Embed Size (px)
Citation preview
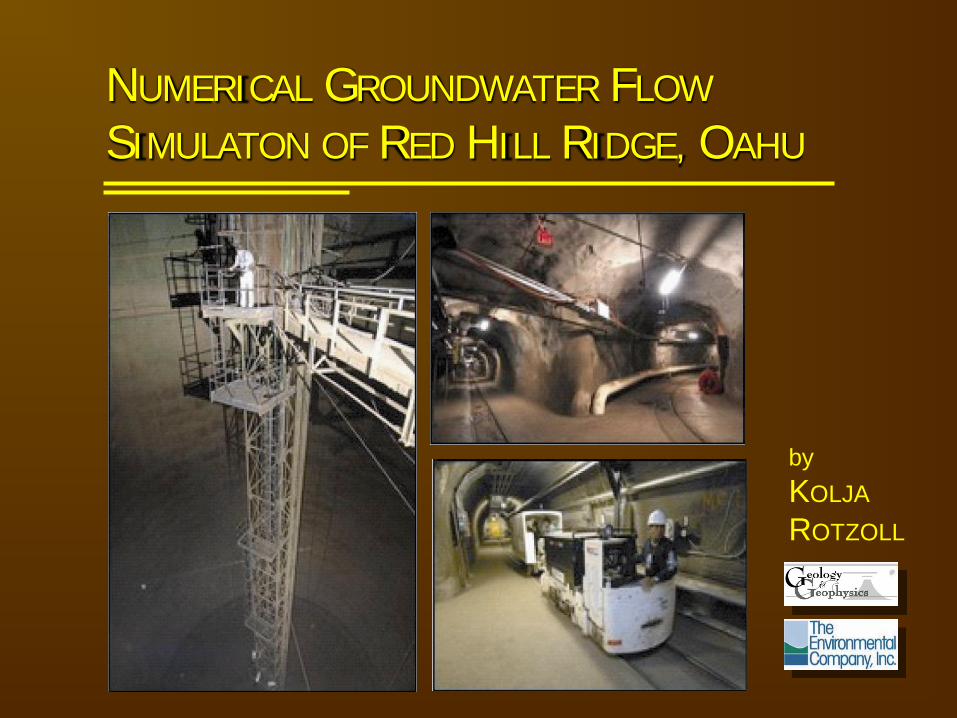
NUMERICAL GROUNDWATER FLOW SIMULATON OF RED HILL RIDGE, OAHU
by
KOLJA
ROTZOLL
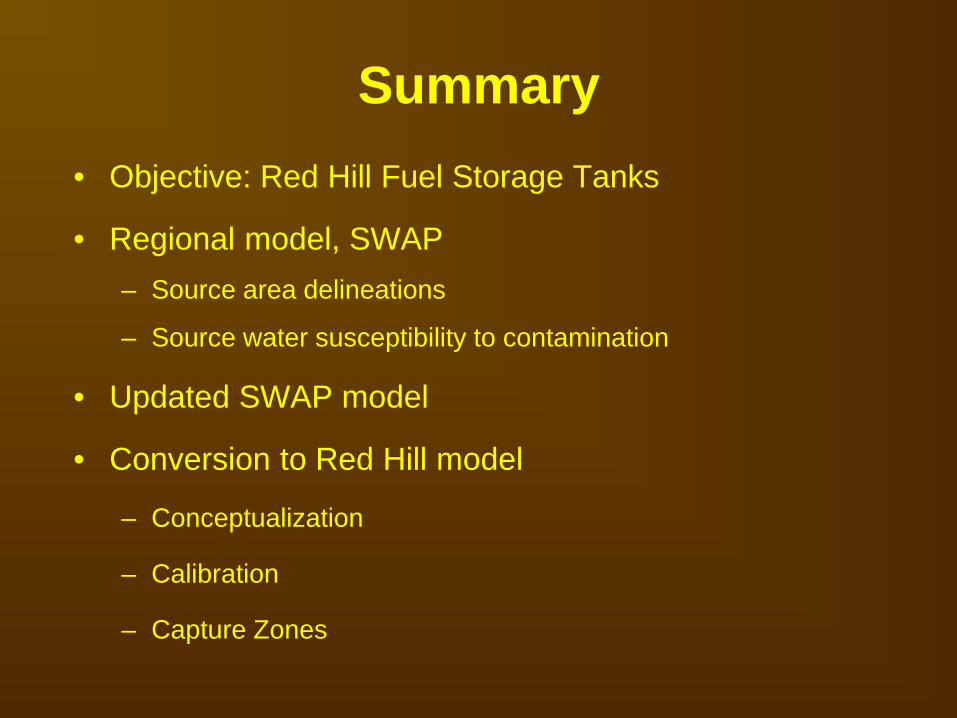
Summary
• Objective: Red Hill Fuel Storage Tanks
• Regional model, SWAP
– Source area delineations
– Source water susceptibility to contamination
• Updated SWAP model
• Conversion to Red Hill model
– Conceptualization
– Calibration
– Capture Zones
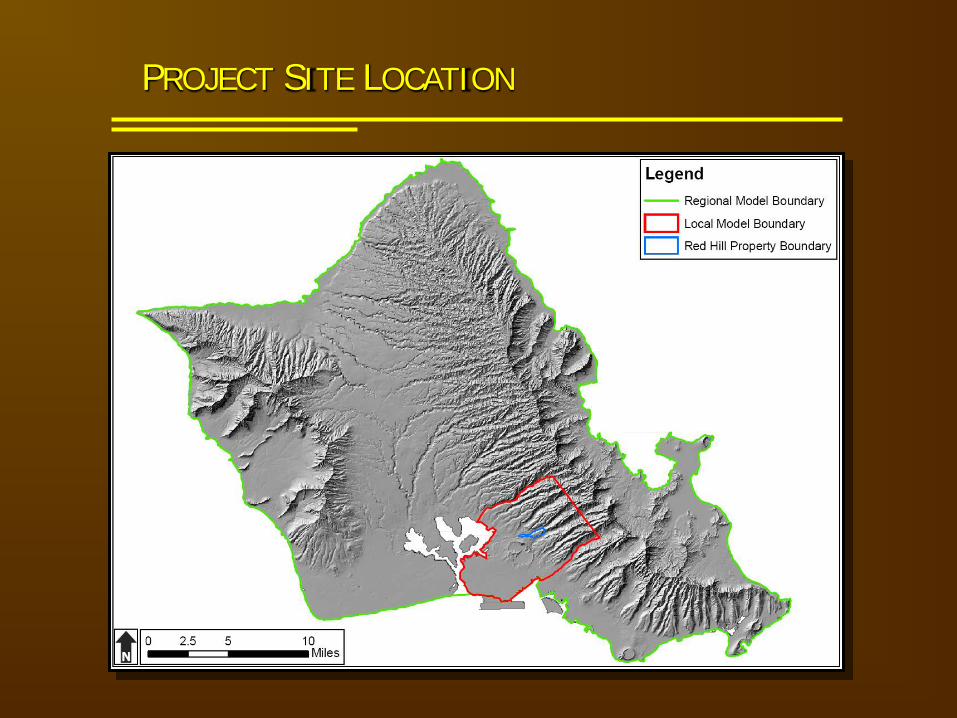
PROJECT SITE LOCATION
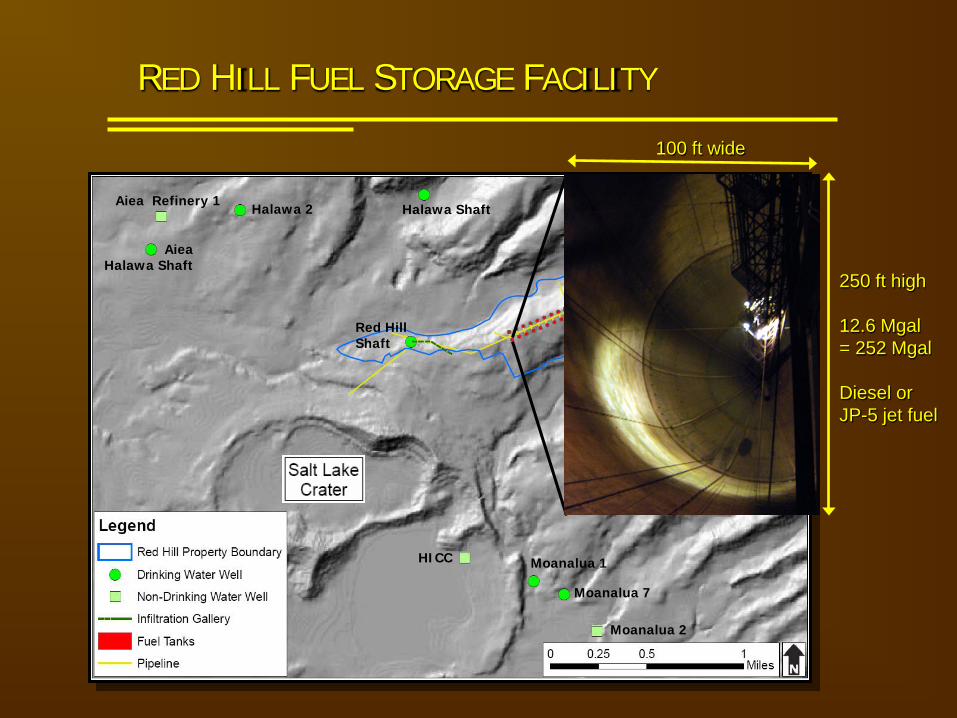
RED HILL FUEL STORAGE FACILITY
Red Hill Shaft
Aiea Halawa Shaft
Halawa Shaft
HICC Moanalua 1
Moanalua 7
Moanalua 2
Aiea Refinery 1 Halawa 2
250 ft high
12.6 Mgal = 252 Mgal
Diesel or JP-5 jet fuel
100 ft wide
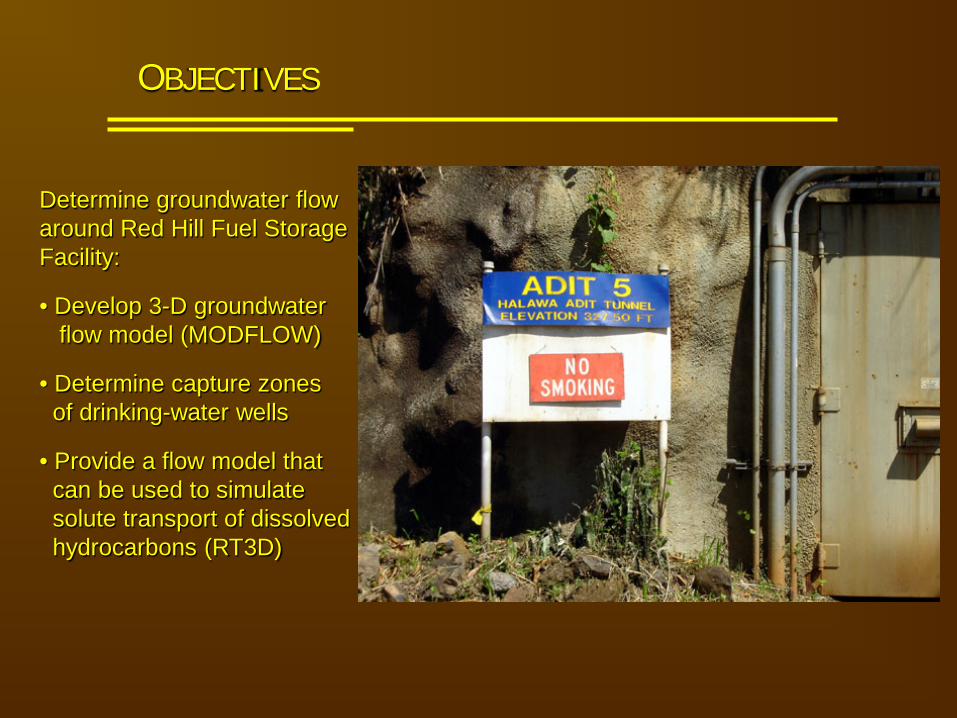
OBJECTIVES
Determine groundwater flow around Red Hill Fuel Storage Facility:
• Develop 3-D groundwater flow model (MODFLOW)
• Determine capture zones of drinking-water wells
• Provide a flow model that can be used to simulate solute transport of dissolved hydrocarbons (RT3D)
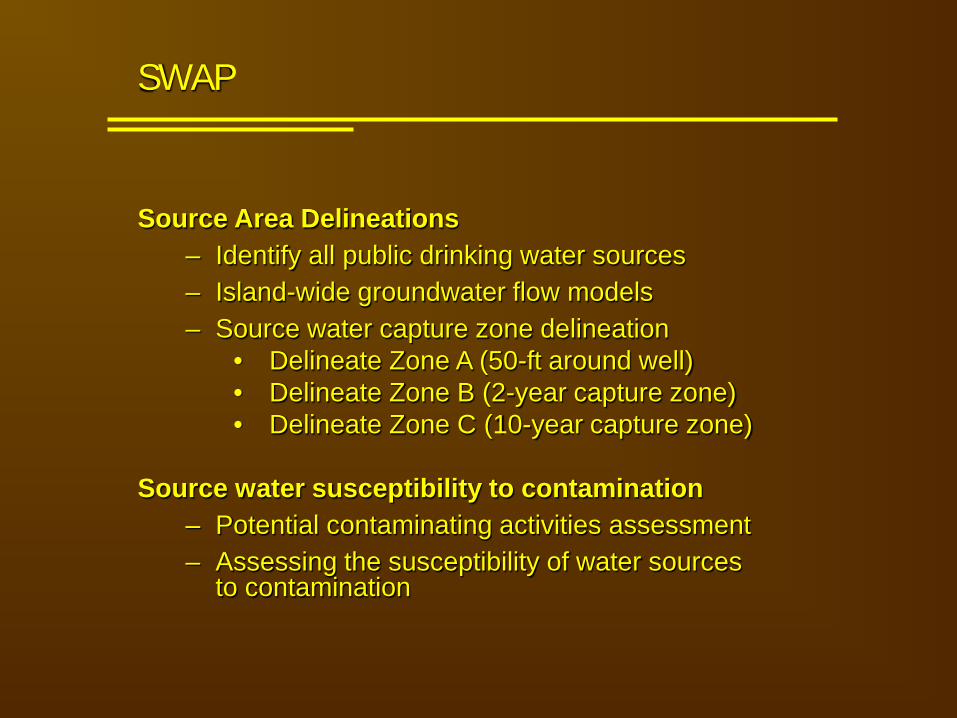
SWAP
Source Area Delineations – Identify all public drinking water sources – Island-wide groundwater flow models – Source water capture zone delineation
• Delineate Zone A (50-ft around well) • Delineate Zone B (2-year capture zone) • Delineate Zone C (10-year capture zone)
Source water susceptibility to contamination – Potential contaminating activities assessment – Assessing the susceptibility of water sources
to contamination
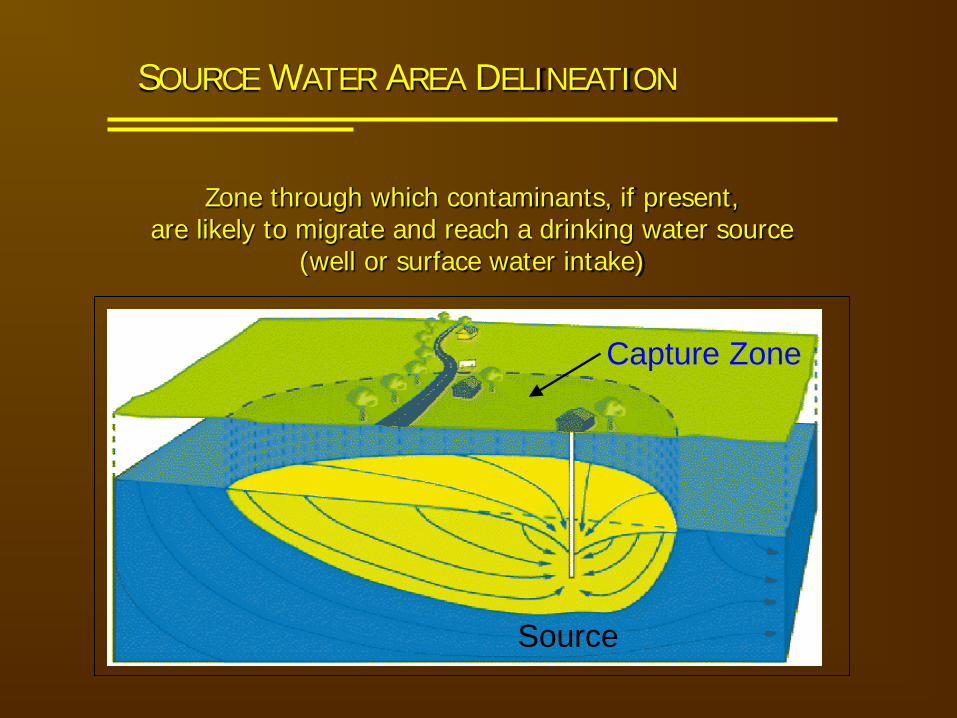
SOURCE WATER AREA DELINEATION
Zone through which contaminants, if present, are likely to migrate and reach a drinking water source
(well or surface water intake)
Capture Zone
Source
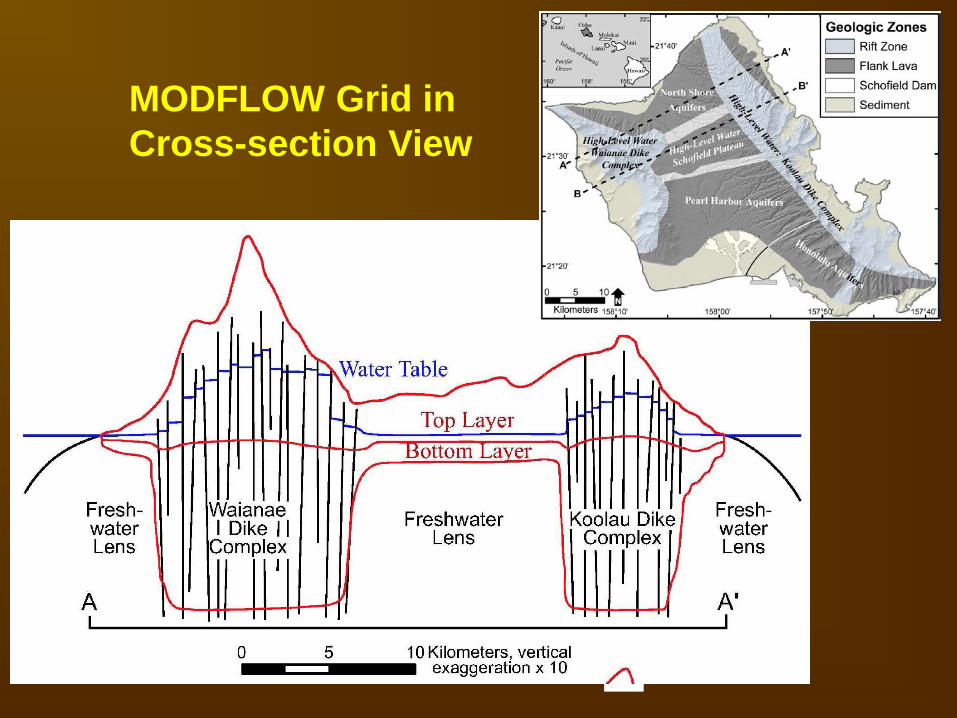
MODFLOW Grid in Cross-section View
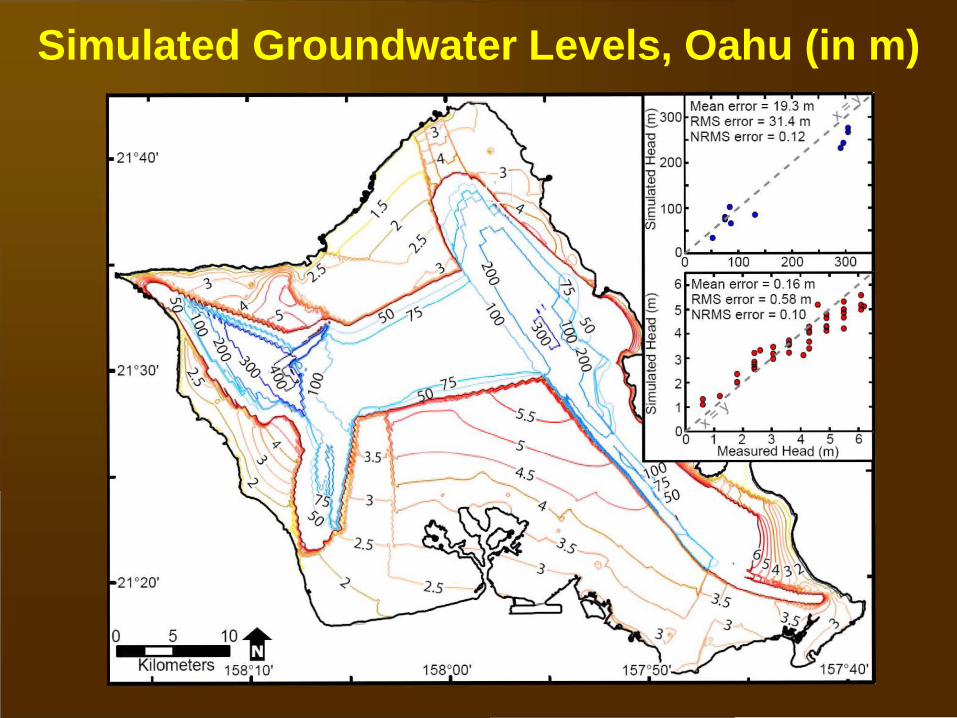
Mean error = 19.3 m
~300 _ RMS error= 31.4 m , 1 "O
ro a.>
NRMS error= 0.12,,' I
I 200 , , , "O
a.> ...., ro
, , ~ 100 U5
, ., . , ...
, '• 100 200 300
6 Mean error = 0.16 m RMS error= 0.58 m • , .
5 NRMS error= 0.10 , f I 4 t • •
J, . .. . . 3 ,I' •• . ' 2 , ,
I . , .. ;~ '+ 0o 1 2 3 4 5
Measured Head (m)
Simulated Groundwater Levels, Oahu (in m)
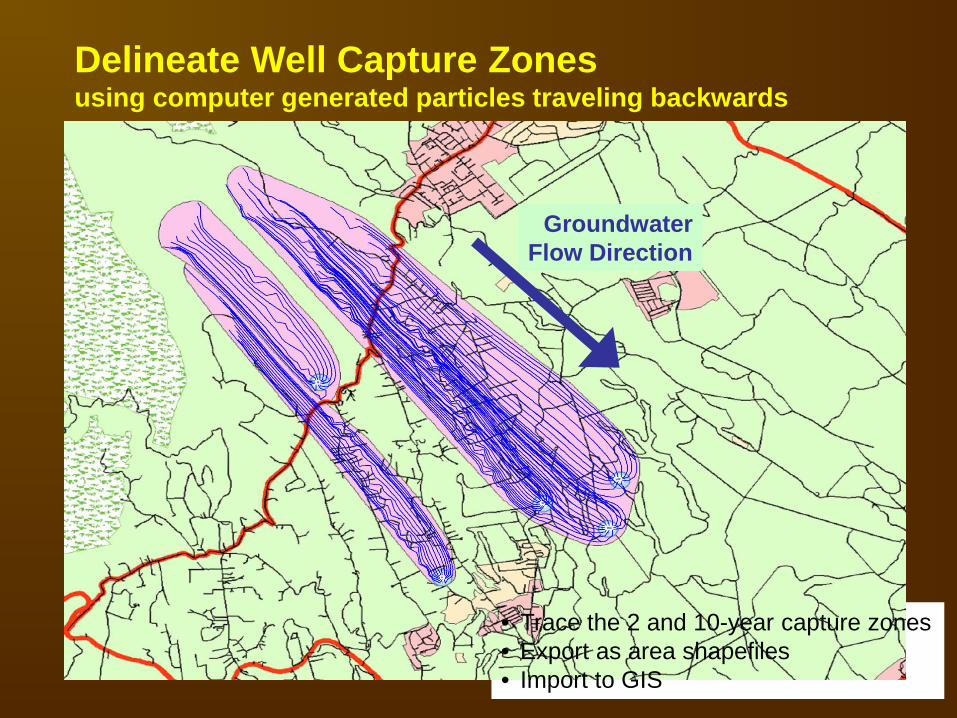
Delineate Well Capture Zones using computer generated particles traveling backwards
Groundwater Flow Direction
• Trace the 2 and 10-year capture zones • Export as area shapefiles • Import to GIS
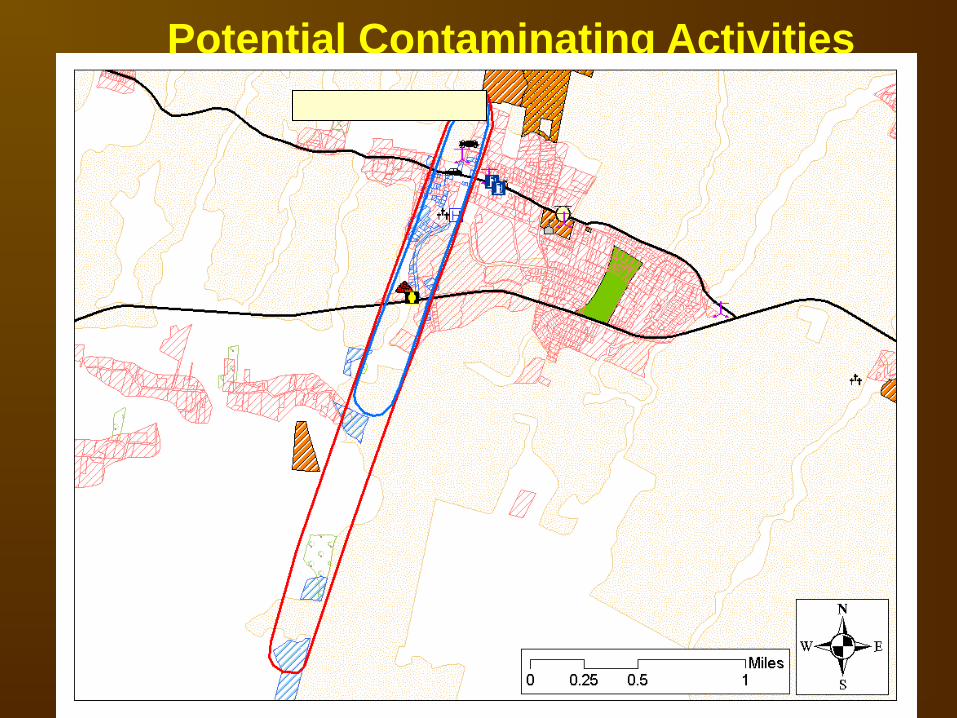
Potential Contaminating Activities YOURTOWN WELL 9999-99
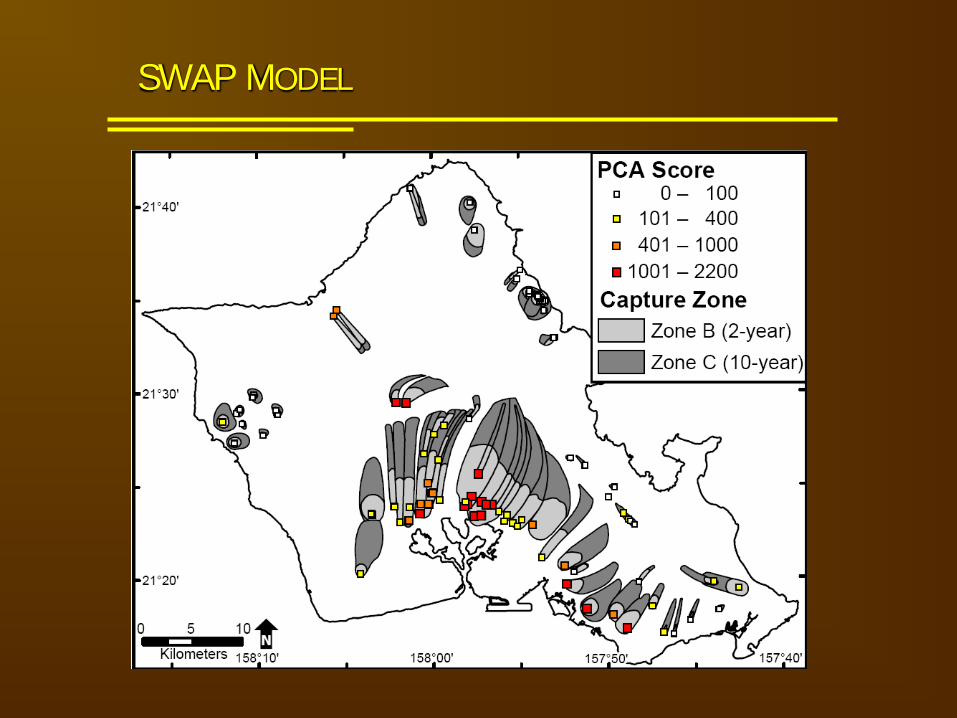
SWAP MODEL
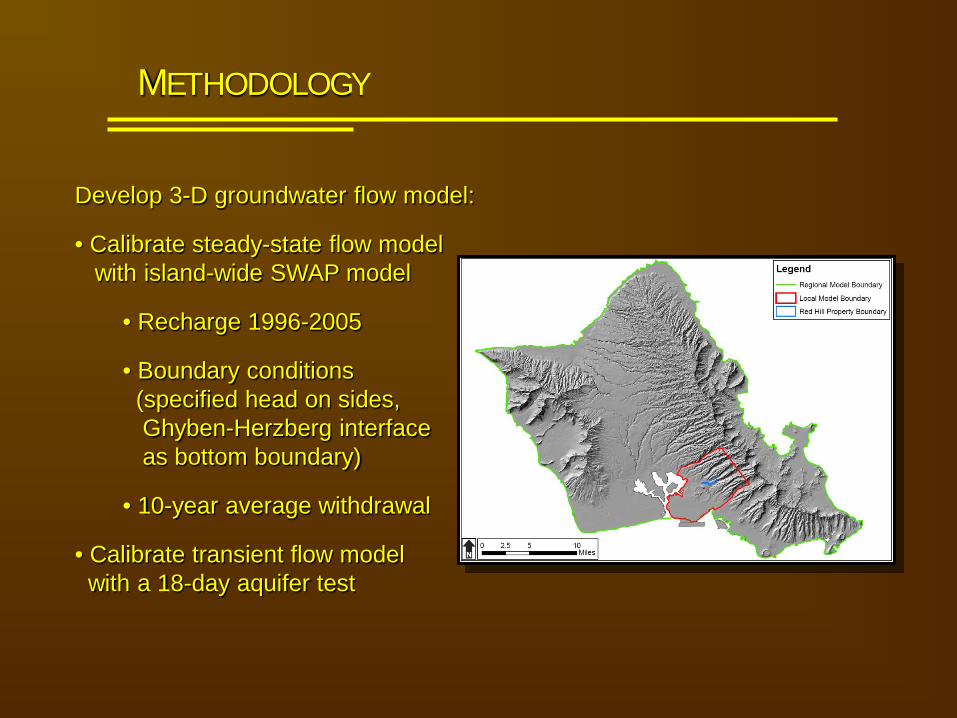
METHODOLOGY
Develop 3-D groundwater flow model:
• Calibrate steady-state flow model with island-wide SWAP model
• Recharge 1996-2005
• Boundary conditions (specified head on sides, Ghyben-Herzberg interface as bottom boundary)
• 10-year average withdrawal
• Calibrate transient flow model with a 18-day aquifer test
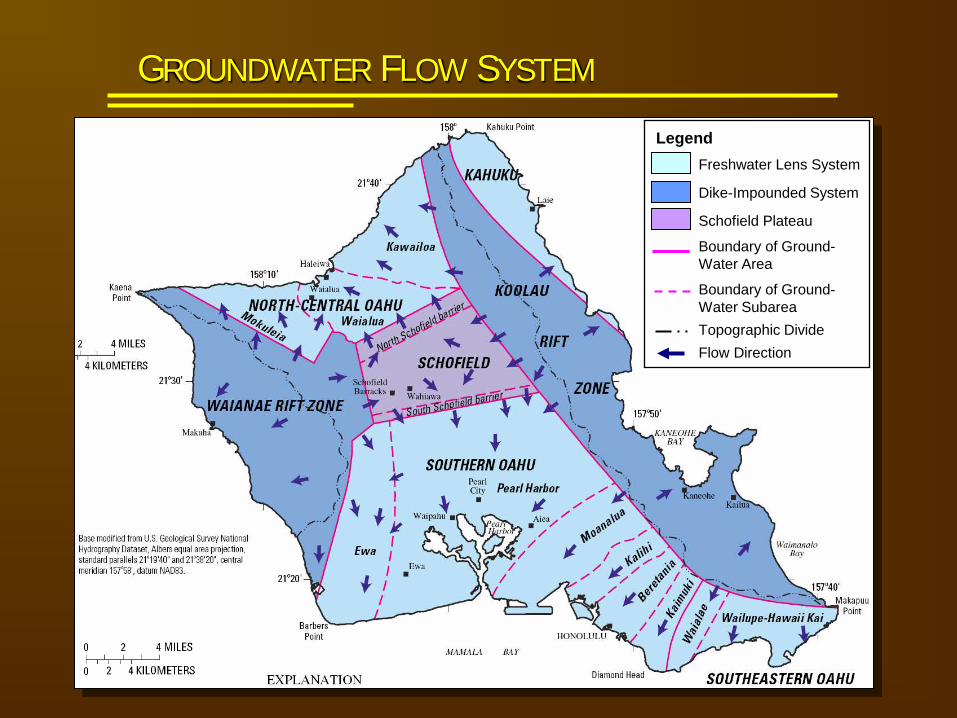
GROUNDWATER FLOW SYSTEM
Freshwater Lens System
Dike-Impounded System
Schofield Plateau
Boundary of Ground-Water Area
Boundary of Ground-Water Subarea
Topographic Divide
Flow Direction
Legend
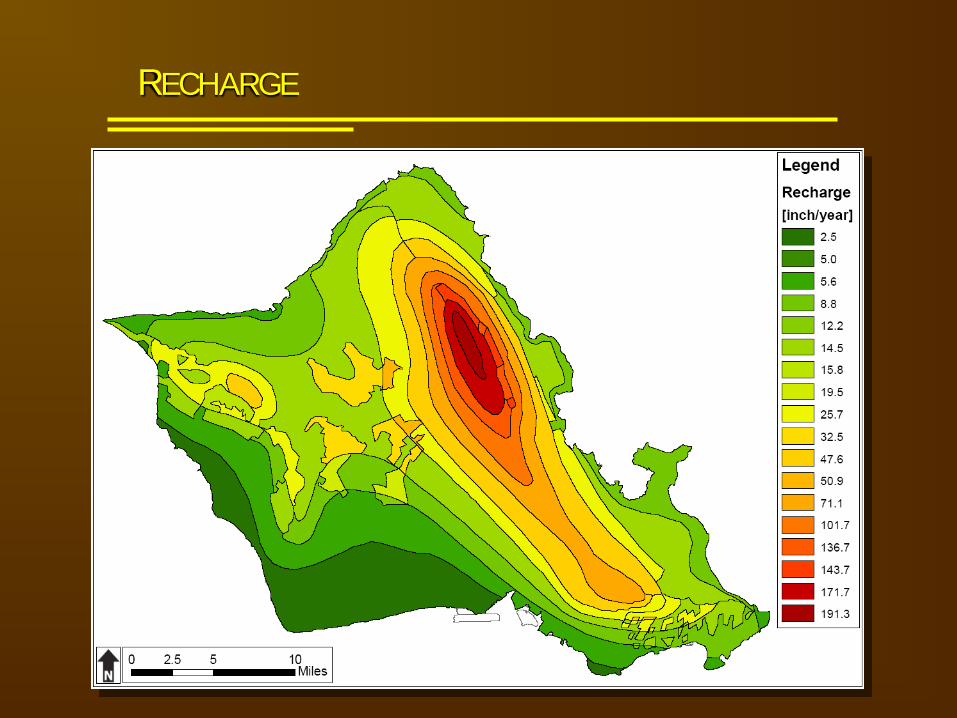
RECHARGE
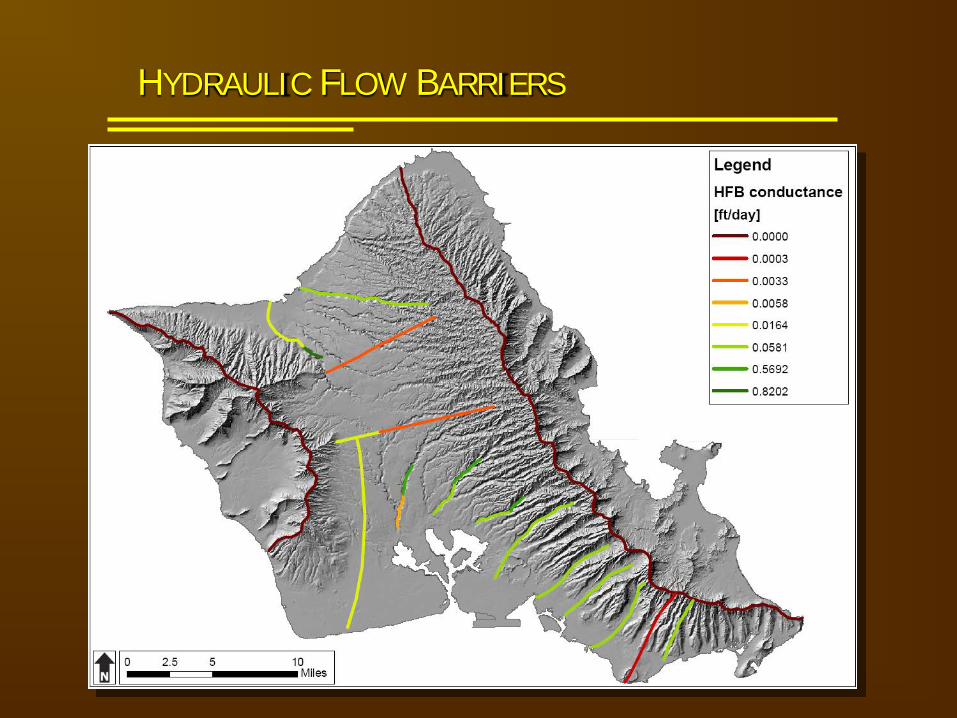
HYDRAULIC FLOW BARRIERS
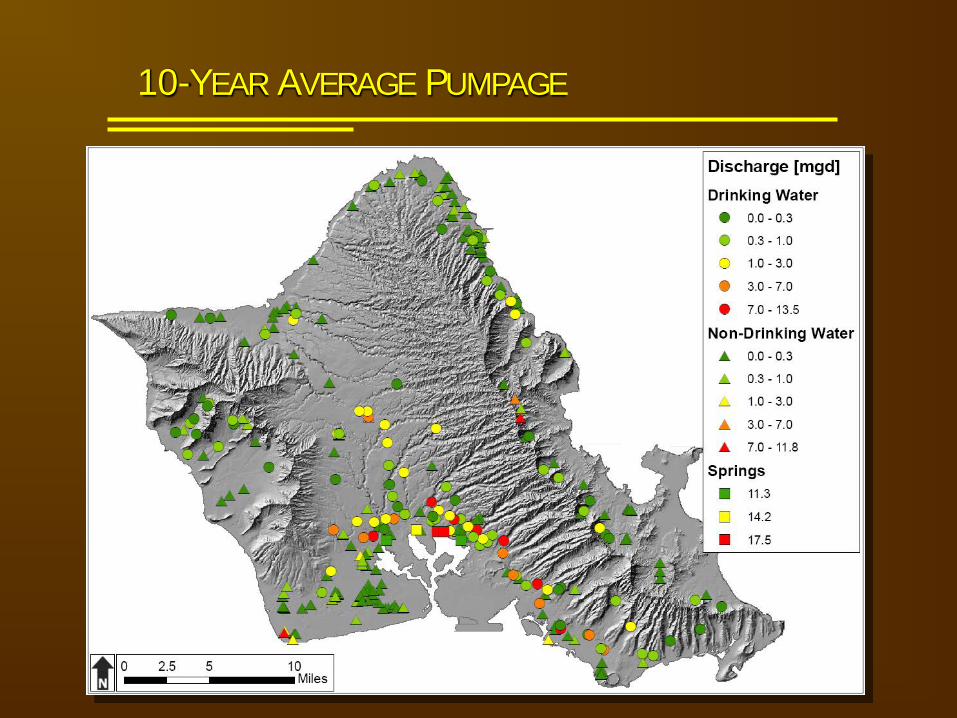
10-YEAR AVERAGE PUMPAGE
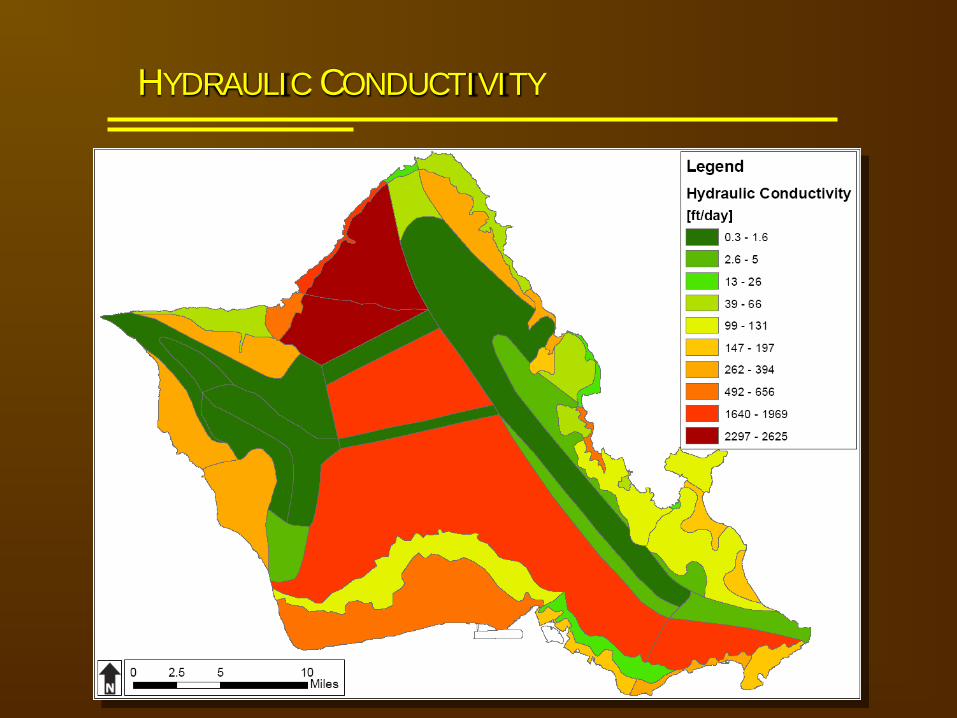
HYDRAULIC CONDUCTIVITY
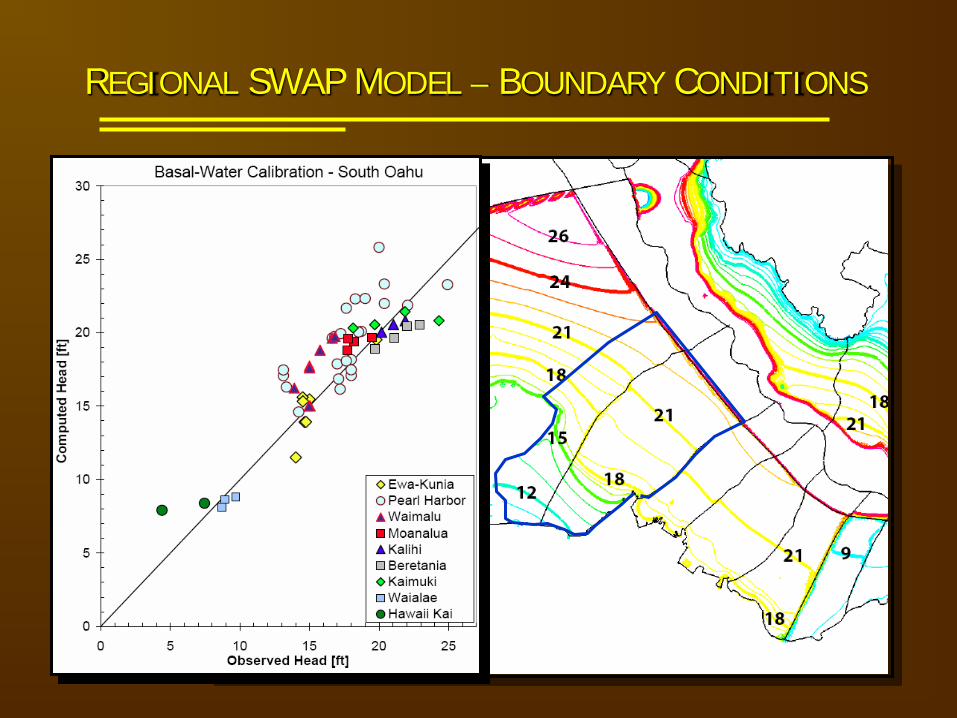
REGIONAL SWAP MODEL – BOUNDARY CONDITIONS
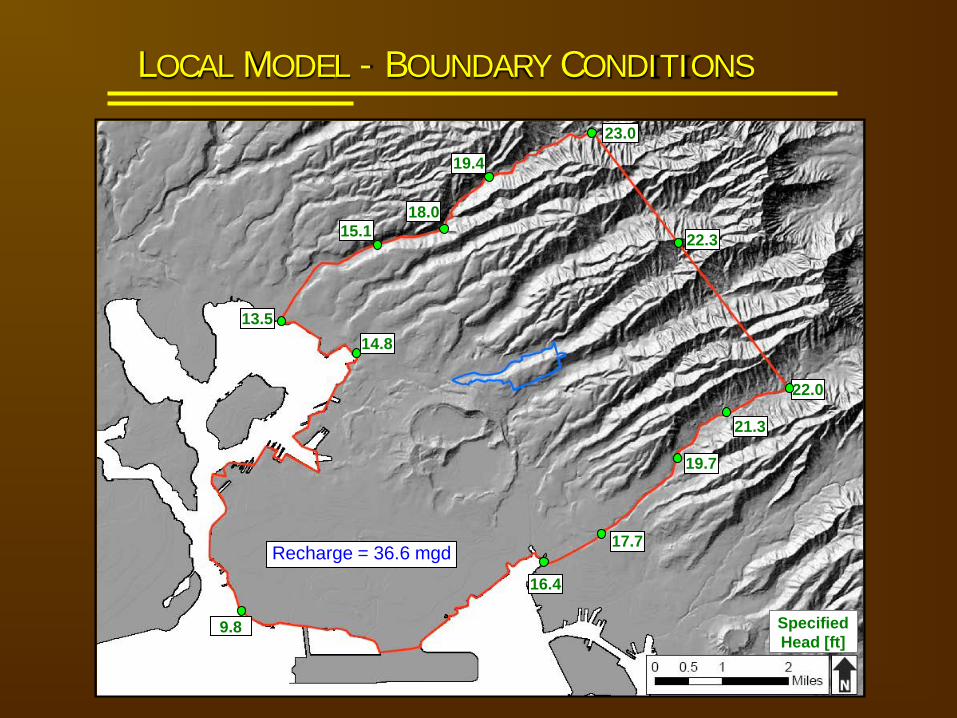
LOCAL MODEL - BOUNDARY CONDITIONS
Specified Head [ft]
23.0
22.0
16.4
9.8
14.8
13.5
Recharge = 36.6 mgd
15.1
19.4
22.3
17.7
19.7
18.0
21.3
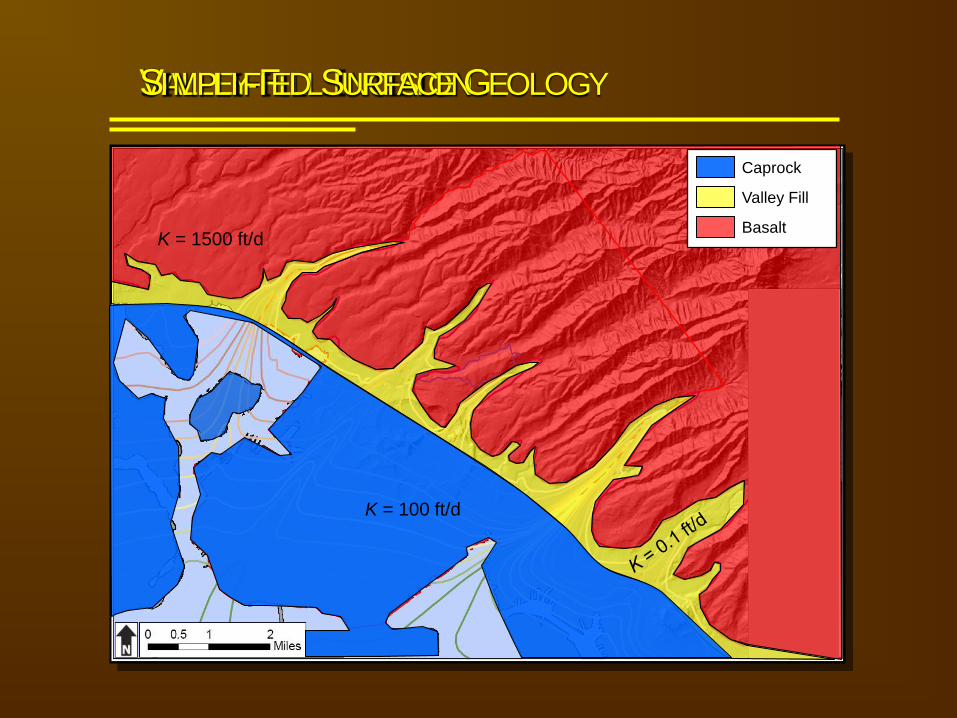
VALLEY-FILL INCISION
Caprock
Valley Fill
Basalt
SIMPLIFIED SURFACE GEOLOGY
K = 100 ft/d
K = 1500 ft/d
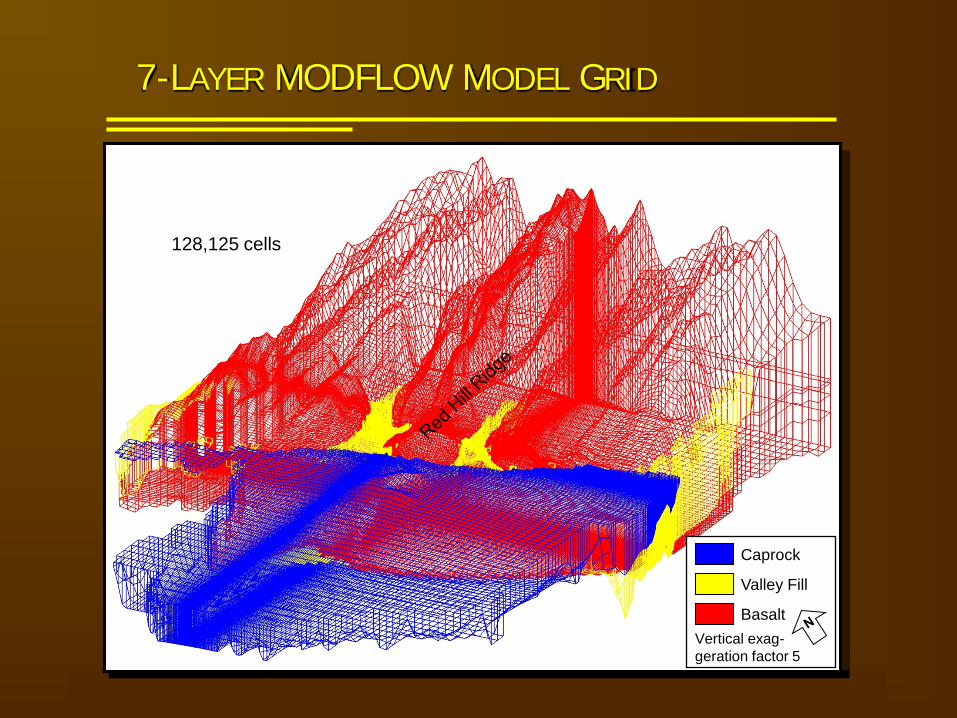
7-LAYER MODFLOW MODEL GRID
Caprock
Valley Fill
Basalt
Vertical exaggeration factor 5
128,125 cells
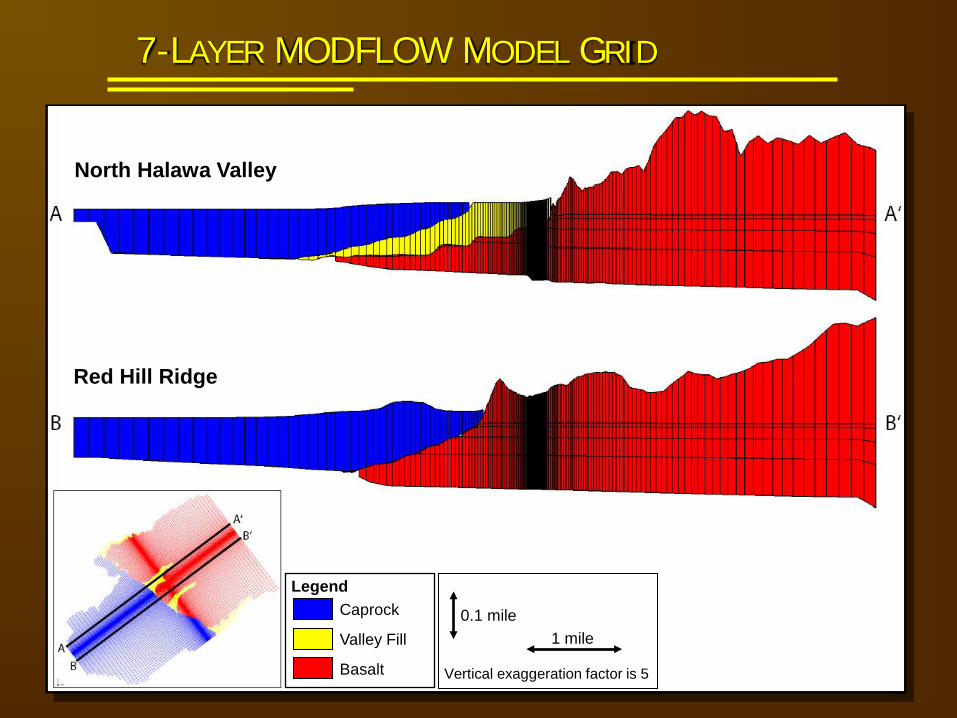
7-LAYER MODFLOW MODEL GRID
Red Hill Ridge
North Halawa Valley
Legend Caprock
Valley Fill
Basalt Vertical exaggeration factor is 5
1 mile 0.1 mile
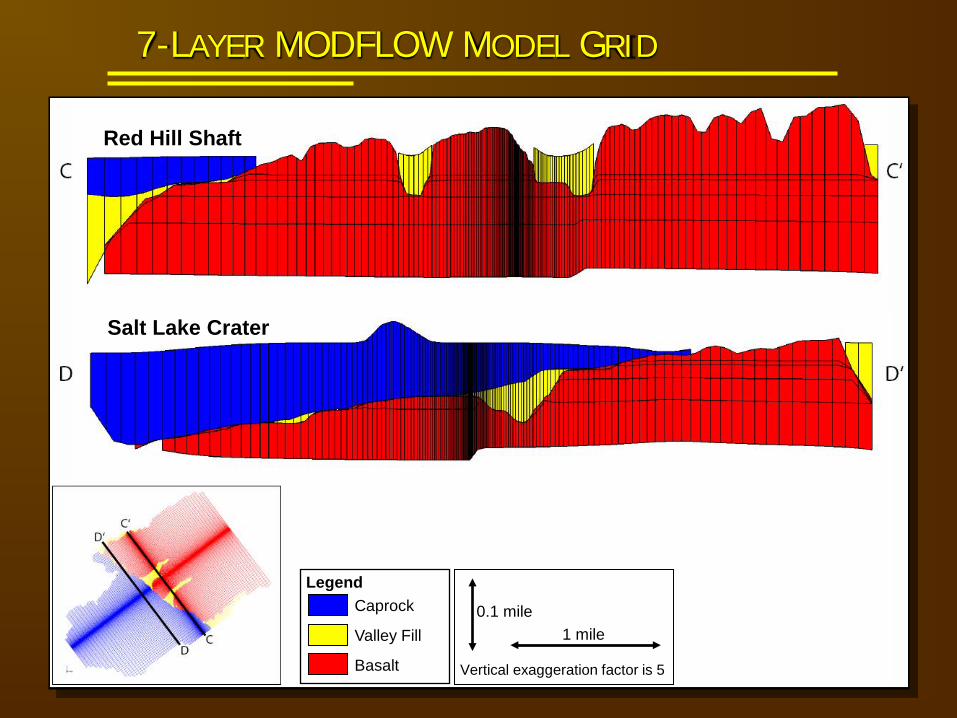
7-LAYER MODFLOW MODEL GRID
Legend Caprock
Valley Fill
Basalt Vertical exaggeration factor is 5
1 mile 0.1 mile
Red Hill Shaft
Salt Lake Crater
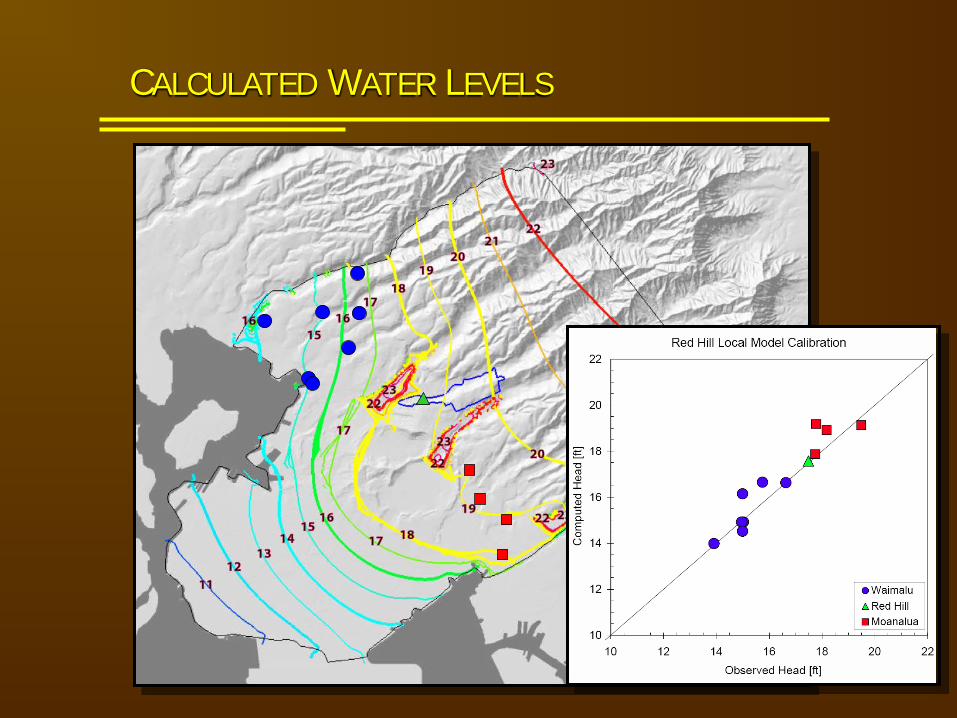
CALCULATED WATER LEVELS
210.5
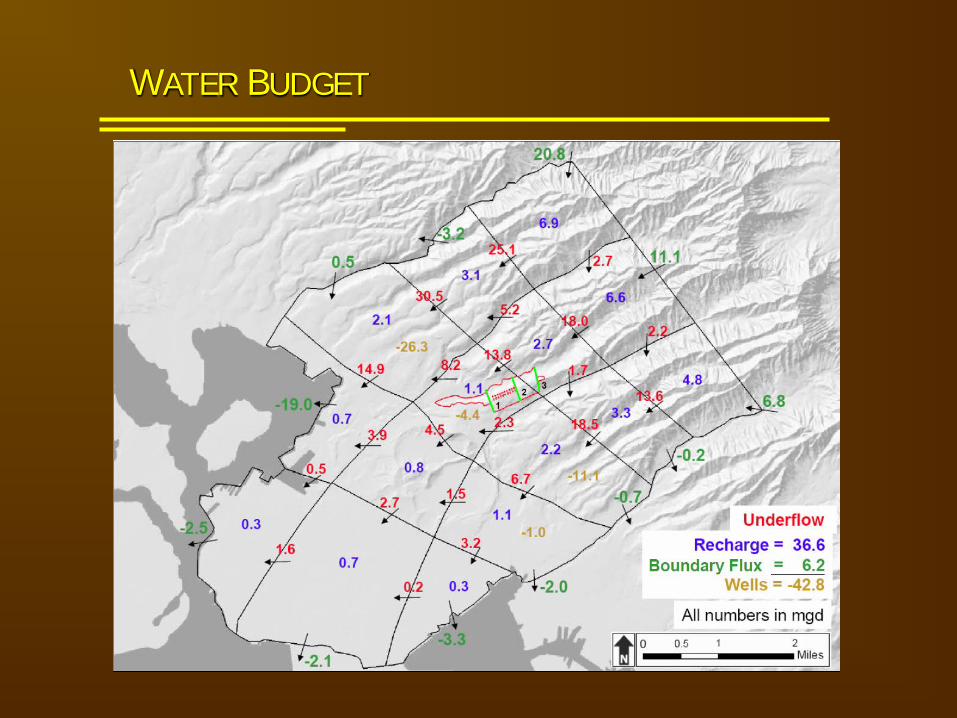
WATER BUDGET
-
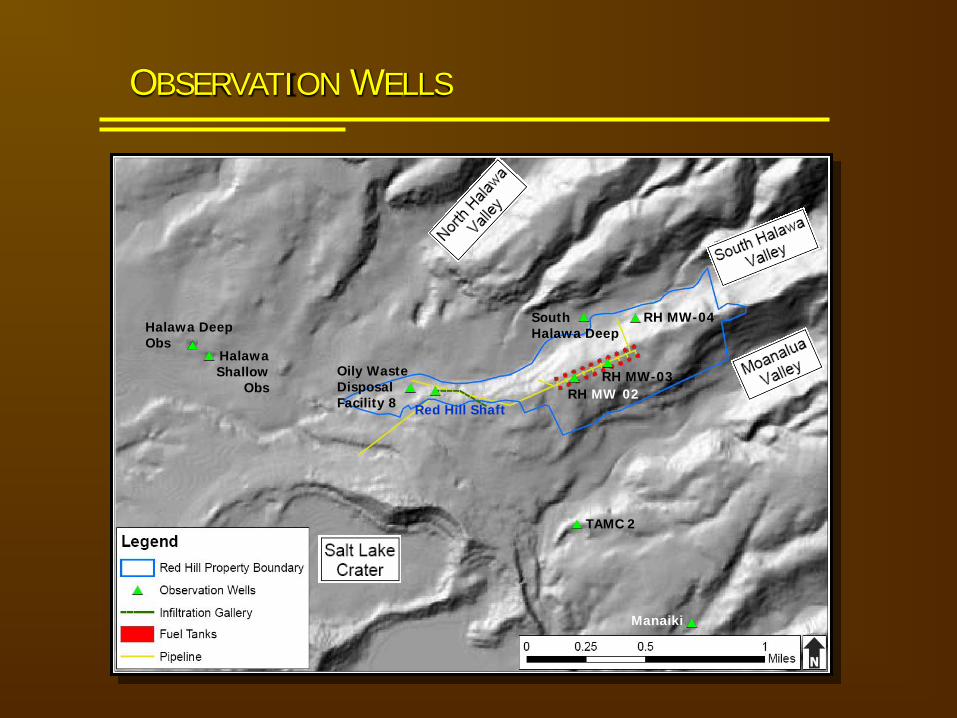
Red Hill Shaft
Oily Waste Disposal Facility 8
Halawa Shallow
Obs
Halawa Deep Obs
South Halawa Deep
RH MW-04
TAMC 2
Manaiki
RH MW-03 RH MW 02
OBSERVATION WELLS
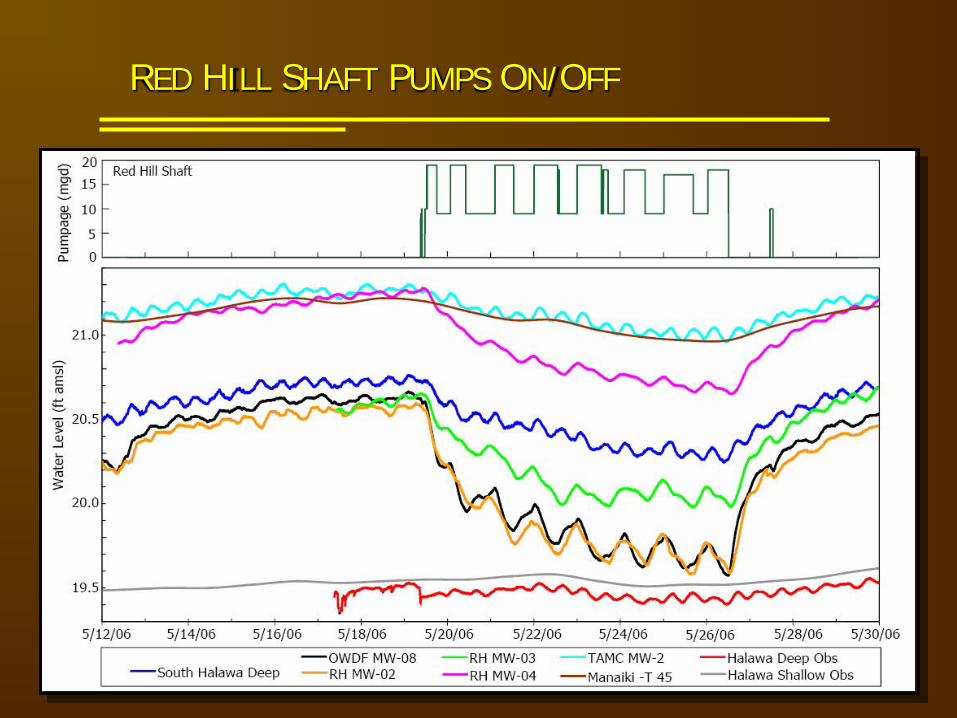
RED HILL SHAFT PUMPS ON/OFF
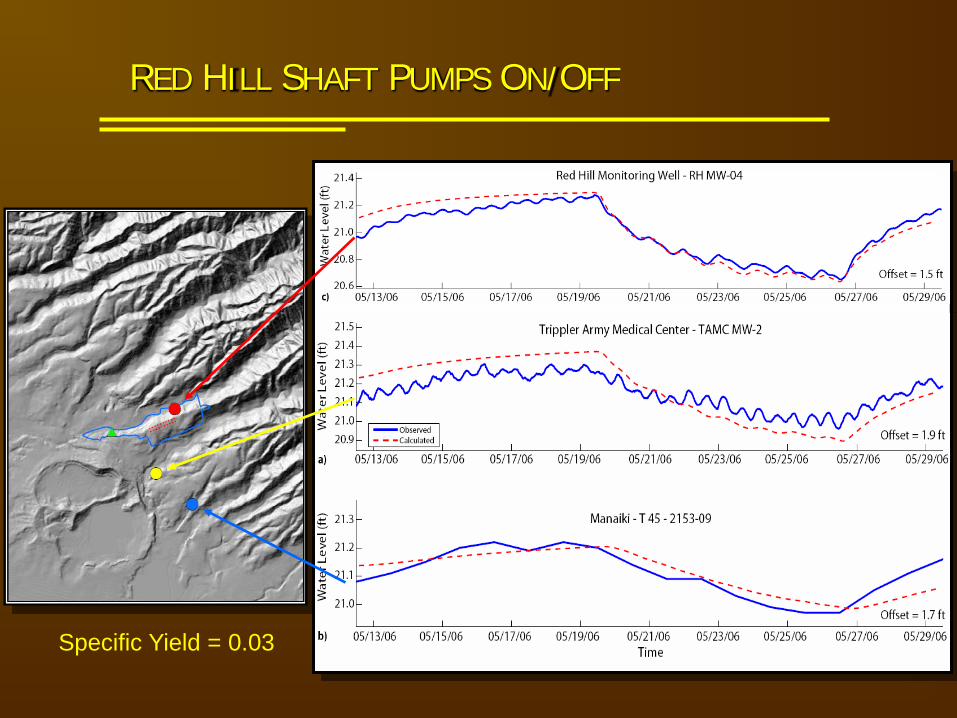
RED HILL SHAFT PUMPS ON/OFF
Specific Yield = 0.03
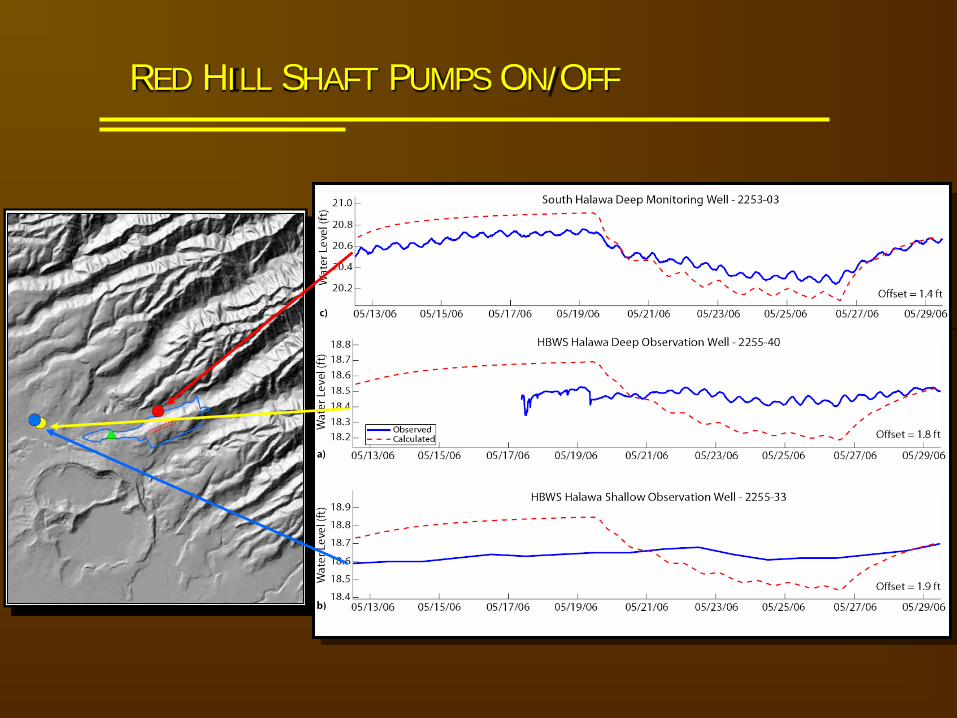
RED HILL SHAFT PUMPS ON/OFF
210.5
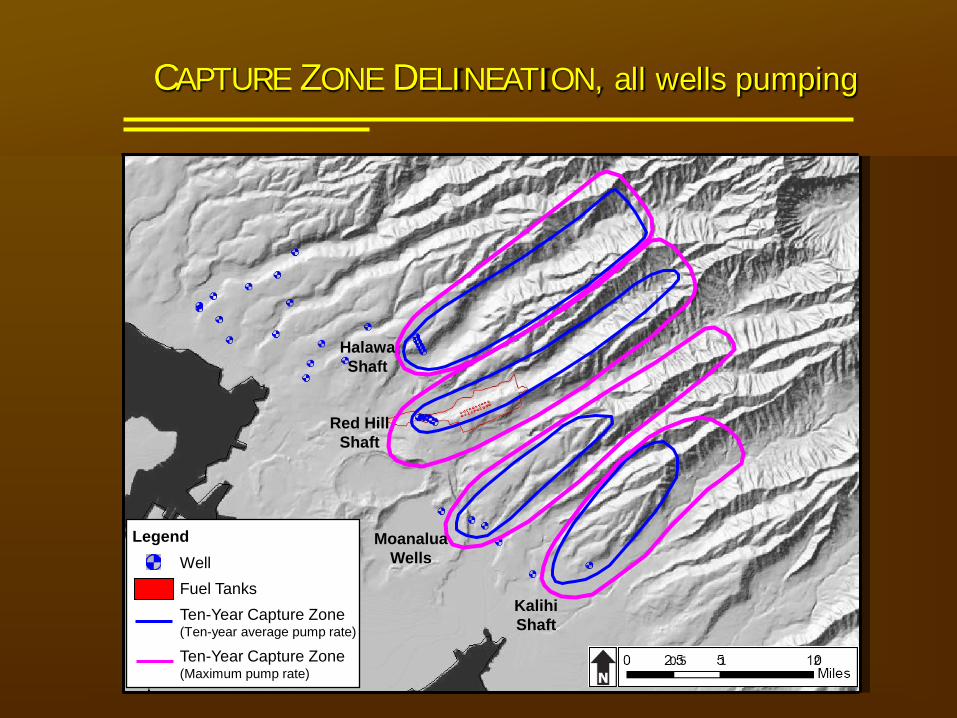
Legend
Well
Fuel Tanks
Ten-Year Capture Zone (Ten-year average pump rate)
Ten-Year Capture Zone (Maximum pump rate)
Halawa Shaft
Red Hill Shaft
Moanalua Wells
Kalihi Shaft
CAPTURE ZONE DELINEATION, all wells pumping
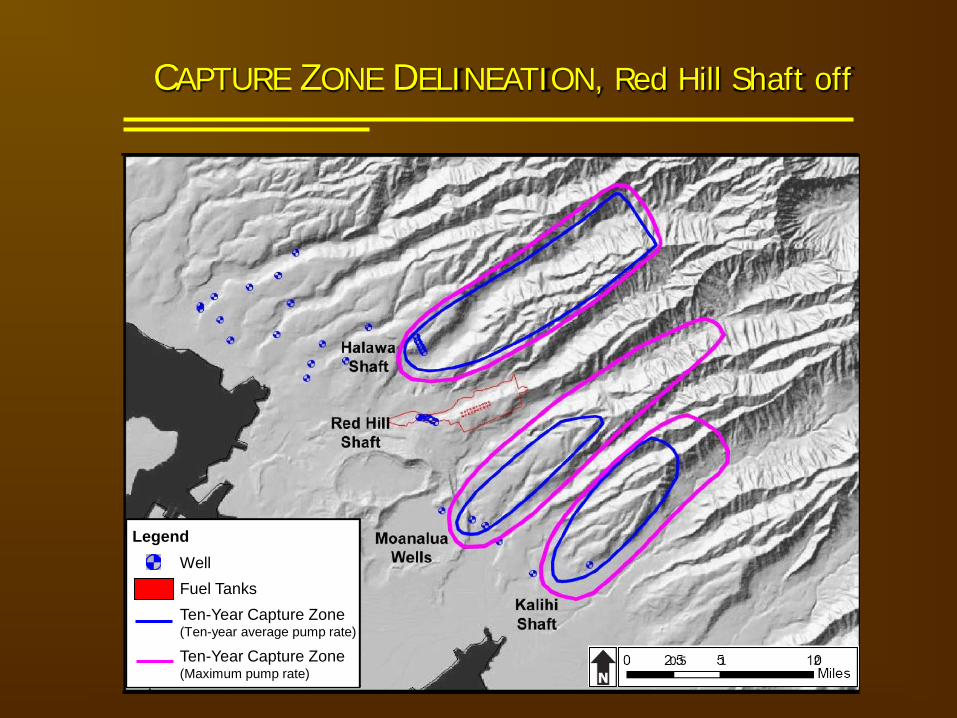
CAPTURE ZONE DELINEATION, Red Hill Shaft off
210.5
Legend
Well
Fuel Tanks
Ten-Year Capture Zone (Ten-year average pump rate)
Ten-Year Capture Zone (Maximum pump rate)
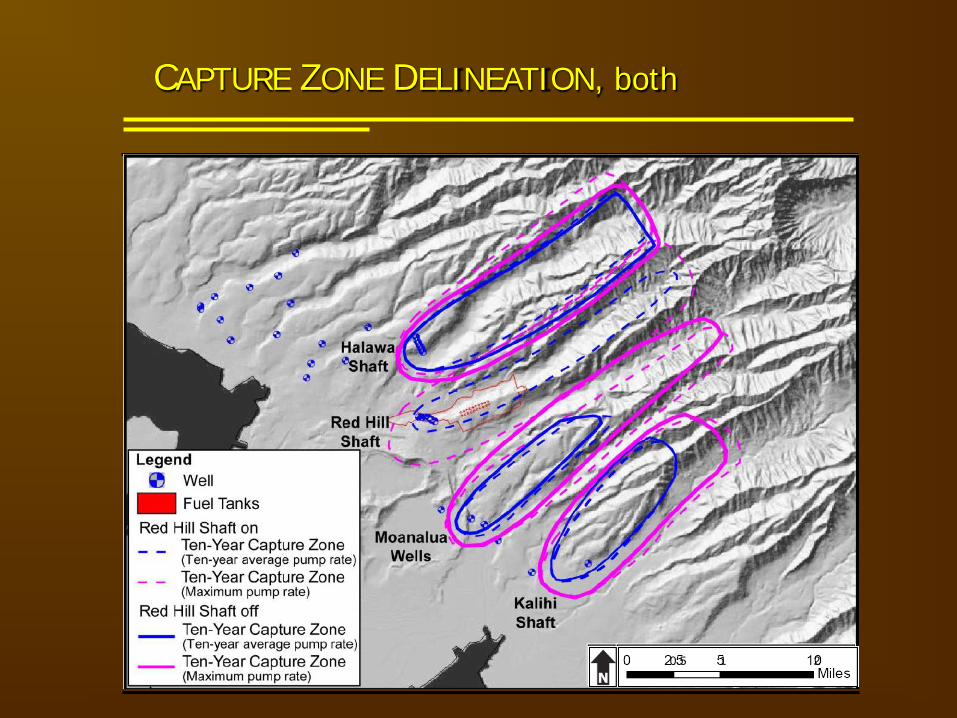
CAPTURE ZONE DELINEATION, both
210.5
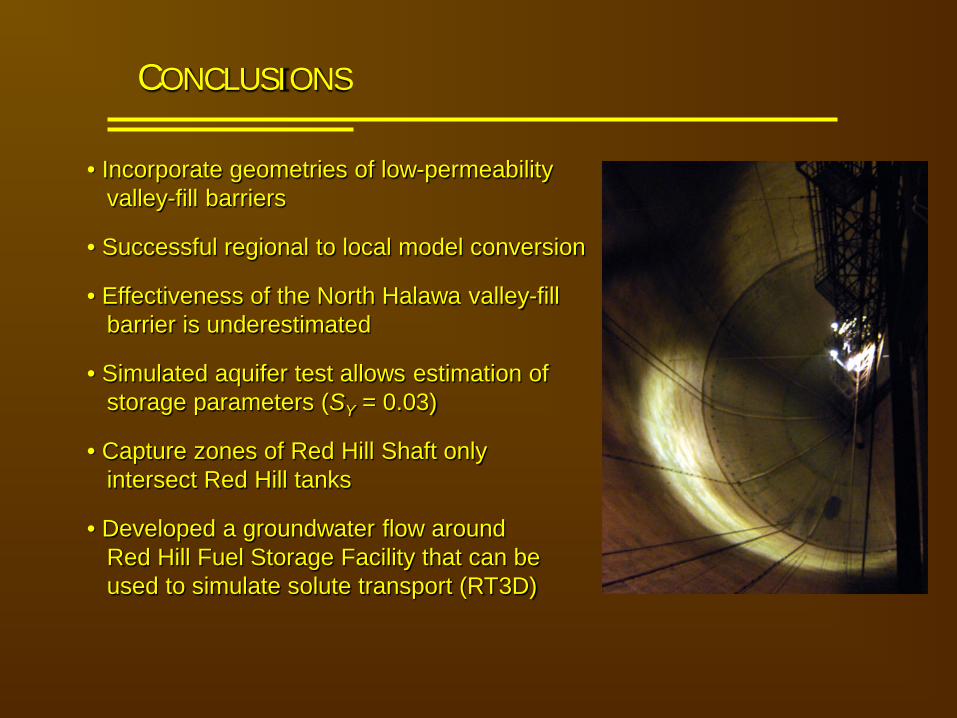
CONCLUSIONS
• Incorporate geometries of low-permeability valley-fill barriers
• Successful regional to local model conversion
• Effectiveness of the North Halawa valley-fill barrier is underestimated
• Simulated aquifer test allows estimation of storage parameters (SY = 0.03)
• Capture zones of Red Hill Shaft only intersect Red Hill tanks
• Developed a groundwater flow around Red Hill Fuel Storage Facility that can be used to simulate solute transport (RT3D)
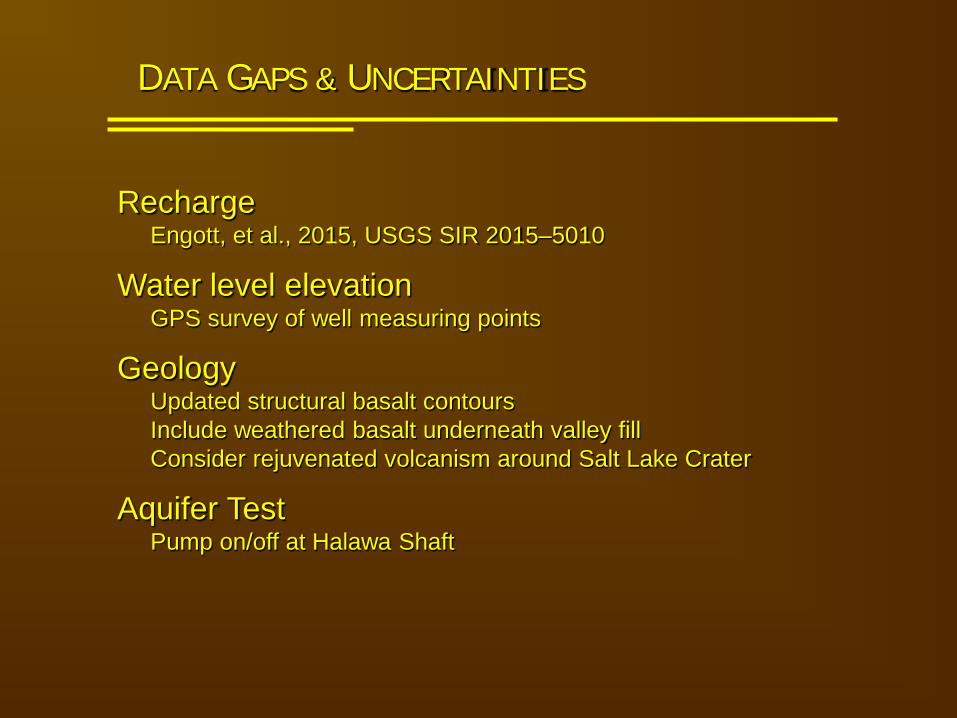
DATA GAPS & UNCERTAINTIES
Recharge Engott, et al., 2015, USGS SIR 2015–5010
Water level elevation GPS survey of well measuring points
Geology Updated structural basalt contours Include weathered basalt underneath valley fill Consider rejuvenated volcanism around Salt Lake Crater
Aquifer Test Pump on/off at Halawa Shaft
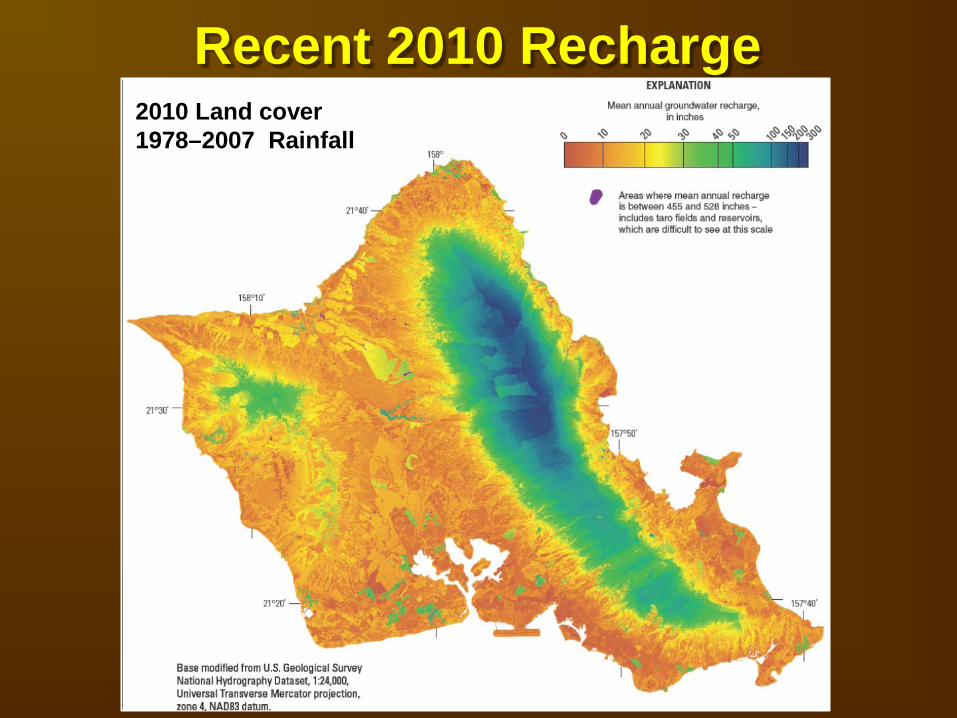
Recent 2010 Recharge 2010 Land cover 1978–2007 Rainfall
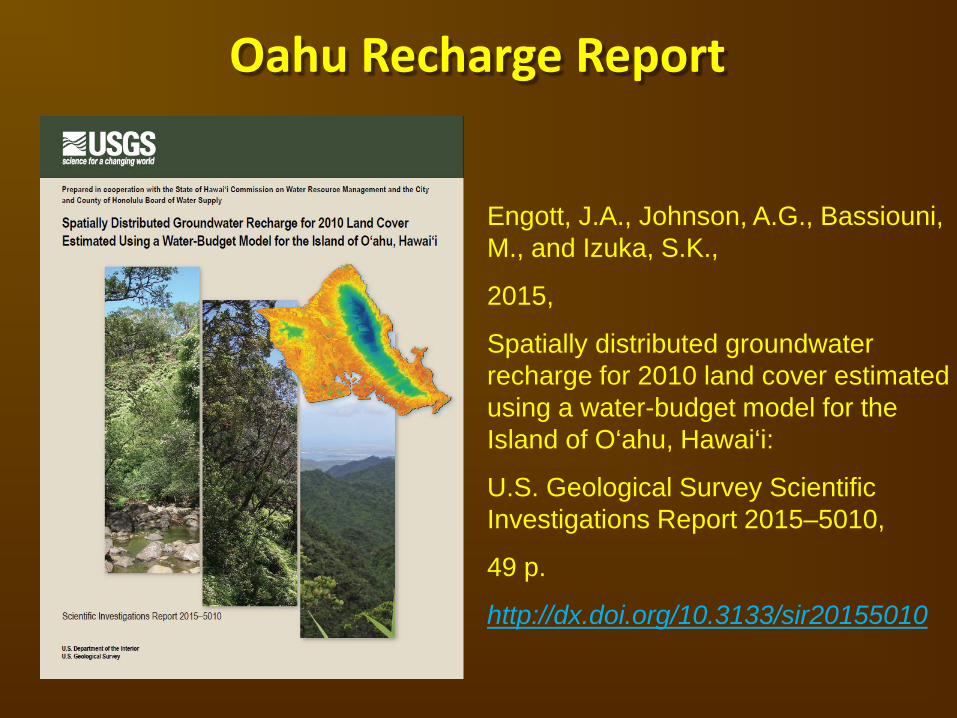
Oahu Recharge Report
Engott, J.A., Johnson, A.G., Bassiouni, M., and Izuka, S.K.,
2015,
Spatially distributed groundwater recharge for 2010 land cover estimated using a water-budget model for the Island of O‘ahu, Hawai‘i:
U.S. Geological Survey Scientific Investigations Report 2015–5010,
49 p.
http://dx.doi.org/10.3133/sir20155010
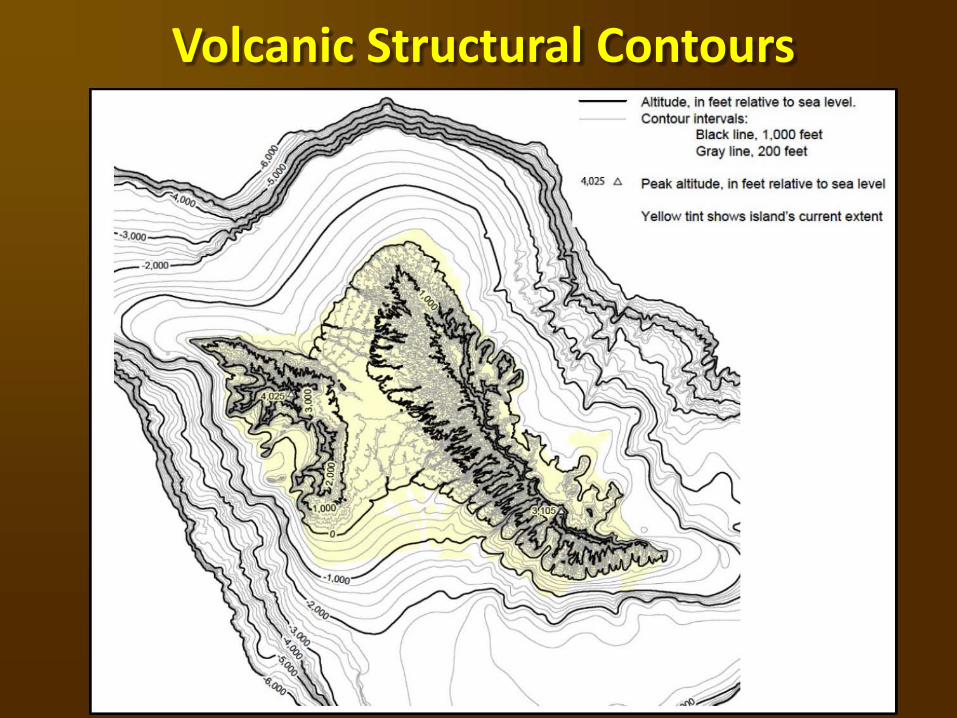
Altitude, in feet relative to sea level. Contour Intervals:
Black line, 1,000 feet Gray line. 200 feet
4,025 A Peak altitude, in feet relative to sea level
Yellow tint shows island's current extent
/
Volcanic Structural Contours
Hawaii Volcanic Aquifers Report
Izuka, S.K., Engott, J.A., Bassiouni, M., Johnson, A.G., Miller, L.D., Rotzoll, K., and Mair, A.,
in press,
Volcanic aquifers of Hawai‘i — hydrogeology, water budgets, and conceptual models:
U.S. Geological Survey Scientific Investigations Report 2015-5164