Embed Size (px)
Citation preview
Open access e-Journal
Earth Science India, eISSN: 0974 – 8350 Vol. 5 (III), July, 2012, pp. 79-91
http://www.earthscienceindia.info/
79
Numerical Groundwater Flow and Contaminant Transport
Modelling of the Southern Aquifer, Mauritius
Manta Devi Nowbuth1, P. Rambhojun
2 and Bhavana Umrikar
3*
1 Department of Civil Engineering, University of Mauritius, Mauritius
2 Arup SIGMA, Civil Engineering Consultancy Firm, Mauritius
3 Department of Geology, University of Pune, Maharashtra, India
*Email: [email protected]
Abstract
Mauritius depends on both surface and groundwater to cater its water demand, where
groundwater contributes up to 50% of the total domestic water supply. Groundwater follows a
radial movement and is eventually getting discharged into the ocean at the boundary of the
island. The aquifers in Mauritius are in hydraulic contact with the sea along all the coastline
boundaries. If there is excessive abstraction of groundwater, then the radial flow towards the
sea may decrease or even the flow pattern is reversed, thereafter causing seawater movement
inland. In addition, the aquifers are characterised by highly permeable lava flows which
increases the vulnerability of seawater intrusion. A groundwater flow model was first developed
for the Southern Aquifer (Rose Belle, Nouvelle France and Plaisance) and after calibration and
verification this model was used to simulate the groundwater flow characteristics within the
aquifer. This model has also been used to study the pollution risk from land based pollutants
and the movement of seawater inland. The model has predicted the pathways for contaminants
from source pollutants.
Keywords: numerical groundwater flow model, contaminant transport, Mauritius
Introduction
The island of Mauritius was formed 10,000 years ago (Fig. 1) and this was followed
by successive volcanic eruptions following a certain period of quiescence, (Saddul and
Mphande, 2002). These volcanic activities shaped up the island and especially its
hydrogeological set up. The aquifers of the island of Mauritius are characterised by
weathered, vesicular and fractured basaltic rocks with a large amount of clay content which
are of varying hydraulic conductivities. They have been classified into five main types which
are all in dynamic hydraulic contact with the sea (Proag, 1995, 2006). The aquifer covering
southern part of island is known as the Rose Belle-Plaisance aquifer (Fig. 2), makes up one of
the five main aquifers of Mauritius with an approximate area of 180 sq km (Giorgi et al.,
1999). It is bounded by the intra-calderic reservoir which is located on Arnaud-Curepipe
Point in the east, the Grand Port mountain range in the northeast and by another mountain
range, the Savanne range in the south which forms the impermeable boundary and hence
isolates this aquifer system to a large extent from other aquifers. Ancient highly massive lava
flows form the base of the aquifer because of its low porosity and hydraulic conductivity
(Sentenac, 1964). The island is surrounded by coral reefs, and soils are mainly derived from
weathered basaltic lava.
Numerical Groundwater Flow and Contaminant Transport Modelling of the Southern Aquifer, Mauritius: Nowbuth et al.
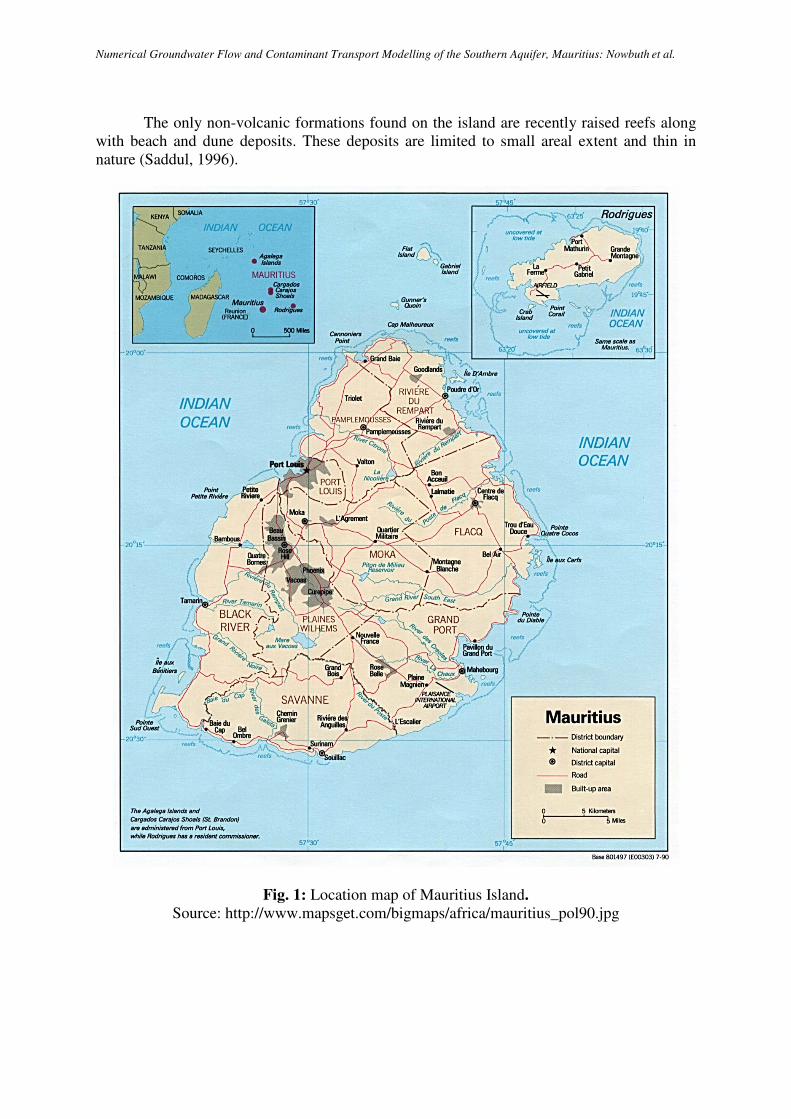
The only non-volcanic formations found on the island are recently raised reefs along
with beach and dune deposits. These deposits are limited to small areal extent and thin in
nature (Saddul, 1996).
Fig. 1: Location map of Mauritius Island.
Source: http://www.mapsget.com/bigmaps/africa/mauritius_pol90.jpg
Open access e-Journal
Earth Science India, eISSN: 0974 – 8350 Vol. 5 (III), July, 2012, pp. 79-91
http://www.earthscienceindia.info/
81
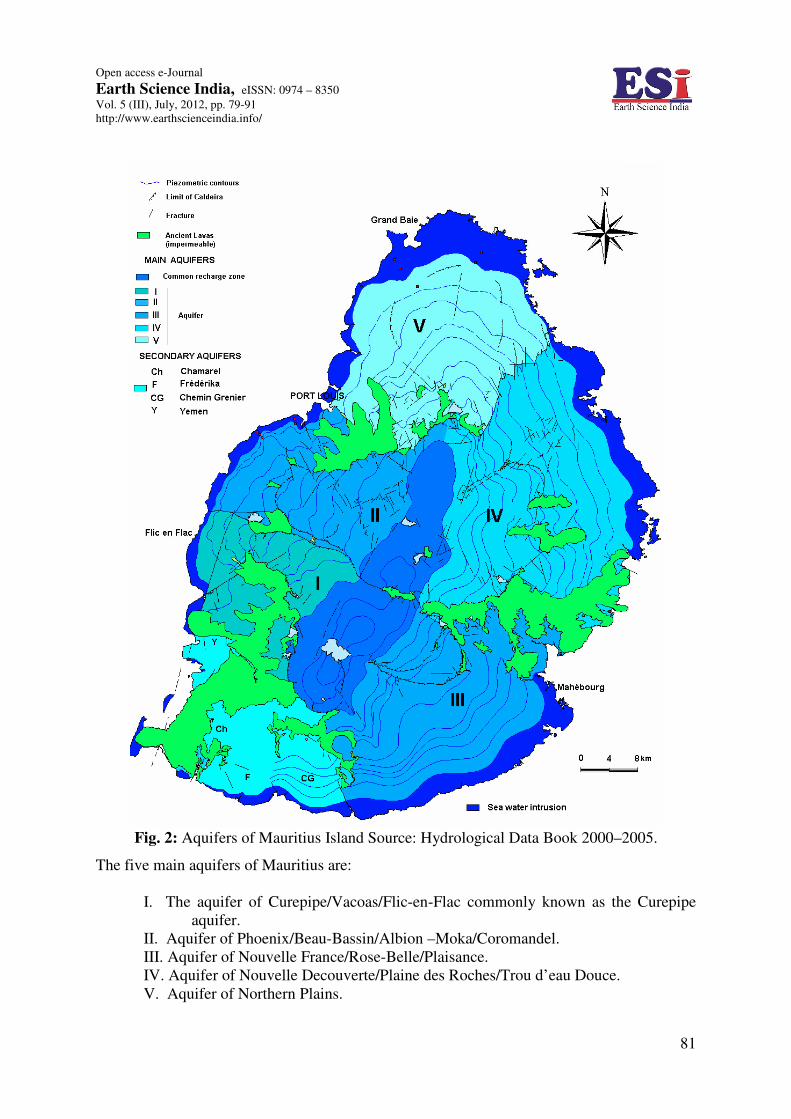
Fig. 2: Aquifers of Mauritius Island Source: Hydrological Data Book 2000–2005.
The five main aquifers of Mauritius are:
I. The aquifer of Curepipe/Vacoas/Flic-en-Flac commonly known as the Curepipe
aquifer.
II. Aquifer of Phoenix/Beau-Bassin/Albion –Moka/Coromandel.
III. Aquifer of Nouvelle France/Rose-Belle/Plaisance.
IV. Aquifer of Nouvelle Decouverte/Plaine des Roches/Trou d’eau Douce.
V. Aquifer of Northern Plains.
Numerical Groundwater Flow and Contaminant Transport Modelling of the Southern Aquifer, Mauritius: Nowbuth et al.
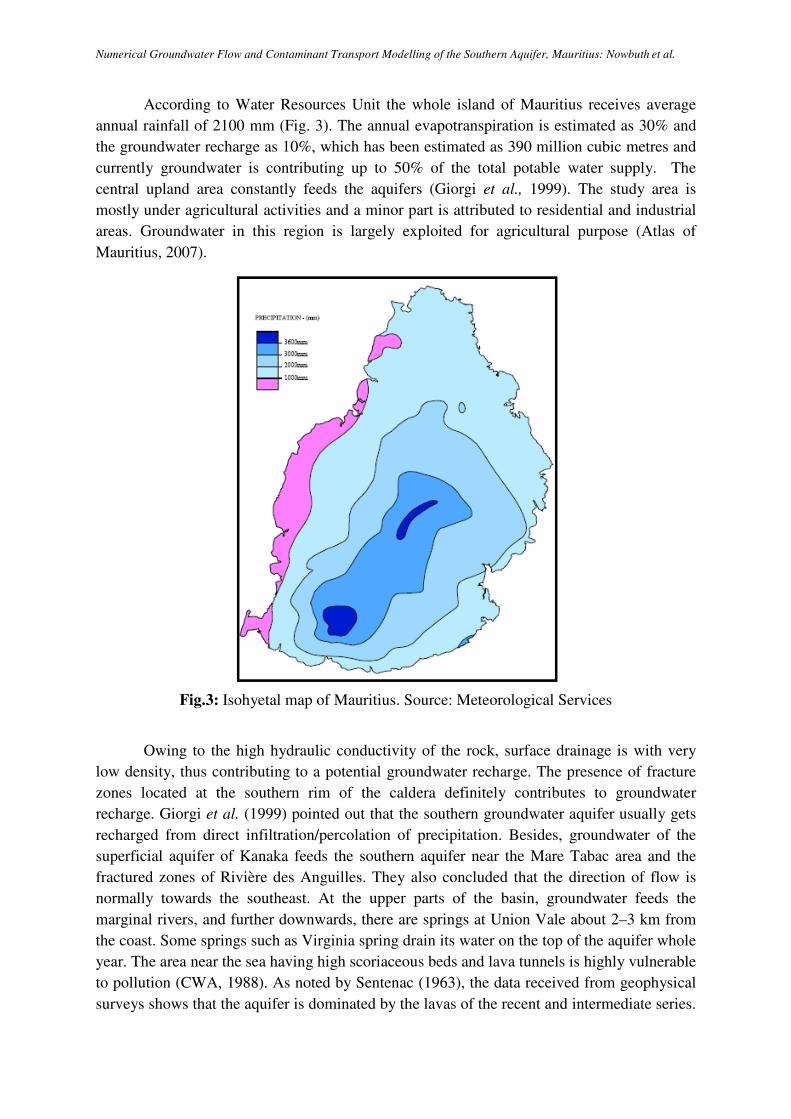
According to Water Resources Unit the whole island of Mauritius receives average
annual rainfall of 2100 mm (Fig. 3). The annual evapotranspiration is estimated as 30% and
the groundwater recharge as 10%, which has been estimated as 390 million cubic metres and
currently groundwater is contributing up to 50% of the total potable water supply. The
central upland area constantly feeds the aquifers (Giorgi et al., 1999). The study area is
mostly under agricultural activities and a minor part is attributed to residential and industrial
areas. Groundwater in this region is largely exploited for agricultural purpose (Atlas of
Mauritius, 2007).
Fig.3: Isohyetal map of Mauritius. Source: Meteorological Services
Owing to the high hydraulic conductivity of the rock, surface drainage is with very
low density, thus contributing to a potential groundwater recharge. The presence of fracture
zones located at the southern rim of the caldera definitely contributes to groundwater
recharge. Giorgi et al. (1999) pointed out that the southern groundwater aquifer usually gets
recharged from direct infiltration/percolation of precipitation. Besides, groundwater of the
superficial aquifer of Kanaka feeds the southern aquifer near the Mare Tabac area and the
fractured zones of Rivière des Anguilles. They also concluded that the direction of flow is
normally towards the southeast. At the upper parts of the basin, groundwater feeds the
marginal rivers, and further downwards, there are springs at Union Vale about 2–3 km from
the coast. Some springs such as Virginia spring drain its water on the top of the aquifer whole
year. The area near the sea having high scoriaceous beds and lava tunnels is highly vulnerable
to pollution (CWA, 1988). As noted by Sentenac (1963), the data received from geophysical
surveys shows that the aquifer is dominated by the lavas of the recent and intermediate series.
Open access e-Journal
Earth Science India, eISSN: 0974 – 8350 Vol. 5 (III), July, 2012, pp. 79-91
http://www.earthscienceindia.info/
83
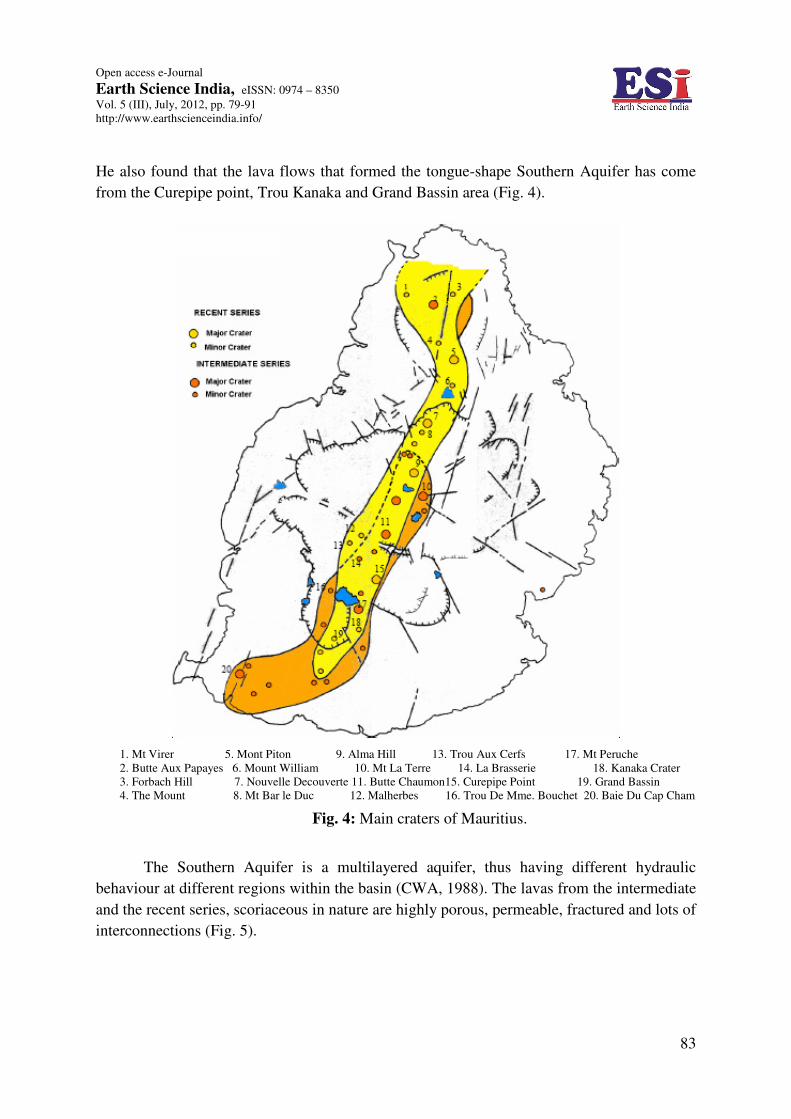
He also found that the lava flows that formed the tongue-shape Southern Aquifer has come
from the Curepipe point, Trou Kanaka and Grand Bassin area (Fig. 4).
1. Mt Virer 5. Mont Piton 9. Alma Hill 13. Trou Aux Cerfs 17. Mt Peruche
2. Butte Aux Papayes 6. Mount William 10. Mt La Terre 14. La Brasserie 18. Kanaka Crater
3. Forbach Hill 7. Nouvelle Decouverte 11. Butte Chaumon15. Curepipe Point 19. Grand Bassin
4. The Mount 8. Mt Bar le Duc 12. Malherbes 16. Trou De Mme. Bouchet 20. Baie Du Cap Cham
Fig. 4: Main craters of Mauritius.
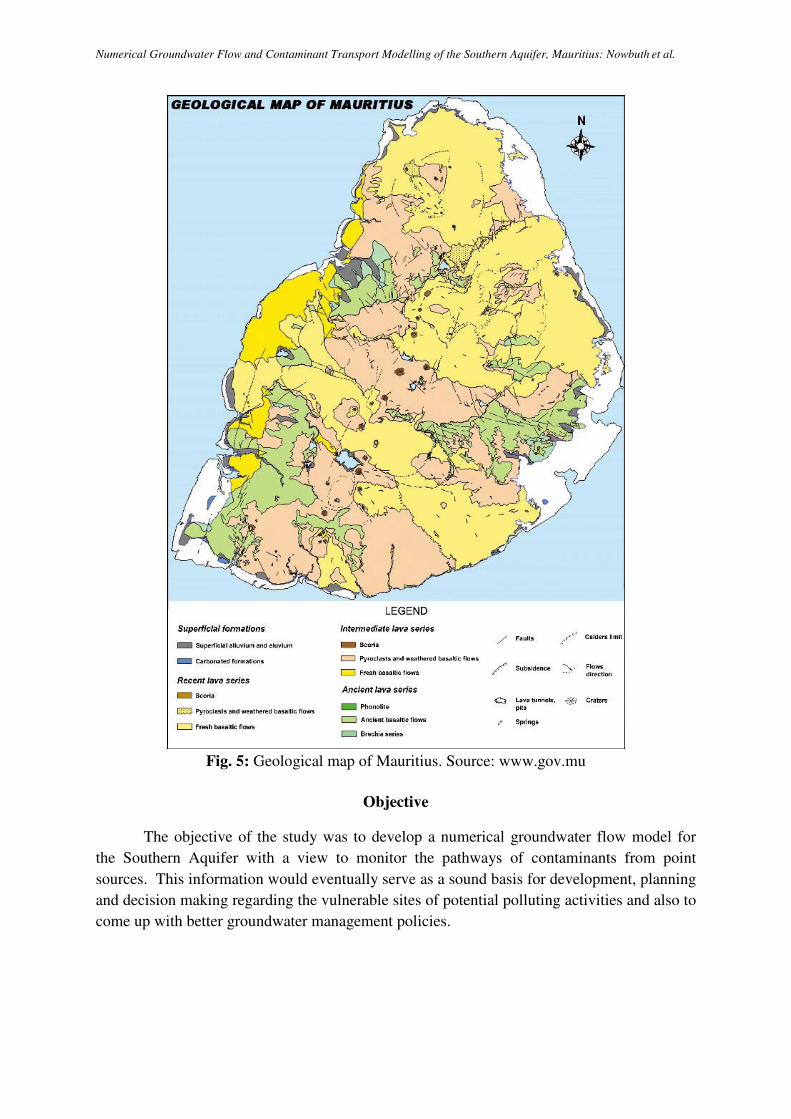
The Southern Aquifer is a multilayered aquifer, thus having different hydraulic
behaviour at different regions within the basin (CWA, 1988). The lavas from the intermediate
and the recent series, scoriaceous in nature are highly porous, permeable, fractured and lots of
interconnections (Fig. 5).
Numerical Groundwater Flow and Contaminant Transport Modelling of the Southern Aquifer, Mauritius: Nowbuth et al.
Fig. 5: Geological map of Mauritius. Source: www.gov.mu
Objective
The objective of the study was to develop a numerical groundwater flow model for
the Southern Aquifer with a view to monitor the pathways of contaminants from point
sources. This information would eventually serve as a sound basis for development, planning
and decision making regarding the vulnerable sites of potential polluting activities and also to
come up with better groundwater management policies.
Open access e-Journal
Earth Science India, eISSN: 0974 – 8350 Vol. 5 (III), July, 2012, pp. 79-91
http://www.earthscienceindia.info/
85
Methodology
The numerical model was developed by getting a thorough understanding of the
Southern Aquifer system in terms of its geology, recharge-discharge areas, current
exploitation scenario and the physical parameters of the aquifer. The conceptual model was
developed by carrying out a detailed literature review of the geological and hydrogeological
set up undertaken by various workers (Theis, 1935, 1963; Sentenac, 1963; Freeze and Cherry,
1979; Domenico and Schwartz, 1998; Fetter, 1999; Proag, 1995; Saddul, 2002). Secondary
data were collected with regards to groundwater levels from observation wells and pumping
rates from large domestic wells. Transmissivity data from past pumping tests and data
regarding small dug wells and shallow wells was also collected.
The data available on depths to groundwater levels were used to calibrate and verify
the validity of the model. A sensitivity analysis was performed on the calibration parameters
to determine the most sensitive parameter of the numerical model. Once calibrated, the model
was used for a number of simulations, such as, impact of overexploitation on seawater
intrusion and contaminant transport with respect to the hydraulic conductivity and hydraulic
gradient of the aquifer. The numerical model was developed by using the Visual Modflow
software: version 2.70 (Guiguer and Franz, 1996; Chiang and Kinzelbach, 1998; Hill, 1998).
The Groundwater Flow Model
Groundwater modelling refers to the representation of a real flow system (Anderson
and Woessner, 1992). Consequently, groundwater models are used specifically in
hydrogeology in order to have an in depth comprehension on the performance of an actual
flow system and to forecast changes that may occur in the groundwater levels or groundwater
storage. It also helps in decision making especially regarding the land surface developments,
such as erection of an industry, setting up of a wastewater treatment plant or land excavation
to accommodate a landfill site. The modelling protocol used for the study of the Southern
Aquifer was adapted from Anderson and Woessner (1992). This stepwise approach has built
a support in demonstrating the site specific model and worth capable of producing
meaningful results.
The computer code used for simulation of groundwater flow and contaminant
transport for the Southern Aquifer is written in FORTRAN that solves a set of algebraic
equations e.g. Equation: 1 generated by approximating the partial differential equations
(governing equations, boundary conditions and initial conditions) by Freeze and Cherry
(1979).
Equation 1: Partial differential equation for three-dimensional groundwater flow.
t
hSsQ
z
hK
zy
hK
yx
hK
xzzyyxx
∂
∂=−
∂
∂
∂
∂+
∂
∂
∂
∂+
∂
∂
∂
∂
Numerical Groundwater Flow and Contaminant Transport Modelling of the Southern Aquifer, Mauritius: Nowbuth et al.
Where,
Kxx, Kyy, Kzz = hydraulic conductivity along the x, y, z axes which are assumed to be parallel
to the major axes of hydraulic conductivity;
h = total piezometric head;
Q = volumetric flux per unit volume representing source/sink terms;
Ss = specific storage coefficient defined as the volume of water released from
storage per unit change in head per unit volume of porous material.
A set of algebraic equations produced is expressed in matrix form and solved by the iteration
process (Anderson and Woessner, 1992).
Grid Design
The process of development of the numerical model starts with the design of suitable
grid. Grid design was performed initially on the plan view, where the location and extent of
the aquifer were visualized. The finer the grid the better the modelling results, but at the
same time increases the computer processing time. At the beginning, the model was
developed with a coarse grid and later the grid spacing was refined to 244 m by 219 m.
Boundary Conditions
As far as possible, natural boundaries were identified and mostly physical boundaries
were chosen since they are the most stable features of the groundwater system. The boundary
conditions for the Southern Aquifer are as follows:
The lower boundary of the model is considered as comprising of impermeable rocks
forming no flow boundary. No flow boundaries at northeast and southwest of the aquifer
were assigned to Grand Port Range and Savanne Range respectively. Intra-calderic structure
(St Hubert and Vernon Hill) also considered as a part of no flow boundaries. The northwest
part is a specified hydraulic head boundary of 450 m where interaction between the Curepipe
aquifer and the Southern Aquifer takes place and groundwater flows from the higher to the
lower hydraulic head. The sea forms the south eastern boundary of the model and has been
assigned a status of constant head value of 0 m.
Physical Parameters
The aquifer parameters assigned to the model are hydraulic conductivity, storage
coefficient and recharge. Since the Southern Aquifer is highly heterogenous, the Zoning
method has been used to assign the parameters. In this method, the model domain is divided
into sub-zones depending on the geologic formation. Each sub-zone contains a number of
nodes that had similar aquifer properties based on the areal extent of the hydro-stratigraphic
units. The recent series basalt was considered as single zone with constant properties but
different zones were established for the Intermediate series basalt (Banharally, 2005).
According to Water Resources Unit (2002) the hydrogeological characteristics of
aquifers in terms of transmissivity for the different geological formations is given in Table-1.
Open access e-Journal
Earth Science India, eISSN: 0974 – 8350 Vol. 5 (III), July, 2012, pp. 79-91
http://www.earthscienceindia.info/
87
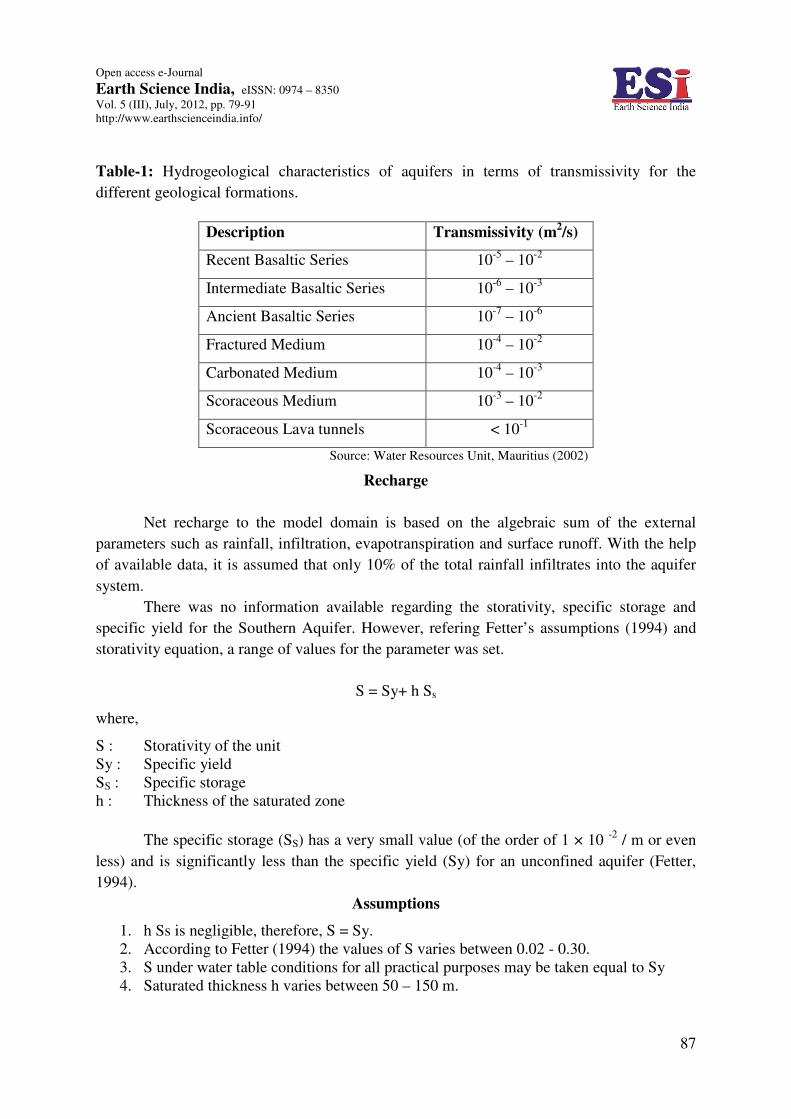
Table-1: Hydrogeological characteristics of aquifers in terms of transmissivity for the
different geological formations.
Description Transmissivity (m2/s)
Recent Basaltic Series 10-5
– 10-2
Intermediate Basaltic Series 10-6
– 10-3
Ancient Basaltic Series 10-7
– 10-6
Fractured Medium 10-4
– 10-2
Carbonated Medium 10-4
– 10-3
Scoraceous Medium 10-3
– 10-2
Scoraceous Lava tunnels < 10-1
Source: Water Resources Unit, Mauritius (2002)
Recharge
Net recharge to the model domain is based on the algebraic sum of the external
parameters such as rainfall, infiltration, evapotranspiration and surface runoff. With the help
of available data, it is assumed that only 10% of the total rainfall infiltrates into the aquifer
system.
There was no information available regarding the storativity, specific storage and
specific yield for the Southern Aquifer. However, refering Fetter’s assumptions (1994) and
storativity equation, a range of values for the parameter was set.
S = Sy+ h Ss
where,
S : Storativity of the unit
Sy : Specific yield
SS : Specific storage
h : Thickness of the saturated zone
The specific storage (SS) has a very small value (of the order of 1 × 10 -2
/ m or even
less) and is significantly less than the specific yield (Sy) for an unconfined aquifer (Fetter,
1994).
Assumptions
1. h Ss is negligible, therefore, S = Sy.
2. According to Fetter (1994) the values of S varies between 0.02 - 0.30.
3. S under water table conditions for all practical purposes may be taken equal to Sy
4. Saturated thickness h varies between 50 – 150 m.
Numerical Groundwater Flow and Contaminant Transport Modelling of the Southern Aquifer, Mauritius: Nowbuth et al.
SS max = Sy max / 50 hmin
SS max : maximum specific storage
Sy max : maximum specific yield
hmin : minimum saturated thickness
SS min= Sy min / 150 hmax
SS min : minimum specific storage
Sy min : minimum specific yield
hmax : maximum saturated thickness
Using above equation, the range for specific storage was computed between 2.67 × 10⁻⁵
and 1.2 × 10⁻³
/m.
For the first simulation, average values were used as follows:
Sy = 0.16
SS = 6.13 × 10⁻⁴
/m
Groundwater Flow - Simulation Result
For the first simulation, steady-state conditions were assumed and no data from rivers
were included. Intra-calderic borders were included to set the boundary conditions. The
velocity map shows the main direction of groundwater flow and the maximum velocity is of
the order of 5.6 × 10⁻⁵
m/s. Out of 13 observation wells, 9 observation wells were calibrated
according to the condition of having a residual of less than 20 m. The wells that have
residuals greater than 20 m are:
1. CH 210 Eau Bleue No. 6
2. CH 211 Eau Bleue No. 7
3. CH 212 Plaisance No. 1
4. CH 239 Cluny No. 12
This alteration in head values could be explained by the fact that a two-layered model
was built, owing to lack of detailed information on underground geological barriers. Increase
in residuals may be the result of neglecting certain important geological barriers within the
underground basin. Also, sensitivity analysis showed that there were many alterations in
calibrated values related to anisotropy; therefore assumption of isotropic medium amplified
the residuals. The size of the cells implemented was uniform everywhere.
By including both, precipitation and aquifer interaction with the central uplands as
recharge factors in the model has changed the pattern of distribution of groundwater
completely. It was noticed that the aquifer has a strong recharge component from the central
plateau. The central uplands were therefore described as the main recharge zone for the
Southern Aquifer. At some places within the Southern Aquifer, it was found that numerous
cells turned out to be dry, mostly in regions nearer to the coast. Also, it was reasonable to
Open access e-Journal
Earth Science India, eISSN: 0974 – 8350 Vol. 5 (III), July, 2012, pp. 79-91
http://www.earthscienceindia.info/
89
decrease the amount of infiltrated water as there are residential buildings made the large area
impervious.
It was observed that the geological barriers found uplands of the aquifer, controlled
the flow direction and the quantity of flow to a larger extent. Presence of the geological
barriers has increased the storage capacity in that particular region of the aquifer as revealed
by the water levels. The variation in results showed the extent to which the intracalderic
borders would affect the flow direction and the water levels. The results from the geological
barriers proved to be true about the underground reservoir within the caldera which could
constitute a hydrogeological regulator for the island.
Simulating Contaminant Transport
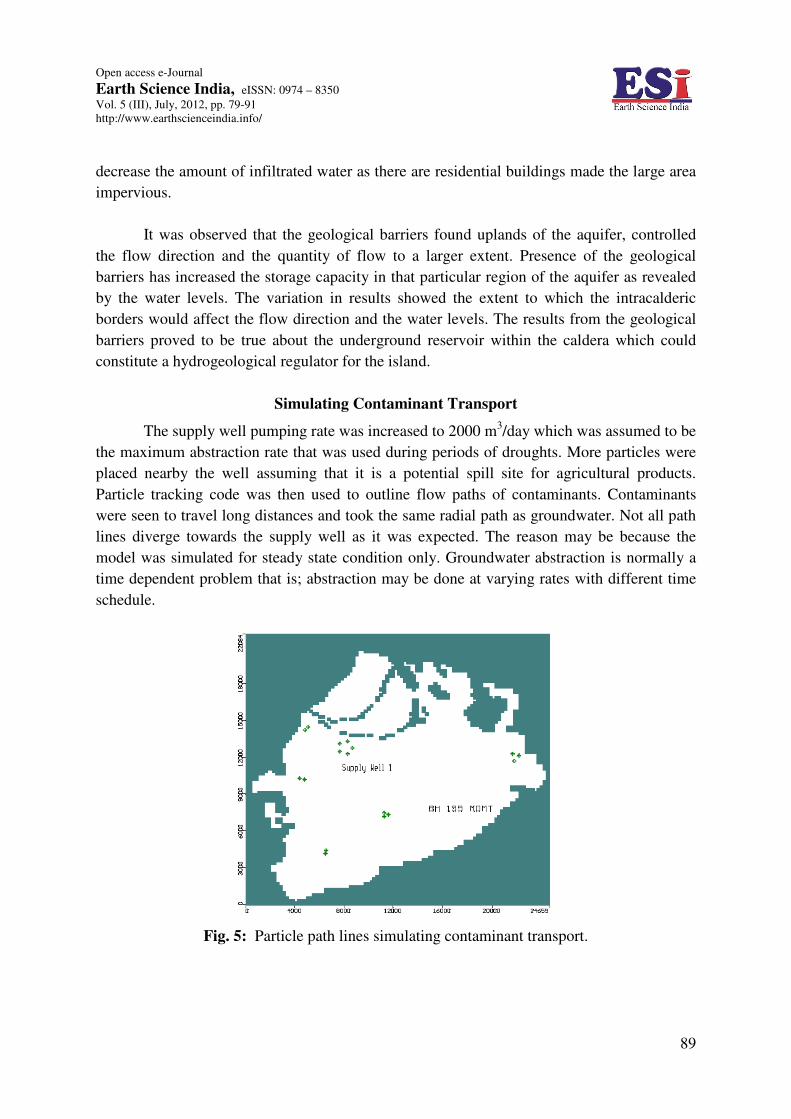
The supply well pumping rate was increased to 2000 m3/day which was assumed to be
the maximum abstraction rate that was used during periods of droughts. More particles were
placed nearby the well assuming that it is a potential spill site for agricultural products.
Particle tracking code was then used to outline flow paths of contaminants. Contaminants
were seen to travel long distances and took the same radial path as groundwater. Not all path
lines diverge towards the supply well as it was expected. The reason may be because the
model was simulated for steady state condition only. Groundwater abstraction is normally a
time dependent problem that is; abstraction may be done at varying rates with different time
schedule.
Fig. 5: Particle path lines simulating contaminant transport.
Numerical Groundwater Flow and Contaminant Transport Modelling of the Southern Aquifer, Mauritius: Nowbuth et al.
Discussion and Conclusion
The Southern Aquifer is one of the five main aquifers of Mauritius where mainly
hydrogeological studies were conducted. With the increasing urbanisation and water demand
it was necessary to set up a groundwater model for this particular aquifer in order to find out
the extent to which the groundwater resources can be safely exploited. The two dimensional
steady state groundwater flow model has been developed for the Southern Aquifer, a valuable
tool that could be used to help understand the movement of groundwater and pollutants
through the subsurface. The main results of the model specified that groundwater moves in a
radial path towards decreasing hydraulic head and gets recharged from the central plateau.
Though the particle tracking model did not account for the effects of dispersion or
physical and chemical retardation of the contaminant, it was noticed that the particles follow
the same radial flow as groundwater. The model was also able to show that the intracalderic
borders within the Southern Aquifer acts as geological barriers to the flow of groundwater.
The numerical model obtained could assist in problem evaluation, for example the quantity of
contaminants that would migrate and the area vulnerable to pollution. The model could also
help in understanding the consequent flow processes due to the setting up of new extraction
wells. The numerical model may provide valuable information for decision making, such as
the safe rate of abstraction that can be applied at each well, without creating any impact on
the subsurface conditions. Such numerical models can eventually be used in the water
management sector and contribute to the assessment of water demand and availability.
References
Anderson, M.P. and Woessner, W. W. (1992) Applied groundwater modelling: simulation of flow and advective
transport., Orlando, Florida: Academic Press, 381p.
Atlas of Mauritius (2007) Editions de l’ocean Indien, Mauritius and Philip’s, London: Commercial Press
Sdn.Bhd., Malaysia, 336p.
Banharally, M. N. (2005) Modelling of Groundwater flow in a volcanic aquifer, B.E. Civil (Hon.) Dissertation
thesis, Univ. of Mauritius, Mauritius, 132 p.
Central Water Authority (CWA) (1988), Hydrology Year Book. Ministry of Energy and Water Resources,
Government of Mauritius, 315p.
Chiang, W.-H., and Kinzelbach, Wolfgang. (1998) Processing Modflow- A simulation system for modeling
groundwater flow and pollution: software manual, 325 p.
Domenico, A. and Schwartz, F. (1998) Physical and Chemical Hydrogeology. John Wiley and Sons, Inc., 2nd
Edition, 506p.
Food and Agriculture Organization (FAO-1999) Project Report: Water Profile of Mauritius.
Fetter (1999) Contaminant hydrogeology. 2nd Ed. Upper Saddle River, N.J., Prentice-Hall, 598p.
Freeze, R. A., and Cherry, J. A. (1979) Groundwater: Prentice-Hall, Inc., Englewood Cliffs, New Jersey, 604 p.
Giorgi, L., Borchiellini, S. and Delucchi, L. (1999) Appui a la Gestion des Ressources en Eau et a la
Preservation de leur Qualite: Le Schema Hydrogeologique. Mauritius: Water Resources Unit.
Guiguer, N. and Franz, Th. (1996) Visual Modflow Version 2.00 - The Integrated Modelling Environnent for
MODFLOW and MODPATH, Waterloo Hydrogeologic Software.
Hill, M.C. (1998) Methods and guidelines for effective model calibration. U.S. Geological Survey Water
Resources Investigations Report, pp. 98 – 4005.
Proag, V. (1995) The Geology and Water Resources of Mauritius., Mahatma Gandhi Institute Press, Moka,
Mauritius.
Proag, V. (2006) Water resources management in Mauritius., European Water, 15/16, E.W. Publ., pp.45-57.
Saddul, P. (1996) Atlas of Mauritius for E.V.S. and social studies, George Philip Ltd., London, 800p.
Saddul, P. and Mphande, D.W. (2002) Mauritius: A Geomorphological Analysis, Published by Mahatma
Gandhi Institute, Moka, Republic of Mauritius, 340 p.
Open access e-Journal
Earth Science India, eISSN: 0974 – 8350 Vol. 5 (III), July, 2012, pp. 79-91
http://www.earthscienceindia.info/
91
Sentenac, R. (1964) Recherches d’eau southerrain a l’ile Maurice, MSIRI, occasional paper, v. 17, pp. 1 -21.
Theis, C. V. (1935) The relation between the lowering of the piezometric surface and the rate and duration of
discharge of a well using groundwater storage: American Geophysical Union Transaction, v. 16, pp. 519–
524.
Theis, C. V. (1963) Estimating the transmissivity of a water-table aquifer from the specific capacity of a well:
U.S. Geological Survey Water Supply Paper 1536-I, pp. 332-336.
Water Resources Unit (2002) Hydrology Data Book, Mauritius: Ministry of Utilities.