Embed Size (px)
Citation preview
Earth Planets Space, 64, 817–827, 2012
Numerical experiment and a case study of sediment transport simulation of the2004 Indian Ocean tsunami in Lhok Nga, Banda Aceh, Indonesia
Aditya Riadi Gusman1, Yuichiro Tanioka1, and Tomoyuki Takahashi2
1Institute of Seismology and Volcanology, Hokkaido University, Japan2Faculty of Safety Science, Kansai University, Japan
(Received October 31, 2010; Revised October 14, 2011; Accepted October 21, 2011; Online published October 24, 2012)
We use a two-dimensional tsunami sediment transport model to study the source of the 2004 earthquake.To test the model behavior, numerical experiment on sediment deposition and erosion is performed usingvarious hypothetical parameters of tsunami wavelength, topographic slope, and sediment supply. The numericalexperiment results show that erosion and deposition are strongly influenced by the tsunami wavelength and thetopographic slope. The model is used to compute the spatial distribution of tsunami deposit thickness produced bythe 2004 Indian Ocean over an actual elevation datasets in the coastal area of Lhok Nga, Banda Aceh, Indonesia.The model produced simulated tsunami deposits that have similar thicknesses with the measured data along asurveyed transect. Then we estimate a simple fault model for the southern portion of the 2004 earthquake usingtsunami sediment transport simulations. The simulated tsunami run-up from the fault model is very close to themeasured run-up. This result indicates that a source process of a large earthquake that generates a large tsunamihas a potential to be estimated using sediment deposit distribution data.Key words: Sediment transport simulation, the 2004 Indian Ocean tsunami, numerical experiment, slip amount.
1. IntroductionLarge tsunamis can deposit sand layers up to several tens
centimeters and distributed sand layers several kilometersinland. For example, in case of the 2004 Indian Oceantsunami, the maximum tsunami height at Lhok Nga, westof Banda Aceh, Indonesia, was 35 m, and the inundationdistance reached 6 km inland (Tsuji et al., 2005; Paris etal., 2007). The tsunami deposited sand up to 80 cm thickand left mud up to 5 km inland (Moore et al., 2006).
Recent tsunami sediment deposits have been studied byNishimura and Miyaji (1995) in Hokkaido, Dawson (1994)in Java, Gelfenbaum and Jaffe (2003) in Papua New Guinea,Moore et al. (2006) and Paris et al. (2007) in Aceh, Suma-tra, and MacInnes et al. (2009) in Kuril Islands. The in-teractions between the tsunami, the topography, and thesediment source affect the spatial distribution and charac-teristics of tsunami deposits (Dawson, 1994; Gelfenbaumand Jaffe, 2003). Jaffe and Gelfenbuam (2007) devel-oped a simple model for tsunami sedimentation that canbe applied to calculate tsunami flow speed from the thick-ness and grain size of a tsunami deposit. Two-dimensionalsimulation models that simulate topographic change in-duced by tsunami previously developed by Takahashi etal. (1999, 2000), Fujii et al. (2008), and Nishihata et al.(2005). A three-dimensional hydrostatic shallow watermodel, the C-HYDRO3D, was developed to study tsunamisediment transport at coastal areas near a harbor (Kihara
Copyright c© The Society of Geomagnetism and Earth, Planetary and Space Sci-ences (SGEPSS); The Seismological Society of Japan; The Volcanological Societyof Japan; The Geodetic Society of Japan; The Japanese Society for Planetary Sci-ences; TERRAPUB.
doi:10.5047/eps.2011.10.009
and Matsuyama, 2010). Another three-dimensional numer-ical model, the Deflt3D, was used to simulate the inunda-tion and sediment transport of tsunami over measured andidealized coastal morphologies at Fagafue Bay, AmericanSamoa (Apotsos et al., 2011a) and Kuala Meurisi, Sumatra,Indonesia (Apotsos et al., 2011b).
On the other hand, when those tsunami deposits wereburied and preserved, they became the geological recordsof past tsunamis (Paris et al., 2007). Paleotsunami depositshave been used to estimate the recurrence interval of greatearthquakes (Atwater, 1987; Minoura et al., 2001; Jankaewet al., 2008; Monecke et al., 2008). Paleo-tsunami de-posits have been used to study the type and size of a pre-historical earthquake (Minoura et al., 2001; Namegaya etal., 2010). Namegaya et al. (2010) compare the simulatedinundation area with the distribution area of the 869 Jogantsunami deposits to determine that the earthquake was an in-terplate earthquake with magnitude of Mw 8.4. Those pre-vious studies assumed that the tsunami inundation area isthe same as the tsunami deposits distribution area. How-ever, the tsunami inundation area can be much larger thanthe deposited area (Goto et al., 2011).
In this paper, we try to show that the tsunami depositsdata are useful to find the source processes of pre-historicallarge earthquake. Source processes of pre-historical largeearthquakes are one of key data need to be found forearthquake prediction researches. Numerical simulation oftsunami sediment transport from the co-seismic deforma-tion using the earthquake fault model is needed for explain-ing the tsunami deposit data. First, to understand the inter-action between tsunami hydraulics and sediment transportwith a given input parameters, we perform one-dimensional
817
818 A. R. GUSMAN et al.: TSUNAMI SEDIMENT TRANSPORT SIMULATION
sediment transport numerical experiment. Then, we test ourtechnique to explain the actual tsunami deposit data at LhokNga, Banda Aceh, Indonesia, due to the 2004 Sumatra-Andaman earthquake using a two-dimensional sedimenttransport simulation. Finally, we try to find the possibil-ity to estimate the slip amount on an assumed simple faultmodel from sediment transport simulations.
2. Tsunami Sediment Transport ModelTo simulate tsunami propagation and inundation, the
TUNAMI-N2 (IUGG/IOC TIME Project) model is used.The model solves the nonlinear shallow water equationsthat are based on the conservation of mass and momentumusing a finite difference scheme in the Cartesian coordinatesystem (Goto et al., 1997). Those equations are the follow-ing:
∂h
∂t+ ∂ M
∂x+ ∂ N
∂y= 0 (1)
∂ M
∂t+ ∂
∂x
(M2
D
)+ ∂
∂y
(M N
D
)
+gD∂h
∂x+ gn2
D73
M√
M2 + N 2 = 0 (2)
∂ N
∂t+ ∂
∂x
(M N
D
)+ ∂
∂y
(N 2
D
)
+gD∂h
∂y+ gn2
D73
N√
M2 + N 2 = 0 (3)
where t is time, h is water level, M and N are dischargefluxes along x and y axes, g is the gravitational acceleration,n is Manning’s roughness, and D is the total water depthgiven by h + d. Boundary conditions for tsunami run-upcomputation are determined by the judgment of a cell forbeing submerged or dry. Discharge across the boundarybetween two cells is calculated if the ground height in thedry cell is lower than the water level in the submerged cell;otherwise, the discharge is considered to be zero (Imamura,1996).
Among the sediment transport models mentioned inthe previous section, we choose to build and use a two-dimensional model based on the method by Takahashiet al. (2000) because it is rather simple compare to thethree-dimensional models. Another reason is that a two-dimensional model requires less computer time per runcompare to a three-dimensional model. The magnitude ofthe 2004 tsunami required us to simulate sediment trans-port over a large area, so a two-dimensional model is pre-ferred. Takahashi et al. (2000) assumed two distinct layersof suspended load layer and bed load layer in their modeland used the concept of exchange rate that connect the twolayers. The exchange rate is a balance between sedimentsettling down from suspended load layer and the sedimentrising up to the suspension. This method was applied tostudy the sediment transport of the 1960 Chile tsunami inKesennuma Bay, Japan (Takahashi et al., 2000).
To simulate sediment transported by tsunami, the conti-nuity equations for bed load transport and suspended trans-port are solved numerically. The model can be used to eval-uate tsunami induced erosion and deposition for a single
grain diameter of sediment. The followings are the continu-ity equations in the bed load layer and the suspended layer.
∂ ZB
∂t+ 1
1 − λ
(∂ QBx
∂x
∂ QBy
∂y+ Wex
)= 0 (4)
∂C M
∂x
∂C N
∂y− Wex + ∂C D
∂t= 0 (5)
In the above equations, ZB is bed level, λ is porosity, QBx
and QBy are bed load rate in −x and −y directions, Wex isexchange load, and C is the mean concentration of sedimentin the suspended load layer. The mean concentration of thesuspended load is limited up to 1%.
Takahashi et al. (2000) proposed the following equationsfor the bed load and exchange rate due to a tsunami.
qB = 21√
sgd3 τ32∗ (6)
Wex = 0.012√
sgd τ 2∗ − ω0C (7)
In the above equations, qB is bed load rate, s = ρs−ρ
ρis the
submerged specific gravity of the sand particle, ρs and ρ arethe densities of sediment and the fluid, respectively, d is the
mean grain diameter, the τ∗ = u2∗
sgd is Shields number, u∗ isshear velocity, and ω0 is the settling velocity.
Watanabe et al. (1984) showed that the bed load trans-port is affected by the topography and is a function of thediffusion coefficient of sediment (εz), which is assumed tobe 2.0 (Tanaka et al., 1989). The equations of bed load ratein −x and −y directions due to the effect of topography(Watanabe et al., 1984) are the following:
QBx = qBx − |qBx |εz∂ ZB
∂x(8)
QBy = qBy − |qBy |εz∂ ZB
∂y(9)
The settling velocity of a particle is related to the parti-cle shape, particle size, specific gravity, and the kinematicviscosity of the sediment. The settling velocity of a spherein a fluid at rest can be estimated by solving the balancebetween the gravitational force and the drag resistance.
A simple formula to estimate the settling velocity of nat-ural sediment particles has been obtained from the previouswork of Dietrich (1982), which can be used for a given sed-iment diameter, shape factor, and roundness. In case of noinformation on shape and roundness factor, the shape factorof 0.7 and roundness value of 3.5 can be used for naturalsediment particles (Jimenez and Madsen, 2003). The sub-merged specific gravity is assumed to be 1.65. The kine-matic viscosity corresponds to fresh water at specified tem-perature.
3. Numerical Experiment3.1 Method
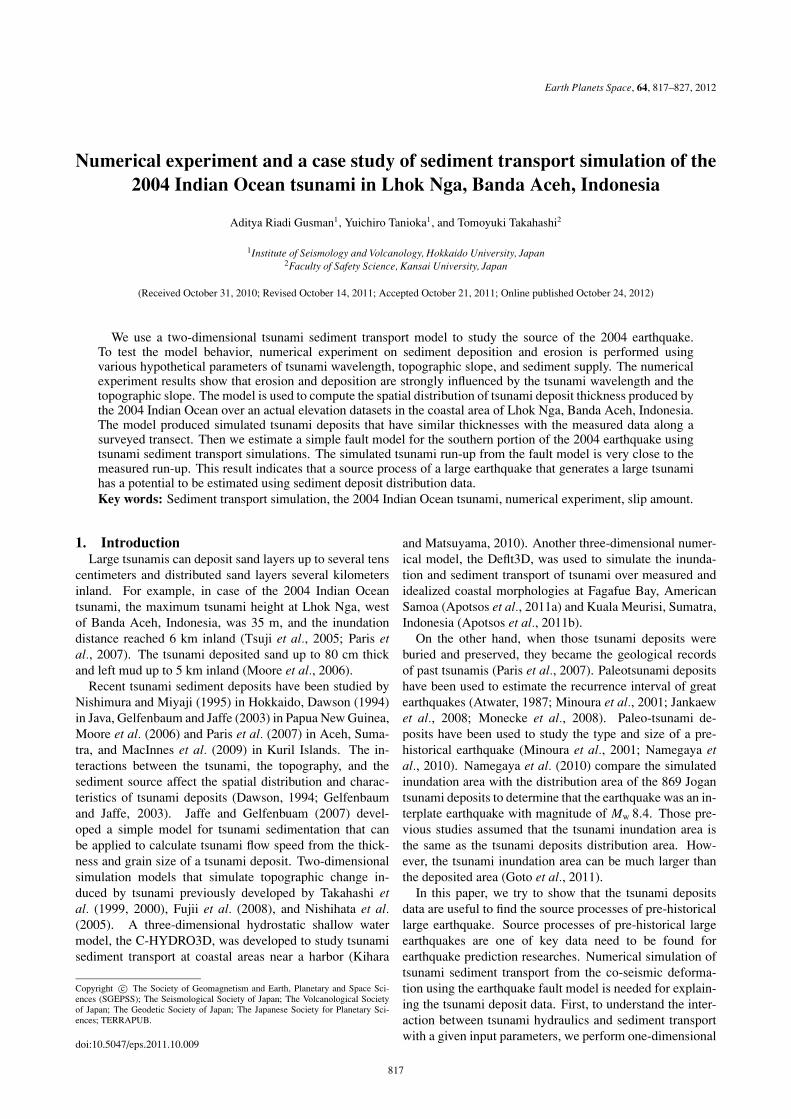
Tsunami waveforms are simulated at a point with adistance of 2 km from the coastline of a hypotheticalbathymetry by using different fault models. The fault mod-els have different fault widths of 25 km, 50 km, and 100 km,respectively. Each of the fault models has a slip amountthat is set to generate tsunami waveforms with amplitudes
A. R. GUSMAN et al.: TSUNAMI SEDIMENT TRANSPORT SIMULATION 819
Fig. 1. Three different hypothetical tsunami waveforms.
of about 6 m. The simulated tsunami waveforms of TW1,TW2 and TW3 have negative wave front and wave periodsof about 36, 42, and 65 min, respectively (Fig. 1). Thesetsunami waveforms are used as inputs of sediment transportsimulations in this numerical experiment.
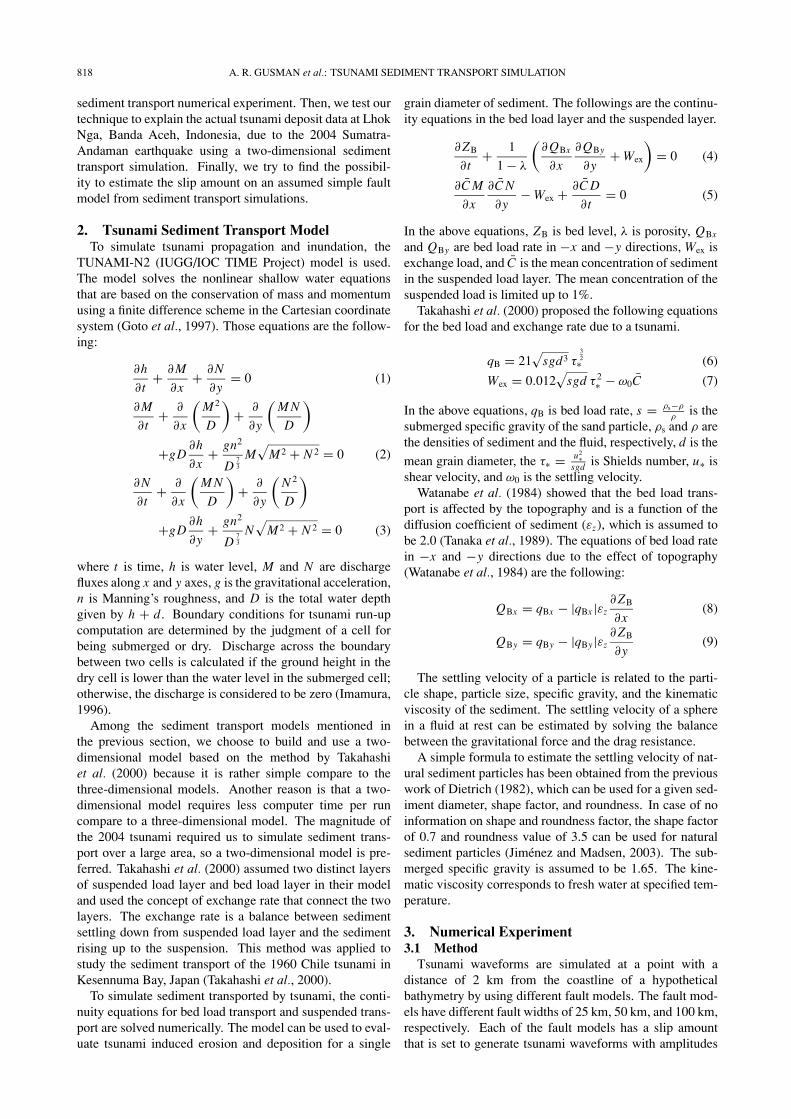
We design three geometries of hypothetical topographyof Topo1, Topo2, and Topo3 that have topographic slopes of8:800, 5:800, and 3:800, respectively (Fig. 2). Each of thetopography has three types of landforms, which are beach,coastal plain and hill. Steeper topographic slope (hill) oneach of the hypothetical topography is designated to stopa tsunami for inundating farther inland. The slope of thebathymetry used for all designs is the same (slope = 3:200)with maximum depth of 30 m (Fig. 2). The cross-shorelength of the elevation profiles is 3 km with modeling grid
size of 20 m.Another important feature in sedimentation process is
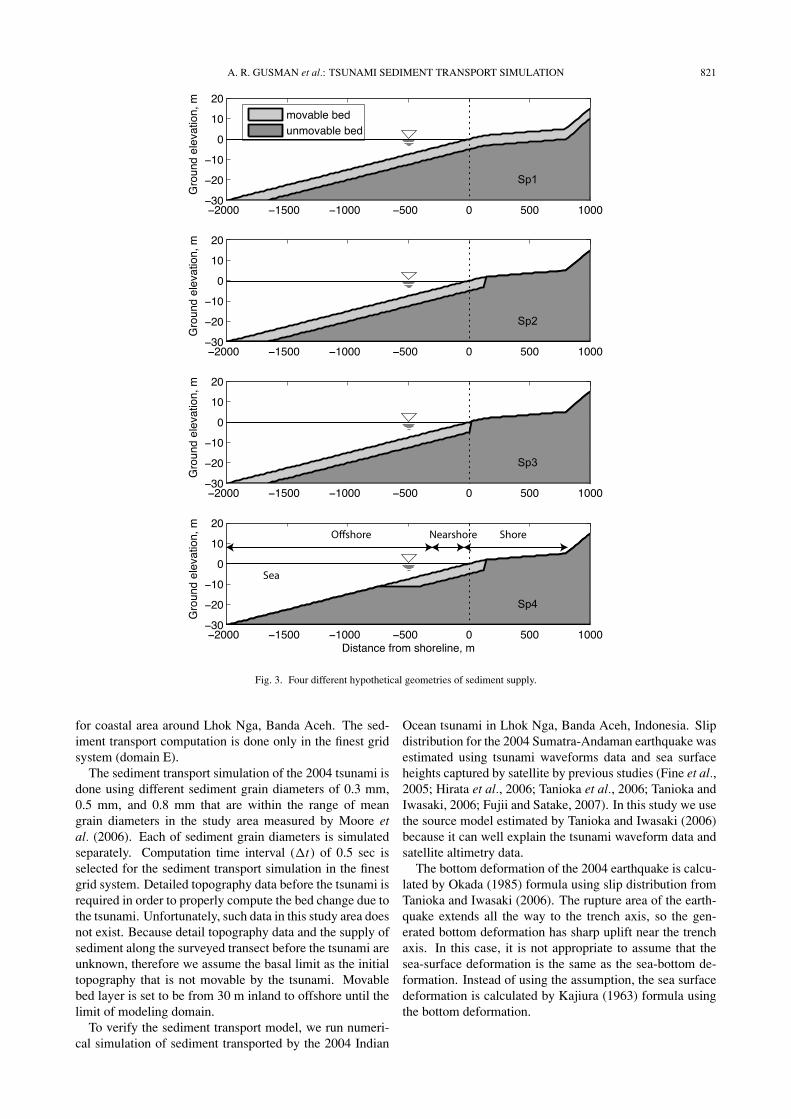
sediment supply. Coastal areas usually formed by sandybeaches, dunes, cliffs, and rocky outcrops, it is also likelyto have estuaries, lagoons, and river deltas (Bird, 2008).Sandy beaches are easy to be eroded by tsunamis whilesoil-formed lands are reluctant to erosion. Here we designfour different geometries of bed conditions of Sp1, Sp2,Sp3, and Sp4 (Fig. 3). The geometries are applied to thetopography of the Topo2. Each of the geometries containsmovable bed layer and unmovable bed layer. The movablebed layer described by two types of limits, the first is thevertical limit as deep as 5 m from the surface that is appliedto all geometries, and the second is the horizontal limit. TheSp1 does not have horizontal limit within the modeling areaand therefore have homogenous thickness of movable bedof 5 m. In Sp2, the initial topography is not movable from140 m to the farther inland. In Sp3, the initial topographyis not movable from the shoreline to the farther inland. TheSp4 has the same inland limit as Sp2 but the offshore limitis set to be as far as 740 m from the shoreline.3.2 Results
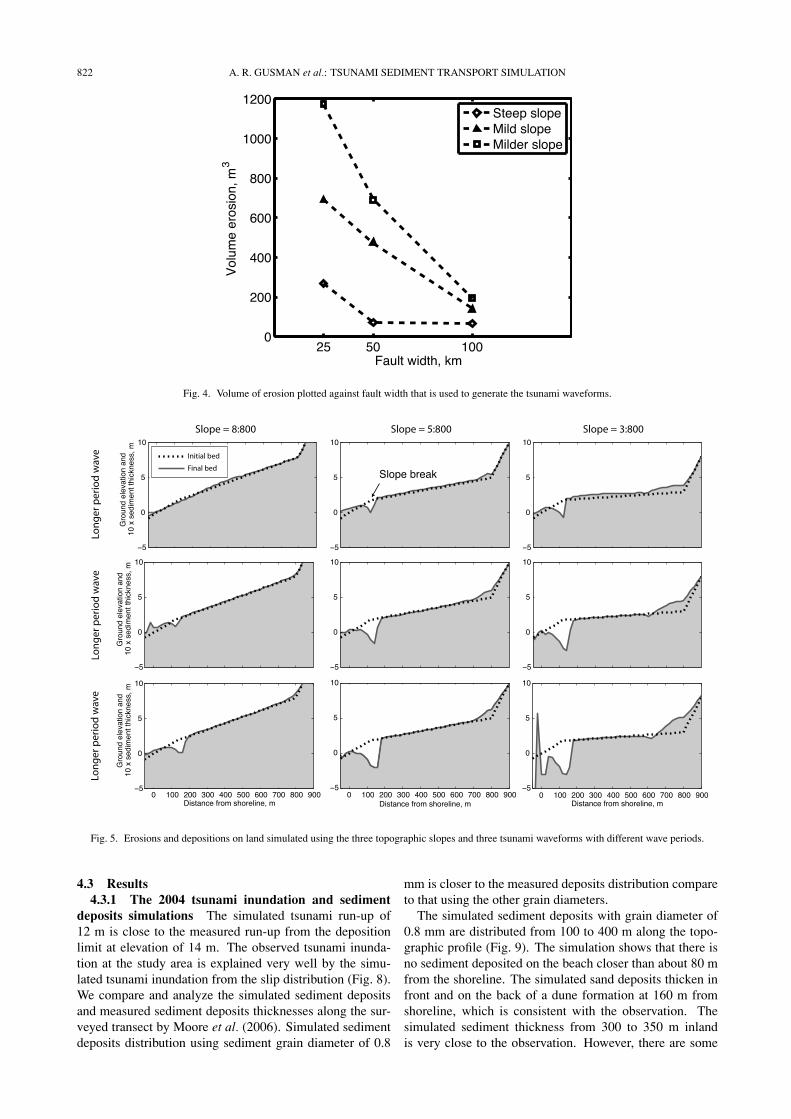
3.2.1 Effect of tsunami wavelength The results ofsediment transport simulations on the three land slopesshow that the tsunami with shorter wavelength generatesmore erosion than the tsunami with longer wavelengths(Fig. 4). This is due to the energy by the tsunami withshorter wavelength that induces larger flow accelerationthan the tsunami with longer wavelength. The tsunami withlonger wavelength distributes sand layer more smoothlyalong the coastal plain than the tsunami with shorter wave-length (Fig. 5). The tsunami with shorter wavelength accu-mulates more sand deposits near the hill at the back of thebeach than the tsunami with longer wavelength (Fig. 5).
3.2.2 Effect of topographic slope Simulation resultson the three geometries topography show that the erosionsare located near the shoreline and depositions are on thecoastal plain (Fig. 5). Erosion usually occurs around theslope break (Fig. 5) where spatial flow acceleration can belarge. The eroded land is located near the beach where largebed load transport and large amount of sand rising to sus-pension immediately after the tsunami hit the shore and dur-ing backwash. The calculated volume of erosion is largerwhen using topography with sharper slope break, which inthis case is the topography with milder slope (Fig. 4).
The simulated sand deposits thickness increase near thesteeper slope topography (hill) that stops the tsunami forinundating farther inland. This is because more sand par-ticles fall on the bed due to accumulation and saturationof suspended concentration in the water columns near thehill. Comparison of bed changes using the three topogra-phy shows that the sand layer is distributed more smoothlywhen using milder topographic slope. The comparisonsusing tsunami waveforms with different wavelengths alsoshow the same result.
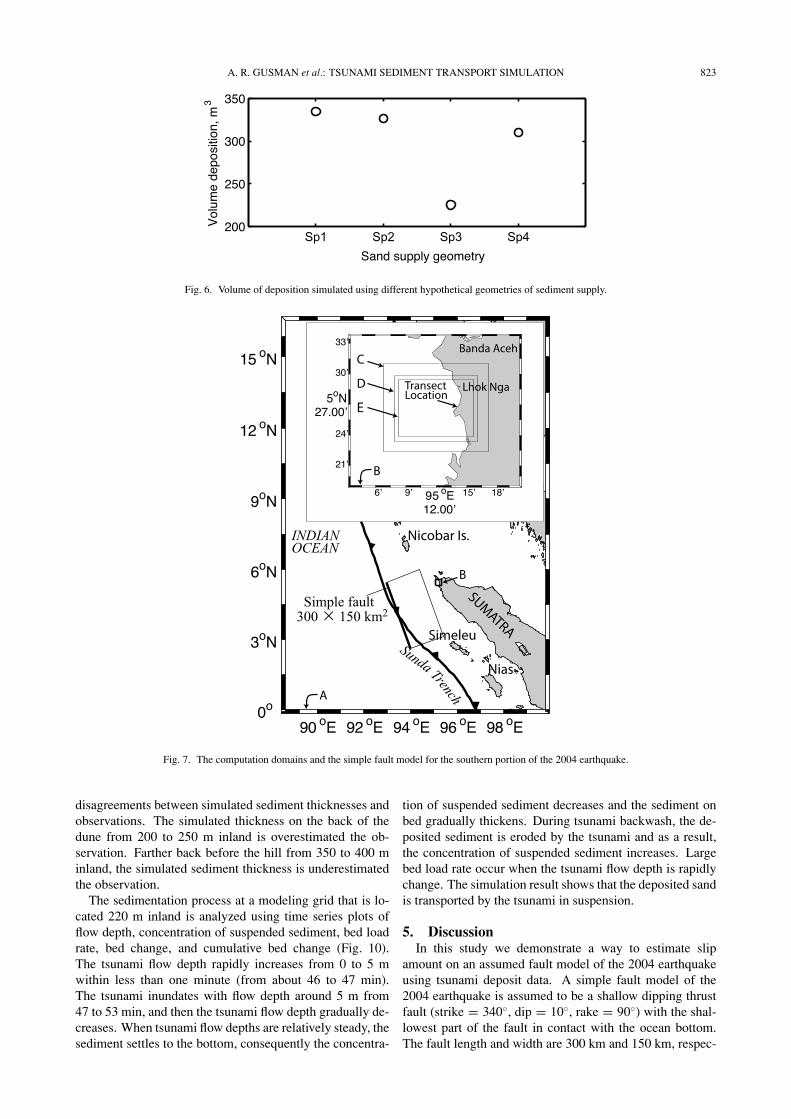
3.2.3 Effect of sediment supply The calculated vol-umes of deposition decrease from Sp1 to Sp2 and Sp2 toSp3 in which the amount of movable sand on the bed de-creases. The deposited sand when using the geometry Sp3where there is no sand supply in the onshore direction is
820 A. R. GUSMAN et al.: TSUNAMI SEDIMENT TRANSPORT SIMULATION
Fig. 2. Three different hypothetical geometries of topography.
significantly smaller compare to that using the geometriesof Sp1, Sp2, and Sp4. Comparison of the calculated vol-umes of deposition using the geometries of Sp2 and Sp4shows that the limitation of sediment supply offshore doesnot affect much the deposition on land (Fig. 6). These re-sults show that the deposition on land seems to be influ-enced by supply of sediment near-shore and onshore, butnot significantly by supply of sediment in the offshore area.
4. Case Study of the 2004 Indian Ocean Tsunami4.1 Data
Tsunami sand deposits were collected by Moore et al.(2006) along a 400 m transect in Lhok Nga, Banda Aceh,Indonesia. The measured transect originates at the shorelineat 5◦26′32.5′′N and 95◦14′22.8′′E. Along the transect theymeasured topographic profile and thickness of sediment de-posited by the 2004 tsunami. The sand layer is distributedalong the profile from 100 to 400 m from shoreline withmaximum sediment thickness of 20 cm. The mean graindiameters of sediment samples range from 0.3 to 0.9 mm.In this study, these data are used for comparison to verifythe simulation result. The tsunami run-up height of about
14 m at 400 m from shoreline is estimated from the limit ofsediment deposit.
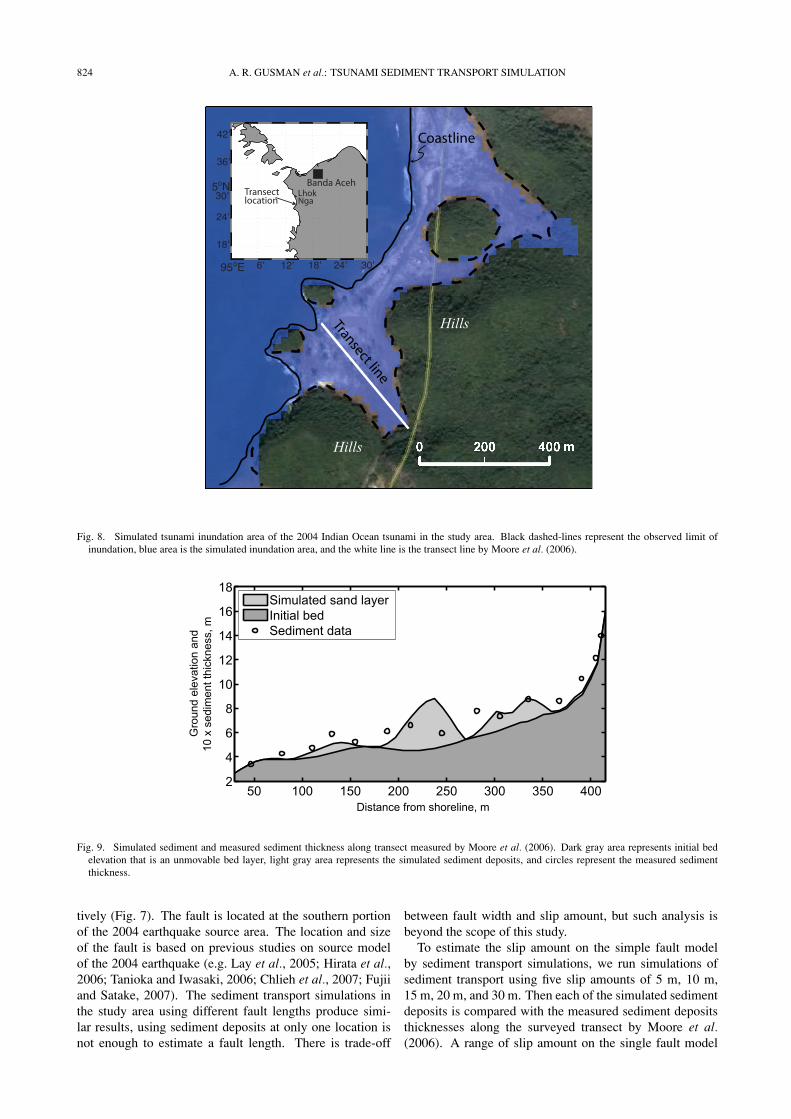
Elevation datasets that include both bathymetry and to-pography are required for tsunami inundation and sedimenttransport simulations. For bathymetry data, the GeneralBathymetric Chart of the Oceans (GEBCO) dataset with 30arc-sec resolution and nautical charts around west coast ofBanda Aceh are used. To reproduce the topography datasetaround the surveyed transect, the BAKOSURTANAL topo-graphic contour map and the measured ground elevationsby Moore et al. (2006) are combined. Then the elevationdatasets for tsunami inundation and sediment transport sim-ulation is obtained by combining the bathymetry and thetopography datasets.4.2 Method
The computational area of the tsunami numerical simu-lation ranges from 88.5◦E to 100◦E and from 0◦ to 17◦N.Different grid sizes of 1.8 km (domain A), 600 m (domainB), 200 m (domain C), 67 m (domain D), and 22 m (do-main E) are respectively used to compute the 2004 tsunami(Fig. 7). Nested grid system is used to connect between gridsystems with different grid sizes. The finest grid system is
A. R. GUSMAN et al.: TSUNAMI SEDIMENT TRANSPORT SIMULATION 821
Fig. 3. Four different hypothetical geometries of sediment supply.
for coastal area around Lhok Nga, Banda Aceh. The sed-iment transport computation is done only in the finest gridsystem (domain E).
The sediment transport simulation of the 2004 tsunami isdone using different sediment grain diameters of 0.3 mm,0.5 mm, and 0.8 mm that are within the range of meangrain diameters in the study area measured by Moore etal. (2006). Each of sediment grain diameters is simulatedseparately. Computation time interval (t) of 0.5 sec isselected for the sediment transport simulation in the finestgrid system. Detailed topography data before the tsunami isrequired in order to properly compute the bed change due tothe tsunami. Unfortunately, such data in this study area doesnot exist. Because detail topography data and the supply ofsediment along the surveyed transect before the tsunami areunknown, therefore we assume the basal limit as the initialtopography that is not movable by the tsunami. Movablebed layer is set to be from 30 m inland to offshore until thelimit of modeling domain.
To verify the sediment transport model, we run numeri-cal simulation of sediment transported by the 2004 Indian
Ocean tsunami in Lhok Nga, Banda Aceh, Indonesia. Slipdistribution for the 2004 Sumatra-Andaman earthquake wasestimated using tsunami waveforms data and sea surfaceheights captured by satellite by previous studies (Fine et al.,2005; Hirata et al., 2006; Tanioka et al., 2006; Tanioka andIwasaki, 2006; Fujii and Satake, 2007). In this study we usethe source model estimated by Tanioka and Iwasaki (2006)because it can well explain the tsunami waveform data andsatellite altimetry data.
The bottom deformation of the 2004 earthquake is calcu-lated by Okada (1985) formula using slip distribution fromTanioka and Iwasaki (2006). The rupture area of the earth-quake extends all the way to the trench axis, so the gen-erated bottom deformation has sharp uplift near the trenchaxis. In this case, it is not appropriate to assume that thesea-surface deformation is the same as the sea-bottom de-formation. Instead of using the assumption, the sea surfacedeformation is calculated by Kajiura (1963) formula usingthe bottom deformation.
822 A. R. GUSMAN et al.: TSUNAMI SEDIMENT TRANSPORT SIMULATION
Fig. 4. Volume of erosion plotted against fault width that is used to generate the tsunami waveforms.
Fig. 5. Erosions and depositions on land simulated using the three topographic slopes and three tsunami waveforms with different wave periods.
4.3 Results4.3.1 The 2004 tsunami inundation and sediment
deposits simulations The simulated tsunami run-up of12 m is close to the measured run-up from the depositionlimit at elevation of 14 m. The observed tsunami inunda-tion at the study area is explained very well by the simu-lated tsunami inundation from the slip distribution (Fig. 8).We compare and analyze the simulated sediment depositsand measured sediment deposits thicknesses along the sur-veyed transect by Moore et al. (2006). Simulated sedimentdeposits distribution using sediment grain diameter of 0.8
mm is closer to the measured deposits distribution compareto that using the other grain diameters.
The simulated sediment deposits with grain diameter of0.8 mm are distributed from 100 to 400 m along the topo-graphic profile (Fig. 9). The simulation shows that there isno sediment deposited on the beach closer than about 80 mfrom the shoreline. The simulated sand deposits thicken infront and on the back of a dune formation at 160 m fromshoreline, which is consistent with the observation. Thesimulated sediment thickness from 300 to 350 m inlandis very close to the observation. However, there are some
A. R. GUSMAN et al.: TSUNAMI SEDIMENT TRANSPORT SIMULATION 823
Fig. 6. Volume of deposition simulated using different hypothetical geometries of sediment supply.
Fig. 7. The computation domains and the simple fault model for the southern portion of the 2004 earthquake.
disagreements between simulated sediment thicknesses andobservations. The simulated thickness on the back of thedune from 200 to 250 m inland is overestimated the ob-servation. Farther back before the hill from 350 to 400 minland, the simulated sediment thickness is underestimatedthe observation.
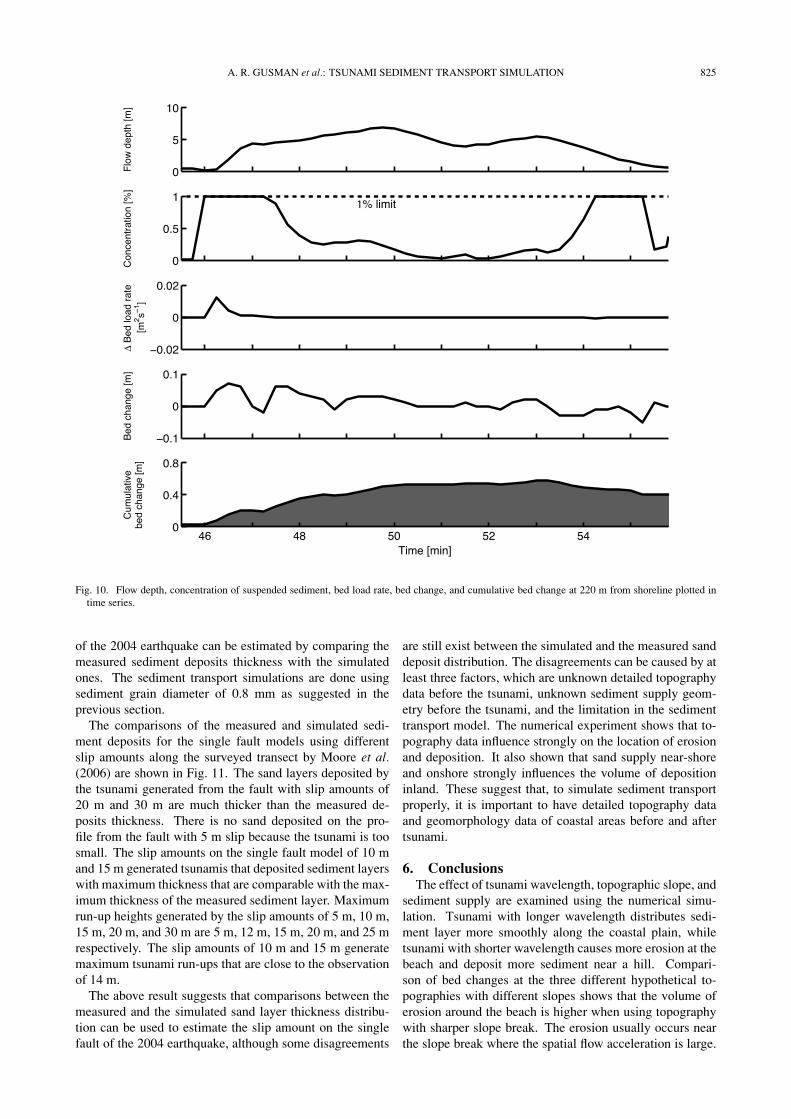
The sedimentation process at a modeling grid that is lo-cated 220 m inland is analyzed using time series plots offlow depth, concentration of suspended sediment, bed loadrate, bed change, and cumulative bed change (Fig. 10).The tsunami flow depth rapidly increases from 0 to 5 mwithin less than one minute (from about 46 to 47 min).The tsunami inundates with flow depth around 5 m from47 to 53 min, and then the tsunami flow depth gradually de-creases. When tsunami flow depths are relatively steady, thesediment settles to the bottom, consequently the concentra-
tion of suspended sediment decreases and the sediment onbed gradually thickens. During tsunami backwash, the de-posited sediment is eroded by the tsunami and as a result,the concentration of suspended sediment increases. Largebed load rate occur when the tsunami flow depth is rapidlychange. The simulation result shows that the deposited sandis transported by the tsunami in suspension.
5. DiscussionIn this study we demonstrate a way to estimate slip
amount on an assumed fault model of the 2004 earthquakeusing tsunami deposit data. A simple fault model of the2004 earthquake is assumed to be a shallow dipping thrustfault (strike = 340◦, dip = 10◦, rake = 90◦) with the shal-lowest part of the fault in contact with the ocean bottom.The fault length and width are 300 km and 150 km, respec-
824 A. R. GUSMAN et al.: TSUNAMI SEDIMENT TRANSPORT SIMULATION
Fig. 8. Simulated tsunami inundation area of the 2004 Indian Ocean tsunami in the study area. Black dashed-lines represent the observed limit ofinundation, blue area is the simulated inundation area, and the white line is the transect line by Moore et al. (2006).
Fig. 9. Simulated sediment and measured sediment thickness along transect measured by Moore et al. (2006). Dark gray area represents initial bedelevation that is an unmovable bed layer, light gray area represents the simulated sediment deposits, and circles represent the measured sedimentthickness.
tively (Fig. 7). The fault is located at the southern portionof the 2004 earthquake source area. The location and sizeof the fault is based on previous studies on source modelof the 2004 earthquake (e.g. Lay et al., 2005; Hirata et al.,2006; Tanioka and Iwasaki, 2006; Chlieh et al., 2007; Fujiiand Satake, 2007). The sediment transport simulations inthe study area using different fault lengths produce simi-lar results, using sediment deposits at only one location isnot enough to estimate a fault length. There is trade-off
between fault width and slip amount, but such analysis isbeyond the scope of this study.
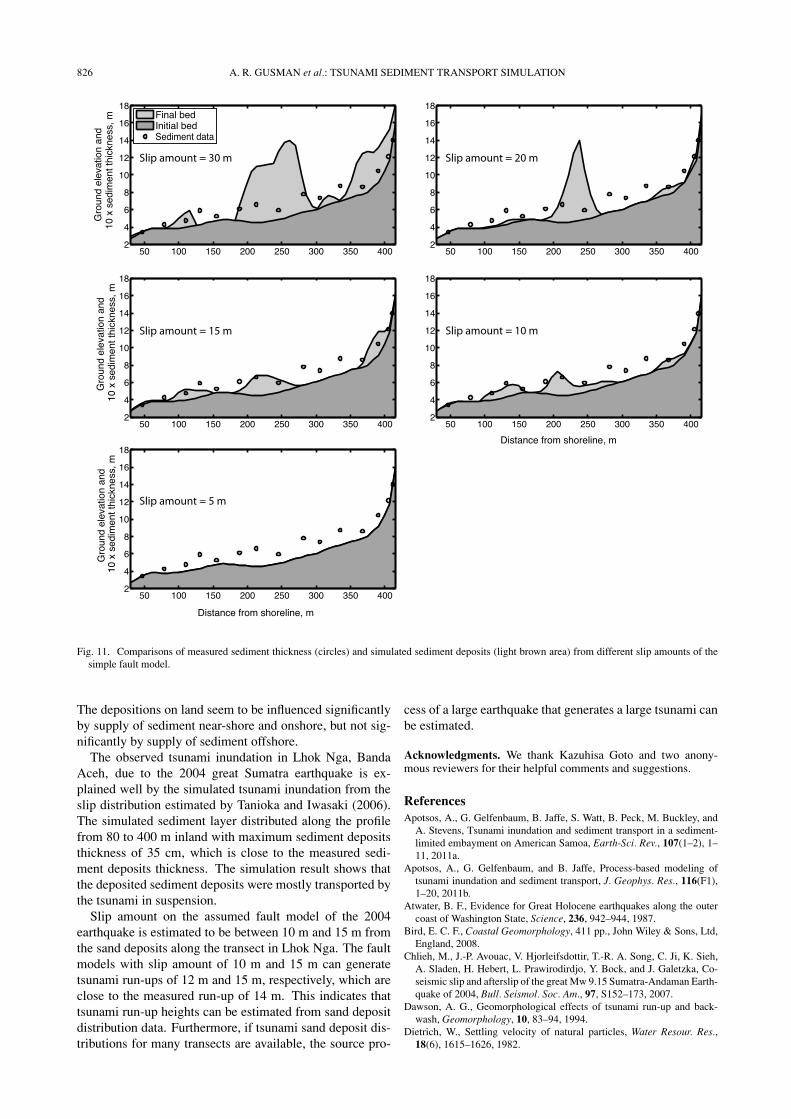
To estimate the slip amount on the simple fault modelby sediment transport simulations, we run simulations ofsediment transport using five slip amounts of 5 m, 10 m,15 m, 20 m, and 30 m. Then each of the simulated sedimentdeposits is compared with the measured sediment depositsthicknesses along the surveyed transect by Moore et al.(2006). A range of slip amount on the single fault model
A. R. GUSMAN et al.: TSUNAMI SEDIMENT TRANSPORT SIMULATION 825
Fig. 10. Flow depth, concentration of suspended sediment, bed load rate, bed change, and cumulative bed change at 220 m from shoreline plotted intime series.
of the 2004 earthquake can be estimated by comparing themeasured sediment deposits thickness with the simulatedones. The sediment transport simulations are done usingsediment grain diameter of 0.8 mm as suggested in theprevious section.
The comparisons of the measured and simulated sedi-ment deposits for the single fault models using differentslip amounts along the surveyed transect by Moore et al.(2006) are shown in Fig. 11. The sand layers deposited bythe tsunami generated from the fault with slip amounts of20 m and 30 m are much thicker than the measured de-posits thickness. There is no sand deposited on the pro-file from the fault with 5 m slip because the tsunami is toosmall. The slip amounts on the single fault model of 10 mand 15 m generated tsunamis that deposited sediment layerswith maximum thickness that are comparable with the max-imum thickness of the measured sediment layer. Maximumrun-up heights generated by the slip amounts of 5 m, 10 m,15 m, 20 m, and 30 m are 5 m, 12 m, 15 m, 20 m, and 25 mrespectively. The slip amounts of 10 m and 15 m generatemaximum tsunami run-ups that are close to the observationof 14 m.
The above result suggests that comparisons between themeasured and the simulated sand layer thickness distribu-tion can be used to estimate the slip amount on the singlefault of the 2004 earthquake, although some disagreements
are still exist between the simulated and the measured sanddeposit distribution. The disagreements can be caused by atleast three factors, which are unknown detailed topographydata before the tsunami, unknown sediment supply geom-etry before the tsunami, and the limitation in the sedimenttransport model. The numerical experiment shows that to-pography data influence strongly on the location of erosionand deposition. It also shown that sand supply near-shoreand onshore strongly influences the volume of depositioninland. These suggest that, to simulate sediment transportproperly, it is important to have detailed topography dataand geomorphology data of coastal areas before and aftertsunami.
6. ConclusionsThe effect of tsunami wavelength, topographic slope, and
sediment supply are examined using the numerical simu-lation. Tsunami with longer wavelength distributes sedi-ment layer more smoothly along the coastal plain, whiletsunami with shorter wavelength causes more erosion at thebeach and deposit more sediment near a hill. Compari-son of bed changes at the three different hypothetical to-pographies with different slopes shows that the volume oferosion around the beach is higher when using topographywith sharper slope break. The erosion usually occurs nearthe slope break where the spatial flow acceleration is large.
826 A. R. GUSMAN et al.: TSUNAMI SEDIMENT TRANSPORT SIMULATION
Fig. 11. Comparisons of measured sediment thickness (circles) and simulated sediment deposits (light brown area) from different slip amounts of thesimple fault model.
The depositions on land seem to be influenced significantlyby supply of sediment near-shore and onshore, but not sig-nificantly by supply of sediment offshore.
The observed tsunami inundation in Lhok Nga, BandaAceh, due to the 2004 great Sumatra earthquake is ex-plained well by the simulated tsunami inundation from theslip distribution estimated by Tanioka and Iwasaki (2006).The simulated sediment layer distributed along the profilefrom 80 to 400 m inland with maximum sediment depositsthickness of 35 cm, which is close to the measured sedi-ment deposits thickness. The simulation result shows thatthe deposited sediment deposits were mostly transported bythe tsunami in suspension.
Slip amount on the assumed fault model of the 2004earthquake is estimated to be between 10 m and 15 m fromthe sand deposits along the transect in Lhok Nga. The faultmodels with slip amount of 10 m and 15 m can generatetsunami run-ups of 12 m and 15 m, respectively, which areclose to the measured run-up of 14 m. This indicates thattsunami run-up heights can be estimated from sand depositdistribution data. Furthermore, if tsunami sand deposit dis-tributions for many transects are available, the source pro-
cess of a large earthquake that generates a large tsunami canbe estimated.
Acknowledgments. We thank Kazuhisa Goto and two anony-mous reviewers for their helpful comments and suggestions.
ReferencesApotsos, A., G. Gelfenbaum, B. Jaffe, S. Watt, B. Peck, M. Buckley, and
A. Stevens, Tsunami inundation and sediment transport in a sediment-limited embayment on American Samoa, Earth-Sci. Rev., 107(1–2), 1–11, 2011a.
Apotsos, A., G. Gelfenbaum, and B. Jaffe, Process-based modeling oftsunami inundation and sediment transport, J. Geophys. Res., 116(F1),1–20, 2011b.
Atwater, B. F., Evidence for Great Holocene earthquakes along the outercoast of Washington State, Science, 236, 942–944, 1987.
Bird, E. C. F., Coastal Geomorphology, 411 pp., John Wiley & Sons, Ltd,England, 2008.
Chlieh, M., J.-P. Avouac, V. Hjorleifsdottir, T.-R. A. Song, C. Ji, K. Sieh,A. Sladen, H. Hebert, L. Prawirodirdjo, Y. Bock, and J. Galetzka, Co-seismic slip and afterslip of the great Mw 9.15 Sumatra-Andaman Earth-quake of 2004, Bull. Seismol. Soc. Am., 97, S152–173, 2007.
Dawson, A. G., Geomorphological effects of tsunami run-up and back-wash, Geomorphology, 10, 83–94, 1994.
Dietrich, W., Settling velocity of natural particles, Water Resour. Res.,18(6), 1615–1626, 1982.
A. R. GUSMAN et al.: TSUNAMI SEDIMENT TRANSPORT SIMULATION 827
Fine, I. V., A. B. Rabinovich, and R. E. Thomson, The dual source regionfor the 2004 Sumatra tsunami, Geophys. Res. Lett., 32, L16602, 2005.
Fujii, N., M. Ikeno, T. Sakakiyama, M. Matsuyama, M. Takao, and T.Mukohara, Hydraulic experiment on flow and topography change inharbor due to tsunami and its numerical simulation, Ann. J. Coast. Eng.,JSCE, 56, 291–295, 2008 (in Japanese).
Fujii, Y. and K. Satake, Tsunami source of the 2004 Sumatra-Andamanearthquake inferred from tide gauge and satellite data, Bull. Seismol.Soc. Am., 97, S192–S207, 2007.
Gelfenbaum, G. and B. Jaffe, Erosion and sedimentation from the 17 July1998 Papua New Guinea tsunami, Pure Appl. Geophys., 160, 1969–1999, 2003.
Goto, C., Y. Ogawa, N. Shuto, and F. Imamura, Numerical methodof tsunami simulation with the leap-frog scheme, IUGG/IOC TIMEProject, IOC Manuals and Guides, UNESCO, 35, 1997.
Goto, K., C. C. Goff, S. Fujino, J. Goff, B. Jaffe, Y. Nishimura, B. Rich-mond, D. Suguwara, W. Szczucinski, D. R. Tappin, R. Witter, and E.Yulianto, New insights of tsunami hazard from the 2011 Tohoku-okievent, Mar. Geol., 2011 (submitted).
Hirata, K., K. Satake, Y. Tanioka, T. Kuragano, Y. Hasegawa, Y. Hayashi,and N. Hamada, The 2004 Indian Ocean tsunami: Tsunami sourcemodel from satellite altimetry, Earth Planets Space, 58, 195–201, 2006.
Imamura, F., Review of tsunami simulation with a finite difference method,in Long-Wave Runup Models, edited by H. Yeh, P. Liu, and C. Synolakis,403 pp., World Scientific, Singapore, 1996.
Jaffe, B. E. and G. Gelfenbaum, A simple model for calculating tsunamiflow speed from tsunami deposits, Sediment. Geol., 200, 347–361, 2007.
Jankaew, K., B. F. Atwater, Y. Sawai, M. Choowong, T. Charoentitirat, M.E. Martin, and A. Prendergast, Medieval forewarning of the 2004 IndianOcean tsunami in Thailand, Nature, 455, 1228–1231, 2008.
Jimenez, J. A. and O. S. Madsen, A simple formula to estimate settling ve-locity of natural sediments, J. Waterw. Port Coast. Ocean Eng., 129(2),70–78, 2003.
Kajiura, K., The leading wave of a tsunami, Bull. Earthq. Res. Inst., 41,535–571, 1963.
Kihara, N. and M. Matsuyama, Three-dimensional hydrostatic numericalsimulations on tsunami-induced sediment transport in a model harbor,Proceedings of the 3rd International Tsunami Field Symposium, 2010.
Lay, T., H. Kanamori, C. J. Ammon, M. Nettles, S. N. Ward, R. C. Aster,S. L. Beck, S. L. Bilek, M. R. Brudzinski, R. Butler, H. R. DeShon, G.Ekstrom, K. Satake, and S. Sipkin, The great Sumatra-Andaman earth-quake of 26 December 2004, Science, 308(5725), 1127–1133, 2005.
MacInnes, B. T., J. Bourgeois, T. K. Pinegina, and E. A. Kravchunovskaya,Tsunami geomorphology: Erosion and deposition from the 15 Novem-ber 2006 Kuril Island tsunami, Geology, 37, 995–998, 2009.
Minoura, K., F. Imamura, D. Sugawara, Y. Kono, and T. Iwashita, The 869Jogan tsunami deposit and recurrence interval of large-scale tsunami onthe Pacific coast of northeast Japan, J. Nat. Disaster Sci., 23(2), 83–88,2001.
Monecke, K., W. Finger, D. Klarer, W. Kongko, B. G. McAdoo, A. L.
Moore, and S. U. Sudrajat, A 1,000-year sediment record of tsunamirecurrence in northern Sumatra, Nature, 455, 1232–1234, 2008.
Moore, A., Y. Nishimura, G. Gelfenbaum, T. Kamataki, and R. Triyono,Sedimentary deposits of the 26 December 2004 tsunami on the north-west coast of Aceh, Indonesia, Earth Planets Space, 58, 253–258, 2006.
Namegaya, Y., K. Satake, and S. Yamaki, Numerical simulation of the AD896 Jogan tsunami in Ishinomaki and Sendai plains and Ukedo river-mouth lowland, Ann. Rep. Active Fault Paleoearthq. Res., 10, 1–21,2010 (in Japanese).
Nishihata, T., Y. Tajima, and Y. Moriya, Study on the dynamic topographychange due to tsunami attacks at kirinda port—the December 26, 2004earthquake tsunami of Indian Ocean, Ann. J. Coast. Eng., JSCE, 52,1386–1390, 2005 (in Japanese).
Nishimura, Y. and N. Miyaji, Tsunami deposits from the 1993 SouthwestHokkaido earthquake and the 1640 Hokkaido Komagatake eruption,Northern Japan, Pure Appl. Geophys., 144, 719–733, 1995.
Okada, Y., Surface deformation due to shear and tensile faults in half-space, Bull. Seismol. Soc. Am., 75(4), 1135–1154, 1985.
Paris, R., F. Lavigne, P. Wassmer, and J. Sartohadi, Coastal sedimentationassociated with the December 26, 2004 tsunami in Lhok Nga, westBanda Aceh (Sumatra, Indonesia), Mar. Geol., 238(1–4), 93–106, 2007.
Takahashi, T., N. Shuto, F. Imamura, and D. Asai, A movable bed modelfor tsunamis with exchange rate between bed load layer and suspendedlayer, Proc. Coatal Eng., JSCE, 46, 606–610, 1999 (in Japanese).
Takahashi, T., N. Shuto, F. Imamura, and D. Asai, Modeling sedimenttransport due to tsunamis with exchange rate between bed load layerand suspended load layer, Coast. Eng., 1508–1519, 2000.
Tanaka, H., Y. Yoshitake, and N. Shuto, Numerical simulation of bottomdeposit classification in wave and flow coexisting field, Proc. Coast.Eng., 36, 264–268, 1989 (in Japanese).
Tanioka, Y. and S. Iwasaki, Rupture processes of the 2004 Sumatra earth-quake estimated using the tsunami waveform inversion, Earth Monthly,56, 19–24, 2006.
Tanioka, Y., Y. Yudhicara, T. Kususose, S. Kathiroli, Y. Nishimura, S. I.Iwasaki, and K. Satake, Rupture process of the 2004 great Sumatra-Andaman earthquake estimated from tsunami waveforms, Earth PlanetsSpace, 58, 203–209, 2006.
Tsuji, Y., H. Matsutomi, Y. Tanioka, Y. Nishimura, T. Sakakiyama,T. Kamataki, Y. Murakami, A. Moore, and G. Gelfenbaum, Dis-tribution of the tsunami heights of the 2004 Sumatra tsunami inBanda Aceh measured by the tsunami survey team, http://www.eri.u-tokyo.ac.jp/namegaya/sumatera/surveylog/eindex.htm, 2005.
Watanabe, A., Y. Maruyama, T. Shimizu, and T. Sakakiyama, Numer-ical prediction model of three-dimensional beach transformation dueto installed structures, Proc. Conf. Coast. Eng., 31, 406–410, 1984 (inJapanese).
A. R. Gusman (e-mail: [email protected]), Y. Tanioka, andT. Takahashi