Embed Size (px)
Citation preview
44th AIAA Aerospace Sciences Meeting and Exhibit AIAA 2006-668 9 - 12 January 2006, Reno, Nevada
Numerical Evaluation of the Flowfield for a High Fineness Ratio Body with Drag Brakes
Russell M. Cummings,* James A. Divine, † Thomas R. Yechout,‡ and David C. Wetlesen§
United States Air Force Academy, USAF Academy, CO, 80840
Joseph J. Kealos**
Textron Systems Corporation, Wilmington, MA, 01887
The Advanced Remote Ground Unattended Sensor (ARGUS) utilizes drag brakes to control its terminal velocity during flight. Computational fluid dynamics predictions were performed at Mach numbers between 0.20 and 0.95 with a full scale model of the ARGUS configuration at conditions to match wind tunnel testing that has been performed at the USAFA Subsonic Wind Tunnel. Configurations consist of brakes fully deployed for a nominal brake fin and a perforated brake fin. Steady-stated computations were performed using the Spalart-Allmaras turbulence model at angles of attack between 0 degrees to 20 degrees at roll angles of 0 degrees and 45 degrees. Unsteady calculations were performed for selected cases using Detached-Eddy Simulation. Predictions are compared with available wind tunnel data from the USAFA test, and aerodynamic peculiarities are investigated with flow visualization.
I. Introduction
THE design evolution of a high fineness ratio body with drag brakes is presented, focusing on the computational modeling that directly contributed to definition of the final design configuration. A parallel experimental effort
was accomplished which nicely complimented the computational program and which is the subject of a separate paper.1 The flight vehicle described in this paper was called the Advanced Remote Ground Unattended Sensor, or ARGUS, and was intended to be deployed from an aircraft, conduct free flight where it would transition from approximately a level attitude to a vertical attitude, and then impact the ground. The United States Air Force Academy provided critical aerodynamic support for the design and development of this vehicle through wind tunnel research. Initial flight tests had shown that the ARGUS predecessor (the Steel Eagle II) lacked sufficient aerodynamic stability to impact the ground in a near-vertical attitude due to a steady-state roll/yaw oscillation referred to as “coning.” Wind-tunnel and CFD evaluations were used to understand/correct this problem and to contribute to evolution and definition of the ARGUS design.
During this initial effort, four problems were identified. First, the lift characteristics of the ARGUS were found to, upon release, potentially cause the ARGUS to rise back toward the carrier aircraft and create a hazard. Second, yawing moment excursions were identified that would perturb the ARGUS from a trimmed condition, and third, after such a perturbation, the stabilizing pitching moment of the ARGUS was found to be very limited in restoring the trimmed condition. Finally, the terminal velocity of the initial ARGUS design was found to be approximately 15% lower than the desired terminal velocity of 265 ft/sec. The yaw and pitching moment characteristics were identified as the probable cause of the coning experienced during the preliminary flight tests. To correct the coning problem, a perforated drag brake design (as an alternative to the initial solid drag brake design) was suggested to reduce asymmetric vortex shedding that was predicted to be occurring behind the solid drag brakes of the initial ARGUS design. The perforated drag brake design was found to significantly improve the performance of ARGUS and have a positive effect on the four problems identified, giving the ARGUS desirable aerodynamic characteristics. A new investigation was then performed in an attempt to optimize the perforation pattern on the drag brakes. Five perforation patterns were evaluated, including the “baseline” pattern from the initial testing. This testing led to selection of the baseline pattern for the final design. Results from flight test confirmed that this design mitigated the
* Professor, Department of Aeronautics, AIAA Associate Fellow. † Cadet First Class, Department of Aeronautics. ‡ Professor, Department of Aeronautics, AIAA Associate Fellow. § Assistant Professor, Department of Aeronautics, AIAA Member. ** Senior Aerodynamicist, Advanced Missile Systems Department, AIAA Member.
1 American Institute of Aeronautics and Astronautics
This material is declared a work of the U.S. Government and is not subject to copyright protection in the United States.
coning effect that was previously seen and would result in satisfactory ARGUS performance. During this effort, the ARGUS increased in size, so the drag data from previous testing was used to correctly size the drag brakes so that a desired terminal velocity of approximately 265 ft/sec could be achieved. A final wind tunnel investigation was conducted to establish baseline aerodynamic data for the final ARGUS design and to investigate the aerodynamic effects of the addition of a release lanyard system to the ARGUS. The lanyard system was not found to diminish the aerodynamic characteristics of the ARGUS, and the final ARGUS design was found to have aerodynamic characteristics suitable for its mission. The overall ARGUS design effort through all phases of testing was led by Textron, Inc. under contract to the Air Force Electronic Systems Center at Hanscom AFB. This paper presents the 18-month ARGUS design evolution from an aerodynamic view and the crucial data and analysis that led to definition of the final successful design.
II. Wind Tunnel Test Conditions and CFD Simulation
A. Wind tunnel conditions
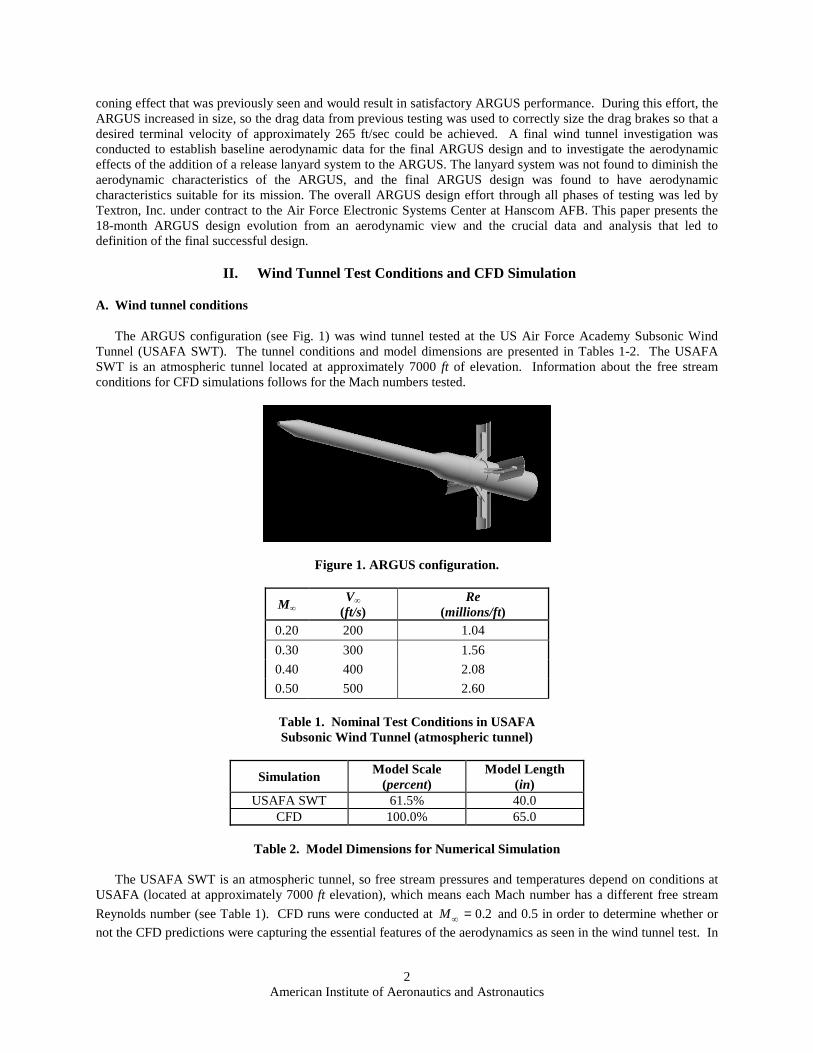
The ARGUS configuration (see Fig. 1) was wind tunnel tested at the US Air Force Academy Subsonic Wind Tunnel (USAFA SWT). The tunnel conditions and model dimensions are presented in Tables 1-2. The USAFA SWT is an atmospheric tunnel located at approximately 7000 ft of elevation. Information about the free stream conditions for CFD simulations follows for the Mach numbers tested.
Figure 1. ARGUS configuration.
M∞ V∞
(ft/s) Re
(millions/ft) 0.20 200 1.04
0.30 300 1.56
0.40 400 2.08
0.50 500 2.60
Table 1. Nominal Test Conditions in USAFA Subsonic Wind Tunnel (atmospheric tunnel)
Simulation Model Scale
(percent) Model Length
(in) USAFA SWT 61.5% 40.0
CFD 100.0% 65.0
Table 2. Model Dimensions for Numerical Simulation
The USAFA SWT is an atmospheric tunnel, so free stream pressures and temperatures depend on conditions at USAFA (located at approximately 7000 ft elevation), which means each Mach number has a different free stream
Reynolds number (see Table 1). CFD runs were conducted at M∞ = 0.2 and 0.5 in order to determine whether or
not the CFD predictions were capturing the essential features of the aerodynamics as seen in the wind tunnel test. In
2 American Institute of Aeronautics and Astronautics
addition, simulations were performed at M∞ = 0.6.,0.8,0.95 to determine the transonic behavior of the drag brakes.
The USAFA model was 40.0 in long (see Table 2), which means the length-based Reynolds number for the model is:
6 6For M∞ = 0.2 : Re = (1.04 ×10 / ft )(40.0in )/(12 in / ft ) = 3.468 ×10 l
6 6For M ∞ = 0.5 : Re = (2.60 ×10 / ft )(40.0in )/(12 in / ft ) = 8.667 ×10 l
In order to obtain the same length-based Reynolds number for the CFD full-scale model, the CFD simulation was run with the conditions shown in Table 3, where the free stream pressure was set to a 7000 ft standard-day value (10.92 lb/in2), and the temperature was modified in order to achieve the correct Reynolds number. Specifically, the free stream Reynolds number used in the CFD calculations is:
6 4For M∞ = 0.2 : Re/ in = 3.468 ×10 / 65.0in = 5.335 ×10 / in 6 5For M ∞ = 0.5 : Re/ in = 8.667 ×10 / 65.0in = 1.333 ×10 / in
Drag Brakes Φ (deg) M∞ Rel α schedule DES Baseline 0 0.20 3.468 × 10⁶ A1 α = 0°
Baseline 0 0.50 8.680 × 10⁶ A1 α = 0°
Baseline 45 0.20 3.468 × 10⁶ A2
Baseline 45 0.50 8.680 × 10⁶ A2
Perforated 0 0.2 3.468 × 10⁶ A1
Perforated 0 0.5 8.680 × 10⁶ A1 α = 0°
Table 3. CFD Prediction Matrix A1: α = 0, 1, 2, 4, 6, 8, 10, 12, 16, 20 deg
A2: α = 0, 1, 2, 4, 8, 12, 16, 20 deg
B. CFD Simulation
Flow Solver Solutions for all configurations were computed with the commercial version of Cobalt developed by Cobalt Solutions, LLC. Cobalt solves the unsteady, three-dimensional, compressible Navier-Stokes equations on a hybrid unstructured grid. Full details of the computational scheme are presented in Ref. 2. The code has several choices of turbulence models, including Spalart Almaras (SA), and Menter’s Shear Stress Transport (SST) RANS, as well as DES versions of SA and SST. All simulations were computed on unstructured meshes with prisms in the boundary layer and tetrahedra elsewhere. The computational meshes were generated with the software packages GridTool3 and VGRIDns.4
Spalart-Allmaras Turbulence Model The Spalart-Allmaras5 one equation model (SA) solves a single partial ~ differential equation for a working variable ν which is related to the turbulent viscosity. The differential equation is
derived by “using empiricism and arguments of dimensional analysis, Galilean invariance and selected dependence on the molecular viscosity.”5 The model includes a wall destruction term that reduces the turbulent viscosity in the laminar sublayer. The model takes the form,
~ ~ Dν ~ ⎡ν ⎤2
~ = c Sν − c fb1 w1 wDt ⎢⎣ d ⎥⎦
1 2~ ~ ~ + [∇ ⋅ ((ν +ν )∇ν ) + c (∇ν ) ]σ
b2
The turbulent kinematic viscosity is obtained from, ~ µt ~ χ 3 ν
ν = = ν f ; f = ; χ = t v1 v1 3 3ρ χ + cv1 ν
where S is the magnitude of the vorticity given by
3 American Institute of Aeronautics and Astronautics
ˆ ˆ ˆS = ω = ∇ × (ui + vj + wk ) and the modified vorticity is,
~ ~ ν χ S = S + f ; f = 1 −2 2 v2 v2κ d 1 + χfv1
where d is the distance to the closest wall. The wall destruction function f is, w
1
6⎡ 1 + cw 6
3 ⎤ f = gw ⎢ 6 6 ⎥g + c⎣ w3 ⎦ and
~ g = r + c (r 6 − r) ; r ≡
ν w2 ~ 2 2Sκ d
The turbulent viscosity is obtained from the turbulent kinematic viscosity by µ = ρν . The model coefficients are t t
given in Table 4.
0.1355 1 =cb 0.622 2 =cb 7.11 = vc
= 0.41 κ = 2 / 3σ
( ) σ
κ
/1
/
2
2 11
b
bw
c
cc
++
= 0.32 = wc 23 = wc
Table 4. Spalart-Allmaras turbulence model coefficients.
Detached-Eddy Simulation The Detached-Eddy Simulation method was proposed by Spalart et al.6 and was originally based on the Spalart-Allmaras one equation RANS turbulence model (detailed above). The wall
destruction term presented above is proportional to (ν~ / d )2 , where d is the distance to the wall. When this term is
2balanced with the production term, the eddy viscosity becomes proportional to Sd , where S is the local strain rate. The Smagorinski LES model varies its sub-grid scale (SGS) turbulent viscosity with the local strain rate, and the
ˆΔ2grid spacing: ν ∝ S , where Δ = max (Δx, Δy, Δz) . If d is replaced with Δ in the wall destruction term, the SA SGS
model will act as a Smagorinski LES model. To exhibit both RANS and LES behavior, d in the SA model is replaced by
~ d = min (d , cDES Δ)
When d << Δ , the model acts in a RANS mode and when d >> Δ the model acts in a Smagorinski LES mode. Therefore the model switches into LES mode when the grid is locally refined.
DES was implemented in an unstructured grid method by Forsythe et al7 They determined that the DES
constant should be = 0.65 , consistent with the structured grid implementation of Spalart et al.5 when the grid cDES
spacing, Δ , was taken to be the longest distance between the cell center and all of the neighboring cell centers. A Newton sub-iteration method is used in the solution of the system of equations to improve time accuracy of
the point implicit method and approximate Jacobians. In the calculations presented below, a typical number of three Newton sub-iterations is used for all time-accurate cases.
Grid Generation Spalart described the process of grid design and assessment for DES,8 defining important regions of the solution and offering guidelines for grid densities within each region. The “Young-Person’s Guide” (YPG)8
forms a basis for interpretation of many of the results presented below. One of the traditional motivations for using unstructured grids has been the ability to rapidly create grids around complex geometries. There are other positive
4 American Institute of Aeronautics and Astronautics
attributes of unstructured grids that are relevant to DES. Most notably, it is possible to concentrate points in the region of interest (i.e. the vortex core or aft of breakdown) and rapidly coarsen the grid away from these areas. This region of interest was termed the “focus region” in the YPG.
Another advantage exploited in the present study is the isotropic cells generated in the LES region by most unstructured grid generation packages. The YPG reference describes the desirability of having nearly isotropic grid cells in the focus region in which unsteady, time-dependent, features are resolved. For this reason, unstructured grids are good candidates for use in DES because near isotropy of the grid cells in the LES region is assured by most grid generation packages.
Morton et al.9 applied the YPG guidelines to three massively separated flows of interest: forebody in a cross-flow, flow over a delta wing at 27o angle of attack, and the flow over an F-15E at 65o angle of attack. In the latter two cases an extensive grid sensitivity study was performed by systematically varying the grid by a scale parameter allowing a very consistent analysis of grid effects when using the DES method of computing massively separated flows. DES of the F-15E provided an impressive drag coefficient match of 5% to the Boeing flight test data at 65o
angle of attack. A more detailed look at the simulations can be found in Ref. 10.
III. Results and Discussion Results are presented below for the ARGUS configuration with the baseline drag brakes (see Fig. 1), as well as
with perforated drag brakes. The perforations were found to aid greatly in the reduction of coning and the improvement in overall vehicle performance (see Ref. 1 for details). A number of aerodynamic issues are resolved through the use of the CFD simulations, as will be discussed in this section.
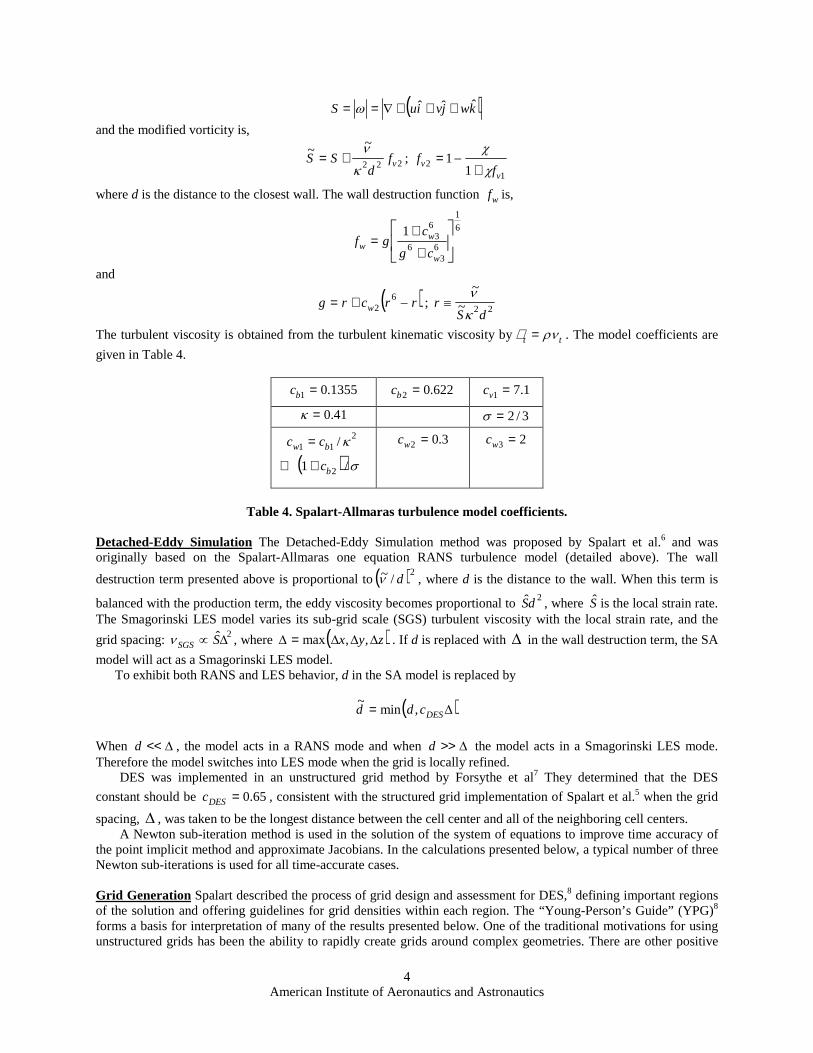
A. Baseline Drag Brake Results Figure 2 shows representatives comparisons of CFD predictions with wind tunnel data for M = 0.5. While there
is an offset in the normal force and lift coefficients (a symmetric configuration should have zero lift and moment at oα = 0 , so the wind tunnel data offset is probably due to some sort of model or flow misalignment), the trends
match very well. The pitching moment coefficient and axial/drag force coefficients are also within expected levels of accuracy for such a comparison, although the inability of the CFD to predict the neutral stability region in Fig. 2b is troubling. The zero-lift drag coefficient prediction (Fig. 2c) is within 5% of the experimental data, certainly within engineering accuracy levels and good enough to be used for comparisons between configurations for design purposes.
-5 0 5 10 15 20-2
CN Numerical CL Numerical CN USAFA Wind Tunnel CL USAFA Wind Tunnel
ARGUS Aerodynamics Baseline Terra Brakes
M = 0.5, φ = 0
Pitc
h M
omen
t Co
effic
ient
, Cm
-35
-30
-25
-20
-15
-10
-5
0
5
10
Cm Numerical Cm USAFA Wind Tunnel
ARGUS Aerodynamics Baseline Terra Brakes
M = 0.5, φ = 0
6
5
4
3
2
1
0
-1
For
ce C
oeff
icie
nt
-5 0 5 10 15 20 Angle of Attack, α (deg.) Angle of Attack, α (deg.)
a) Lift and Normal Force Coefficients b) Pitch Moment Coefficient
5 American Institute of Aeronautics and Astronautics
22 ARGUS Aerodynamics Baseline Terra Brakes
M = 0.5, φ = 021
20
19
18
17
16
15
CA Numerical 14 CD Numerical
CA USAFA Wind Tunnel 13 CD USAFA Wind Tunnel
12 -5 0 5 10 15 20
Angle of Attack, α (deg.)
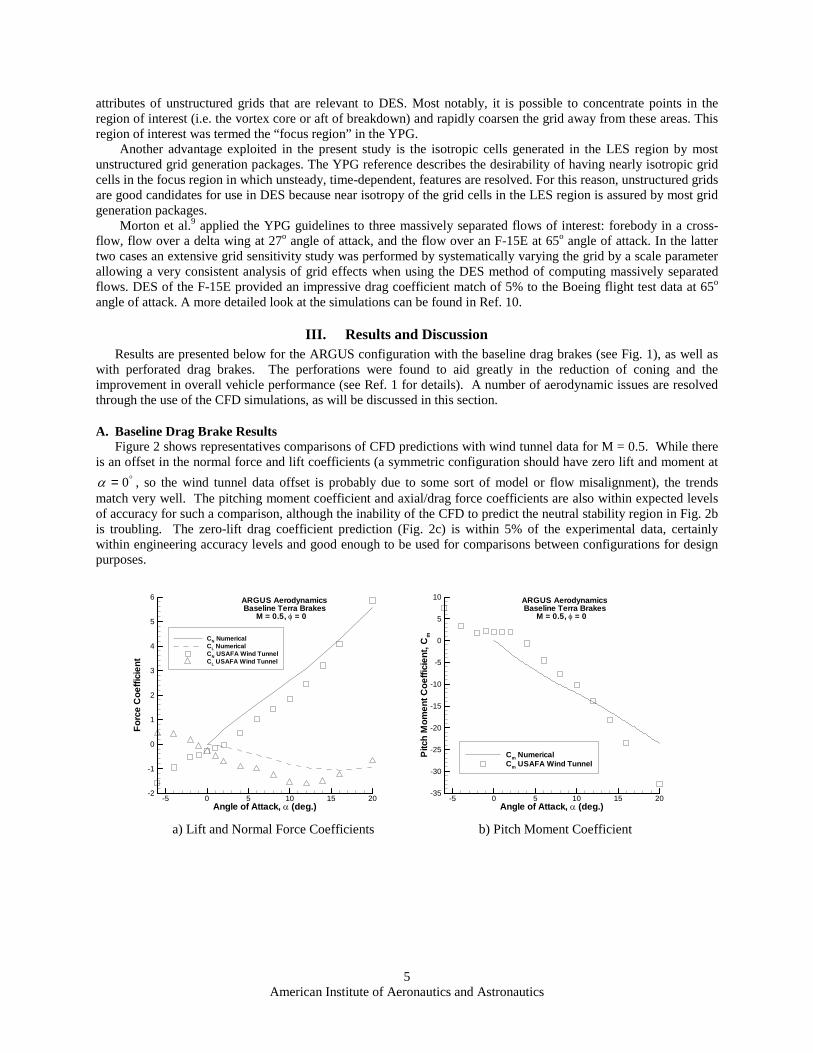
c) Drag and Axial Force Coefficient Figure 2. Baseline Drag Brake Results for M = 0.5, φ = 0
For
ce C
oeff
icie
nt
.
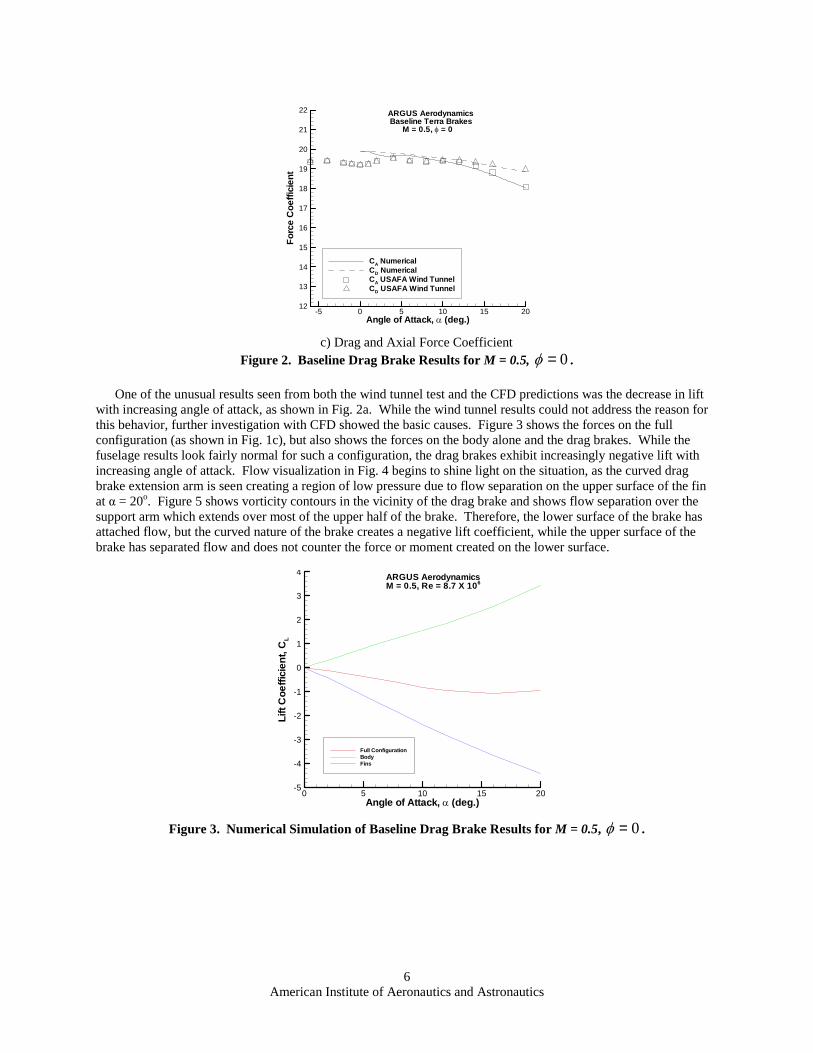
One of the unusual results seen from both the wind tunnel test and the CFD predictions was the decrease in lift with increasing angle of attack, as shown in Fig. 2a. While the wind tunnel results could not address the reason for this behavior, further investigation with CFD showed the basic causes. Figure 3 shows the forces on the full configuration (as shown in Fig. 1c), but also shows the forces on the body alone and the drag brakes. While the fuselage results look fairly normal for such a configuration, the drag brakes exhibit increasingly negative lift with increasing angle of attack. Flow visualization in Fig. 4 begins to shine light on the situation, as the curved drag brake extension arm is seen creating a region of low pressure due to flow separation on the upper surface of the fin at α = 20o. Figure 5 shows vorticity contours in the vicinity of the drag brake and shows flow separation over the support arm which extends over most of the upper half of the brake. Therefore, the lower surface of the brake has attached flow, but the curved nature of the brake creates a negative lift coefficient, while the upper surface of the brake has separated flow and does not counter the force or moment created on the lower surface.
Lift
Coe
ffic
ien
t, C
L
-5
-4
-3
-2
-1
0
1
2
3
4
Full Configuration Body Fins
ARGUS Aerodynamics M = 0.5, Re = 8.7 X 10⁶
0 5 10 15 20 Angle of Attack, α (deg.)
Figure 3. Numerical Simulation of Baseline Drag Brake Results for M = 0.5, φ = 0 .
6 American Institute of Aeronautics and Astronautics
a) α = 0 degrees b) α = 20 degrees Figure 4. Pressures on Drag Brakes for M = 0.5, φ = 0 .
∞V
∞V
a. α = 0 degrees b. α = 20 degrees Figure 5. Vorticity Contours on Drag Brakes for M = 0.5, φ = 0 .
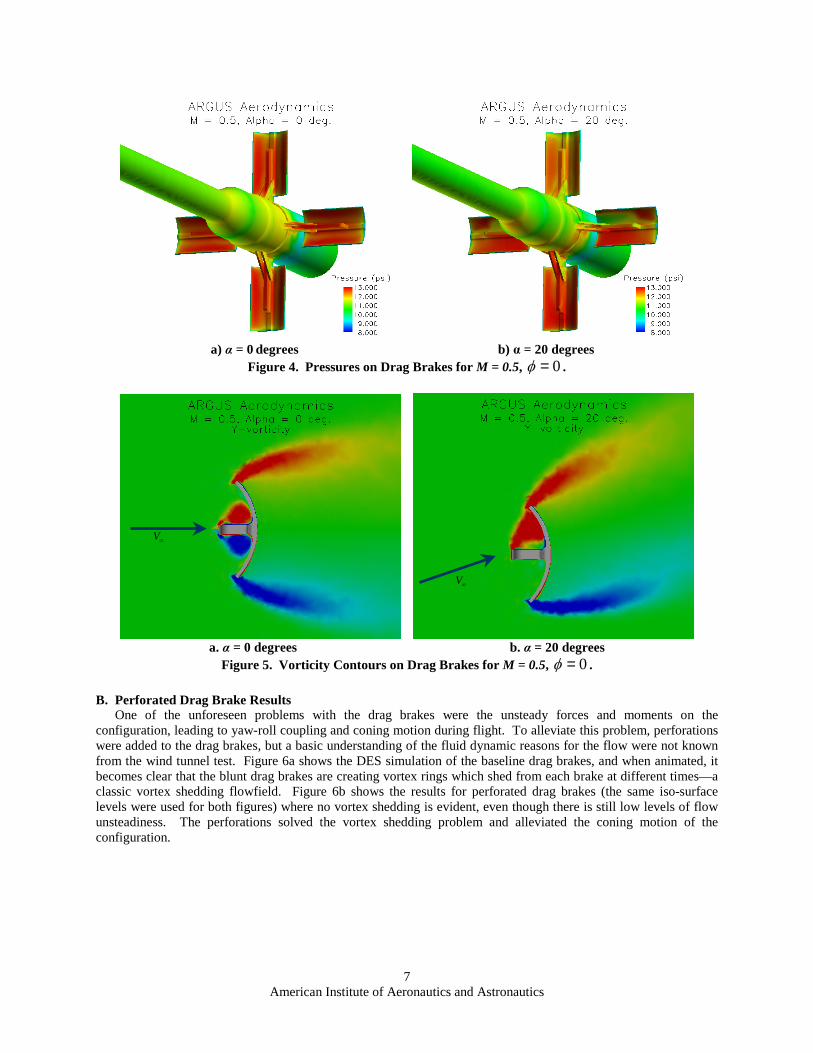
B. Perforated Drag Brake Results One of the unforeseen problems with the drag brakes were the unsteady forces and moments on the
configuration, leading to yaw-roll coupling and coning motion during flight. To alleviate this problem, perforations were added to the drag brakes, but a basic understanding of the fluid dynamic reasons for the flow were not known from the wind tunnel test. Figure 6a shows the DES simulation of the baseline drag brakes, and when animated, it becomes clear that the blunt drag brakes are creating vortex rings which shed from each brake at different times—a classic vortex shedding flowfield. Figure 6b shows the results for perforated drag brakes (the same iso-surface levels were used for both figures) where no vortex shedding is evident, even though there is still low levels of flow unsteadiness. The perforations solved the vortex shedding problem and alleviated the coning motion of the configuration.
7 American Institute of Aeronautics and Astronautics
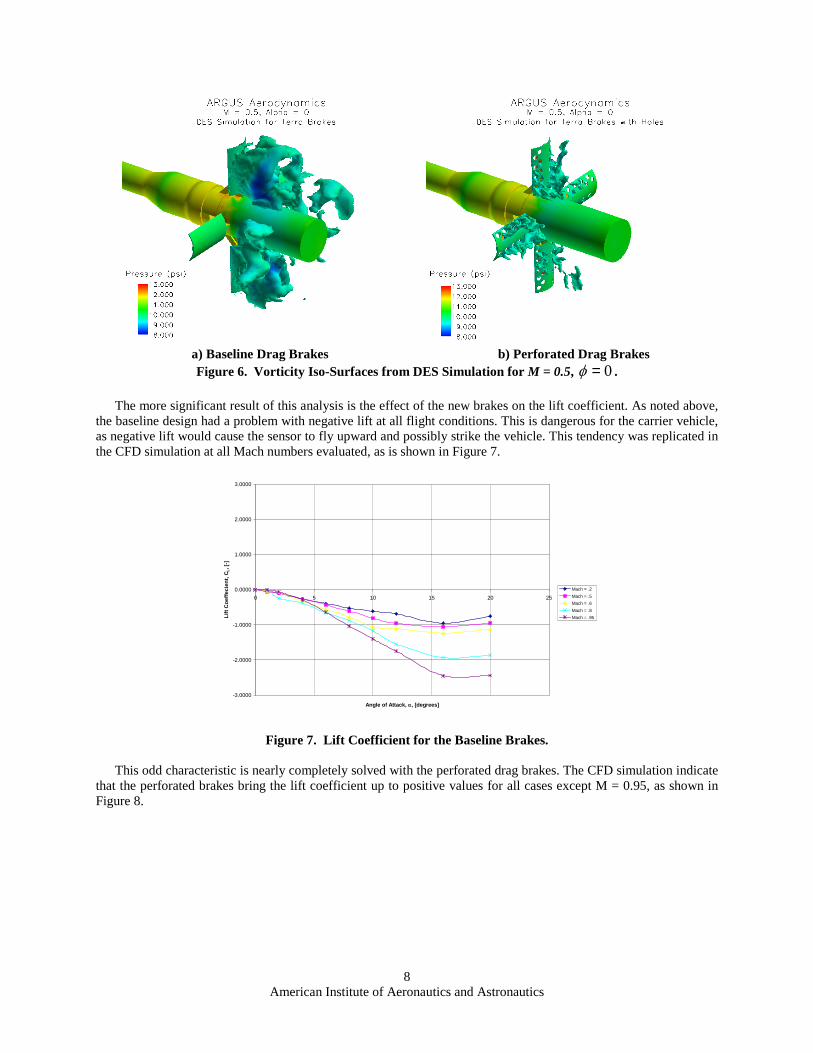
a) Baseline Drag Brakes b) Perforated Drag Brakes Figure 6. Vorticity Iso-Surfaces from DES Simulation for M = 0.5, φ = 0 .
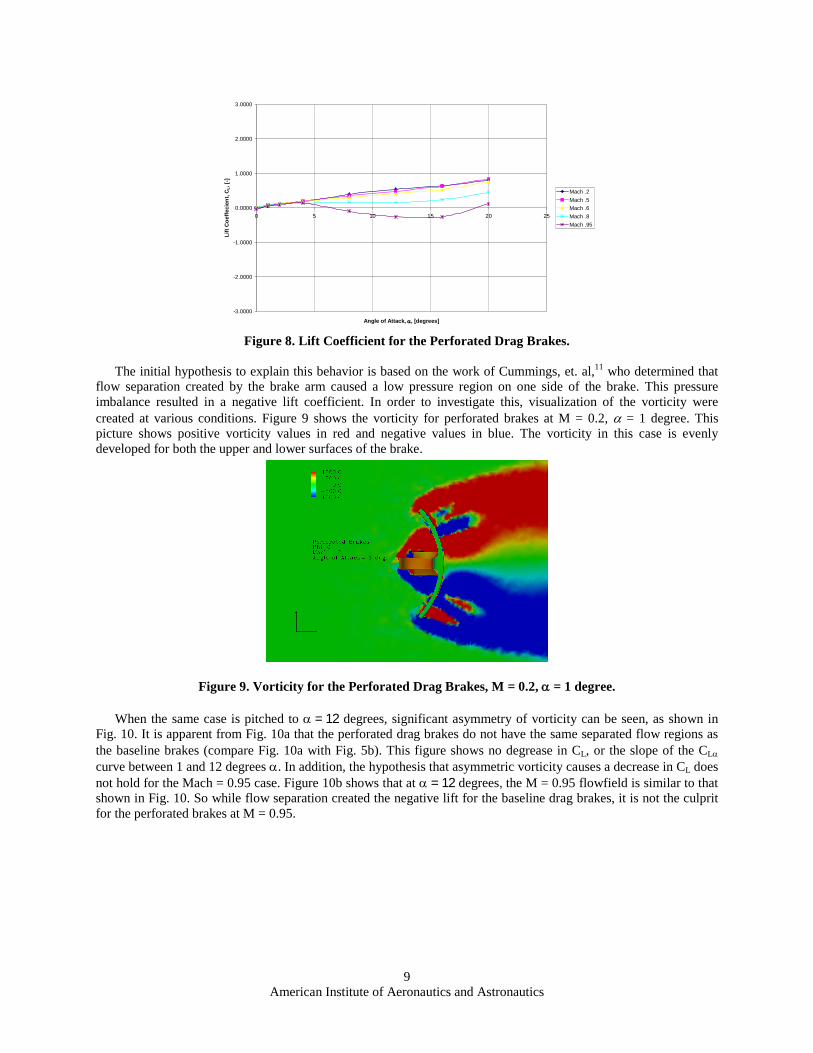
The more significant result of this analysis is the effect of the new brakes on the lift coefficient. As noted above, the baseline design had a problem with negative lift at all flight conditions. This is dangerous for the carrier vehicle, as negative lift would cause the sensor to fly upward and possibly strike the vehicle. This tendency was replicated in the CFD simulation at all Mach numbers evaluated, as is shown in Figure 7.
3.0000
2.0000
1.0000
0.0000 Mach = .2
Mach = .5
Mach = .6
Mach = .8
Mach = .95
-1.0000
-2.0000
-3.0000
0 5 10 15 20 25
Angle of Attack, α, [degrees]
Figure 7. Lift Coefficient for the Baseline Brakes.
This odd characteristic is nearly completely solved with the perforated drag brakes. The CFD simulation indicate that the perforated brakes bring the lift coefficient up to positive values for all cases except M = 0.95, as shown in Figure 8.
Lif
t C
oef
feci
ent,
CL, [
-]
8 American Institute of Aeronautics and Astronautics
Lif
t C
oef
feci
ent,
CL, [
-]
3.0000
2.0000
1.0000
0.0000
Mach .2
Mach .5
Mach .6
Mach .8
Mach .95
-1.0000
-2.0000
-3.0000
0 5 10 15 20 25
Angle of Attack, α, [degrees]
Figure 8. Lift Coefficient for the Perforated Drag Brakes.
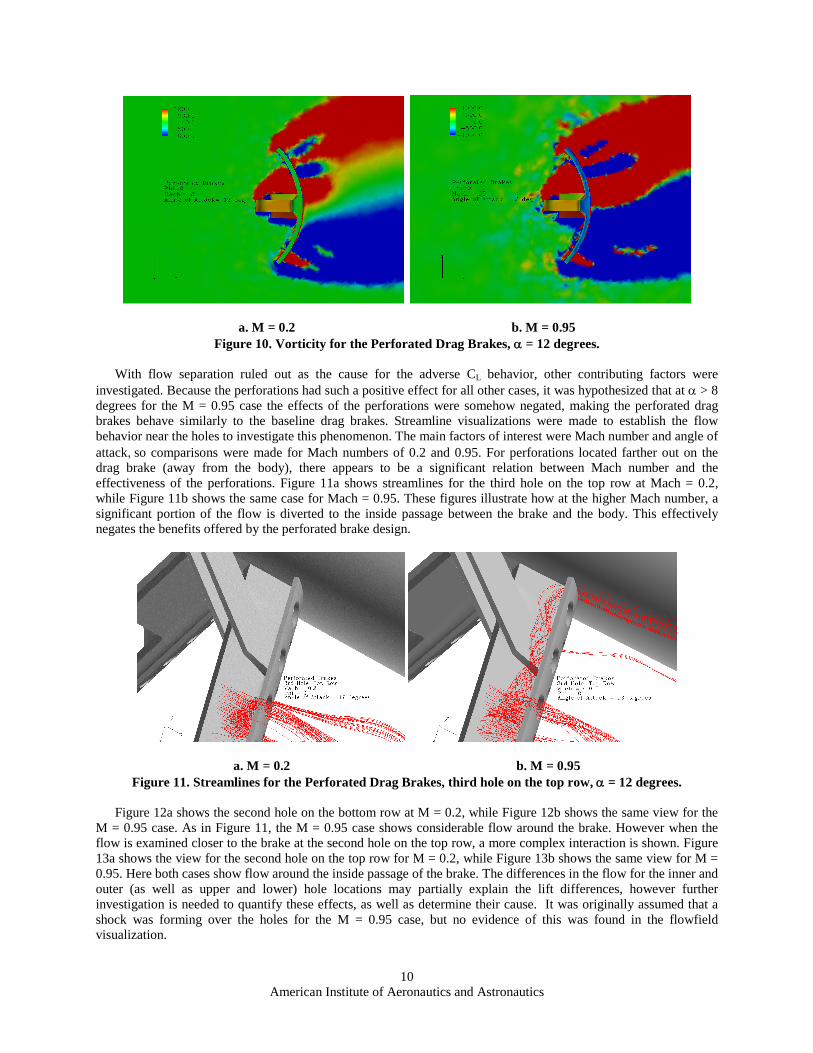
The initial hypothesis to explain this behavior is based on the work of Cummings, et. al,11 who determined that flow separation created by the brake arm caused a low pressure region on one side of the brake. This pressure imbalance resulted in a negative lift coefficient. In order to investigate this, visualization of the vorticity were created at various conditions. Figure 9 shows the vorticity for perforated brakes at M = 0.2, α = 1 degree. This picture shows positive vorticity values in red and negative values in blue. The vorticity in this case is evenly developed for both the upper and lower surfaces of the brake.
Figure 9. Vorticity for the Perforated Drag Brakes, M = 0.2, α = 1 degree.
When the same case is pitched to α = 12 degrees, significant asymmetry of vorticity can be seen, as shown in Fig. 10. It is apparent from Fig. 10a that the perforated drag brakes do not have the same separated flow regions as the baseline brakes (compare Fig. 10a with Fig. 5b). This figure shows no degrease in CL, or the slope of the CLα
curve between 1 and 12 degrees α. In addition, the hypothesis that asymmetric vorticity causes a decrease in CL does not hold for the Mach = 0.95 case. Figure 10b shows that at α = 12 degrees, the M = 0.95 flowfield is similar to that shown in Fig. 10. So while flow separation created the negative lift for the baseline drag brakes, it is not the culprit for the perforated brakes at M = 0.95.
9 American Institute of Aeronautics and Astronautics
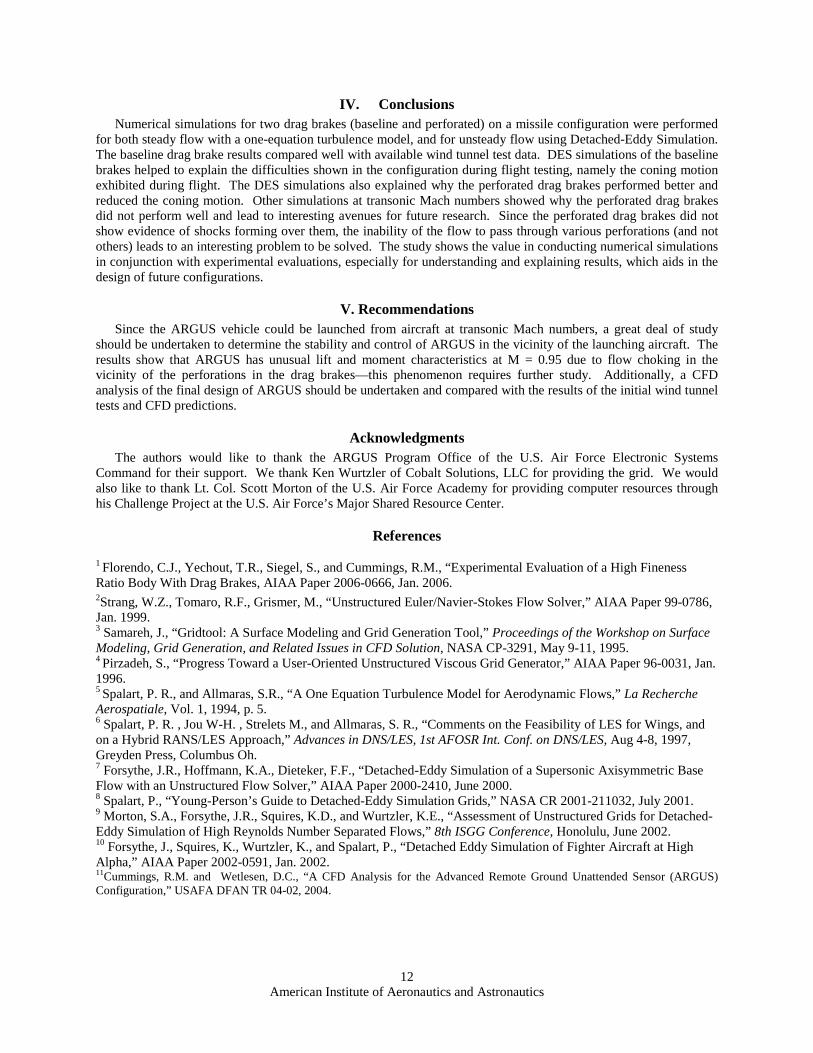
a. M = 0.2 b. M = 0.95 Figure 10. Vorticity for the Perforated Drag Brakes, α = 12 degrees.
With flow separation ruled out as the cause for the adverse CL behavior, other contributing factors were investigated. Because the perforations had such a positive effect for all other cases, it was hypothesized that at α > 8 degrees for the M = 0.95 case the effects of the perforations were somehow negated, making the perforated drag brakes behave similarly to the baseline drag brakes. Streamline visualizations were made to establish the flow behavior near the holes to investigate this phenomenon. The main factors of interest were Mach number and angle of attack, so comparisons were made for Mach numbers of 0.2 and 0.95. For perforations located farther out on the drag brake (away from the body), there appears to be a significant relation between Mach number and the effectiveness of the perforations. Figure 11a shows streamlines for the third hole on the top row at Mach = 0.2, while Figure 11b shows the same case for Mach = 0.95. These figures illustrate how at the higher Mach number, a significant portion of the flow is diverted to the inside passage between the brake and the body. This effectively negates the benefits offered by the perforated brake design.
a. M = 0.2 b. M = 0.95 Figure 11. Streamlines for the Perforated Drag Brakes, third hole on the top row, α = 12 degrees.
Figure 12a shows the second hole on the bottom row at M = 0.2, while Figure 12b shows the same view for the M = 0.95 case. As in Figure 11, the M = 0.95 case shows considerable flow around the brake. However when the flow is examined closer to the brake at the second hole on the top row, a more complex interaction is shown. Figure 13a shows the view for the second hole on the top row for M = 0.2, while Figure 13b shows the same view for M = 0.95. Here both cases show flow around the inside passage of the brake. The differences in the flow for the inner and outer (as well as upper and lower) hole locations may partially explain the lift differences, however further investigation is needed to quantify these effects, as well as determine their cause. It was originally assumed that a shock was forming over the holes for the M = 0.95 case, but no evidence of this was found in the flowfield visualization.
10 American Institute of Aeronautics and Astronautics

a. M = 0.2 b. M = 0.95 Figure 12. Streamlines for the Perforated Drag Brakes, second hole on the top row, α = 12 degrees.
a. M = 0.2 b. M = 0.95 Figure 13. Streamlines for the Perforated Drag Brakes, second hole on the bottom row, α = 12 degrees.
Another possibility is that the flow is being partially choked due to compressibility at the higher Mach numbers, causing some holes to have little or no flow through them, and making the drag brake behave similarly to the baseline drag brake. Figure 14 shows Mach contours in the vicinity of the holes (viewed from the rear), which suggests that the holes are choked with supersonic acceleration taking place behind the perforations.
Figure 14. Mach contours behind the perforations, α = 12 degrees.
11 American Institute of Aeronautics and Astronautics
IV. Conclusions Numerical simulations for two drag brakes (baseline and perforated) on a missile configuration were performed
for both steady flow with a one-equation turbulence model, and for unsteady flow using Detached-Eddy Simulation. The baseline drag brake results compared well with available wind tunnel test data. DES simulations of the baseline brakes helped to explain the difficulties shown in the configuration during flight testing, namely the coning motion exhibited during flight. The DES simulations also explained why the perforated drag brakes performed better and reduced the coning motion. Other simulations at transonic Mach numbers showed why the perforated drag brakes did not perform well and lead to interesting avenues for future research. Since the perforated drag brakes did not show evidence of shocks forming over them, the inability of the flow to pass through various perforations (and not others) leads to an interesting problem to be solved. The study shows the value in conducting numerical simulations in conjunction with experimental evaluations, especially for understanding and explaining results, which aids in the design of future configurations.
V. Recommendations Since the ARGUS vehicle could be launched from aircraft at transonic Mach numbers, a great deal of study
should be undertaken to determine the stability and control of ARGUS in the vicinity of the launching aircraft. The results show that ARGUS has unusual lift and moment characteristics at M = 0.95 due to flow choking in the vicinity of the perforations in the drag brakes—this phenomenon requires further study. Additionally, a CFD analysis of the final design of ARGUS should be undertaken and compared with the results of the initial wind tunnel tests and CFD predictions.
Acknowledgments The authors would like to thank the ARGUS Program Office of the U.S. Air Force Electronic Systems
Command for their support. We thank Ken Wurtzler of Cobalt Solutions, LLC for providing the grid. We would also like to thank Lt. Col. Scott Morton of the U.S. Air Force Academy for providing computer resources through his Challenge Project at the U.S. Air Force’s Major Shared Resource Center.
References
1 Florendo, C.J., Yechout, T.R., Siegel, S., and Cummings, R.M., “Experimental Evaluation of a High Fineness Ratio Body With Drag Brakes, AIAA Paper 2006-0666, Jan. 2006. 2Strang, W.Z., Tomaro, R.F., Grismer, M., “Unstructured Euler/Navier-Stokes Flow Solver,” AIAA Paper 99-0786, Jan. 1999. 3 Samareh, J., “Gridtool: A Surface Modeling and Grid Generation Tool,” Proceedings of the Workshop on Surface Modeling, Grid Generation, and Related Issues in CFD Solution, NASA CP-3291, May 9-11, 1995. 4 Pirzadeh, S., “Progress Toward a User-Oriented Unstructured Viscous Grid Generator,” AIAA Paper 96-0031, Jan. 1996. 5 Spalart, P. R., and Allmaras, S.R., “A One Equation Turbulence Model for Aerodynamic Flows,” La Recherche Aerospatiale, Vol. 1, 1994, p. 5. 6 Spalart, P. R. , Jou W-H. , Strelets M., and Allmaras, S. R., “Comments on the Feasibility of LES for Wings, and on a Hybrid RANS/LES Approach,” Advances in DNS/LES, 1st AFOSR Int. Conf. on DNS/LES, Aug 4-8, 1997, Greyden Press, Columbus Oh. 7 Forsythe, J.R., Hoffmann, K.A., Dieteker, F.F., “Detached-Eddy Simulation of a Supersonic Axisymmetric Base Flow with an Unstructured Flow Solver,” AIAA Paper 2000-2410, June 2000. 8 Spalart, P., “Young-Person’s Guide to Detached-Eddy Simulation Grids,” NASA CR 2001-211032, July 2001. 9 Morton, S.A., Forsythe, J.R., Squires, K.D., and Wurtzler, K.E., “Assessment of Unstructured Grids for Detached-Eddy Simulation of High Reynolds Number Separated Flows,” 8th ISGG Conference, Honolulu, June 2002. 10 Forsythe, J., Squires, K., Wurtzler, K., and Spalart, P., “Detached Eddy Simulation of Fighter Aircraft at High Alpha,” AIAA Paper 2002-0591, Jan. 2002. 11Cummings, R.M. and Wetlesen, D.C., “A CFD Analysis for the Advanced Remote Ground Unattended Sensor (ARGUS) Configuration,” USAFA DFAN TR 04-02, 2004.
12 American Institute of Aeronautics and Astronautics