Embed Size (px)
Citation preview

Numerical analysis of suction embedded plate anchors instructured clay
T. S. Charltona, M. Rouainiaa, A. Gensb
aNewcastle University, School of Civil Engineering and Geosciences, Newcastle upon Tyne NE1 7RU, UKbUniversitat Politècnica de Catalunya, BarcelonaTech, Campus Norte UPC, 08034 Barcelona, Spain
Abstract
As offshore energy developments move towards deeper water,moored floating production fa-
cilities are increasingly preferred to fixed structures. Anchoring systems are therefore of great
interest to engineers working on deep water developments. Suction embedded plate anchors
(SEPLAs) are rapidly becoming a popular solution, possessing a more accurate and predictable
installation process compared to traditional alternatives. In this paper, finite element analysis
has been conducted to evaluate the ultimate pullout capacity of SEPLAs in a range of post-
keying configurations. Previous numerical studies of anchor pullout capacity have generally
treated the soil as an elastic-perfectly plastic medium. However, the mechanical behaviour of
natural clays is affected by inter-particle bonding, or structure, which cannot be accounted for
using simple elasto-plastic models. Here, a novel application of an advanced constitutive model
formulated within the kinematic hardening framework is used to accurately predict the degra-
dation of structure as an anchor embedded in a natural soft clay deposit is loaded to its pullout
capacity. In comparison with an idealised, non-softening clay, the degradation of clay structure
due to plastic strains in the soil mass results in a lower pullout capacity factor, a quantity com-
monly used in design, and a more complex load-displacement relationship. It can be concluded
that clay structure has an important effect on the pullout behaviour of plate anchors.
Preprint submitted to Elsevier November 2, 2016

1. Introduction
In recent decades the global demand for energy has increasedrapidly and this trend is pre-
dicted to continue into the future [1]. Offshore oil and gas reserves have been a mainstay of
energy production around the world. However, as the most accessible resources in shallow
coastal waters are depleted, the attention of energy producers is moving further offshore [2].
Energy resources requiring installations in water depths of over 2000m are becoming econom-
ically viable and the engineering challenges of deep water developments are therefore of great
importance.
As water depths increase rigid structures that are fixed to the seabed, such as jackup units,
jacket platforms and gravity platforms, become impractical. Instead, moored floating facilities
are preferred. An anchoring system tethers the structure tothe seabed, with the amount of free
movement of the facility being controlled by the mooring arrangement. The primary goal of the
anchor is to resist the combined vertical and horizontal pullout loads that the floating facility is
subjected to in the offshore environment.
Suction embedded plate anchors (SEPLAs) are designed to overcome certain limitations of
drag embedded anchors, which operate according to the same principles as a ship’s anchor. The
soil mass in front of the anchor gives resistance to pullout loads. An accurate prediction of
holding capacity is difficult as embedment depth of drag-in anchors is hard to predict. SEPLAs
are installed into the seabed by a suction caisson, the plateanchor being inserted into a slot at
the base of the caisson during penetration. The depth and location of the installed anchor are
consequently known to a high degree of accuracy. Using the plate anchor rather than the suction
caisson itself for anchoring is significantly less expensive [3]. Following installation, the plate
anchor is keyed into the soil through loading of the anchor chain and rotates from a vertical
orientation to a direction normal to the applied load if the anchor is symmetrically loaded.
The problem of anchor pullout capacity in undrained clay hasbeen studied by various re-
searchers. For horizontal anchors, Vesic [4] proposed an analytical solution for pullout capacity
based on cavity expansion theory in a rigid-plastic material; this approach provides reason-
able results for shallow anchors in soft clays. Das [5] presented a more versatile approach for
the estimation of pullout capacity of shallow and deep horizontal anchors, with an empirical
expression derived from model tests.
Rowe and Davis [6] undertook both an experimental and numerical investigation of horizontal
and vertical plate anchor capacity in clay. Finite element analysis was used to predict pullout
factor values for a range of anchor configurations and soil types, and results were found to agree

well with model tests. The study considered an idealised clay which deforms according to the
Tresca criterion. A practical definition of failure was adopted, with the failure load being taken
as the load causing a displacement four times that of an elastic analysis. This was due to the
extent of plastic deformation observed before a well-defined collapse load could be obtained.
Merifield et al. [7] used a finite element formulation of upperand lower bound theorems from
limit analysis to analyse a similar problem. Results provide a bracket for the true collapse load,
and were shown to compare favourably with previous laboratory work.
For SEPLAs, the keying process undertaken after insertion of the anchor by suction caisson
leads to rotation and loss of embedment. This was observed infield tests reported by Wilde et
al. [3] and has been a recent topic of research [e.g. 8, 9]. Thecapacity of plate anchors at a range
of inclination angles is therefore of interest. Limited empirical research has been undertaken,
for example the study by Das and Puri [10] tested a model square anchor at several inclination
angles to obtain an empirical expression for pullout capacity. Meyerhof [11] also presented a
closed-form expression for inclined strip and square anchors in frictional soils. Merifield et
al. [12] undertook a numerical investigation of inclined strip anchor capacity where upper and
lower bound solutions for pullout factors from limit analysis were compared with finite element
results. The finite element analysis, using a Tresca material, was found to be very close to the
upper bound solution. Only results for the vented or immediate breakaway case were reported.
Recently, a range of further studies applying finite elementanalysis have been carried out.
Yu et al. [13] conducted a thorough investigation of the pullout capacity of plate anchors at a
range of inclination angles and considered a variety of soilconditions. The effect of an inhomo-
geneous strength profile on the pullout capacity of a square anchor was extensively analysed by
Tho et al. [14] using a three-dimensional large deformationfinite element formulation. Other
examples of finite element studies include Wang et al. [15] and Fahmy et al. [16].
In these cases, the soil was described as a simple elastic-perfectly plastic material. This as-
sumption may be unsuitable for describing natural clays, which often show inter-particle bond-
ing, or structure, that can significantly affect mechanicalbehaviour [17]. Load-displacement
curves show rapid post-peak softening as structure degrades with increasing soil deformation.
As an extreme example, the highly sensitive quick clays of Scandinavia [18] demonstrate the
impact of the loss of natural structure during soil deformation. In this paper, an advanced soil
constitutive model will be used in a finite element analysis of the ultimate pullout capacity of
a SEPLA in an undrained structured clay. Plate anchor capacity will be evaluated in a range of
post-keying inclinations. This will allow an assessment ofthe effect of soil structure on pullout
capacity, and the subsequent implications for design. In addition, the localised degradation of
structure in the soil mass during the deformation process may be observed and related to the
failure mechanism.
2. Plate anchor capacity
2.1. Problem outline
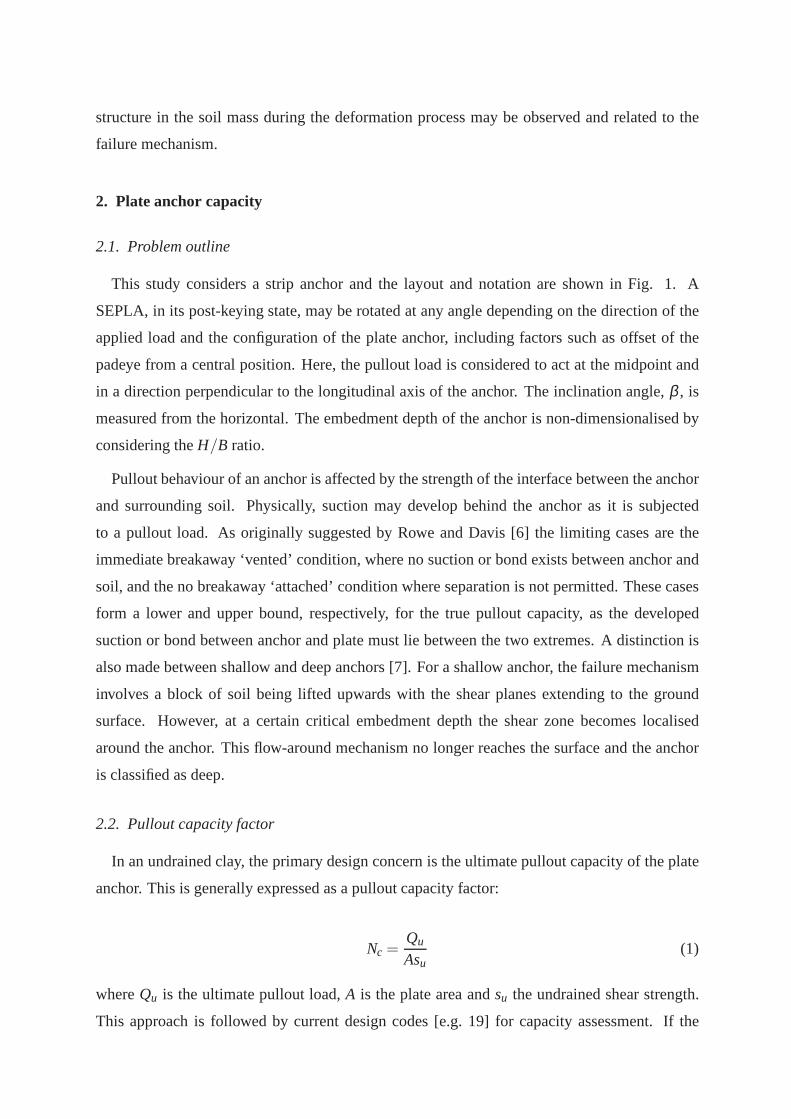
This study considers a strip anchor and the layout and notation are shown in Fig. 1. A
SEPLA, in its post-keying state, may be rotated at any angle depending on the direction of the
applied load and the configuration of the plate anchor, including factors such as offset of the
padeye from a central position. Here, the pullout load is considered to act at the midpoint and
in a direction perpendicular to the longitudinal axis of theanchor. The inclination angle,β , is
measured from the horizontal. The embedment depth of the anchor is non-dimensionalised by
considering theH/B ratio.
Pullout behaviour of an anchor is affected by the strength ofthe interface between the anchor
and surrounding soil. Physically, suction may develop behind the anchor as it is subjected
to a pullout load. As originally suggested by Rowe and Davis [6] the limiting cases are the
immediate breakaway ‘vented’ condition, where no suction or bond exists between anchor and
soil, and the no breakaway ‘attached’ condition where separation is not permitted. These cases
form a lower and upper bound, respectively, for the true pullout capacity, as the developed
suction or bond between anchor and plate must lie between thetwo extremes. A distinction is
also made between shallow and deep anchors [7]. For a shallowanchor, the failure mechanism
involves a block of soil being lifted upwards with the shear planes extending to the ground
surface. However, at a certain critical embedment depth theshear zone becomes localised
around the anchor. This flow-around mechanism no longer reaches the surface and the anchor
is classified as deep.
2.2. Pullout capacity factor
In an undrained clay, the primary design concern is the ultimate pullout capacity of the plate
anchor. This is generally expressed as a pullout capacity factor:
Nc =Qu
Asu(1)
whereQu is the ultimate pullout load,A is the plate area andsu the undrained shear strength.
This approach is followed by current design codes [e.g. 19] for capacity assessment. If the

H
B
β
Qu
Figure 1: Schematic of plate anchor pullout scenario and sign convention.
anchor is installed in a soil with an undrained shear strength that increases with depth, the
pullout capacity factor may be obtained as:
Nc =Qu
Asu,m(2)
wheresu,m is the undrained shear strength at the midpoint of the anchor. The pullout capacity
factor may be further broken down to explicitly analyse the effect of soil weight and an inho-
mogeneous shear strength profile. It has been shown that thisis a reasonable assumption [7]. In
this study, a practical scenario is simulated and hence a lumped pullout capacity factorNc will
be calculated with soil weight and inhomogeneous shear strength considered simultaneously.
3. Constitutive model
The kinematic hardening structure model (KHSM) developed by Rouainia and Muir Wood
[20] is used to describe the effect of clay structure on anchor uplift capacity. The KHSM
incorporates soil structure by observing that with total loss of structure the soil behaves as a
remoulded material. Hence, the framework is built upon the classic modified Cam-clay (MCC)
model [21]. The KHSM extension is based on the introduction of a kinematic hardening bubble,
which contains the elastic behaviour, and an outer structure surface to describe the state and
effect of soil structure.
The essential feature of the KHSM is the degradation of soil structure as plastic strain is
accumulated and hence this will be detailed here. The relative size of the structure surface to
the reference MCC surface describes the degree of structure, r, of the clay. The degradation of
structure is modelled by a destructuration law:

r = 1+(r0−1)exp
(
−kεd
λ ∗−κ∗
)
(3)
wherer0 is the initial degree of structure,k controls the rate of destructuration with plastic
‘damage’ strain,εd, λ ∗ is the slope of the normal compression line andκ∗ is the slope of
the swelling line in a volumetric strain-logarithmic mean stress plot. It can be seen thatr
is a monotonically decreasing function of the damage strain. The clay is remoulded with no
structure whenr = 1. The damage strain itself is calculated from the components of plastic
strain by a relationship between the strain rates:
ε̇d =[
(1−A)ε̇ p2v +Aε̇ p2
q
]1/2(4)
whereε pv is plastic volumetric strain andε p
q is plastic shear strain. A is a dimensionless param-
eter that determines howε pv andε p
q contribute to the damage strain, and thus the destructuration
of the clay.
4. Soil properties
4.1. Norrköping clay
The plate anchor will be modelled using the KHSM calibrated to test results from Norrköping
clay. The calibration procedure was undertaken and reported by Rouainia and Muir Wood [20].
The Norrköping clay is inorganic and of low sensitivity, with a plasticity index of 0.43 and a
liquidity index of 1.2. Clay and silt content is 62% and 36% respectively. The calibrated pa-
rameters are given in Table 1. The initial degree of structure of the Norrköping clay is 1.75. An
effective unit weight (γ ′) of 10kN/m3 is considered throughout and the initial stress conditions
are generated byK0 consolidation, withK0 equal to 0.5.
4.2. Undrained shear strength profile
The KHSM is implemented as a user defined model in the finite element code Plaxis 2D,
which is used for all numerical simulations in this study. Undrained shear strength is not an
input parameter in the KHSM, but a profile ofsu with depth is needed to determine the pullout
capacity factor of a plate anchor. Plane strain shear tests were therefore simulated.
Fig. 2 presents results from an undrained plane strain compression test on aK0 consolidated
sample at 20m depth. The effect of structure on the mechanical behaviour of the clay during the

Table 1: Soil parameters for Norrköping clay.Material property Value
Slope of swelling line,k∗ 0.0297Slope of normal compression line,λ ∗ 0.252Poisson’s ratio,ν 0.22Critical state stress ratio,M 1.35Ratio of size of bubble and reference surface,R 0.145Stiffness interpolation parameter,B 1.98Stiffness interpolation exponent,ψ 1.55Initial degree of structure,r0 1.75Destructuration strain parameter,A 0.494Destructuration parameter,k 4.16Anisotropy of initial structure,η0 0
test is demonstrated in Fig. 2a. A clear peak strength is observed before softening behaviour
occurs due to degradation of the structure with continuing strain. Eventually the behaviour of
the structured clay matches that of the MCC model, obtained by setting parametersr0 andR
equal to 1 in the KHSM. This case represents remoulded clay asno structure exists in the model,
with the structure surface coinciding with the MCC yield surface. The effective stress paths are
shown in Fig. 2b.
0 5 10 15 20 25 30
Axial strain (%)
0
50
100
150
200
250
Dev
iato
r st
ress
(kP
a)
StructuredRemoulded (MCC)
50 75 100 125 150
Mean effective stress (kPa)
0
50
100
150
200
250
Dev
iato
r st
ress
(kP
a)
StructuredRemoulded (MCC)
(a) (b)
Figure 2: Undrained plane strain compression test using KHSM model: (a) Deviator stress-axial strain responseand (b) effective stress path.
The undrained shear strength of the clay is determined from aseries of undrained plane strain
compression tests using the in-situK0 consolidated stress state at different depths. The resulting
su profiles of both structured and remoulded clay, calculated from the peak strengths exhibited
during the tests, are shown in Fig. 3. It may be seen thatsu increases linearly with depth.

For the default structured clay parameters in Table 1, the strength increases at a gradient of
4.30kPa/m while in the remoulded clay the gradient is 2.94kPa/m. A normally consolidated
clay is considered as this is typical of seabed sediments in many areas of interest for offshore
development. The sensitivity of the Norrköping clay is 1.46; this may be somewhat lower than
the sensitivity of marine clays where SEPLAs would typically be deployed but it should be
noted that the KHSM can easily be calibrated to clays of higher sensitivity.
0 20 40 60 80 100
Undrained shear strength su (KPa)
0
2
4
6
8
10
12
14
16
18
20
Dep
th (
m)
StructuredRemoulded (MCC)
Figure 3: Profiles of undrained shear strength.
5. Model set up
5.1. Finite element model
A plane strain finite element model was created in Plaxis using 15 node triangular elements,
as shown in Fig. 4. The model boundaries are fixed along the base and horizontal translation
is prevented at the sides. Results indicated that a model of size 25B×20B (with B= 2m) was
sufficient to avoid boundary effects on the ultimate pulloutload. The anchor itself is modelled
by a plate element of very high stiffness. The analysis is displacement-based to ensure a rigid
plate response. Soil-structure interaction is described with the aid of an interface element. An
interface is applied along the anchor base to model the vented and attached conditions and is
extended beyond the end of the anchor to avoid stress irregularities at the corner points. In
the vented condition, a very low stiffness is applied to simulate the lack of bonding or suction

between plate and soil. In all cases, a smooth anchor is considered. Whilst not realistic, this
will provide a conservative solution.
25×B
20×
B
Figure 4: Typical finite element mesh for horizontal plate anchor.
A mesh sensitivity study was carried out to determine an appropriate mesh coarseness for the
finite element model. The results are presented in Fig. 5. It can be seen that the discretisation
error increases rapidly for a mesh with less than 2000 nodes.An example of the meshes used in
this study is presented in Fig. 4. The mesh, containing 6421 nodes, is refined around the anchor
to improve accuracy in the failure zone.
Number of nodes0 1000 2000 3000 4000 5000 6000 7000
Nc
8
8.5
9
9.5
10
10.5
11
11.5
12
Figure 5: Mesh sensitivity

The ultimate pullout capacities are obtained for specific embedment depths and the position
of the mesh is not updated throughout the analysis. The effect of geometric non-linearity as the
anchor is pulled out of the soil is beyond the scope of this paper. However, previous small-strain
finite element studies [e.g. 6, 13] have given adequate solutions for the ultimate pullout capacity
when compared with results of laboratory experiments and limit analysis formulations.
5.2. Selection of failure criterion
Yu et al. [13] report that in attached conditions the ultimate load is reached quickly, requiring
only a relatively small displacement. For vented anchors the ultimate load will not be reached
until the failure mechanism reaches the surface; if the anchor is deeply-embedded for this to
occur the soil deformation will be extremely high. It was forthis reason that Rowe and Davis
[6] adopted a practical failure criterion, based on an assessment of elastic displacement. Here,
a similar approach is taken in vented cases primarily for numerical expediency. Based on pre-
liminary results, a displacement of 0.5B (1.0m) is selected as the failure criterion. It is worth
noting here that in practical offshore applications the ratio of overburden stress to shear strength
is likely to be large enough to encourage fully attached anchor behaviour [13]. Hence, the use
of a truncated failure criterion provides a conservative estimate of the lower bound to the true
pullout capacity, which will fall between vented and attached scenarios and in all likelihood
will lie close to the attached capacity.
6. Results and discussion
6.1. Analysis of the effect of structure on pullout capacity
6.1.1. Load-displacement behaviour
The effect of clay structure on anchor pullout capacity may be demonstrated by varying the
degree of initial structure and the rate of destructuration, which are controlled by parametersr0
andk respectively. The parametric study is undertaken on a deep anchor embedded atH/B= 10
(20m); the default parameter values are those given in Table1 unless otherwise stated. For each
set of parameters, the peak undrained shear strength is determined at anchor embedment depth
(20m) by a plane strain compression test and used for normalisation of the pullout force. Values
of initial structure of 1, 1.75, 2.5 and 3 are considered, corresponding to sensitivities of 1, 1.46,
1.82 and 2. It should be noted that in the caser0 = 1, an MCC model is used withR= 1, as this
enables comparison with a conventional soil model. The rateof destructuration is varied from

k= 0, when structure does not degrade with plastic strain (see Eq. 3), to the calibrated value of
k= 4.16.
Fig. 6a shows the development of the pullout force of an attached anchor with increasing
total displacement (u). In attached conditions the structured clay (r0 > 1) shows a peak strength
before softening occurs as plastic strains develop and structure is lost. It is clear that a greater
degree of initial structure results in a higher peak. In the remoulded clay (r0 = 1) the load
increases monotonically until an ultimate pullout force isreached. This ultimate force is equal
to that of the structured cases at large displacements due tothe structured clay being completely
remoulded along the failure planes. The post-peak softening of the structured clays occurs at a
similar rate as the calibratedk value is used in each simulation.
Fig. 6b presents normalised load-displacement curves withthe pullout capacity factorNc
calculated using Eq. 2 and the total displacement normalised by the anchor width. It can be
seen that when the degradation of clay structure is taken into account the value of the pullout
capacity factor is significantly reduced, from a maximum 12.0 in the remoulded clay to 8.7 in
the calibrated Norrköping clay. Furthermore, the pullout capacity factor appears to reduce as
the degree of initial structure is increased.
The rate of destructuration also has an important effect on anchor pullout capacity. Fig. 6c
shows that if structure remains constant (k = 0), no softening occurs and the pullout force in-
creases monotonically. When structure degrades with plastic strain, a peak force is observed
and post-peak softening occurs. A higher rate of destructuration reduces the peak pullout ca-
pacity and also causes a sharper post-peak reduction in load. However, this only has a limited
effect on the pullout capacity factor. As evident in Fig 6d, the rate of destructuration does not
have such a major influence on the normalised capacity as the degree of initial structure.
No post-peak softening is observed at this depth for vented anchors (Fig. 7) because the
ultimate load, which is attained when the failure mechanismreaches the surface, is not reached
for a displacement of 0.5B. The relationship between pullout capacity and the degree of initial
structure (Figs. 7a and 7b) is similar to the attached interface condition. In this case, the clay
structure delays the reduction in stiffness due to the development of plastic strains. As structure
is lost, the load-displacement curve reduces to the same shape as the remoulded clay but at a
higher load. Again, a higher initial degree of structure tends to reduce theNc value. Figs 7c and
7d show that increasing the rate of destructuration resultsin a lower pullout capacity, but the
effect on the capacity factor is minimal once destructuration occurs (k> 0).
In the two analysis cases where softening does not occur, in remoulded clay (r0 = 1) and clay

0 0.2 0.4 0.6 0.8 1
Total displacement (m)
0
500
1000
1500
2000
Nor
mal
forc
e (k
N/m
)
r0=1.00
r0=1.75 (calibrated)
r0=2.50
r0=3.00
0 0.1 0.2 0.3 0.4 0.5
Normalised displacement (u/B)
0
2
4
6
8
10
12
14
Nc
r0=1.00
r0=1.75 (calibrated)
r0=2.50
r0=3.00
(a) (b)
0 0.2 0.4 0.6 0.8 1
Total displacement (m)
0
500
1000
1500
2000
2500
Nor
mal
forc
e (k
N/m
)
k=0.00k=1.00k=2.00k=3.00k=4.16 (calibrated)
0 0.1 0.2 0.3 0.4 0.5
Normalised displacement (u/B)
0
2
4
6
8
10
12
Nc
k=0.00k=1.00k=2.00k=3.00k=4.16 (calibrated)
(c) (d)
Figure 6: Effect of (a-b) initial degree of structure (r0) and (c-d) rate of destructuration (k) on load-displacementcurves and pullout capacity factor for a deep, attached anchor (H/B= 10).

with constant structure (k = 0), very similar values of Nc are obtained: 12.0 (11.6) in attached
conditions and 5.2 (4.9) in vented conditions for the corresponding casesr0 = 1 (k = 0). The
non-softening capacity factors can be compared to previousstudies that used simple perfectly-
plastic models to represent clay behaviour. For clay with constant structure (k= 0), the position
of the structure surface actually causes an overconsolidated response and so the MCC model
will be used for comparison as a normally consolidated clay is of interest here. In the following
section the pullout capacity factor in structured Norrköping clay will be compared with the
non-softening capacity factors from the MCC model and otherresults reported in the literature.
0 0.2 0.4 0.6 0.8 1
Total displacement (m)
0
100
200
300
400
500
600
700
800
Nor
mal
forc
e (k
N/m
)
r0=1.00
r0=1.75 (calibrated)
r0=2.50
r0=3.00
0 0.1 0.2 0.3 0.4 0.5
Normalised displacement (u/B)
0
1
2
3
4
5
6
Nc
r0=1.00
r0=1.75 (calibrated)
r0=2.50
r0=3.00
(a) (b)
0 0.1 0.2 0.3 0.4 0.5
Normalised displacement (u/B)
0
1
2
3
4
5
6
Nc
k=0.00k=1.00k=2.00k=3.00k=4.16 (calibrated)
0 0.2 0.4 0.6 0.8 1
Total displacement (m)
0
200
400
600
800
1000
1200
Nor
mal
forc
e (k
N/m
)
k=0.00k=1.00k=2.00k=3.00k=4.16 (calibrated)
(c) (d)
Figure 7: Effect of (a-b) initial degree of structure (r0) and (c-d) rate of destructuration (k) on load-displacementcurves and pullout capacity factor for a vented anchor (H/B= 10).

6.1.2. Pullout capacity factor
The pullout capacity factors for horizontal anchors in non-softening clay (using an MCC
model) and structured clay are shown in Fig. 8, for a range ofH/B ratios. Thesu profiles used
to normalise the pullout force were presented in Fig. 3, withstrength gradients of 2.94kPa/m
and 4.30kPa/m for non-softening and structured clay respectively. Previous finite element re-
sults for uniform, elastic-perfectly plastic clays reported by Yu et al. [13] and Rowe and Davis
[6] are also shown, in addition to plasticity solutions by Merifield et al. [7] for vented anchors.
Although the combined influence of clay weight, strength gradient, and different failure crite-
rions (in the vented interface condition) make comparison difficult, it is reasonable to compare
the limiting Nc value (Ncmax) for deep, attached anchors, for which the upper bound plasticity
solution is 11.42 [6]. TheNcmax of non-softening clay in the current study is slightly overesti-
mated (Ncmax = 12.0) but shows a relatively good fit with values obtained in previous numerical
analyses. The bounding solutions for vented anchors, obtained for a uniform strength profile,
are rather higher than the results of the non-softening analysis. This may be attributed to failure
being defined at a specified displacement for vented anchors,as the general trend of increasing
Nc with embedment depth is captured but at a shallower gradientdue to the failure mechanism
not being allowed to fully develop.
Fig. 8 shows that the pullout capacity factor in non-softening clay is higher than that in struc-
tured clay across all embedment ratios, suggesting that values ofNc obtained by conventional
non-softening analyses may be overestimating capacity in natural clays. This also reflects the
conclusions of other studies of embedded objects in strain-softening clays, such as penetrom-
eters [22, 23] and spudcans [24], where values of normalisedcapacity were found to be lower
if softening behaviour is taken into account. In Norrköpingclay, the ratio of structured to non-
softeningNc is in the range 0.71 - 0.76 for attached anchors and 0.68 - 0.76for the vented
interface condition. The clay structure does not influence the critical embedment ratio, mark-
ing the transition from a shallow to deep anchor, implying that displacement mechanisms are
similar for anchors in structured and non-softening clays.
In practice, the installation process of the SEPLA will cause remoulding to occur. Local
structure degradation will also result from plastic deformation during keying [9]. Some degree
of structure will remain following installation of the plate anchor but it is unlikely to be fully
intact across the soil domain, nor will it be completely lost. The lower bound of the capacity
factor post-installation can be taken as the residual valueof Nc in the structured clay, after
complete remoulding has occurred along the failure planes.As an example, the reduction from
peak to residual strength represents an 8% loss of capacity for an anchor atH/B= 10 (Fig. 6b

H/B0 2 4 6 8 10 12
Nc
0
2
4
6
8
10
12
14
Structured - attached
Non-softening (MCC) - attached
Structured - vented
Non-softening (MCC) - vented
Rowe and Davis [6] - attached
Yu et al. [13] - attached
Merifield et al. [7] - vented lower bound
Merifield et al. [7] - vented upper bound
Figure 8: Pullout capacity factors for horizontal anchors.

r0 = 1.75). Across all embedment ratios, this reduction is in the range 5 - 10%. For a vented
anchor, a similar lower bound can be calculated if the force obtained in the remoulded clay is
normalised by the peak shear strength in structured clay (inorder to overcome the truncated
simulation). In this case, the maximum reduction inNc is 10%.
6.2. Pullout capacity of inclined plate anchors in structured clay
Fig. 9 shows the pullout capacity factors for attached anchors at a range of post-keying incli-
nations (β = 0o, 22.5o, 45o, 67.5o, 90o). It can be seen that all cases tend towards a maximum
capacity factor of around 8.7. The effect on pullout capacity of anchor inclination is relatively
insignificant for embedment ratios greater than 4. At shallow embedment ratios, a horizon-
tal anchor has the highest pullout capacity, and capacity reduces with increasing inclination.
The critical embedment ratio is also seen to increase as the anchor is more steeply inclined;
the plastic flow becomes localised at a greater depth. In a normally consolidated clay, there is
still capacity to be gained from an embedment beyond this critical point due to the increasing
strength profile with depth. However after the critical depth is reached the maximum pullout
force must increase in a manner directly proportional to shear strength, so the rate of gain in
capacity is reduced.
H/B0 2 4 6 8 10 12
Nc
3
4
5
6
7
8
9
10
0o
22.5o
45o
67.5o
90o
Figure 9: Pullout capacity factors for attached anchors at arange of inclinations.
For vented anchors, inclination has a profound effect upon the pullout capacity factor for all
depths, as is evident in Fig. 10. The vertical anchor (β = 90o) gives the highest factor, with
capacity reducing for less steep inclinations. This is in direct contrast to behaviour if the anchor
and soil are attached, as the greatest pullout capacity was found in the horizontal case. The

contrasting relationship betweenNc and anchor inclination for different interface conditions
reflects the results of Yu et al. [13] for a uniform, weightless clay. Although Yu et al. [13]
found that the capacity became constant as the inclination reduced below 45o, here a relatively
constant difference is observed between each inclination angle. This may be a consequence of
the use of a practical failure criterion.
H/B0 2 4 6 8 10 12
Nc
0
1
2
3
4
5
6
7
8
0o
22.5o
45o
67.5o
90o
Figure 10: Pullout capacity factors for vented anchors.
The difference in behaviour between the attached and ventedcase may be explained by ob-
serving the failure mechanism in each interface condition,as illustrated in Fig. 11 for the case
H/B = 2. For a horizontal anchor, if the soil and anchor are fully bonded together (11a) the
shear zone extends a distance beneath the anchor, in both horizontal directions. If soil and an-
chor detach, shown in 11b, the failure plane runs immediately upwards and increases in width
as weaker soil is activated. The greater length of the shear plane in the attached case, coupled
with the activation of stronger soil at depth, adds significantly to the resistance.
For vertical anchors, in the attached case the soil engaged behind the anchor does not benefit
from the increase in shear strength with depth seen in the horizontal case. The failure plane is
much shorter and consequently the vertical anchor has a lower pullout capacity. The inclinations
(22.5o, 45o and 67.5o) are intermediate steps; the failure plane tends to shortenand less soil
is activated beneath the anchor, lowering the pullout capacity factor. In the vented case the
increased pullout capacity for vertical anchors is explained by the failure mechanism extending
deeper into the soil compared to the horizontal case. Again,the intermediate inclinations show
the engagement of greater regions of deeper, stronger soil in the shear zone.

Fig. 12 shows failure mechanisms for deep, horizontal anchors. The localisation of plastic
flow is immediately evident for the attached anchor. It may benoticed that plastic deformation
extends further above the anchor than below due to the linearly increasing shear strength profile.
Failure mechanisms for attached anchors at other inclinations follow the same pattern: instead
of the mechanism reaching the ground surface, plastic deformation is localised at the anchor.
For illustration purposes, Fig. 12b presents a vented anchor at the same embedment ratio
(H/B = 4). The failure mechanism is essentially the same as that shown in Fig. 12 for a
shallower embedment, hence the lack of a critical embedmentratio in vented cases. As noted
by Song et al. [8], if the overburden pressure to shear strength ratio was high enough, an
attached mechanism would form. A truncated failure criterion has been used in this study and
the ultimate pullout load would not be attained until the failure mechanism reaches the surface.
6.3. Degradation of structure during pullout
The KHSM also allows observation of the loss of clay structure as an anchor is loaded to
failure. Fig. 13 shows the loss of structure around a deep anchor (H/B= 10) at displacements
of 0.05B, 0.1B and 0.2B, when the failure mechanism is fully developed. The destructuration
strain parameter A, determining the contribution to structure degradation from volumetric and
shear strain, is 0.494 and so almost equal contributions from the two strain components would
be expected. However, in undrained conditions plastic volumetric strain is necessarily small
and the loss of structure is therefore primarily caused by shear strain.
After a displacement of 0.05B, in both interface scenarios a total loss of structure has oc-
curred in isolated regions at the tips of the anchor. The difference between attached and vented
conditions is immediately apparent. The loss of structure extends above and below the attached
anchor in a similar manner. In the vented case, only a limitedamount of localised degradation
is observed beneath the anchor. No tension is allowed in the vented interface and the loss of
structure below the anchor is likely due to the effect of overburden pressure. At this displace-
ment, structure loss is more extensive in the vented case, suggesting the failure mechanism is
quicker to develop.
The two zones of remoulded clay at the anchor tips continue togrow as plastic shear strains
accumulate and at 0.1B displacement have converged at a central location above the anchor. It
is interesting to note that a zone of relatively intact structure remains above the anchor. At this
stage, in the attached case regions of remoulded clay extenddownwards from the anchor tips as
the fully localised failure mechanism develops. At 0.2B displacement this mechanism is fully
formed, and the anchor is enveloped in a zone of remoulded soil, aside from isolated regions

0o
22.5o
45o
67.5o
90o
(a) (b)
Figure 11: Displacement vectors at failure at inclination angles from 0o to 90o for (a) attached and (b) ventedanchors (H/B= 2).

(a)
(b)
Figure 12: Displacement vectors at failure for a) attached and b) vented anchors (H/B= 4).
next to the anchor. In contrast structure continues to degrade only above the vented anchor, as
the failure mechanism progresses towards the surface.
A pullout load has a similar effect on clay structure if the anchor is inclined. The loss of struc-
ture follows the development of plastic shear strains in thesoil as the failure mechanism forms.
An interesting case occurs when the effect of anchor inclination on the critical embedment ratio
is considered. As observed in Section 6.1.2, anchor inclination can change the critical ratio
from H/B= 3 (horizontal anchor,β = 0o) to H/B= 8 (vertical anchor,β = 90o).
Fig. 14 presents the illustrative caseH/B = 5 for anchor inclinations 0o,45o and 90o. At
this embedment ratio, loss of structure is localised aroundthe horizontal anchor, which deforms
according to a deep failure mechanism as described previously. If the anchor is inclined at 45o,
the loss of structure is less localised. It is clear that limited plastic shear strains must reach the
surface as a zone of substantial but not total loss of structure is observed. This reflects the fact
that, as may be concluded from Fig. 8, forβ = 45o, H/B= 5 is the critical embedment ratio.
The majority of the plastic flow, and associated loss of structure, occurs around the anchor and
the proximity of the ground surface does not affect the pullout capacity factor. For a vertical
anchor, structure degradation clearly extends away from the anchor into the soil mass. The

u=0.05B
u=0.1B
u=0.20B
(b) Vented(a) Attached
1.75
1.65
1.70
1.60
1.55
1.50
1.45
1.40
1.35
1.30
1.25
1.20
1.15
1.10
1.05
1.00
Structure r
Figure 13: Loss of structure at different displacements fora) attached and b) vented anchor (H/B= 10).

failure mechanism reaches the ground surface and the anchoris classified as shallow.
1.75
1.65
1.70
1.60
1.55
1.50
1.45
1.40
1.35
1.30
1.25
1.20
1.15
1.10
1.05
1.00
Structure r
90o
45o
0o
Figure 14: Loss of structure at failure for inclined attached anchors (H/B= 5).
7. Conclusions
In this paper a finite element analysis of the pullout capacity of SEPLAs in a structured clay
has been conducted. An advanced kinematic hardening constitutive model was used to accu-
rately describe the effect of structure on the mechanical behaviour of a plate anchor embedded
in a natural clay. The degradation of clay structure is modelled as a function of plastic strain.
A range of post-keying anchor inclinations have been considered and the limiting cases of an
attached and vented interface were simulated.
The load-displacement relationship for attached anchors in structured clay showed a peak
force followed by softening as structure is lost due to plastic strains developing along the fail-

ure planes. The pullout force ultimately reduces to that of the remoulded clay. In terms of the
pullout capacity factor, which incorporates normalisation by the peak undrained shear strength,
the loss of clay structure resulted in a reduction in capacity factor compared to non-softening
clay. The ratio of structured to non-softening capacity factor for vented and attached conditions
was in the range 0.68 - 0.76 for horizontal anchors. This suggests that values reported in previ-
ous studies may overestimate the capacity factor in naturalclays as the effect of softening has
not been previously accounted for in the pullout of plate anchors. A parametric study indicated
that a greater degree of initial structure, corresponding to a more sensitive clay, has the effect
of further reducing the pullout capacity factor. For low sensitivity clays, as considered here,
it can be concluded that design capacity factors are best estimated on the basis of remoulded
shear strength as the presence of initial structure offers only a relatively small increase in pullout
capacity.
In undrained conditions, the loss of structure is predominantly controlled by plastic shear
strains. If a pullout load is applied to an anchor in structured clay, zones of completely re-
moulded clay will form around the failure planes with increasing displacement. The loss of
structure is more extensive for attached than for vented anchors as clay on both sides of the
anchor is activated. Small regions of remoulded soil were observed beneath vented anchors, but
did not extend into the soil mass.
As a final remark, it must be emphasised that the pullout capacity factors reported in this
study are relevant only for the specific clay considered. Further investigation is needed into the
degree of structure in the clay mass and the rate of destructuration, in addition to the effect of
installation processes on the clay structure and anchor capacity.
Acknowledgment: The authors wish to thank Gerard Vallespí Català MSc for his assistance
with the numerical simulations. We are also grateful to the anonymous reviewers for their
constructive comments and suggestions which significantlyimproved the manuscript.
References
[1] EIA (US Energy Information Administration). International Energy Outlook. Washington,
DC: EIA. 2013.
[2] Randolph MF, Gaudin C, Gourvenec SM, White DJ, Boylan N, Cassidy MJ. Recent ad-
vances in offshore geotechnics for deep water oil and gas developments. Ocean Eng 2011;
38(7): 818-834.

[3] Wilde B, Treu H, Fulton T. Field Testing of Suction Embedded Plate Anchors. Proceedings
of the 11th Int Offshore and Polar Engineering Conference. Stavanger, Norway, June 17-
22, 2001.
[4] Vesic AS. Breakout Resistance of Objects Embedded in Ocean Bottom. J Soil Mech Found
Div, 1971;97(9): 1183-1205.
[5] Das BM. A procedure for estimation of ultimate capacity of foundations in clay. Soils
Found 1980;20(1):77-82.
[6] Rowe RK, and Davis EH. The behaviour of anchor plates in clay. Géotechnique
1982;32(1): 9-23.
[7] Merifield RS, Sloan SW, Yu HS. Stability of plate anchors in undrained clay. Géotechnique
2001;51(2): 141-153.
[8] Song Z, Hu Y, O’Loughlin, C, Randolph, MF. Loss in Anchor Embedment during Plate
Anchor Keying in Clay. J Geotech Geoenviron Eng 2009; 135(10): 1475-1485.
[9] Cassidy MJ, Gaudin C, Randolph MF, Wong PC, Wang D, Tian Y.A plasticity model to
assess the keying of plate anchors. Géotechnique 2012; 62(9):825-836.
[10] Das BM, Puri VK. Holding Capacity of Inclined Square Plate Anchors in Clay. Soils
Found 1989; 29(3): 138-144.
[11] Meyerhof GG. Uplift resistance of inclined anchors andpiles. Proc of the 8th Int Conf on
Soil Mech and Found Eng. Moscow. 1073; 167-172.
[12] Merifield RS, Lyamin AV, Sloan SW. Stability of inclinedstrip anchors in purely cohesive
soil. J Geotech Geoenviron Eng, 2005; 131(6): 792-799.
[13] Yu L, Liu J, Kong X-J, Hu Y. Numerical study on plate anchor stability in clay. Géotech-
nique 2011;61(3): 235-246.
[14] Tho KK, Chen Z, Leung CF, Chow YK. Pullout behaviour of plate anchor in clay with
linearly increasing strength. Can Geotech J 2014; 51(1): 92-102.
[15] Wang D, Hu Y, Randolph MF. Three-Dimensional Large Deformation Finite-Element
Analysis of Plate Anchors in Uniform Clay. J Geotech Geoenviron Eng, 2010;136(2):355-
365.
[16] Fahmy AM, de Bruyn JR, Newson TA. Numerical Investigation of the inclined pullout
behaviour of anchors embedded in clay. Geotech Geol Eng, 2013;31(5): 1525-1542.
[17] Lerouei, S, Vaughan PR. The general and congruent effects of structure in natural soils
and weak rocks. Géotechnique 1990; 40(3): 467-488.
[18] Bjerrum L. Kvikkleireskred. Publication 89, Norwegian Geotechnical Institute.
[19] Det Norske Veritas. Design and Installation of Plate Anchors in Clay. DNV, Norway. 2002.
[20] Rouainia M, Muir Wood D. A kinematic hardening constitutive model for natural clays
with loss of structure. Géotechnique 2000;50(2): 153-164.
[21] Roscoe KH, Burland JB. On the generalised stress-strain behaviour of wet clay. in Hey-
man, J. and Leckie, F.A. (eds.) Engineering plasticity. Cambridge: Cambridge University
Press, 1968; 563-609.
[22] Zhou H., Randolph MF. Computational techniques and shear band development for cylin-
drical and spherical penetrometers in strain-softening clay. Int J Geomech 2007; 7(4):
287-295.
[23] Zhou H, Randolph MF. Resistance of full-flow penetrometers in rate-dependent and strain-
softening clay. Géotechnique 2009; 59(2): 79-86
[24] Hossain MS, Randolph MF 2009. Effect of strain rate and strain softening on the penetra-
tion resistance of spudcan foundations on clay. Int J Geomech 2009; 9(3), 122-132.