Embed Size (px)
DESCRIPTION
Prediction of path loss in a wireless system is important to determine its quality of service. Fluctuationsand variations of signal strength at higher frequency range in Near Field zone, is a common difficulty toachieve higher data rate. Continuous variation in signal causes decay of strength by the interference of theatmospheric obstructions and hence electric field intensity gradually decreases with the distance. In thispaper the behaviour of field strength is explored through AWAS Electromagnetic Code which predicts therapid variations in electric field intensity irrespective of environment as compare to statistical modelswhich do not capture the variations as per Environment. An adequate and optimum values of theseparameters is essential for efficient transmission. The results show that the numerical analysis predictsmuch lower field strengths which could significantly affect the channel quality. . This investigation is essential to reduce the rapid fluctuations in field strength of the WiMAX.
Citation preview
International Journal of Next-Generation Networks (IJNGN) Vol.6, No.2, June 2014
DOI : 10.5121/ijngn.2014.6204 47
NUMERICAL ANALYSIS OF NEAR FIELDDISTRIBUTION VARIATION AT 2300 MHZ USING
AWAS
Chhaya Dalela1, MVSN Prasad2, Rahul Namawat3
1 Department of Electronics & Communication Engineering, JSSATE, Noida, India2National Physical Laboratory, New Delhi, India,
3JECRC University, Jaipur, Rajasthan, India
ABSTRACT
Prediction of path loss in a wireless system is important to determine its quality of service. Fluctuationsand variations of signal strength at higher frequency range in Near Field zone, is a common difficulty toachieve higher data rate. Continuous variation in signal causes decay of strength by the interference of theatmospheric obstructions and hence electric field intensity gradually decreases with the distance. In thispaper the behaviour of field strength is explored through AWAS Electromagnetic Code which predicts therapid variations in electric field intensity irrespective of environment as compare to statistical modelswhich do not capture the variations as per Environment. An adequate and optimum values of theseparameters is essential for efficient transmission. The results show that the numerical analysis predictsmuch lower field strengths which could significantly affect the channel quality. . This investigation isessential to reduce the rapid fluctuations in field strength of the WiMAX.
KEYWORDS
WiMAX, Propagation Modelling, Near Field Zone, Electric Field Intensity, Electromagnetic Code
1. INTRODUCTION
Worldwide Interoperability for Microwave-Access (WiMAX) has emerged as wireless accesstechnology which is capable of providing fixed and mobile broadband connectivity. Theevolution of broadband internet access can become a reality through the novel broadbandtechnologies such as WiMAX (Worldwide Interoperability For Microwave Access ) [1] . FixedWiMAX services are beneficial to the development of broadband used by consumers and smallbusinesses while mobile WiMAX may be used for mobile services being provisioned by existingfixed-line carriers that do not own a 3G spectrum to provide Voice-over-IP (VoIP) or mobileentertainment services [2]. In order to provide guaranteed Quality of Services (QoS) with highdata rate, Radio Network Planning (RNP) is required. Fixed WiMAX is targeted for fixed andnomadic broadband services while mobile WiMAX are designed to provide high mobilityservices. The fast evolution of wireless communications has led to the use of higher frequencybands, smaller cell sizes, and efficient antenna systems, which ultimately makes the path loss andpropagation prediction issues more challenging. These data rates can be further increased byemploying various diversity techniques.
International Journal of Next-Generation Networks (IJNGN) Vol.6, No.2, June 2014
48
In the WiMAX technology, the frequency spectrum is allocating either 2.3 or 3.5 GHz banddepending on availability. In India, WiMAX is operating at 2.3 GHz frequency band which tendsto provide an access to operate the wireless devices at very higher data rates compared toconventional devices, in a large coverage area [1,3]. Prasad et. al. [4] reported that the AWASElectromagnetic Code did not require any building information and was able to compete withother empirical methods. An attempt has been made to realize the objective by analysing theexperimental data for different environments to provide an optimum approach and guidelines forthe cell planning of WiMAX transmissions in the Indian urban & sub urban zones. Theexperimental data utilized in this study corresponds to 2.3 GHz WiMAX radio measurements indense urban environments, carried out in Western India. AWAS Numerical Electromagneticcode, which is based on Sommerfeld’s approach for ground, is used to compute the near fieldsignal strength of propagation link. It is also used to estimate the significant changes in fieldstrength with the variation in height of the transmitting antenna of WiMAX.
In Section II, the details of AWAS Electromagnetic code and Environmental details areprovided. In section III, we have analysed AWAS Electromagnetic code with Existing PredictionMethods. Conclusions are presented in Section IV.
2. EXPERIMENTAL DETAILS
2.1. The AWAS Numerical Electromagnetic Code
AWAS Numerical Electromagnetic Code [5] is a computer program which evaluates the currentdistribution of a conductor by simulating the polynomial coefficients. This program is based on atwo potential equations which is solved numerically by the method of moments with thepolynomial approximation for the current distribution. The influence of the ground is taken intoaccount using Sommerfield’s approach, with numerical integration algorithm developed for thisprogram. It was utilized to compute the path-loss values for different values of dielectric constantand a conductivity of 2 x 10⁻⁴ over real ground. This computer program is capable of analyzingwire antennas operating in transmitting and receiving modes. Different values of dielectricconstant for dense urban, urban, and suburban regions were incorporated into the computation ofthe A WAS simulation. Reference [6] gave relative dielectric constants for various types ofground and environments. It gave values of 3 to 5 for city industrial areas. Hence, a value of 4was used in the A WAS simulation. In the AWAS simulation, the computation of the electricfield was carried out by taking a vertical dipole located over an imperfect ground plane, whereasin the measurements, a high transmitting- gain antenna was employed.
2.2. Environmental Details
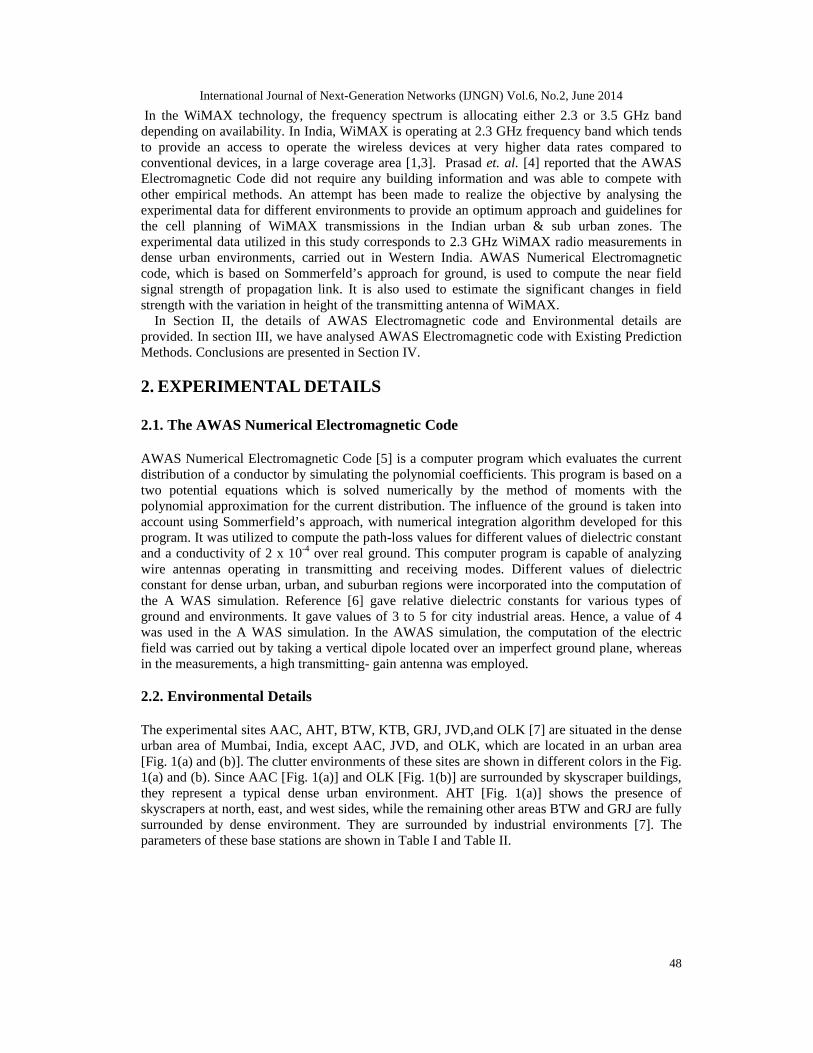
The experimental sites AAC, AHT, BTW, KTB, GRJ, JVD,and OLK [7] are situated in the denseurban area of Mumbai, India, except AAC, JVD, and OLK, which are located in an urban area[Fig. 1(a) and (b)]. The clutter environments of these sites are shown in different colors in the Fig.1(a) and (b). Since AAC [Fig. 1(a)] and OLK [Fig. 1(b)] are surrounded by skyscraper buildings,they represent a typical dense urban environment. AHT [Fig. 1(a)] shows the presence ofskyscrapers at north, east, and west sides, while the remaining other areas BTW and GRJ are fullysurrounded by dense environment. They are surrounded by industrial environments [7]. Theparameters of these base stations are shown in Table I and Table II.
International Journal of Next-Generation Networks (IJNGN) Vol.6, No.2, June 2014
49
Fig. 1. Clutter environment for experimental sites (a) AAC, AHT, KTB, BTW, and GRJ and (b) OLK andJVD.
3. RESULTS AND DISCUSSION
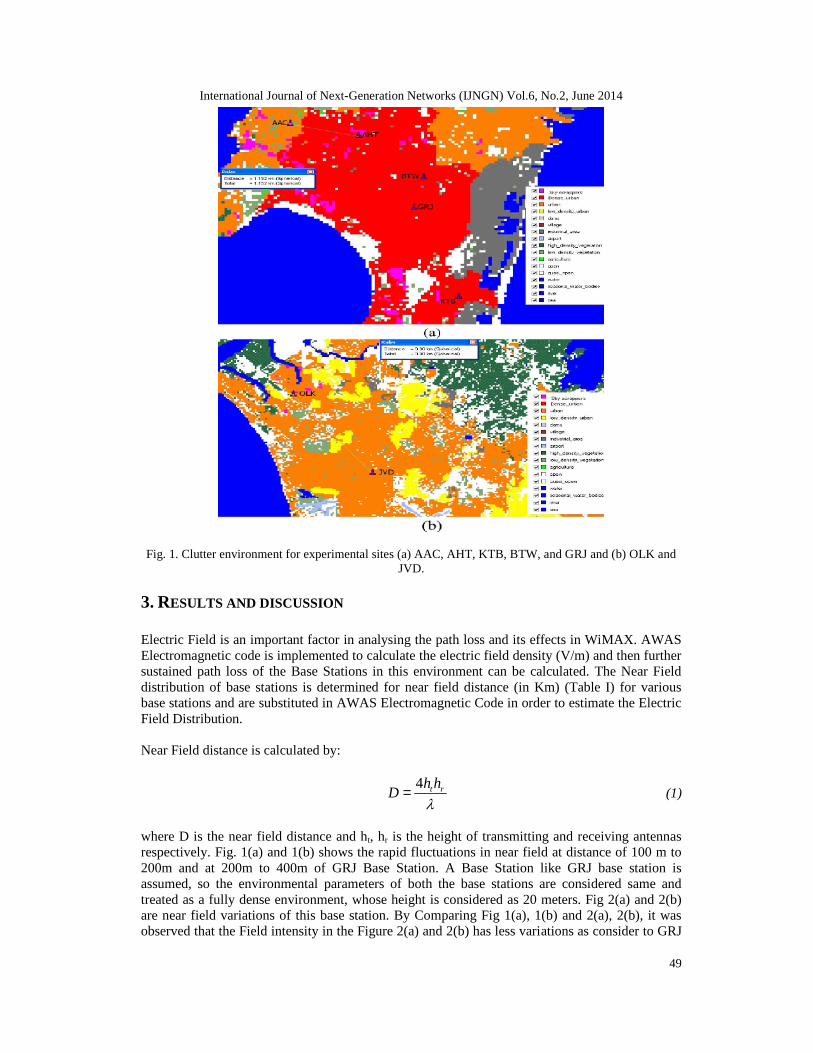
Electric Field is an important factor in analysing the path loss and its effects in WiMAX. AWASElectromagnetic code is implemented to calculate the electric field density (V/m) and then furthersustained path loss of the Base Stations in this environment can be calculated. The Near Fielddistribution of base stations is determined for near field distance (in Km) (Table I) for variousbase stations and are substituted in AWAS Electromagnetic Code in order to estimate the ElectricField Distribution.
Near Field distance is calculated by:
4 t rDh h
= (1)
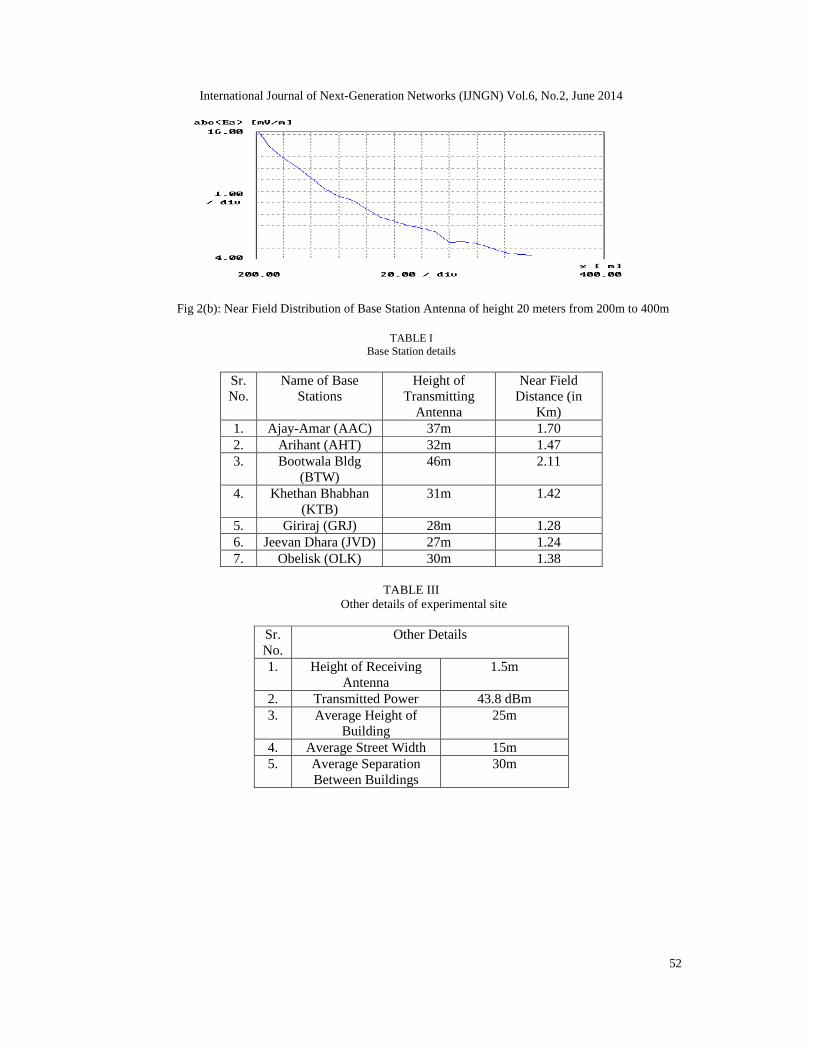
where D is the near field distance and ht, hr is the height of transmitting and receiving antennasrespectively. Fig. 1(a) and 1(b) shows the rapid fluctuations in near field at distance of 100 m to200m and at 200m to 400m of GRJ Base Station. A Base Station like GRJ base station isassumed, so the environmental parameters of both the base stations are considered same andtreated as a fully dense environment, whose height is considered as 20 meters. Fig 2(a) and 2(b)are near field variations of this base station. By Comparing Fig 1(a), 1(b) and 2(a), 2(b), it wasobserved that the Field intensity in the Figure 2(a) and 2(b) has less variations as consider to GRJ
International Journal of Next-Generation Networks (IJNGN) Vol.6, No.2, June 2014
50
Base Station. As observed from figure 1(a) and 1(b), there is a rapid variations in Electric FieldDistribution and can be represented by Δ which is defined as :
–max minE E
d∆ = (2)
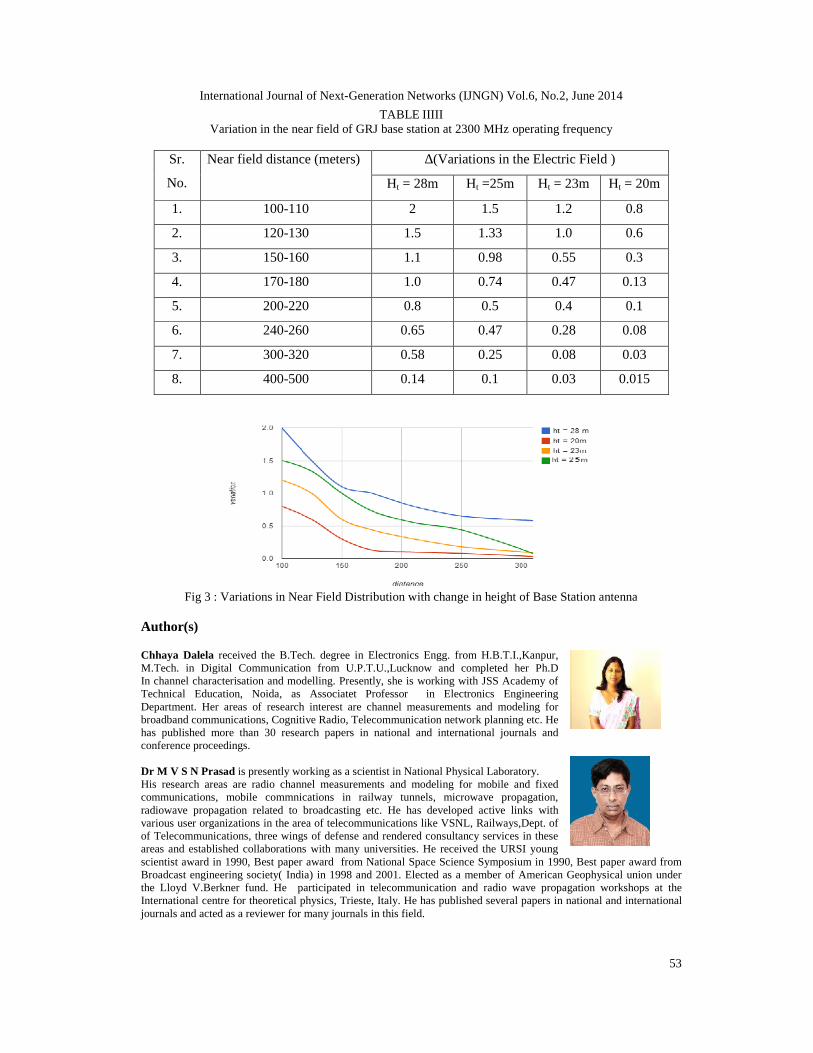
where d is the distance in a single division. Table III shows the variation in electric field which isnumerically decreasing with the distance. Basically there are various conventional methods areused to predict the path loss and electric field distribution. But they are unable to predict thevariation due to increasing height of the Transmitting Antenna. The reason behind rapid variationin Electric Field in Near Field zone is the atmospheric fluctuation and environmental obstruction.The reduction in variations in Electric field intensity with reduction in height of TransmittingAntenna can be explained as shown in Fig 3. Several repeaters with reduced transmitting antennaheight of Transmitting Stations can play a vital role in this situation to remove the rapidfluctuations.
4. CONCLUSIONS
The near field distribution for WiMAX at 2300MHz is analyzed for dense urban region ofWestern India using AWAS Numerical Electromagnetic Code. The advantage of AWASelectromagnetic code is that it predicts the basic atmospheric variations in the field strength withthe environmental parameters of that region. It has been found that in near field zone, the signalfluctuations are very high, and as the height of the transmitting antenna increases, the near fielddistance will be larger and the signal remains stable in the far field. Hence, it is advisable to keepthe antenna closed to the ground and employee more repeater stations. Thus, the reduction intransmitting antenna height will ultimately reduce the rapid variations in near field distributionand is tends to produce efficient radiated signal. Moreover, AWAS numerical electromagneticcode predicts all the variations of path loss irrespective of environment whether it is urban,suburban or rural whereas statistical models do not capture the fundamental physics and it hasseparate models for urban, suburban or rural environment.
REFERENCES
[1] “IEEE Standards for local and metropolitan area network – Part 16 : Air Interface For fixedbroadband wireless access systems” ,2011.
[2] Chhaya Dalela, “Propagation Path Loss Modeling for Deployed WiMAX Network”, IJETAE,8(2012),172-176
[3] CEPT ECC Report 172, “Broadband Wireless Systems usage in 2300-2400MHz”,p. 11, March 2012.[4] M.V.S.N. Prasad, Saurabh Gupta, M.M. Gupta “Comparison of 1.8GHz Cellular Outdoor
measurement with AWAS Electromagnetic Code and conventional Models over urban and suburbanregions of Nothern India”Antenna and Propagation Magazine, IEEE, 53 (2011) 76-85.
[5] A. R. Djordjevic, M. B. Bazdar, T. K. Sarkar and R. F. Harrington, AWAS for Windows Version 2.0:Analysis of Wire Antennas and Scatterers, Software and User s Manual, Norwood, MA, ArtechHouse, 2002 (ISBN: 1 -58053-488-0).
[6] Soil Dielectric Properties (Dielectric Materials and Applications)," NEC list and Web site:http://pe2bz.philpem. me.uklComm/-%20AntennalInfo-905-Misc/soildiel.htm; also from Arthur R.von Hippel (ed.), Dielectric Materials and Applications, Cambridge, MA, MIT Press, 1954.hhaya Dalela, M.V.S.N Prasad, P.K. Dalela and Rajeev Saraf “Analysis of WiMAX RadioMeasurements and Comparison With Some Models Over Dense Urban Western India at 2.3 GHz”IEEE Antenna and Wireless Propagation, 10 (2011).
International Journal of Next-Generation Networks (IJNGN) Vol.6, No.2, June 2014
51
.
Fig 1(a) : Near Field Distribution of GRJ Base Station from 100m to 200m
Fig 1(b) : Near Field Variation of GRJ Base Station from 200m to 400m
Fig 2(a) : Near Field Distribution of Base Station Antenna of height 20 meters from 100m to 200m
International Journal of Next-Generation Networks (IJNGN) Vol.6, No.2, June 2014
52
Fig 2(b): Near Field Distribution of Base Station Antenna of height 20 meters from 200m to 400m
TABLE IBase Station details
Sr.No.
Name of BaseStations
Height ofTransmitting
Antenna
Near FieldDistance (in
Km)1. Ajay-Amar (AAC) 37m 1.702. Arihant (AHT) 32m 1.473. Bootwala Bldg
(BTW)46m 2.11
4. Khethan Bhabhan(KTB)
31m 1.42
5. Giriraj (GRJ) 28m 1.286. Jeevan Dhara (JVD) 27m 1.247. Obelisk (OLK) 30m 1.38
TABLE IIIOther details of experimental site
Sr.No.
Other Details
1. Height of ReceivingAntenna
1.5m
2. Transmitted Power 43.8 dBm3. Average Height of
Building25m
4. Average Street Width 15m5. Average Separation
Between Buildings30m
International Journal of Next-Generation Networks (IJNGN) Vol.6, No.2, June 2014
53
TABLE IIIIIVariation in the near field of GRJ base station at 2300 MHz operating frequency
Sr.
No.
Near field distance (meters) ∆(Variations in the Electric Field )
Ht = 28m Ht =25m Ht = 23m Ht = 20m
1. 100-110 2 1.5 1.2 0.8
2. 120-130 1.5 1.33 1.0 0.6
3. 150-160 1.1 0.98 0.55 0.3
4. 170-180 1.0 0.74 0.47 0.13
5. 200-220 0.8 0.5 0.4 0.1
6. 240-260 0.65 0.47 0.28 0.08
7. 300-320 0.58 0.25 0.08 0.03
8. 400-500 0.14 0.1 0.03 0.015
Fig 3 : Variations in Near Field Distribution with change in height of Base Station antenna
Author(s)
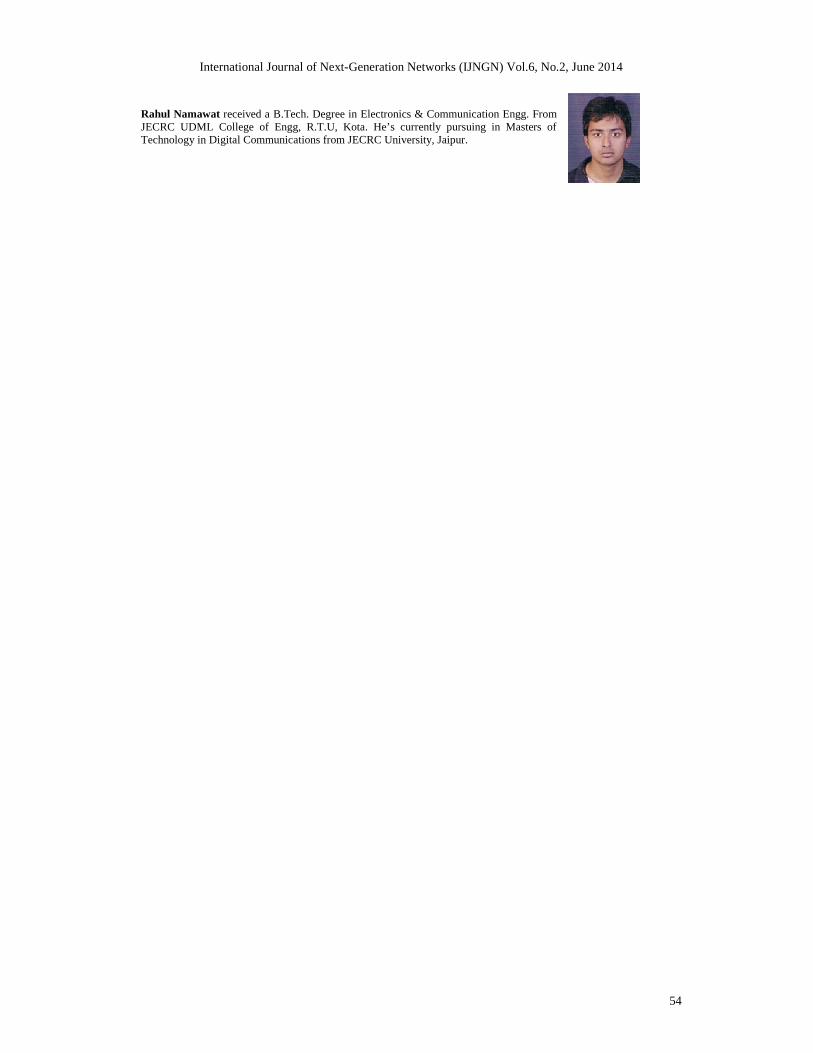
Chhaya Dalela received the B.Tech. degree in Electronics Engg. from H.B.T.I.,Kanpur,M.Tech. in Digital Communication from U.P.T.U.,Lucknow and completed her Ph.DIn channel characterisation and modelling. Presently, she is working with JSS Academy ofTechnical Education, Noida, as Associatet Professor in Electronics EngineeringDepartment. Her areas of research interest are channel measurements and modeling forbroadband communications, Cognitive Radio, Telecommunication network planning etc. Hehas published more than 30 research papers in national and international journals andconference proceedings.
Dr M V S N Prasad is presently working as a scientist in National Physical Laboratory.His research areas are radio channel measurements and modeling for mobile and fixedcommunications, mobile commnications in railway tunnels, microwave propagation,radiowave propagation related to broadcasting etc. He has developed active links withvarious user organizations in the area of telecommunications like VSNL, Railways,Dept. ofof Telecommunications, three wings of defense and rendered consultancy services in theseareas and established collaborations with many universities. He received the URSI youngscientist award in 1990, Best paper award from National Space Science Symposium in 1990, Best paper award fromBroadcast engineering society( India) in 1998 and 2001. Elected as a member of American Geophysical union underthe Lloyd V.Berkner fund. He participated in telecommunication and radio wave propagation workshops at theInternational centre for theoretical physics, Trieste, Italy. He has published several papers in national and internationaljournals and acted as a reviewer for many journals in this field.
International Journal of Next-Generation Networks (IJNGN) Vol.6, No.2, June 2014
54
Rahul Namawat received a B.Tech. Degree in Electronics & Communication Engg. FromJECRC UDML College of Engg, R.T.U, Kota. He’s currently pursuing in Masters ofTechnology in Digital Communications from JECRC University, Jaipur.
![Numerical Study of the Near-Field and Far-Field Properties ...optical Yagi–Uda nanoantenna was proposed in [47] with near-field coupling being used to feed the element at the resonance](https://img.pdfslide.us/doc/110x75/5f4f21963bde496e35386e65/numerical-study-of-the-near-field-and-far-field-properties-optical-yagiauda.jpg)