Embed Size (px)
Citation preview
Numerical Analysis of Gas Exchange system requirements in Heavy Duty DISI
process with Alternative fuels
SENTHIL KRISHNAN MAHENDAR
Master of Science Thesis
Stockholm, Sweden 2016

3
Numerical Analysis of Gas Exchange
system requirements in Heavy Duty DISI
process with Alternative fuels
Senthil Krishnan Mahendar
Master of Science Thesis MMK 2016:152 MFM166
KTH Industrial Engineering and Management
Machine Design
SE-100 44 STOCKHOLM

4
5
Examensarbete MMK 2016:152 MFM166
Numerical Analysis of Gas Exchange system
requirements in Heavy Duty DISI process with
Alternative fuels
Senthil Krishnan Mahendar
Godkänt
2016 – 09 – 01
Examinator
Anders Hultqvist
Handledare
Anders Hultqvist
Uppdragsgivare
Kontaktperson
Anders Hultqvist
Sammanfattning
Kommersiella fordon som använder dieselmotorer har hög bränsleeffektivitet men kräver dyra
efterbehandlingssystem och ökade driftskostnader. Ottomotorer har fördelen att använda en
enkel trevägskatalysator vilket gör ägande- och driftkostnader mycket attraktiva. Knack är en
begränsande faktor för användning av bensin i ottomotorer vilket begränsar deras effektivitet. I
turboöverladdade motorer med ”direct injection spark ignition” (DISI) skulle biobränslen som
alkoholer minska knackning (och därigenom förbättra effektiviteten) och bränslen innehållande
syre skulle också bidra till att minska sotbildning. I denna studie undersöks de förändringar som
krävs för att byta bränsle från diesel till alkoholer i DISI motorer. En numerisk analys används
för att välja ingångsparametrar sådana som inlopp och avgasventil fasning, EGR, förtändningen
och laddtryck krav för att uppnå bästa verkningsgrad. Inparametrarna optimeras genom en
genetisk algoritm med en GT-Power modell av motor som körs på bensin, etanol och metanol.
Vid toppbelastning, har det visat sig att alkoholerna ger något bättre termisk verkningsgrad än
bensin (33% bensin, 34% etanol och 35% metanol vid 1000 rpm full belastning) på grund av
lägre knack tendens. Laddtryck och EGR krav härleds och turbomatchning utförs genom att
skala tabellerna från Diesel VGT turboladdaren. Det visade sig att etanol och metanolfallet
skulle kräva en VGT turboladdare medan bensinfallet bara skulle behöva en wastegate
turboladdare. Med hjälp av informationen från denna studie är det möjligt att validera denna
modell på en encylindrig motor för vidare studier.

6
7
Master of Science Thesis MMK 2016:152 MFM166
Numerical Analysis of Gas Exchange system
requirements in Heavy Duty DISI process with
Alternative fuels
Senthil Krishnan Mahendar
Approved Date
2016 – 09 – 01
Examiner
Anders Hultqvist
Supervisor
Anders Hultqvist
Commissioner
Contact person
Anders Hultqvist
Abstract Commercial vehicles using diesel engines have high fuel efficiency but have a significant cost
impact due to expensive aftertreatment system and increased running costs. Spark ignition
engines have the advantage of using a simple three-way catalyst making cost of ownership and
operation very attractive. Knock is a limiting factor for using gasoline spark ignition engines
hence has poor efficiency. In turbocharged direct injection spark ignition (DISI) operation, bio-
fuels like alcohols would reduce knock (thereby improving efficiency) and the oxygenated fuel
would also help in reducing soot formation. In this study, the system modifications required to
make a fuel change from diesel to alcohols in DISI mode is analysed. A numerical analysis is
used to select input parameters such as inlet and exhaust cam phasing, EGR rate, spark advance
and boost pressure requirements for best efficiency of the engine in full load operating
conditions. The input parameters are optimised by a genetic algorithm in loop with a GT Power
model of the engine with gasoline, ethanol and methanol. At peak load, it is found that the
alcohols give slightly better thermal efficiency than gasoline (33% Gasoline; 34% Ethanol &
35% Methanol at 1000rpm full load) due to lower knock tendency. The boost pressure and EGR
rate requirements are derived and turbo matching is performed by scaling diesel VGT maps. It
was found that the ethanol and methanol case would require a VGT whereas gasoline would only
need a wastegate turbocharger. Using the information from this study, a testing scheme on a
single cylinder engine could be derived to validate this model for further study.

8
FOREWORD
9
I would first like to thank my thesis supervisor Prof. Anders Hultqvist for the support and
guidance I received over the course of the project. It is more important to acknowledge all the
opportunities and the trust he has given me in over a year that I had worked with him.
This thesis could never have been completed on time and I probably would have lost more hair if
not for the continuous help of Ted Holmberg, PhD student, Internal Combustion Engine. His
timely advice has enriched this thesis and it is always great to talk to him about cars and engines.
I would also like to thank Murtaza and Goutham for the inputs and insights that they gave me
over the course of this work.
I could never have started my studies if not for the unwavering support that my parents gave me.
I could never have finished it without the continuous encouragement my girlfriend Gayathri gave
me. Thank you.

10
NOMENCLATURE
11
Symbols & Abbreviations
VVT Variable Valve timing
EGR Exhaust Gas Recirculation
DISI Direct Injection Spark Ignition
GDI Gasoline Direct Injection
BSFC Brake Specific Fuel Consumption
BMEP Brake Mean Effective Pressure
τ Autoignition time delay
HC Hydrocarbon emissions
CO Carbon Monoxide Emissions
NOx Oxides of Nitrogen Emissions
PN Particulate Number
PM Particulate Matter, measured gravimetrically
CFR Cooperative fuel research engine for octane number characterisation
RON Research Octane Number
MON Motor Octane Number
AKI Anti-Knock Index – mean of RON and MON
VGT Variable geometry turbocharger
CA Crank angle
rpm Crank Rotations per minute
GHG Green House gas
Cp Specific heat capacity at constant pressure
WHTC World Harmonized Transient Cycle
CCV Cycle to cycle variations

12
TABLE OF CONTENTS
13
1. INTRODUCTION 14
1.1. Background 14
1.2. Objective and Methodology 15
1.3. DISI Engines 16
2. ENGINE MODELLING 18
2.1. Diesel Engine Modelling 18
2.2. Gasoline, Ethanol and Methanol Model 19
2.2.1. Combustion Model 21
2.2.2. Knock Prediction Model 23
2.2.3. Ethanol and Methanol Fuel 25
2.3. Parameter Optimisation 27
3. RESULTS 29
3.1. Compression Ratio Selection 29
3.2. Modelling Inaccuracies 29
3.3. Full Load BMEP results 32
3.4. Thermal Efficiency 36
3.5. EGR Loop 39
3.6. Variable Valve Timing 42
3.7. Turbocharging 43
4. DISCUSSION 49
4.1. Future Work 50
5. CONCLUSION 51
6. REFERENCES 52
7. APPENDIX 54
1. INTRODUCTION
14
1.1. Background
Commercial vehicles form a vital link in a growing economy and are strongly correlated to gross
domestic product (GDP) of a region. Compression Ignition (CI) diesel engines is a preferred fuel
choice for these engines as they achieve high efficiency returning reduced operating cost for fleet
owners. With advanced aftertreatment systems, diesel engines are also able to match Euro 6
emission regulations. The typical aftertreatment systems utilised in Euro 6 are Diesel Particulate
Filters (DPF) and Selective Catalytic Reduction (SCR) with aqueous urea dosing. These
aftertreatment systems in general constitute about 45% of the total engine cost but have managed
to reduce emissions to about 90% of Euro 3 standards [1]
Heavy Duty (HD) engines have undergone significant improvements and have nearly achieved
50% brake thermal efficiency [1]. Even so, the Green House Gas (GHG) emission and carbon
footprint can still be significantly reduced by using renewable bio-fuels. Two major contenders
for alternative biofuels are bioethanol and biodiesel. These can be produced from a variety of
sources that may be indigenous to a particular geographical area. Regulations of each country
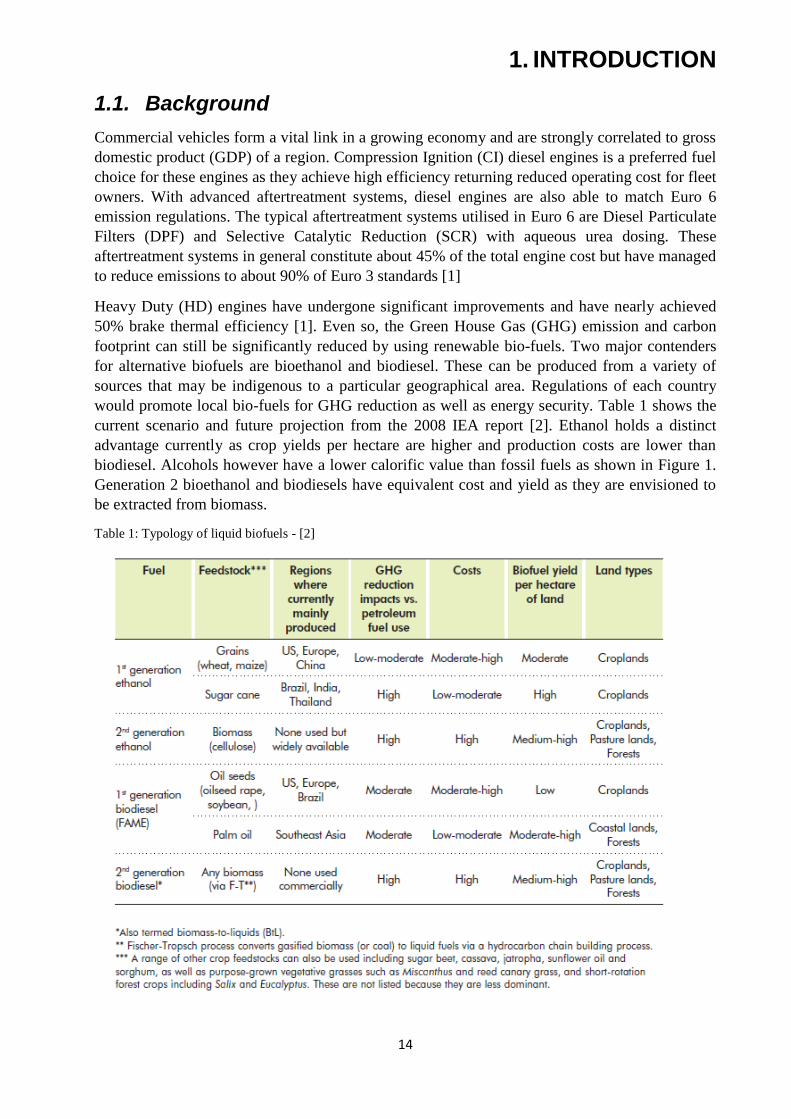
would promote local bio-fuels for GHG reduction as well as energy security. Table 1 shows the
current scenario and future projection from the 2008 IEA report [2]. Ethanol holds a distinct
advantage currently as crop yields per hectare are higher and production costs are lower than
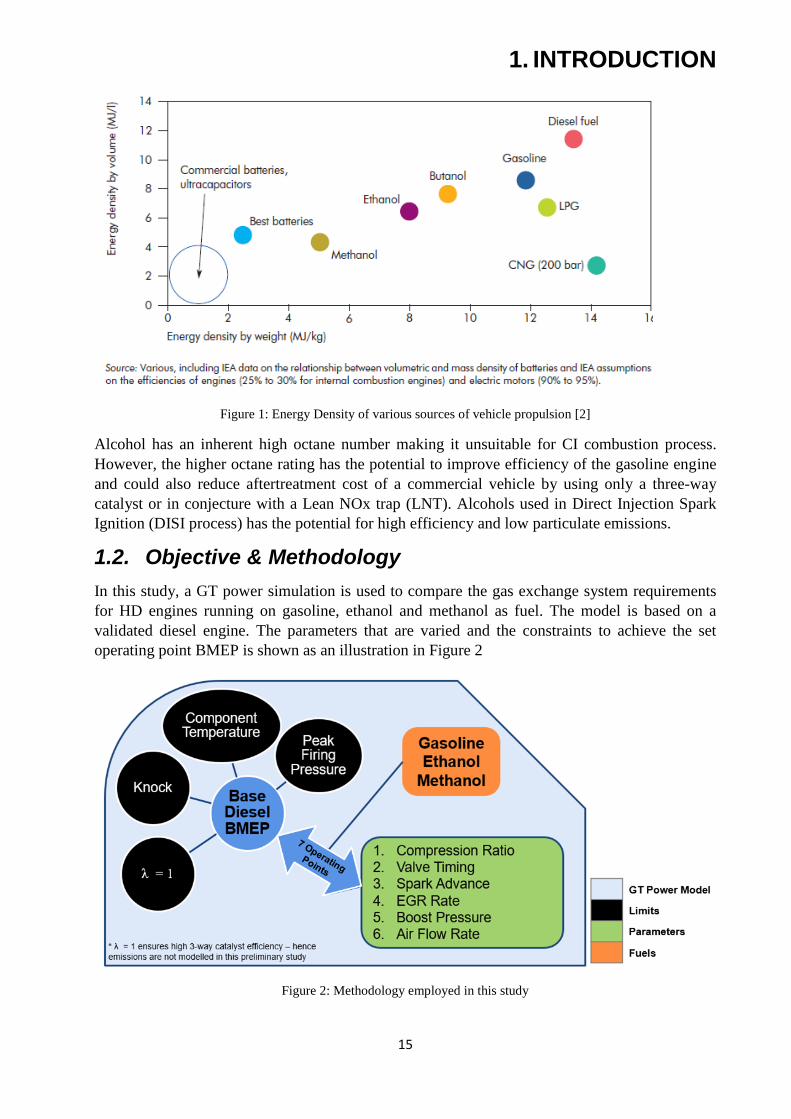
biodiesel. Alcohols however have a lower calorific value than fossil fuels as shown in Figure 1.
Generation 2 bioethanol and biodiesels have equivalent cost and yield as they are envisioned to
be extracted from biomass.
Table 1: Typology of liquid biofuels - [2]
1. INTRODUCTION
15
Figure 1: Energy Density of various sources of vehicle propulsion [2]
Alcohol has an inherent high octane number making it unsuitable for CI combustion process.
However, the higher octane rating has the potential to improve efficiency of the gasoline engine
and could also reduce aftertreatment cost of a commercial vehicle by using only a three-way
catalyst or in conjecture with a Lean NOx trap (LNT). Alcohols used in Direct Injection Spark
Ignition (DISI process) has the potential for high efficiency and low particulate emissions.
1.2. Objective & Methodology
In this study, a GT power simulation is used to compare the gas exchange system requirements
for HD engines running on gasoline, ethanol and methanol as fuel. The model is based on a
validated diesel engine. The parameters that are varied and the constraints to achieve the set
operating point BMEP is shown as an illustration in Figure 2
Figure 2: Methodology employed in this study
1. INTRODUCTION
16
Engine out emissions are not studied in this work as it is assumed that a three-way catalyst would
remove most emissions at tail pipe and λ = 1 would constrain it to operate at best efficiency
during homogenous operation.
This study would enable the system selection and give potential operating strategy of Variable
Valve Timing (VVT), turbocharger and Exhaust Gas Recirculation (EGR) etc. for future
experiments and validation of this model.
1.3. DISI Engines
In homogenous operation, fuel evaporation in the cylinder causes charge temperature to reduce
in DISI engines. This effect reduces knocking tendency leading to designs with higher
compression ratios and thereby thermal efficiency improvement of about 3%.
Additionally, DISI engines can operate on global lean mixtures to improve its part load fuel
efficiency. By injecting fuel directly into the combustion chamber, the fuel air mixture is
maintained close to stoichiometry near the spark plug ensuring good quality combustion
(stratification). This is achieved by a combination of charge air motion in the cylinder and piston
profiles. Injection timing is late in the cycle to achieve stratification. This means the throttling
losses would be lesser as fuel is metered and not air/fuel mixtures from the port.
Combined with reduction in throttling losses and lower heat losses, the DISI engine offers about
10% improvement in efficiency (in a passenger car driving cycle) compared to a similar port fuel
injection engine with gasoline fuel. [3]
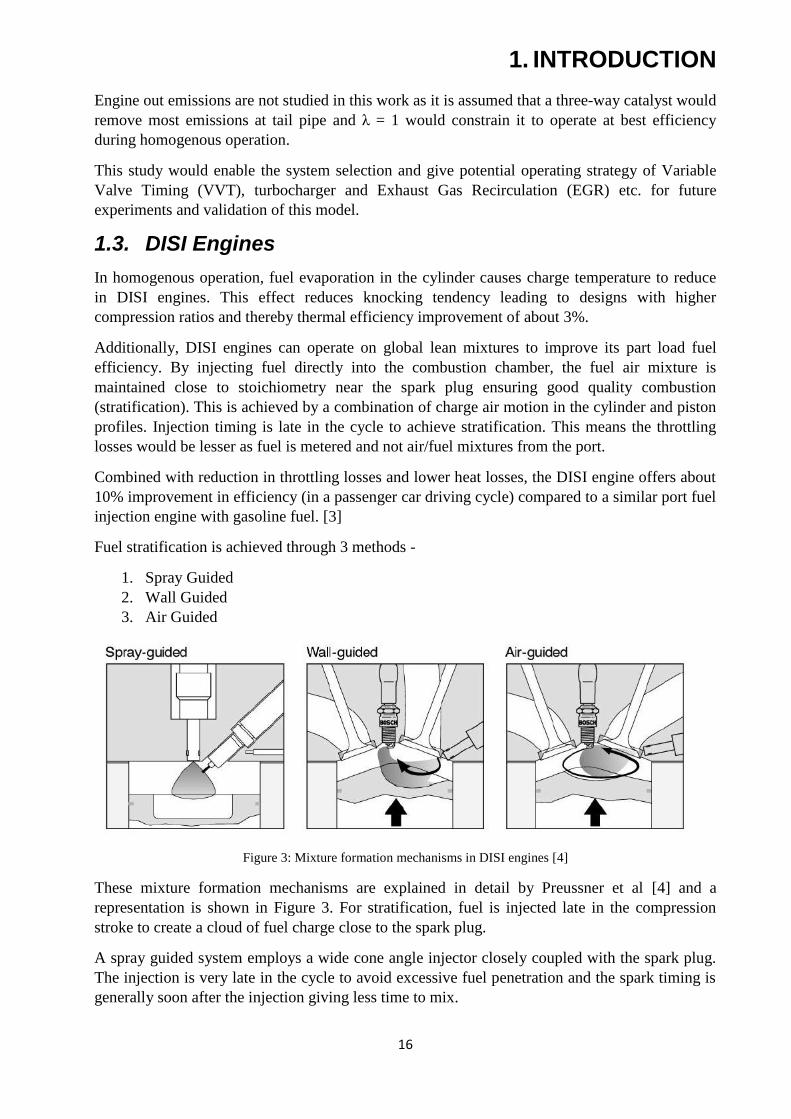
Fuel stratification is achieved through 3 methods -
1. Spray Guided
2. Wall Guided
3. Air Guided
Figure 3: Mixture formation mechanisms in DISI engines [4]
These mixture formation mechanisms are explained in detail by Preussner et al [4] and a
representation is shown in Figure 3. For stratification, fuel is injected late in the compression
stroke to create a cloud of fuel charge close to the spark plug.
A spray guided system employs a wide cone angle injector closely coupled with the spark plug.
The injection is very late in the cycle to avoid excessive fuel penetration and the spark timing is
generally soon after the injection giving less time to mix.
1. INTRODUCTION
17
In a wall guided mechanism, the piston wall is used to create a stratified cloud. It has been
reported to be the most popular in production engines in the first generation GDI engines [5][6].
This system has a narrow cone angle and injection is more advanced than the spray guided
system giving time to mix. Adverse effects have been noted with local rich regions and wall
wetting causing particulate and hydrocarbon emissions.
In an air guided system, the charge air flow (Tumble) is used to contain the stratified mixture.
The injection is more advanced than a wall guided system as tumble is broken down with
increasing compression. The fuel injection is coupled to charge air motion in a large range of air
flows to the cylinder. This makes air guided systems unsuitable for efficient control of the
engine.
Studies [7], [8] suggest that spray guided injection strategies has taken precedence as 4%
improvement in fuel efficiency was obtained as compared to wall guided systems with
comparable emission and combustion stability levels [9]. The drawback of stratified injection in
any mixing method is the formation nano-particulate matter which are now under scrutiny and
the particulate number is regulated by legislation [10]. Nano-particles occur predominantly in
stratified operation caused by insufficient mixing.
Using alcohols in DISI process offers 2 distinct advantages.
1. In homogenous operation, alcohols have a higher octane number and latent heat of
vaporisation than gasoline and could operate at higher compression ratios without
knocking.
2. In stratified operation, the oxygenated fuel could potentially limit particulate matter
formation. This opens possibilities of very low emissions with high thermal efficiency
when using alcohols in DISI engines.
Stratified injection operates at a global lean mixture. This implies that the three-way catalyst
would no longer be effective to reduce NOx emissions at part load. Manufacturers have often
utilised Lean NOx Traps (LNT) to reduce emissions while using lean DISI engines [11] [12].
LNT adsorbs oxides of nitrogen in lean engine operation and reduces them in a brief period of
regeneration using rich engine operation. The quantity it can adsorb against the time required to
purge in a drive cycle determines the fuel consumption advantage that can be extracted from a
lean GDI operation. This system is often used with a close-coupled three-way catalyst for
homogenous operation and to reduce HC emissions in transient cycles.
In this study, part load stratification is represented by a lean global lambda constrain through the
GT Power software. This will be elaborated in the subsequent chapters. Emissions are not
studied although it entails that an LNT is required in addition to a three-way catalyst for
emission control.
2. ENGINE MODELLING
18
2.1. Diesel Engine Modelling
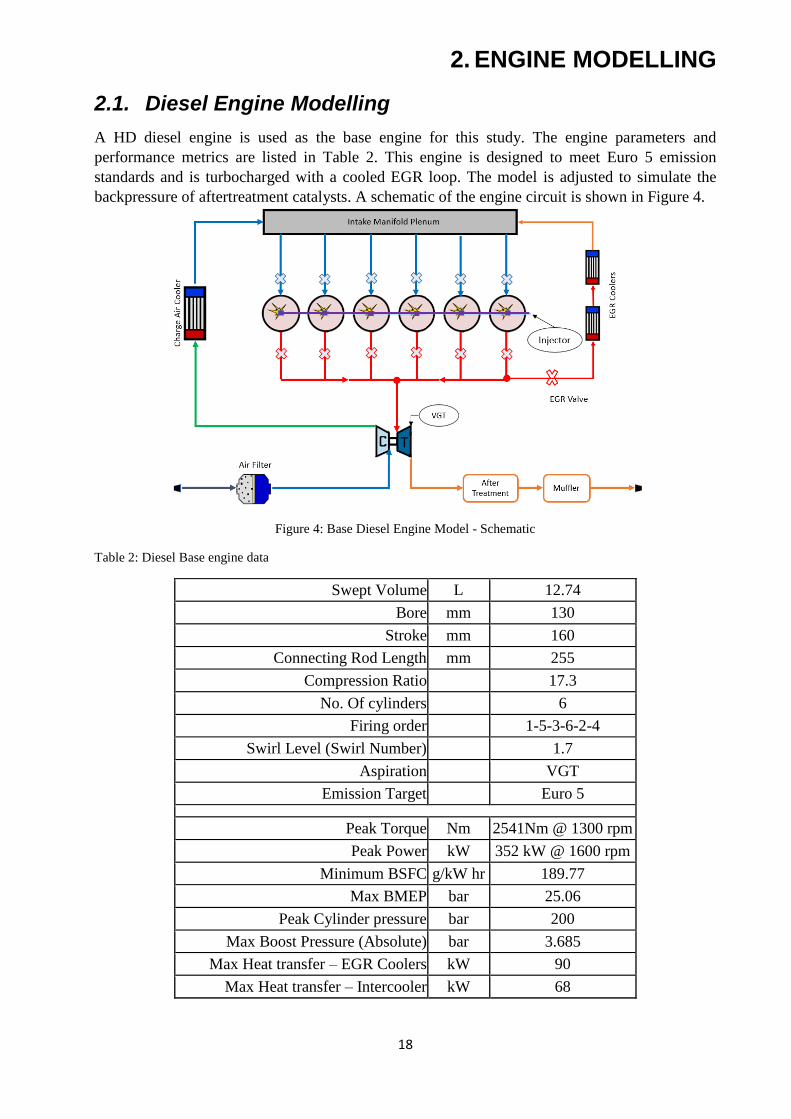
A HD diesel engine is used as the base engine for this study. The engine parameters and
performance metrics are listed in Table 2. This engine is designed to meet Euro 5 emission
standards and is turbocharged with a cooled EGR loop. The model is adjusted to simulate the
backpressure of aftertreatment catalysts. A schematic of the engine circuit is shown in Figure 4.
Figure 4: Base Diesel Engine Model - Schematic
Table 2: Diesel Base engine data
Swept Volume L 12.74
Bore mm 130
Stroke mm 160
Connecting Rod Length mm 255
Compression Ratio
17.3
No. Of cylinders
6
Firing order
1-5-3-6-2-4
Swirl Level (Swirl Number)
1.7
Aspiration VGT
Emission Target Euro 5
Peak Torque Nm 2541Nm @ 1300 rpm
Peak Power kW 352 kW @ 1600 rpm
Minimum BSFC g/kW hr 189.77
Max BMEP bar 25.06
Peak Cylinder pressure bar 200
Max Boost Pressure (Absolute) bar 3.685
Max Heat transfer – EGR Coolers kW 90
Max Heat transfer – Intercooler kW 68
2. ENGINE MODELLING
19
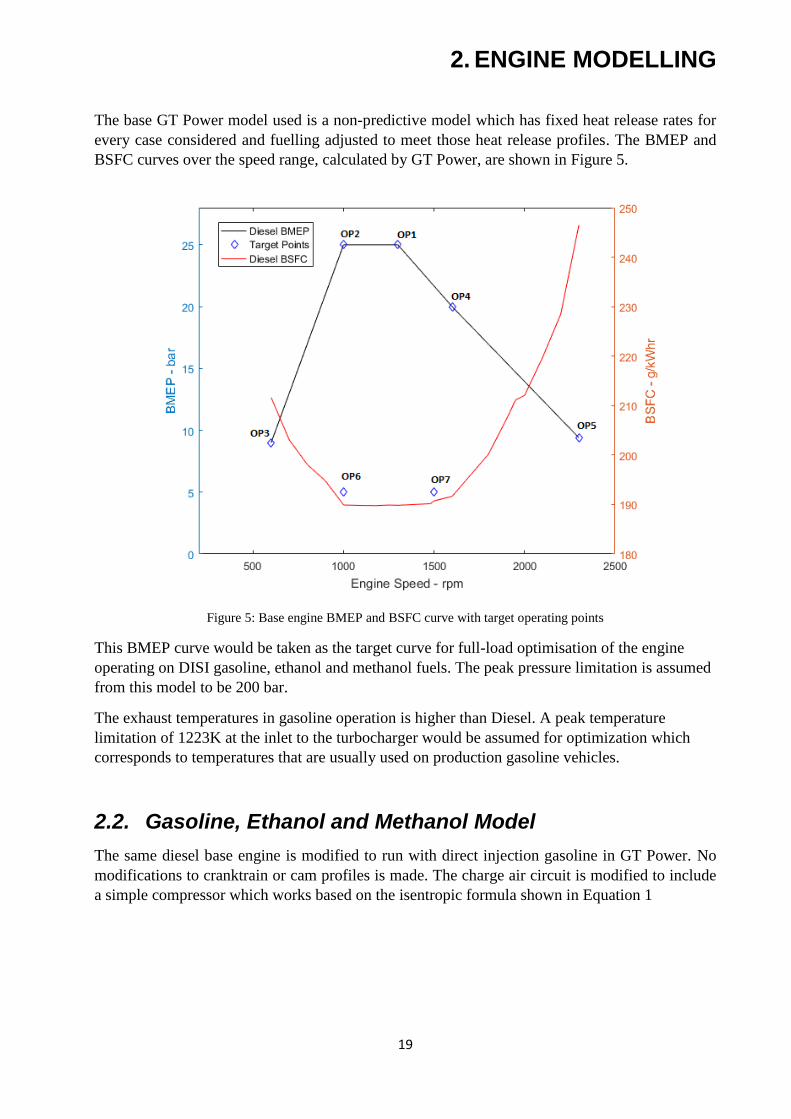
The base GT Power model used is a non-predictive model which has fixed heat release rates for
every case considered and fuelling adjusted to meet those heat release profiles. The BMEP and
BSFC curves over the speed range, calculated by GT Power, are shown in Figure 5.
Figure 5: Base engine BMEP and BSFC curve with target operating points
This BMEP curve would be taken as the target curve for full-load optimisation of the engine
operating on DISI gasoline, ethanol and methanol fuels. The peak pressure limitation is assumed
from this model to be 200 bar.
The exhaust temperatures in gasoline operation is higher than Diesel. A peak temperature
limitation of 1223K at the inlet to the turbocharger would be assumed for optimization which
corresponds to temperatures that are usually used on production gasoline vehicles.
2.2. Gasoline, Ethanol and Methanol Model
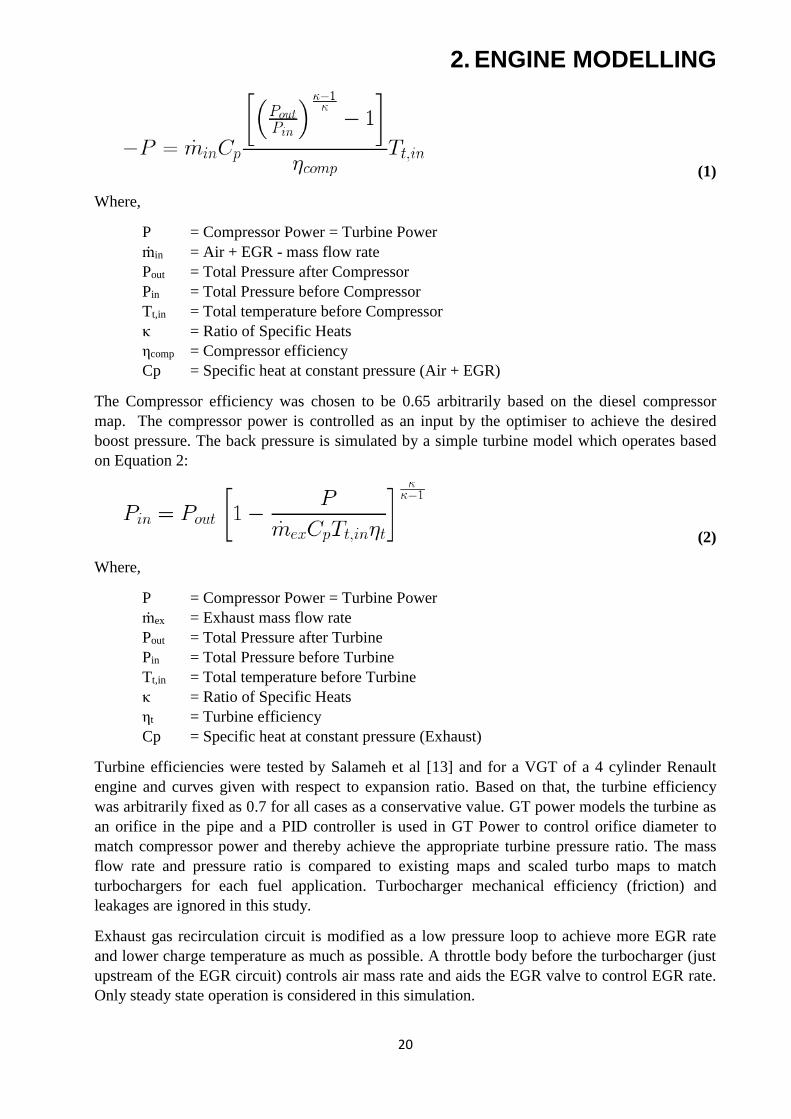
The same diesel base engine is modified to run with direct injection gasoline in GT Power. No
modifications to cranktrain or cam profiles is made. The charge air circuit is modified to include
a simple compressor which works based on the isentropic formula shown in Equation 1
2. ENGINE MODELLING
20
(1)
Where,
P = Compressor Power = Turbine Power
ṁin = Air + EGR - mass flow rate
Pout = Total Pressure after Compressor
Pin = Total Pressure before Compressor
Tt,in = Total temperature before Compressor
κ = Ratio of Specific Heats
ηcomp = Compressor efficiency
Cp = Specific heat at constant pressure (Air + EGR)
The Compressor efficiency was chosen to be 0.65 arbitrarily based on the diesel compressor
map. The compressor power is controlled as an input by the optimiser to achieve the desired
boost pressure. The back pressure is simulated by a simple turbine model which operates based
on Equation 2:
(2)
Where,
P = Compressor Power = Turbine Power
ṁex = Exhaust mass flow rate
Pout = Total Pressure after Turbine
Pin = Total Pressure before Turbine
Tt,in = Total temperature before Turbine
κ = Ratio of Specific Heats
ηt = Turbine efficiency
Cp = Specific heat at constant pressure (Exhaust)
Turbine efficiencies were tested by Salameh et al [13] and for a VGT of a 4 cylinder Renault
engine and curves given with respect to expansion ratio. Based on that, the turbine efficiency
was arbitrarily fixed as 0.7 for all cases as a conservative value. GT power models the turbine as
an orifice in the pipe and a PID controller is used in GT Power to control orifice diameter to
match compressor power and thereby achieve the appropriate turbine pressure ratio. The mass
flow rate and pressure ratio is compared to existing maps and scaled turbo maps to match
turbochargers for each fuel application. Turbocharger mechanical efficiency (friction) and
leakages are ignored in this study.
Exhaust gas recirculation circuit is modified as a low pressure loop to achieve more EGR rate
and lower charge temperature as much as possible. A throttle body before the turbocharger (just
upstream of the EGR circuit) controls air mass rate and aids the EGR valve to control EGR rate.
Only steady state operation is considered in this simulation.
2. ENGINE MODELLING
21
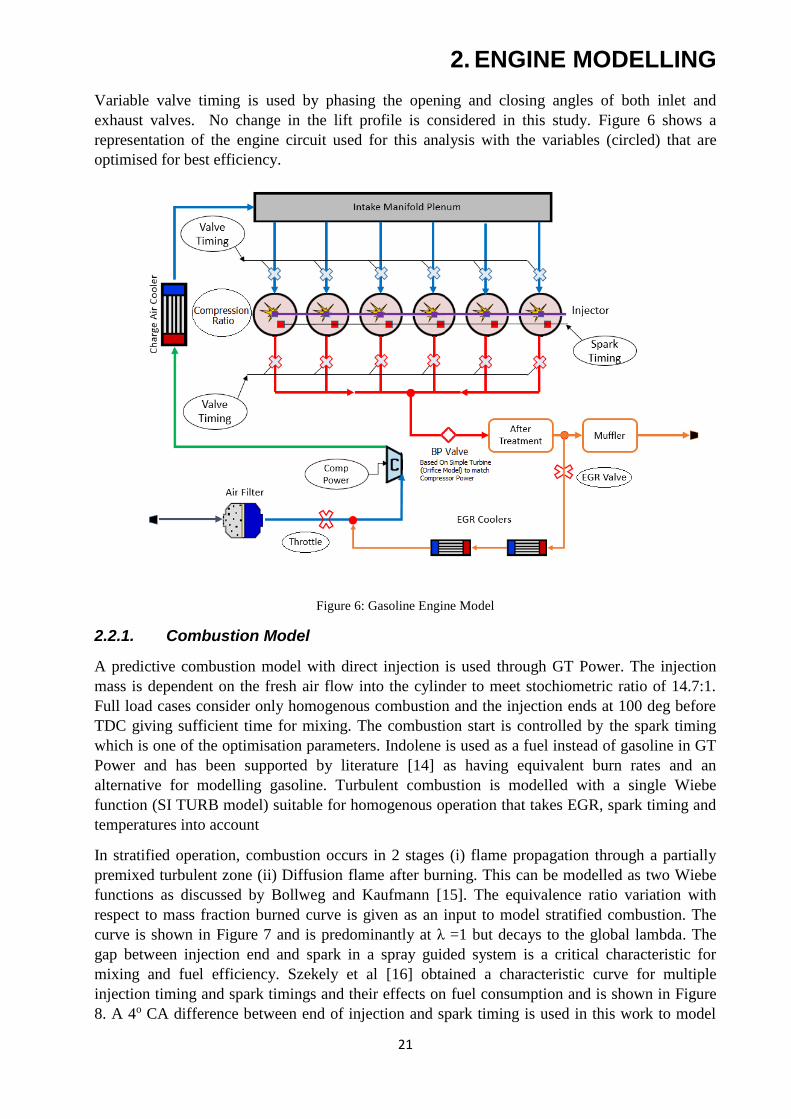
Variable valve timing is used by phasing the opening and closing angles of both inlet and
exhaust valves. No change in the lift profile is considered in this study. Figure 6 shows a
representation of the engine circuit used for this analysis with the variables (circled) that are
optimised for best efficiency.
Figure 6: Gasoline Engine Model
2.2.1. Combustion Model
A predictive combustion model with direct injection is used through GT Power. The injection
mass is dependent on the fresh air flow into the cylinder to meet stochiometric ratio of 14.7:1.
Full load cases consider only homogenous combustion and the injection ends at 100 deg before
TDC giving sufficient time for mixing. The combustion start is controlled by the spark timing
which is one of the optimisation parameters. Indolene is used as a fuel instead of gasoline in GT
Power and has been supported by literature [14] as having equivalent burn rates and an
alternative for modelling gasoline. Turbulent combustion is modelled with a single Wiebe
function (SI TURB model) suitable for homogenous operation that takes EGR, spark timing and
temperatures into account
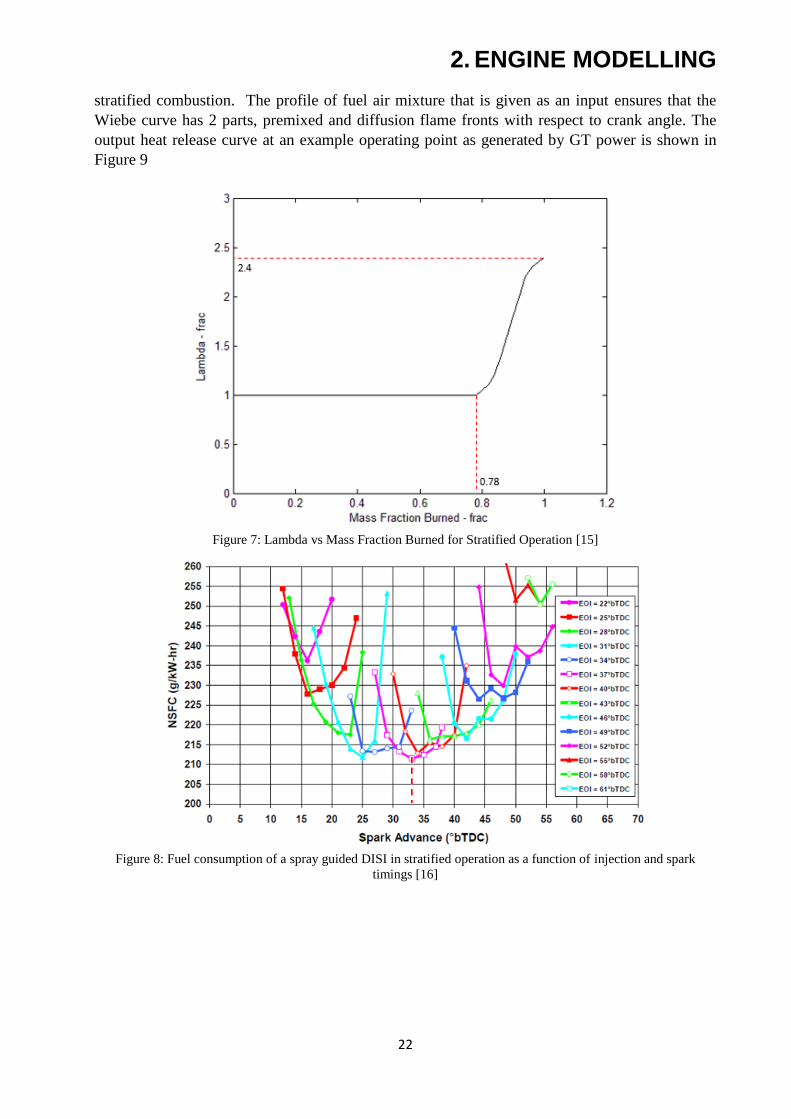
In stratified operation, combustion occurs in 2 stages (i) flame propagation through a partially
premixed turbulent zone (ii) Diffusion flame after burning. This can be modelled as two Wiebe
functions as discussed by Bollweg and Kaufmann [15]. The equivalence ratio variation with
respect to mass fraction burned curve is given as an input to model stratified combustion. The
curve is shown in Figure 7 and is predominantly at λ =1 but decays to the global lambda. The
gap between injection end and spark in a spray guided system is a critical characteristic for
mixing and fuel efficiency. Szekely et al [16] obtained a characteristic curve for multiple
injection timing and spark timings and their effects on fuel consumption and is shown in Figure
8. A 4o CA difference between end of injection and spark timing is used in this work to model
2. ENGINE MODELLING
22
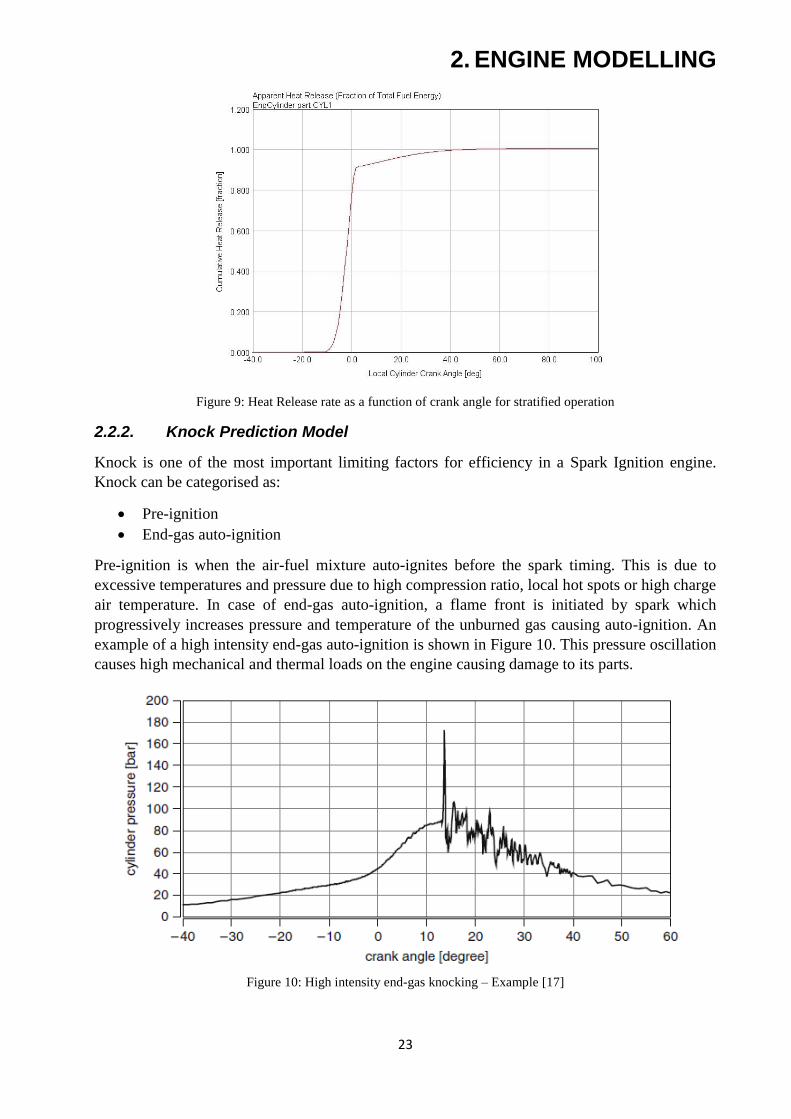
stratified combustion. The profile of fuel air mixture that is given as an input ensures that the
Wiebe curve has 2 parts, premixed and diffusion flame fronts with respect to crank angle. The
output heat release curve at an example operating point as generated by GT power is shown in
Figure 9
Figure 7: Lambda vs Mass Fraction Burned for Stratified Operation [15]
Figure 8: Fuel consumption of a spray guided DISI in stratified operation as a function of injection and spark
timings [16]
2. ENGINE MODELLING
23
Figure 9: Heat Release rate as a function of crank angle for stratified operation
2.2.2. Knock Prediction Model
Knock is one of the most important limiting factors for efficiency in a Spark Ignition engine.
Knock can be categorised as:
Pre-ignition
End-gas auto-ignition
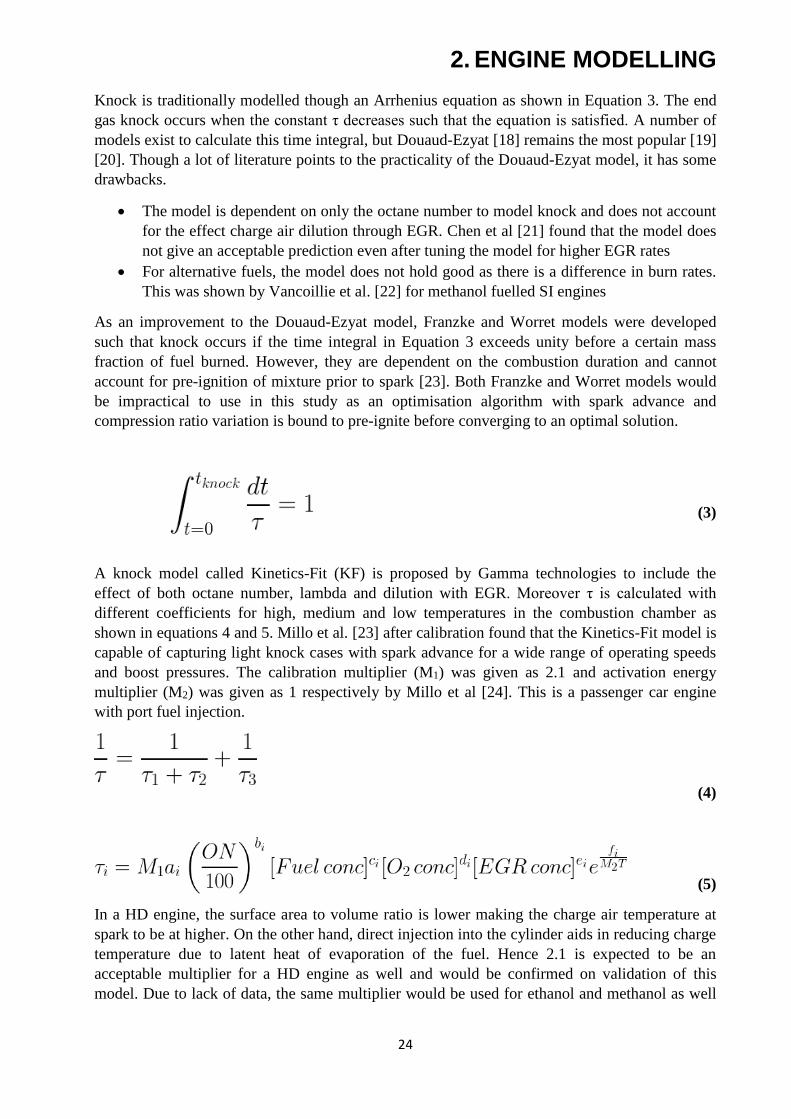
Pre-ignition is when the air-fuel mixture auto-ignites before the spark timing. This is due to
excessive temperatures and pressure due to high compression ratio, local hot spots or high charge
air temperature. In case of end-gas auto-ignition, a flame front is initiated by spark which
progressively increases pressure and temperature of the unburned gas causing auto-ignition. An
example of a high intensity end-gas auto-ignition is shown in Figure 10. This pressure oscillation
causes high mechanical and thermal loads on the engine causing damage to its parts.
Figure 10: High intensity end-gas knocking – Example [17]
2. ENGINE MODELLING
24
Knock is traditionally modelled though an Arrhenius equation as shown in Equation 3. The end
gas knock occurs when the constant τ decreases such that the equation is satisfied. A number of
models exist to calculate this time integral, but Douaud-Ezyat [18] remains the most popular [19]
[20]. Though a lot of literature points to the practicality of the Douaud-Ezyat model, it has some
drawbacks.
The model is dependent on only the octane number to model knock and does not account
for the effect charge air dilution through EGR. Chen et al [21] found that the model does
not give an acceptable prediction even after tuning the model for higher EGR rates
For alternative fuels, the model does not hold good as there is a difference in burn rates.
This was shown by Vancoillie et al. [22] for methanol fuelled SI engines
As an improvement to the Douaud-Ezyat model, Franzke and Worret models were developed
such that knock occurs if the time integral in Equation 3 exceeds unity before a certain mass
fraction of fuel burned. However, they are dependent on the combustion duration and cannot
account for pre-ignition of mixture prior to spark [23]. Both Franzke and Worret models would
be impractical to use in this study as an optimisation algorithm with spark advance and
compression ratio variation is bound to pre-ignite before converging to an optimal solution.
(3)
A knock model called Kinetics-Fit (KF) is proposed by Gamma technologies to include the
effect of both octane number, lambda and dilution with EGR. Moreover τ is calculated with
different coefficients for high, medium and low temperatures in the combustion chamber as
shown in equations 4 and 5. Millo et al. [23] after calibration found that the Kinetics-Fit model is
capable of capturing light knock cases with spark advance for a wide range of operating speeds
and boost pressures. The calibration multiplier (M1) was given as 2.1 and activation energy
multiplier (M2) was given as 1 respectively by Millo et al [24]. This is a passenger car engine
with port fuel injection.
(4)
(5)
In a HD engine, the surface area to volume ratio is lower making the charge air temperature at
spark to be at higher. On the other hand, direct injection into the cylinder aids in reducing charge
temperature due to latent heat of evaporation of the fuel. Hence 2.1 is expected to be an
acceptable multiplier for a HD engine as well and would be confirmed on validation of this
model. Due to lack of data, the same multiplier would be used for ethanol and methanol as well
2. ENGINE MODELLING
25
with only octane number varied between the models. An octane number (AKI) of 90 is used for
the gasoline model.
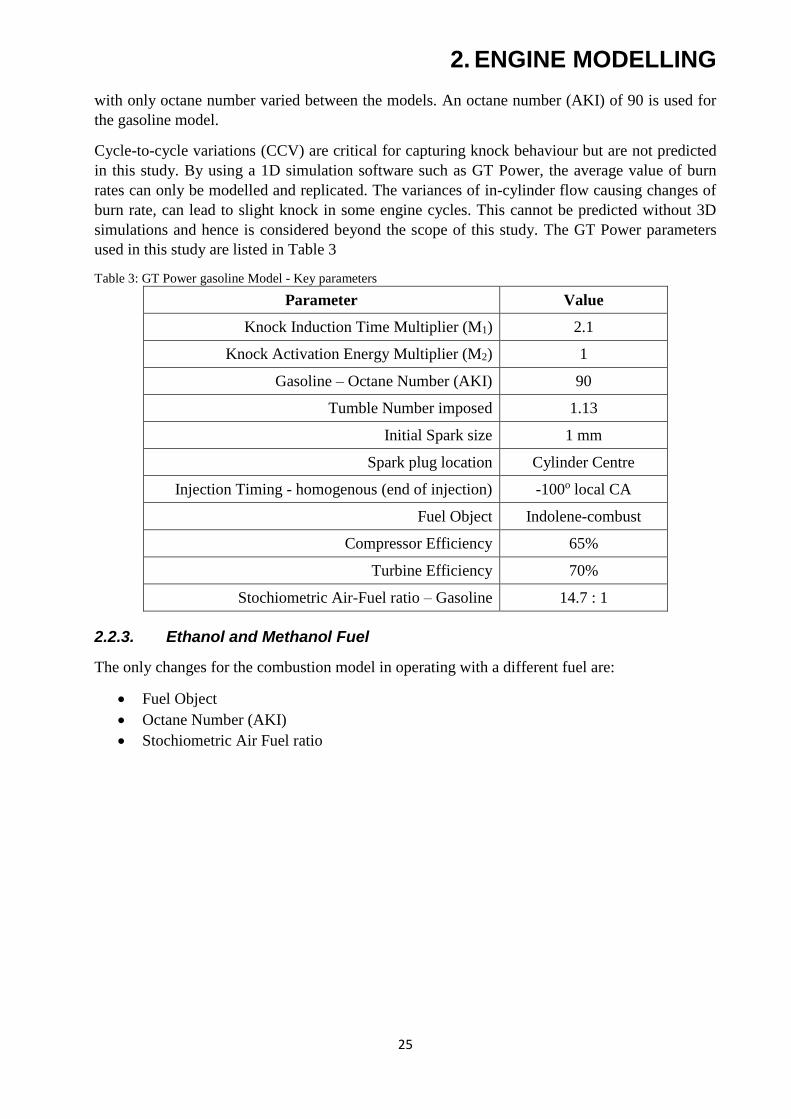
Cycle-to-cycle variations (CCV) are critical for capturing knock behaviour but are not predicted
in this study. By using a 1D simulation software such as GT Power, the average value of burn
rates can only be modelled and replicated. The variances of in-cylinder flow causing changes of
burn rate, can lead to slight knock in some engine cycles. This cannot be predicted without 3D
simulations and hence is considered beyond the scope of this study. The GT Power parameters
used in this study are listed in Table 3
Table 3: GT Power gasoline Model - Key parameters
Parameter Value
Knock Induction Time Multiplier (M1) 2.1
Knock Activation Energy Multiplier (M2) 1
Gasoline – Octane Number (AKI) 90
Tumble Number imposed 1.13
Initial Spark size 1 mm
Spark plug location Cylinder Centre
Injection Timing - homogenous (end of injection) -100o local CA
Fuel Object Indolene-combust
Compressor Efficiency 65%
Turbine Efficiency 70%
Stochiometric Air-Fuel ratio – Gasoline 14.7 : 1
2.2.3. Ethanol and Methanol Fuel
The only changes for the combustion model in operating with a different fuel are:
Fuel Object
Octane Number (AKI)
Stochiometric Air Fuel ratio

2. ENGINE MODELLING
26
The properties for this are given in Table 4
Table 4: Ethanol and methanol Fuel properties in comparison to gasoline [25]
Property Gasoline Methanol Ethanol
Boiling Point, oC 35-210 65 78
Lower heating Value, MJ/kg 42.7 19.9 26.8
Heat of Vaporisation, MJ/kg 0.18 1.17 0.93
Stochiometric Air fuel ratio 14.7:1 6.45:1 9:1
Research Octane Number
(RON) 90-100 109 109
Motor Octane Number (MON) 80-90 89 90
Mean of RON and MON (AKI) [Octane Number used in this study]
90 99 99.5
Peak Laminar Flame Speed at
300K and 1 bar pressure
(m/s) [26]
0.455 0.5 0.47
GT Power – Fuel Object Indolene-combust Methanol-combust Ethanol-combust
Figure 11: Comparison of laminar flame speeds for gasoline, ethanol and methanol [26]
There was no literature using a validated Kinetics Fit knock model using ethanol and methanol
fuels in a SI engine. Hence, only the octane rating in the knock model is changed keeping the
tuning multiplier (M1 & M2) same as gasoline. The additional reduction of knock propensity
would be given by the increase of specified octane number and the temperature reduction due to
higher heat of vaporisation on the short alcohol fuels. Knock models of all three fuels would
have to be validated and tuned individually to obtain the best predictive model.
2. ENGINE MODELLING
27
In part load conditions, the same profile of lambda over mass fraction burned shown in Figure 7
would be used for ethanol and methanol. This is a simplification as the curve and final lambda
value may not be equivalent to gasoline as the fuel is oxygenated and the burn rates are lower at
lean global equivalence ratios as shown in Figure 11
Although the octane numbers of both alcohol fuels are equivalent, the standard CFR Engine tests
do not account for the heat of vaporisation of these fuels. Hence anti knock characteristics of this
fuel might be higher than what the octane numbers suggest.
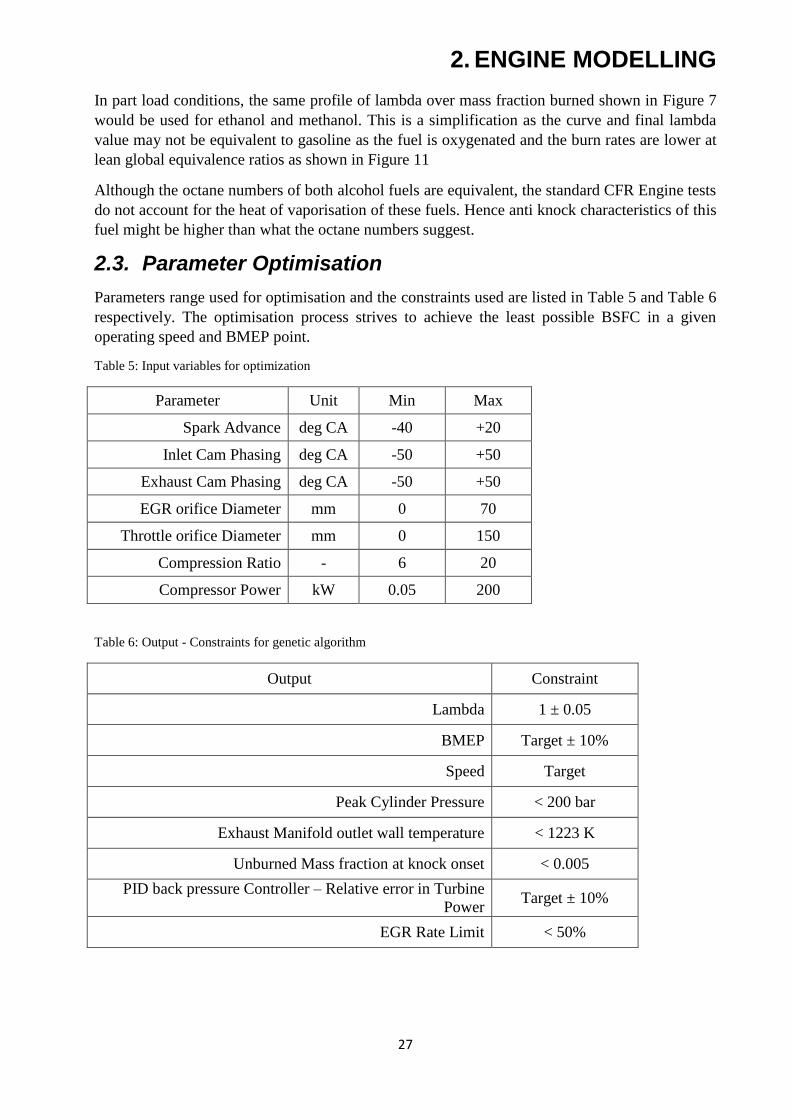
2.3. Parameter Optimisation
Parameters range used for optimisation and the constraints used are listed in Table 5 and Table 6
respectively. The optimisation process strives to achieve the least possible BSFC in a given
operating speed and BMEP point.
Table 5: Input variables for optimization
Parameter Unit Min Max
Spark Advance deg CA -40 +20
Inlet Cam Phasing deg CA -50 +50
Exhaust Cam Phasing deg CA -50 +50
EGR orifice Diameter mm 0 70
Throttle orifice Diameter mm 0 150
Compression Ratio - 6 20
Compressor Power kW 0.05 200
Table 6: Output - Constraints for genetic algorithm
Output Constraint
Lambda 1 ± 0.05
BMEP Target ± 10%
Speed Target
Peak Cylinder Pressure < 200 bar
Exhaust Manifold outlet wall temperature < 1223 K
Unburned Mass fraction at knock onset < 0.005
PID back pressure Controller – Relative error in Turbine
Power Target ± 10%
EGR Rate Limit < 50%
2. ENGINE MODELLING
28
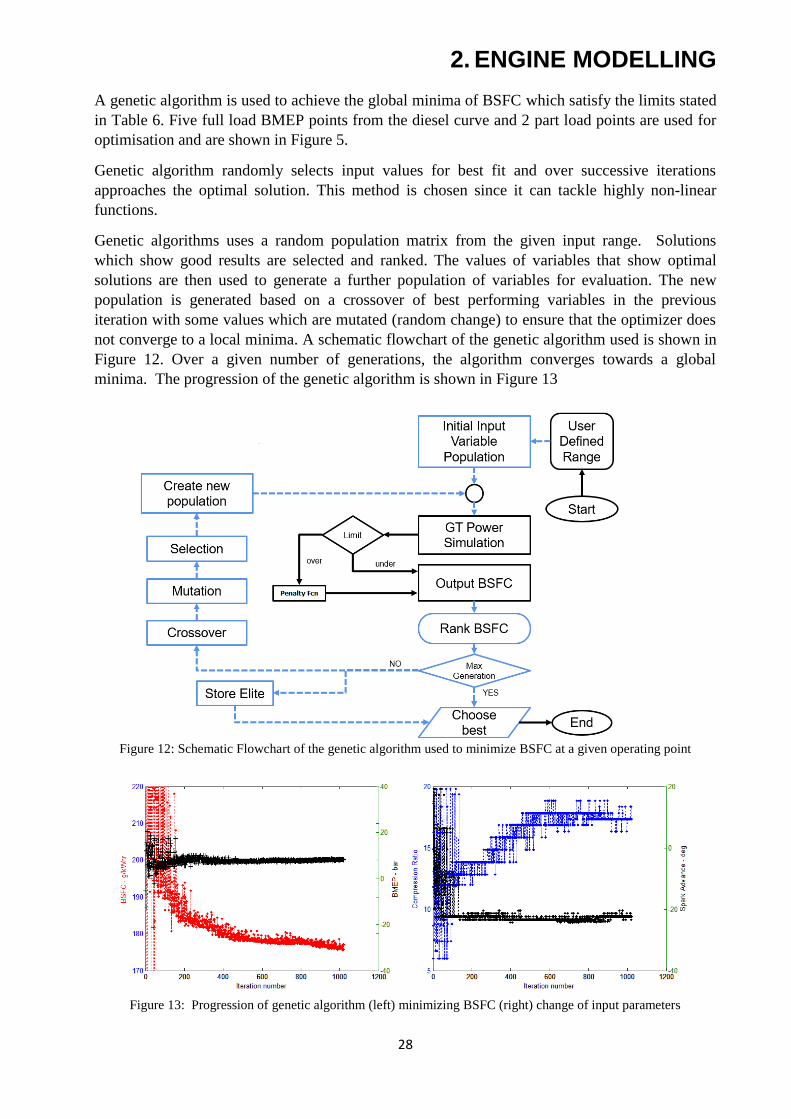
A genetic algorithm is used to achieve the global minima of BSFC which satisfy the limits stated
in Table 6. Five full load BMEP points from the diesel curve and 2 part load points are used for
optimisation and are shown in Figure 5.
Genetic algorithm randomly selects input values for best fit and over successive iterations
approaches the optimal solution. This method is chosen since it can tackle highly non-linear
functions.
Genetic algorithms uses a random population matrix from the given input range. Solutions
which show good results are selected and ranked. The values of variables that show optimal
solutions are then used to generate a further population of variables for evaluation. The new
population is generated based on a crossover of best performing variables in the previous
iteration with some values which are mutated (random change) to ensure that the optimizer does
not converge to a local minima. A schematic flowchart of the genetic algorithm used is shown in
Figure 12. Over a given number of generations, the algorithm converges towards a global
minima. The progression of the genetic algorithm is shown in Figure 13
Figure 12: Schematic Flowchart of the genetic algorithm used to minimize BSFC at a given operating point
Figure 13: Progression of genetic algorithm (left) minimizing BSFC (right) change of input parameters
3. RESULTS
29
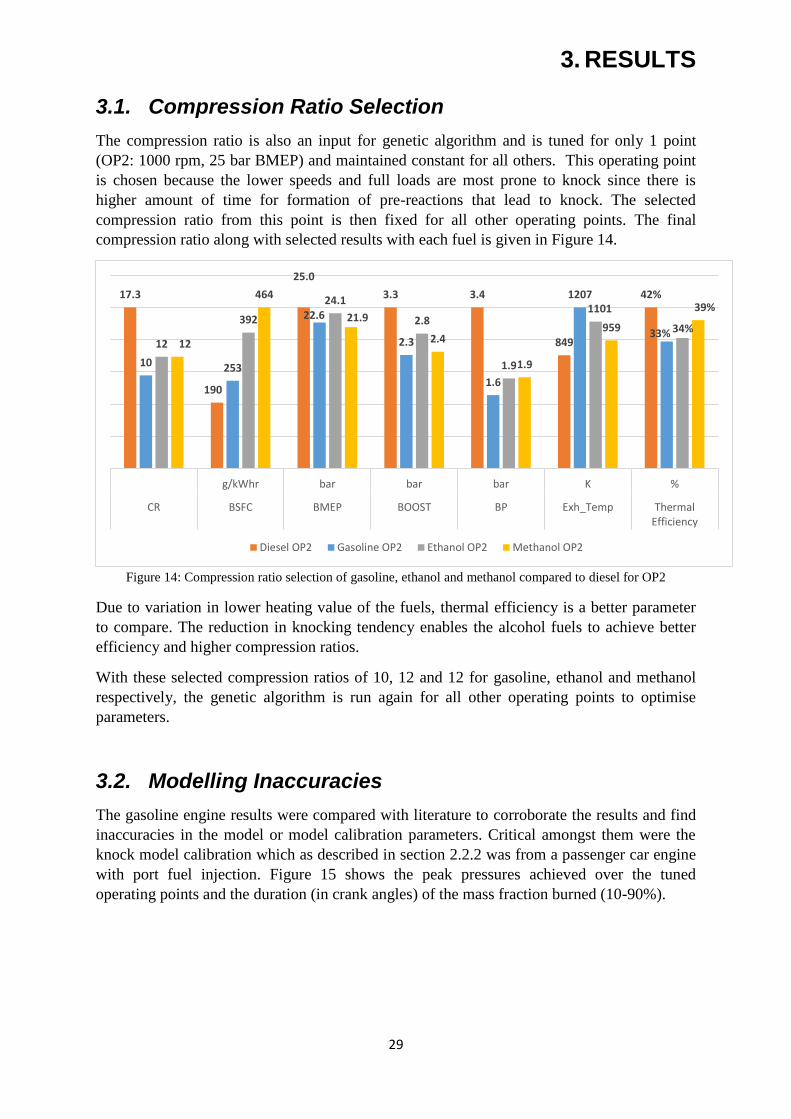
3.1. Compression Ratio Selection
The compression ratio is also an input for genetic algorithm and is tuned for only 1 point
(OP2: 1000 rpm, 25 bar BMEP) and maintained constant for all others. This operating point
is chosen because the lower speeds and full loads are most prone to knock since there is
higher amount of time for formation of pre-reactions that lead to knock. The selected
compression ratio from this point is then fixed for all other operating points. The final
compression ratio along with selected results with each fuel is given in Figure 14.
Figure 14: Compression ratio selection of gasoline, ethanol and methanol compared to diesel for OP2
Due to variation in lower heating value of the fuels, thermal efficiency is a better parameter
to compare. The reduction in knocking tendency enables the alcohol fuels to achieve better
efficiency and higher compression ratios.
With these selected compression ratios of 10, 12 and 12 for gasoline, ethanol and methanol
respectively, the genetic algorithm is run again for all other operating points to optimise
parameters.
3.2. Modelling Inaccuracies
The gasoline engine results were compared with literature to corroborate the results and find
inaccuracies in the model or model calibration parameters. Critical amongst them were the
knock model calibration which as described in section 2.2.2 was from a passenger car engine
with port fuel injection. Figure 15 shows the peak pressures achieved over the tuned
operating points and the duration (in crank angles) of the mass fraction burned (10-90%).
17.3
190
25.0
3.3 3.4
849
42%
10 253
22.6
2.3
1.6
1207
33%12
392
24.1
2.8
1.9
1101
34%
12
464
21.9
2.4
1.9
959
39%
g/kWhr bar bar bar K %
CR BSFC BMEP BOOST BP Exh_Temp ThermalEfficiency
Diesel OP2 Gasoline OP2 Ethanol OP2 Methanol OP2
3. RESULTS
30
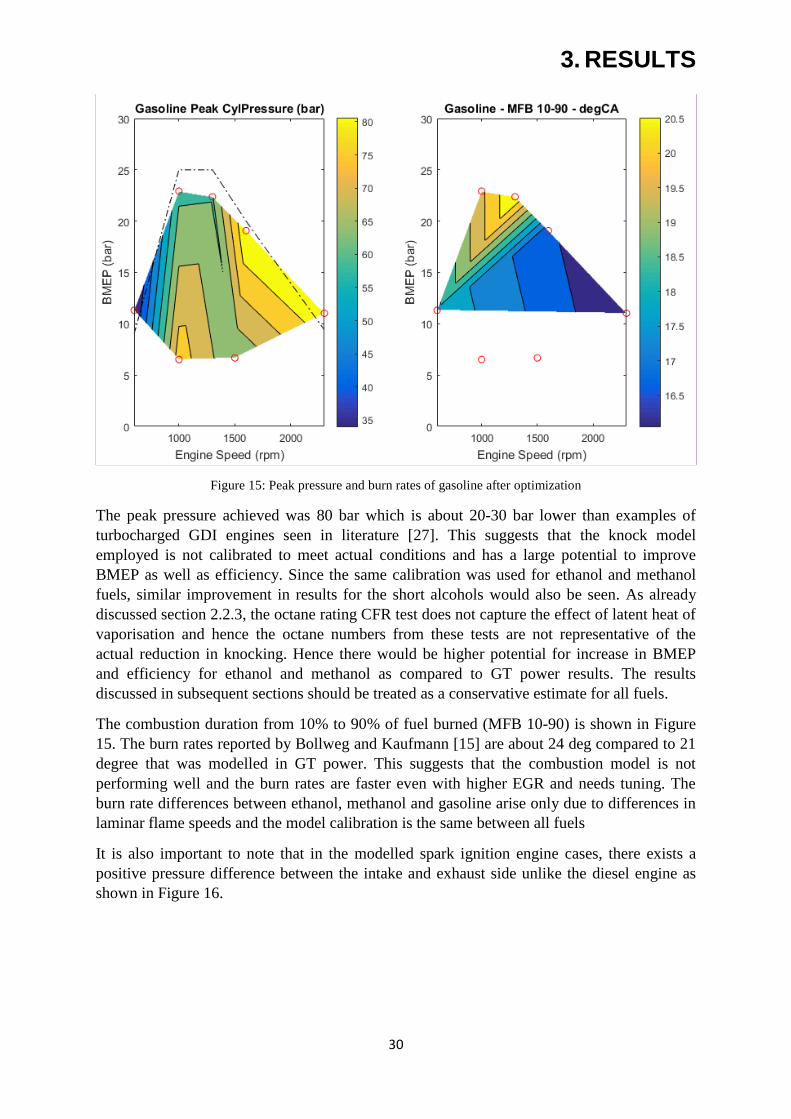
Figure 15: Peak pressure and burn rates of gasoline after optimization
The peak pressure achieved was 80 bar which is about 20-30 bar lower than examples of
turbocharged GDI engines seen in literature [27]. This suggests that the knock model
employed is not calibrated to meet actual conditions and has a large potential to improve
BMEP as well as efficiency. Since the same calibration was used for ethanol and methanol
fuels, similar improvement in results for the short alcohols would also be seen. As already
discussed section 2.2.3, the octane rating CFR test does not capture the effect of latent heat of
vaporisation and hence the octane numbers from these tests are not representative of the
actual reduction in knocking. Hence there would be higher potential for increase in BMEP
and efficiency for ethanol and methanol as compared to GT power results. The results
discussed in subsequent sections should be treated as a conservative estimate for all fuels.
The combustion duration from 10% to 90% of fuel burned (MFB 10-90) is shown in Figure
15. The burn rates reported by Bollweg and Kaufmann [15] are about 24 deg compared to 21
degree that was modelled in GT power. This suggests that the combustion model is not
performing well and the burn rates are faster even with higher EGR and needs tuning. The
burn rate differences between ethanol, methanol and gasoline arise only due to differences in
laminar flame speeds and the model calibration is the same between all fuels
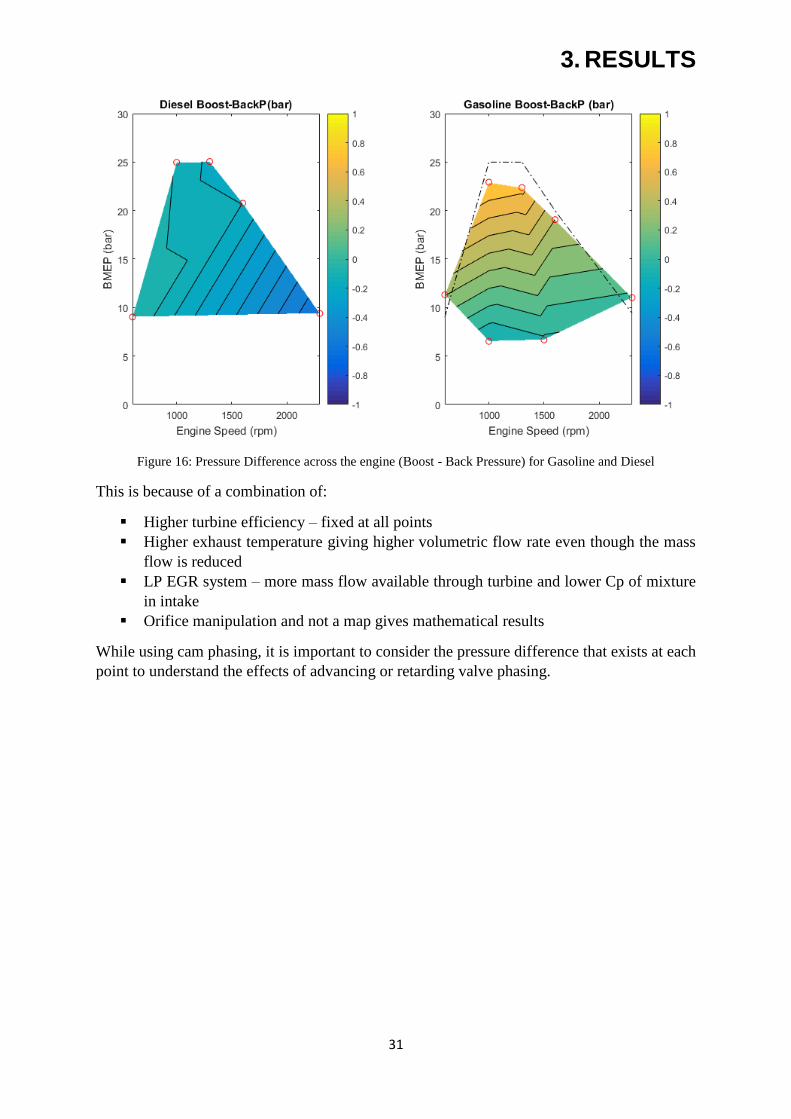
It is also important to note that in the modelled spark ignition engine cases, there exists a
positive pressure difference between the intake and exhaust side unlike the diesel engine as
shown in Figure 16.
3. RESULTS
31
Figure 16: Pressure Difference across the engine (Boost - Back Pressure) for Gasoline and Diesel
This is because of a combination of:
Higher turbine efficiency – fixed at all points
Higher exhaust temperature giving higher volumetric flow rate even though the mass
flow is reduced
LP EGR system – more mass flow available through turbine and lower Cp of mixture
in intake
Orifice manipulation and not a map gives mathematical results
While using cam phasing, it is important to consider the pressure difference that exists at each
point to understand the effects of advancing or retarding valve phasing.
3. RESULTS
32
3.3. Full Load BMEP results
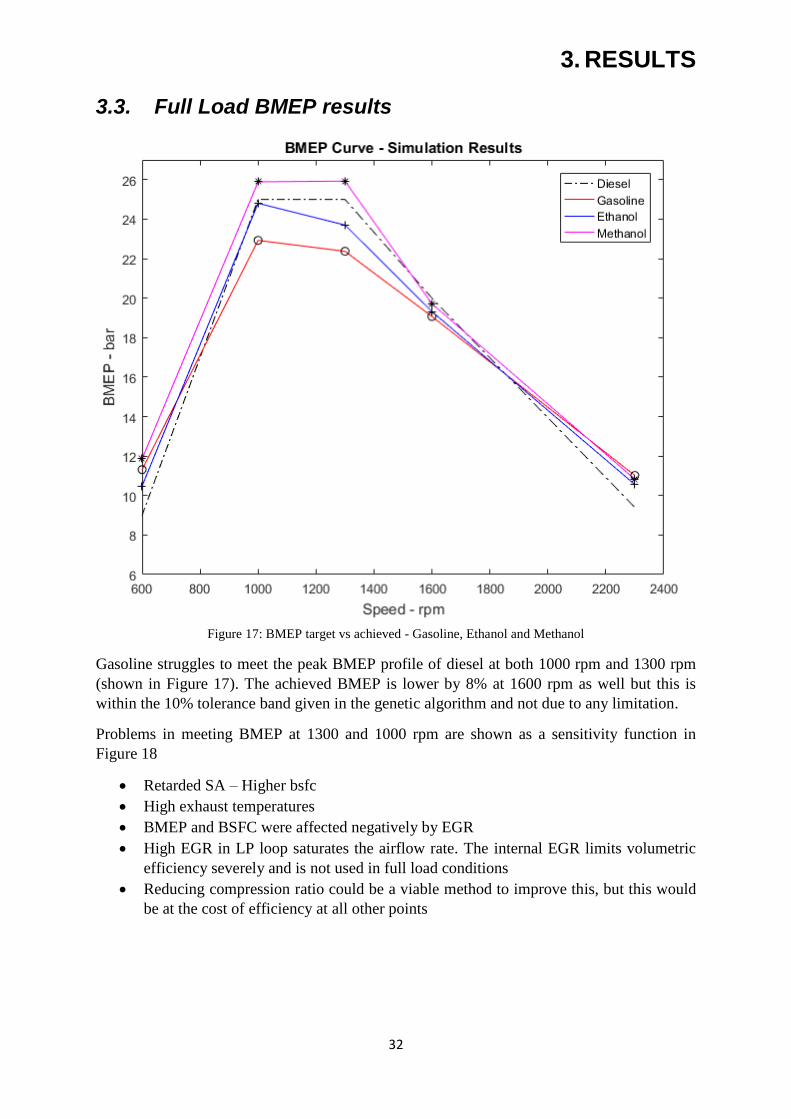
Figure 17: BMEP target vs achieved - Gasoline, Ethanol and Methanol
Gasoline struggles to meet the peak BMEP profile of diesel at both 1000 rpm and 1300 rpm
(shown in Figure 17). The achieved BMEP is lower by 8% at 1600 rpm as well but this is
within the 10% tolerance band given in the genetic algorithm and not due to any limitation.
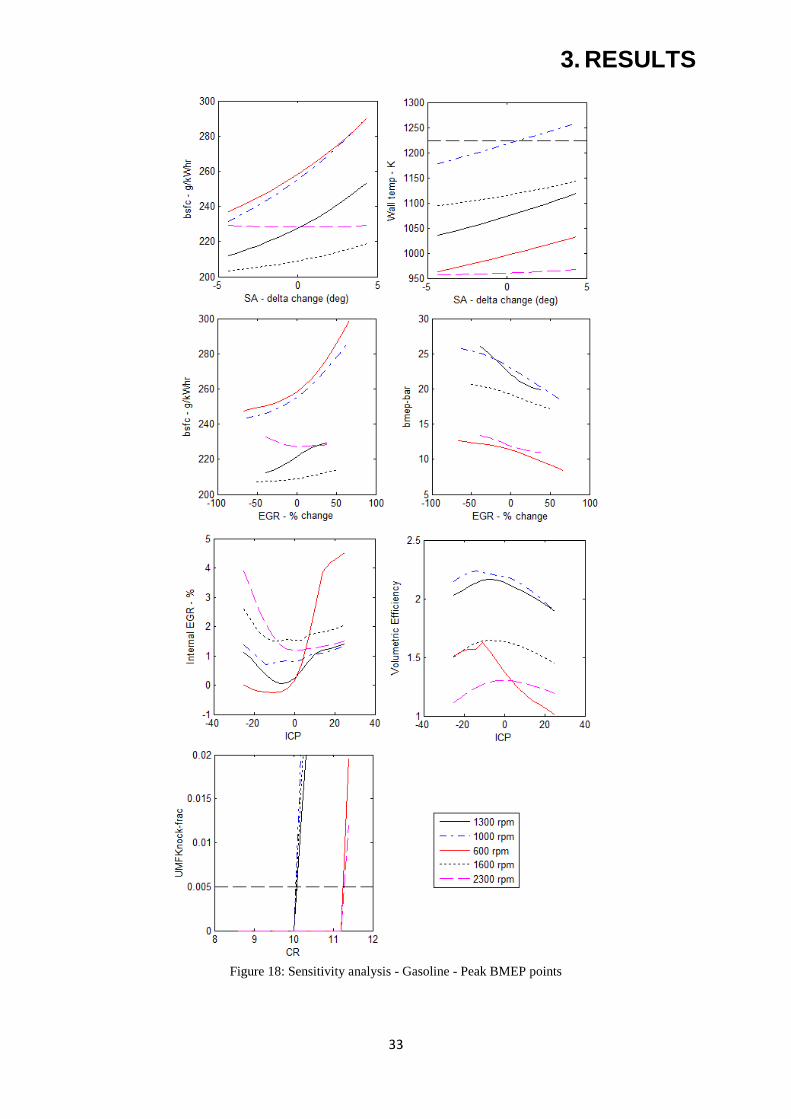
Problems in meeting BMEP at 1300 and 1000 rpm are shown as a sensitivity function in
Figure 18
Retarded SA – Higher bsfc
High exhaust temperatures
BMEP and BSFC were affected negatively by EGR
High EGR in LP loop saturates the airflow rate. The internal EGR limits volumetric
efficiency severely and is not used in full load conditions
Reducing compression ratio could be a viable method to improve this, but this would
be at the cost of efficiency at all other points
3. RESULTS
33
Figure 18: Sensitivity analysis - Gasoline - Peak BMEP points
3. RESULTS
34
UMF knock is a parameter used to estimate knock intensity. Mild knock as detected by
the piezoelectric knock sensor is characterised by 0.5% of fuel left unburned when knock
is detected [24]. In fraction form, this limit is denoted by 0.005 when knock onset is
described by the model. Reducing CR will reduce knock propensity and there is potential
to improve BMEP at peak loads.
At 1300 rpm in gasoline, there is possibility to retard spark and improve BMEP as the
exhaust gas temperature is not near the limit. This is a flaw with the penalty function used
in the genetic algorithm as the BSFC penalty added is relatively smaller than the actual
BSFC increase when the target BMEP is met.
Ethanol & methanol fuels meet the target BMEP (from diesel) within the 10% BMEP
margin that was given for the genetic algorithm to converge.
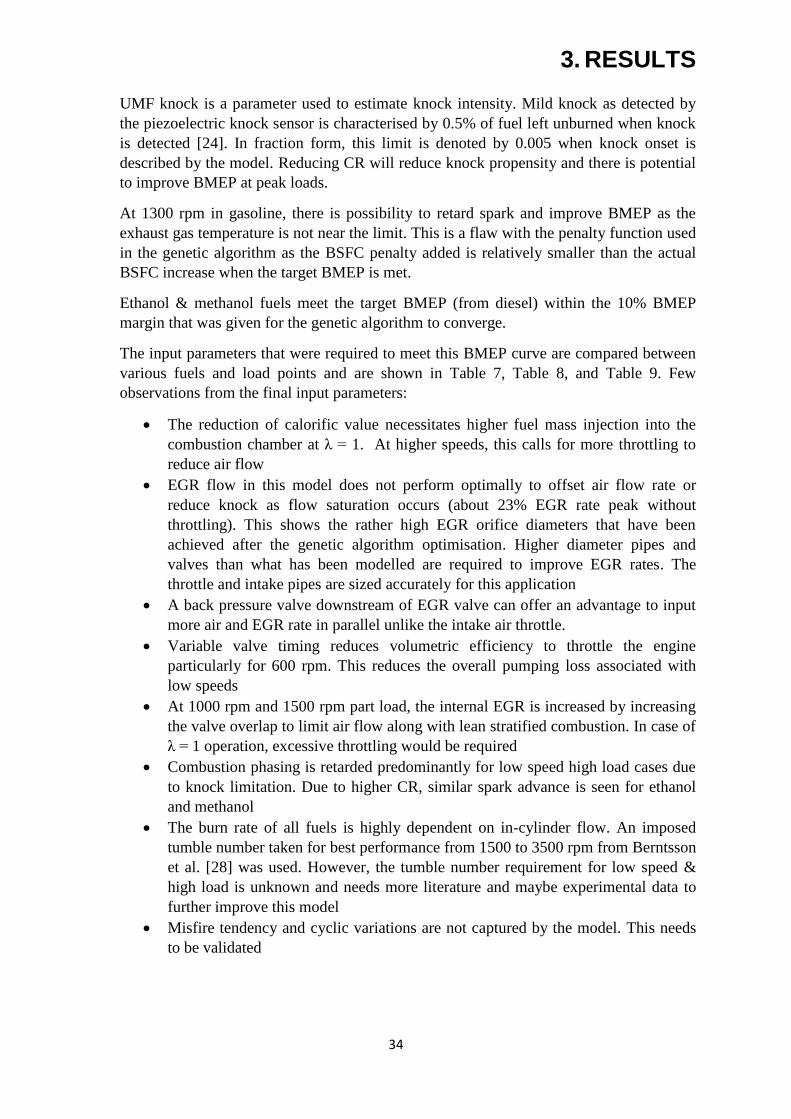
The input parameters that were required to meet this BMEP curve are compared between
various fuels and load points and are shown in Table 7, Table 8, and Table 9. Few
observations from the final input parameters:
The reduction of calorific value necessitates higher fuel mass injection into the
combustion chamber at λ = 1. At higher speeds, this calls for more throttling to
reduce air flow
EGR flow in this model does not perform optimally to offset air flow rate or
reduce knock as flow saturation occurs (about 23% EGR rate peak without
throttling). This shows the rather high EGR orifice diameters that have been
achieved after the genetic algorithm optimisation. Higher diameter pipes and
valves than what has been modelled are required to improve EGR rates. The
throttle and intake pipes are sized accurately for this application
A back pressure valve downstream of EGR valve can offer an advantage to input
more air and EGR rate in parallel unlike the intake air throttle.
Variable valve timing reduces volumetric efficiency to throttle the engine
particularly for 600 rpm. This reduces the overall pumping loss associated with
low speeds
At 1000 rpm and 1500 rpm part load, the internal EGR is increased by increasing
the valve overlap to limit air flow along with lean stratified combustion. In case of
λ = 1 operation, excessive throttling would be required
Combustion phasing is retarded predominantly for low speed high load cases due
to knock limitation. Due to higher CR, similar spark advance is seen for ethanol
and methanol
The burn rate of all fuels is highly dependent on in-cylinder flow. An imposed
tumble number taken for best performance from 1500 to 3500 rpm from Berntsson
et al. [28] was used. However, the tumble number requirement for low speed &
high load is unknown and needs more literature and maybe experimental data to
further improve this model
Misfire tendency and cyclic variations are not captured by the model. This needs
to be validated
3. RESULTS
35
Table 7: Gasoline - Optimized input parameters
Speed
BMEP
Target
Compressi
-on Ratio
Inlet Cam
Phasing
Exhaust
Cam
Phasing
Spark
Advance
EGR
Orifice
diameter
Compress-
or Power
Throttle
Orifice
diameter
1300 25 10 -16.18 6.46 5.00 48.00 57.50 130.00
1000 25 10 -1.11 -3.62 9.04 30.55 37.25 133.93
600 9 10 17.46 13.04 8.94 28.69 3.89 128.42
1600 20 10 -23.88 -1.54 -8.86 38.34 31.65 126.92
2300 9.4 10 -14.02 3.13 -33.74 68.72 30.19 65.84
1000 5 10 -16.63 19.77 -9.97 66.82 17.23 103.46
1500 5 10 -16.46 14.67 -5.06 8.93 17.76 95.33
Table 8: Ethanol - Optimized input parameters
Speed
BMEP
Target
Compressi-
on Ratio
Inlet
Cam
Phasing
Exhaust
Cam
Phasing
Spark
Advance
EGR
Orifice
diameter
Compress-
or Power
Throttle
Orifice
diameter
1300 25 12 -3.91 -0.06 14.45 27.63 48.83 133.64
1000 25 12 2.00 5.25 10.00 64.00 55.35 108.37
600 9 12 10.86 12.04 9.11 60.02 3.89 128.42
1600 20 12 -7.14 0.00 0.50 70.00 56.00 75.00
2300 9.4 12 -8.43 0.34 -29.59 64.49 31.59 55.17
1000 5 12 -17.63 9.94 -6.97 69.07 14.68 104.46
1500 5 12 -21.01 -4.73 -5.06 29.77 15.76 128.80
Table 9: Methanol - Optimized input parameters
Speed
BMEP
Target
Compressi-
on Ratio
Inlet
Cam
Phasing
Exhaust
Cam
Phasing
Spark
Advance
EGR
Orifice
diameter
Compress-
or Power
Throttle
Orifice
diameter
1300 25 12 -3.91 -2.06 11.45 24.63 47.08 130.89
1000 25 12 -1.09 0.34 13.03 1.00 28.84 111.84
600 9 12 20.71 13.54 7.94 29.19 2.89 128.67
1600 20 12 -7.14 0.00 -1.00 70.00 56.00 73.00
2300 9.4 12 -22.72 4.90 -30.74 69.72 29.19 63.84
1000 5 12 -18.63 10.74 -7.97 69.07 11.68 82.48
1500 5 12 -17.87 -1.72 -8.17 42.47 23.07 82.98
3. RESULTS
36
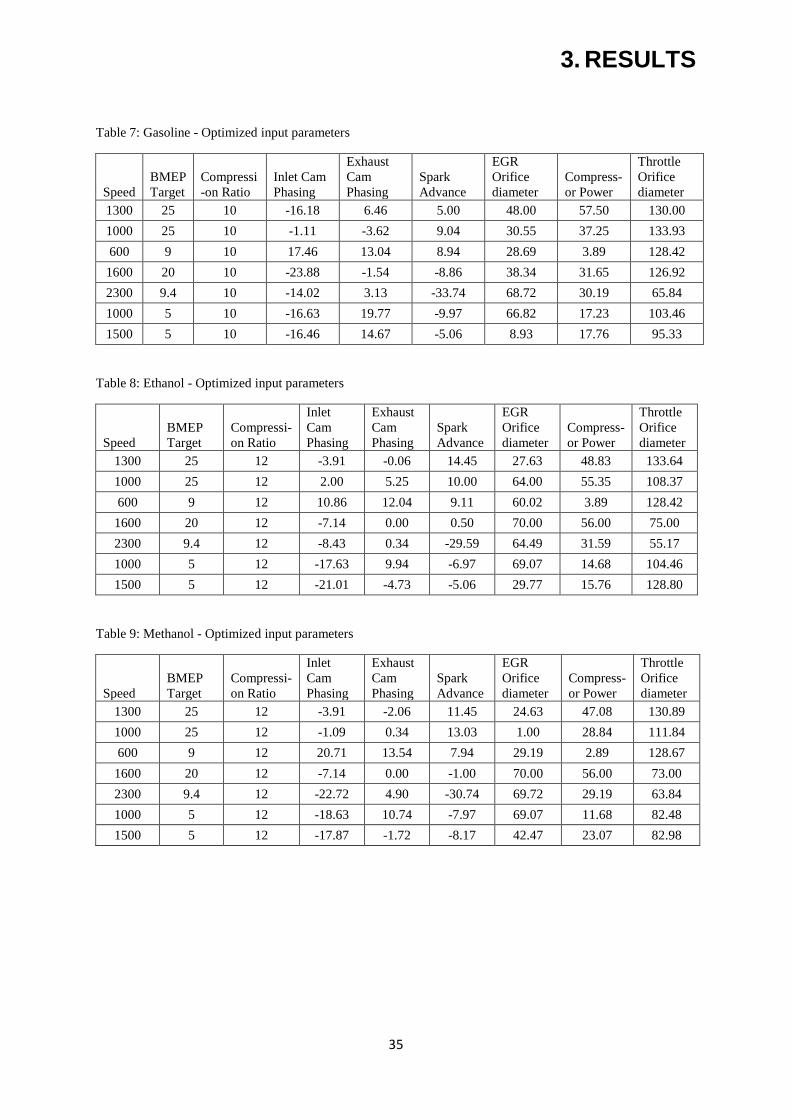
3.4. Thermal Efficiency
To meet the target BMEP, severe spark retardation has been seen in many cases. The
improved octane number of ethanol & methanol should ideally reflect in improved thermal
efficiency in all operating points. However, 1600 rpm shows quite lower thermal efficiency
in comparison to gasoline.
Figure 19: Thermal Efficiency curve at full load operation - Comparison
3. RESULTS
37
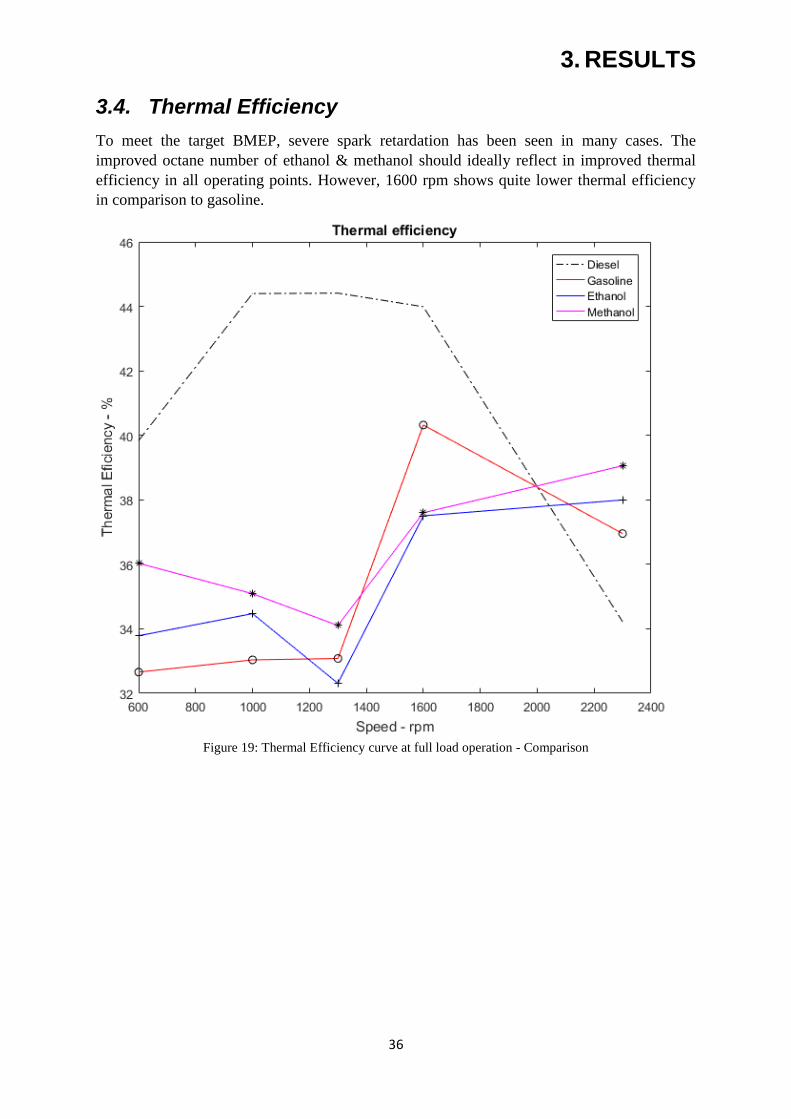
Figure 20: Air Flow Rate at full load operation - Comparison
There are 2 reasons for lower efficiency at 1600 rpm:
1. Higher compression ratio – higher knock tendency
2. Lower burn rates
Ethanol fuelled engine could not be operated at gasoline input conditions with the higher
compression ratio as just the increase in octane number was insufficient in reducing knock.
With spark retardation and higher EGR, similar BMEP with minimised BSFC was achieved.
Another interesting observation from the sensitivity analysis performed was that the burn
rates reduced with higher compression ratio for almost all operating points.
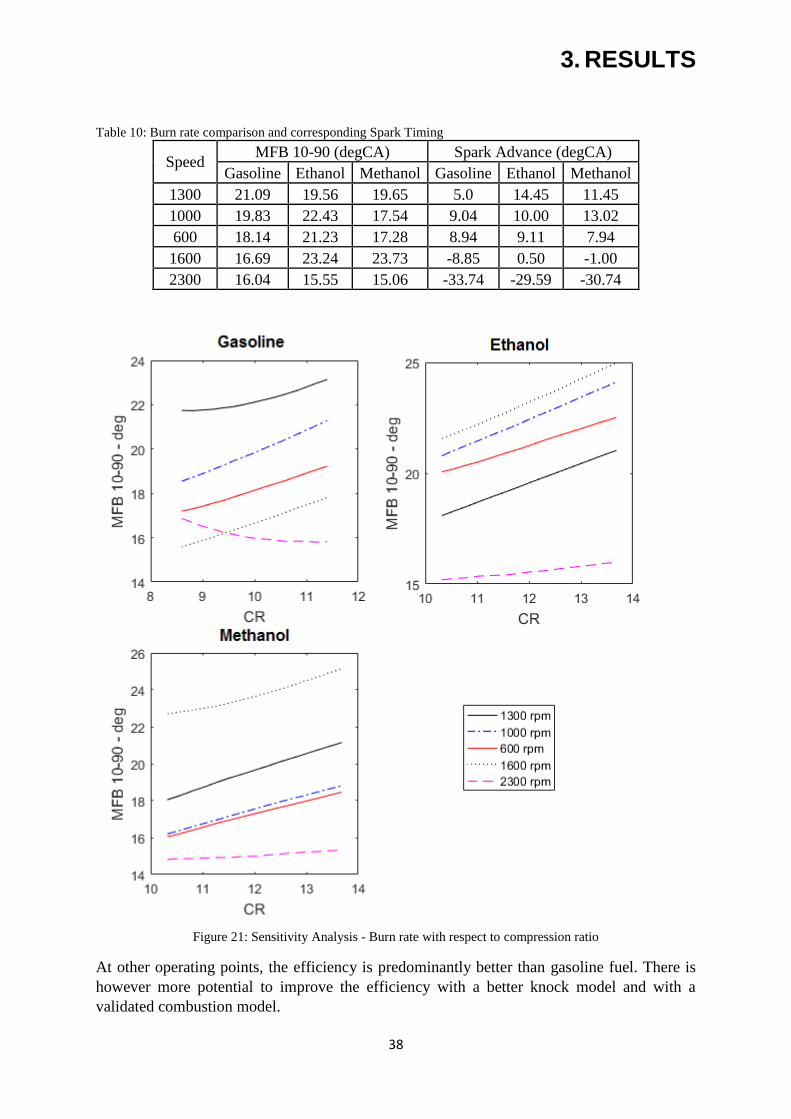
The burn rates are shown in Table 10 for the optimised points and Figure 21 shows the trend
with respect to the compression ratio. The reason for this is not fully understood and there
may be 2 possibilities. When spark is retarded beyond TDC, the heat transfer to the cylinder
wall increases from the combustion charge thereby reducing burn rates. The slope of the
sensitivity analysis for 2300rpm is lower due to lower time for heat transfer near TDC in
support of this hypothesis. Another possibility for this effect may be due to pronounced
tumble breakdown causing lower turbulence post TDC at higher compression ratios.
3. RESULTS
38
Table 10: Burn rate comparison and corresponding Spark Timing
Speed MFB 10-90 (degCA) Spark Advance (degCA)
Gasoline Ethanol Methanol Gasoline Ethanol Methanol
1300 21.09 19.56 19.65 5.0 14.45 11.45
1000 19.83 22.43 17.54 9.04 10.00 13.02
600 18.14 21.23 17.28 8.94 9.11 7.94
1600 16.69 23.24 23.73 -8.85 0.50 -1.00
2300 16.04 15.55 15.06 -33.74 -29.59 -30.74
Figure 21: Sensitivity Analysis - Burn rate with respect to compression ratio
At other operating points, the efficiency is predominantly better than gasoline fuel. There is
however more potential to improve the efficiency with a better knock model and with a
validated combustion model.
3. RESULTS
39
3.5. EGR Loop
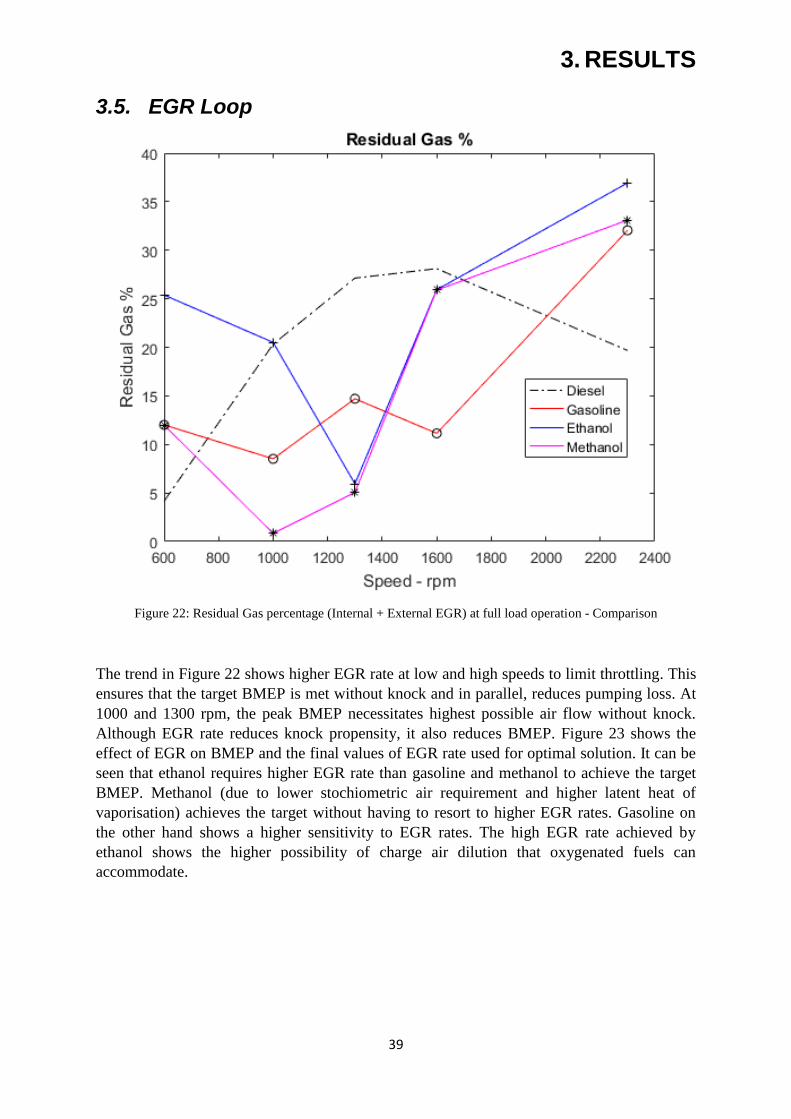
Figure 22: Residual Gas percentage (Internal + External EGR) at full load operation - Comparison
The trend in Figure 22 shows higher EGR rate at low and high speeds to limit throttling. This
ensures that the target BMEP is met without knock and in parallel, reduces pumping loss. At
1000 and 1300 rpm, the peak BMEP necessitates highest possible air flow without knock.
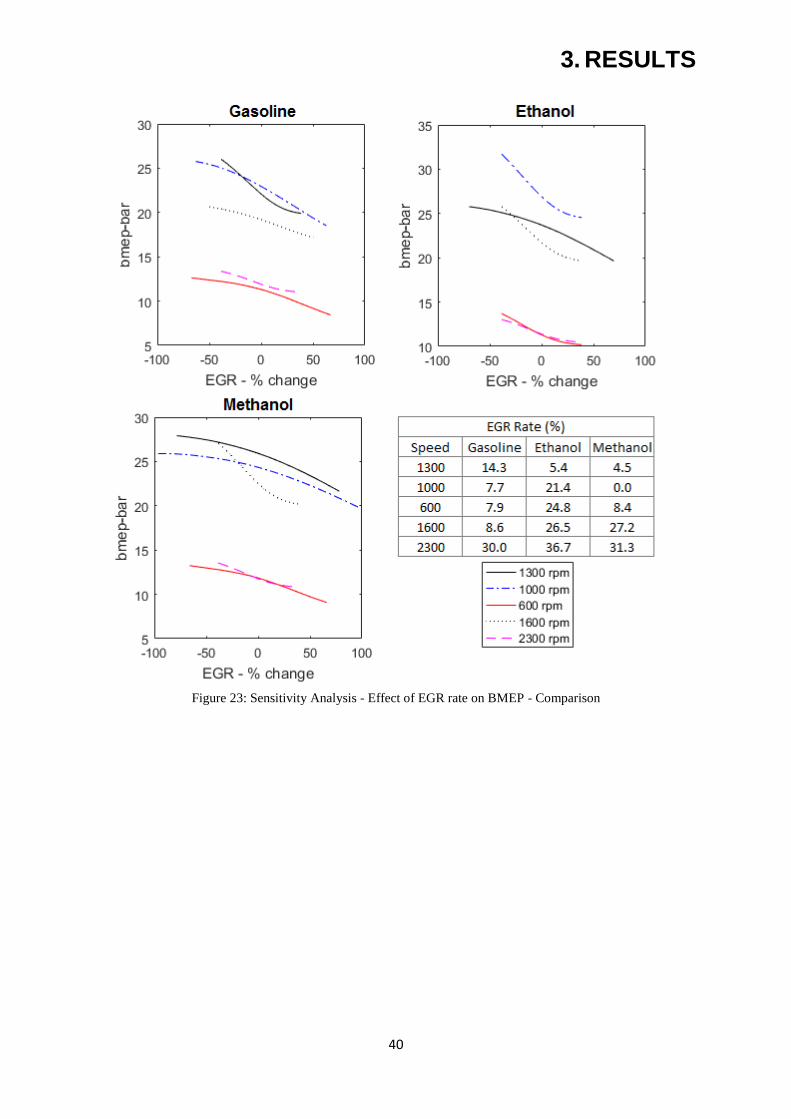
Although EGR rate reduces knock propensity, it also reduces BMEP. Figure 23 shows the
effect of EGR on BMEP and the final values of EGR rate used for optimal solution. It can be
seen that ethanol requires higher EGR rate than gasoline and methanol to achieve the target
BMEP. Methanol (due to lower stochiometric air requirement and higher latent heat of
vaporisation) achieves the target without having to resort to higher EGR rates. Gasoline on
the other hand shows a higher sensitivity to EGR rates. The high EGR rate achieved by
ethanol shows the higher possibility of charge air dilution that oxygenated fuels can
accommodate.
3. RESULTS
40
Figure 23: Sensitivity Analysis - Effect of EGR rate on BMEP - Comparison
3. RESULTS
41
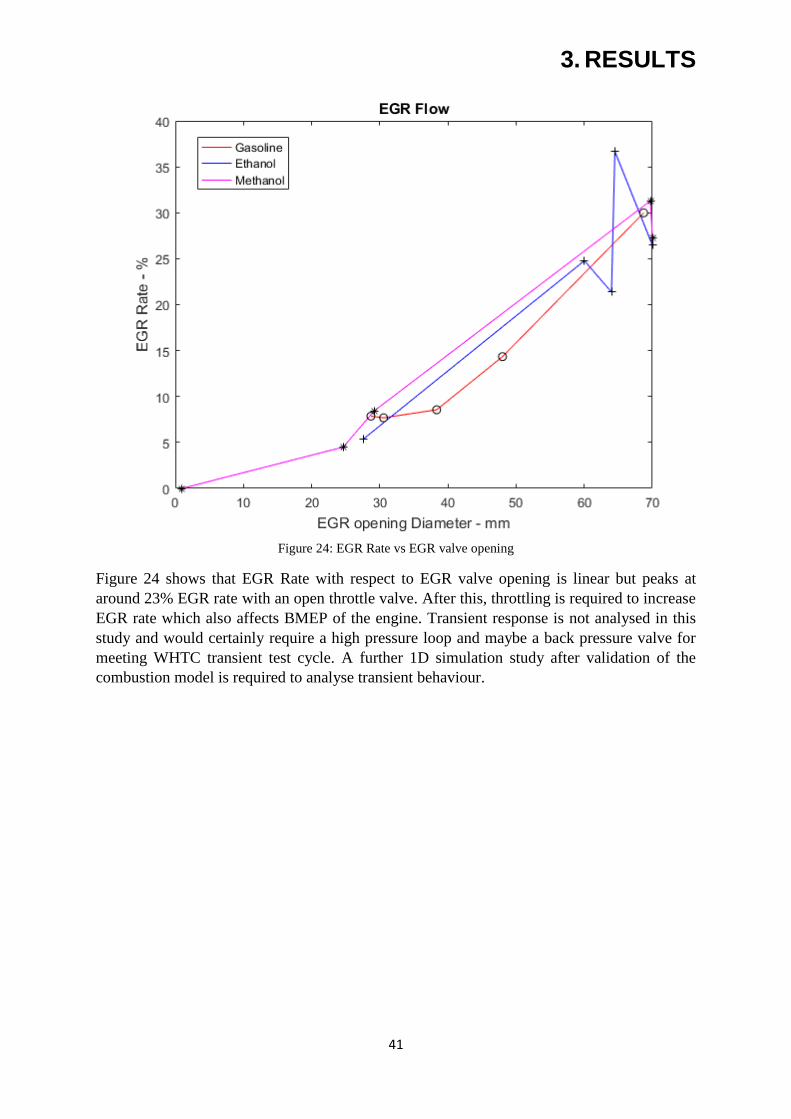
Figure 24: EGR Rate vs EGR valve opening
Figure 24 shows that EGR Rate with respect to EGR valve opening is linear but peaks at
around 23% EGR rate with an open throttle valve. After this, throttling is required to increase
EGR rate which also affects BMEP of the engine. Transient response is not analysed in this
study and would certainly require a high pressure loop and maybe a back pressure valve for
meeting WHTC transient test cycle. A further 1D simulation study after validation of the
combustion model is required to analyse transient behaviour.
3. RESULTS
42
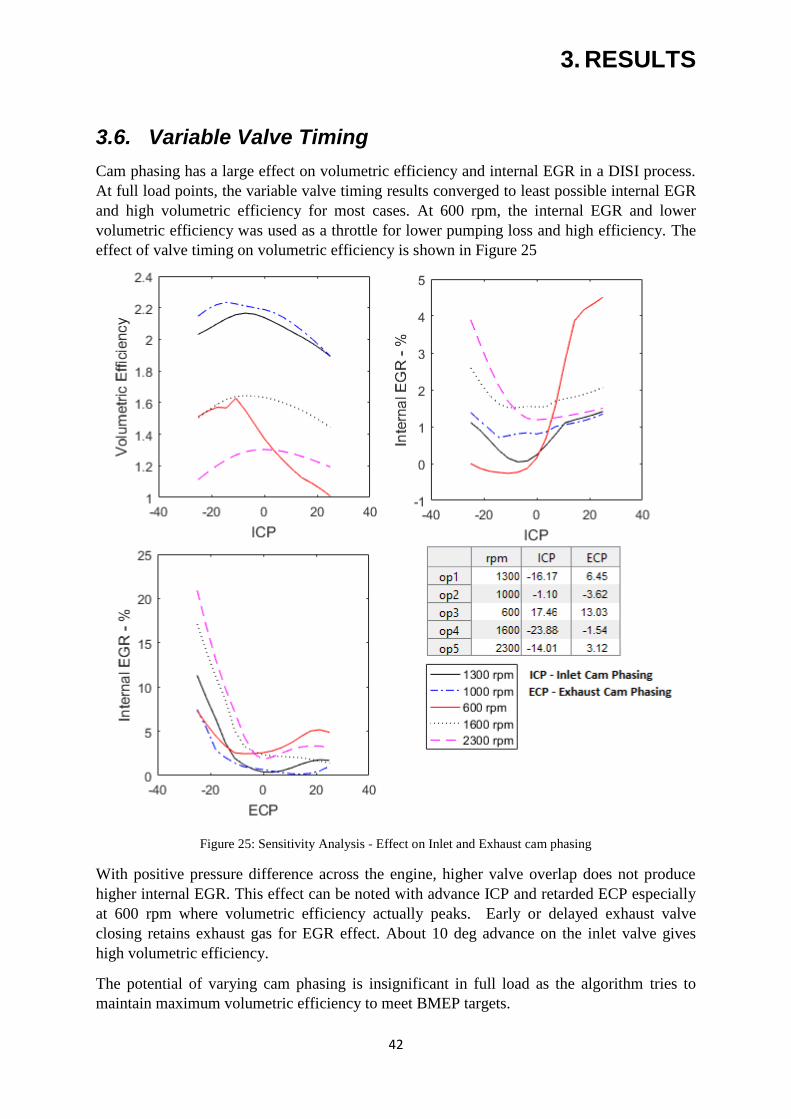
3.6. Variable Valve Timing
Cam phasing has a large effect on volumetric efficiency and internal EGR in a DISI process.
At full load points, the variable valve timing results converged to least possible internal EGR
and high volumetric efficiency for most cases. At 600 rpm, the internal EGR and lower
volumetric efficiency was used as a throttle for lower pumping loss and high efficiency. The
effect of valve timing on volumetric efficiency is shown in Figure 25
Figure 25: Sensitivity Analysis - Effect on Inlet and Exhaust cam phasing
With positive pressure difference across the engine, higher valve overlap does not produce
higher internal EGR. This effect can be noted with advance ICP and retarded ECP especially
at 600 rpm where volumetric efficiency actually peaks. Early or delayed exhaust valve
closing retains exhaust gas for EGR effect. About 10 deg advance on the inlet valve gives
high volumetric efficiency.
The potential of varying cam phasing is insignificant in full load as the algorithm tries to
maintain maximum volumetric efficiency to meet BMEP targets.
3. RESULTS
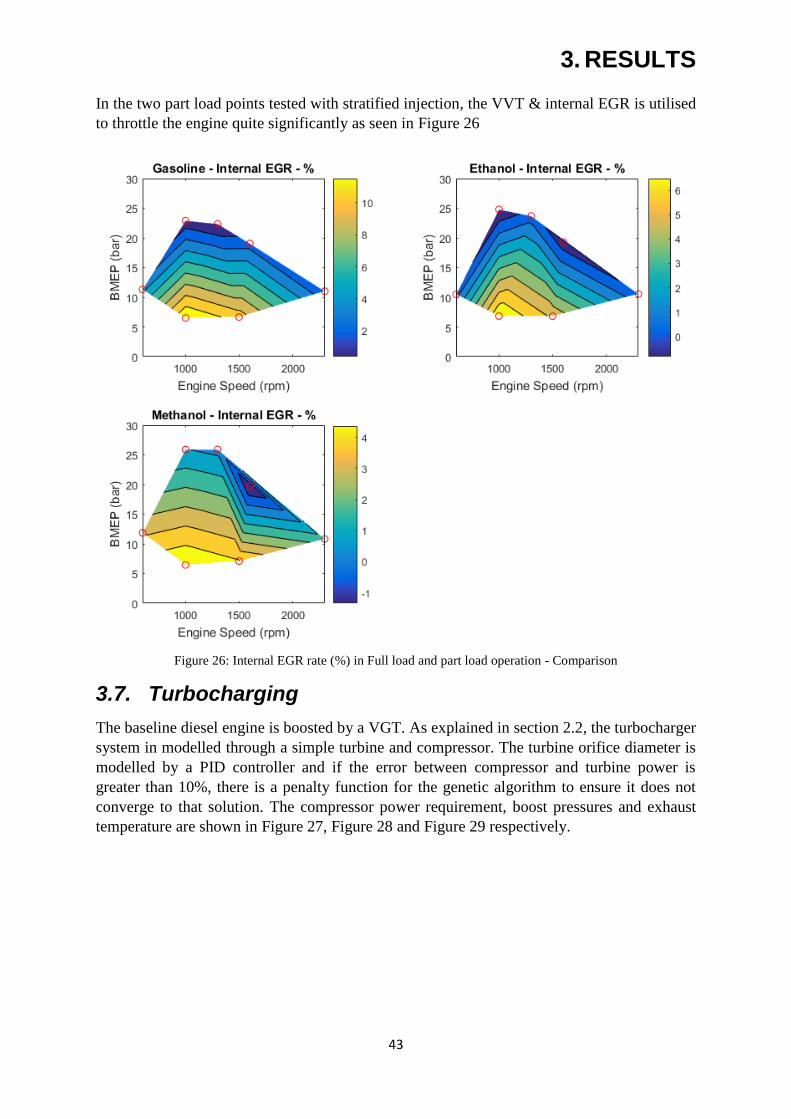
43
In the two part load points tested with stratified injection, the VVT & internal EGR is utilised
to throttle the engine quite significantly as seen in Figure 26
Figure 26: Internal EGR rate (%) in Full load and part load operation - Comparison
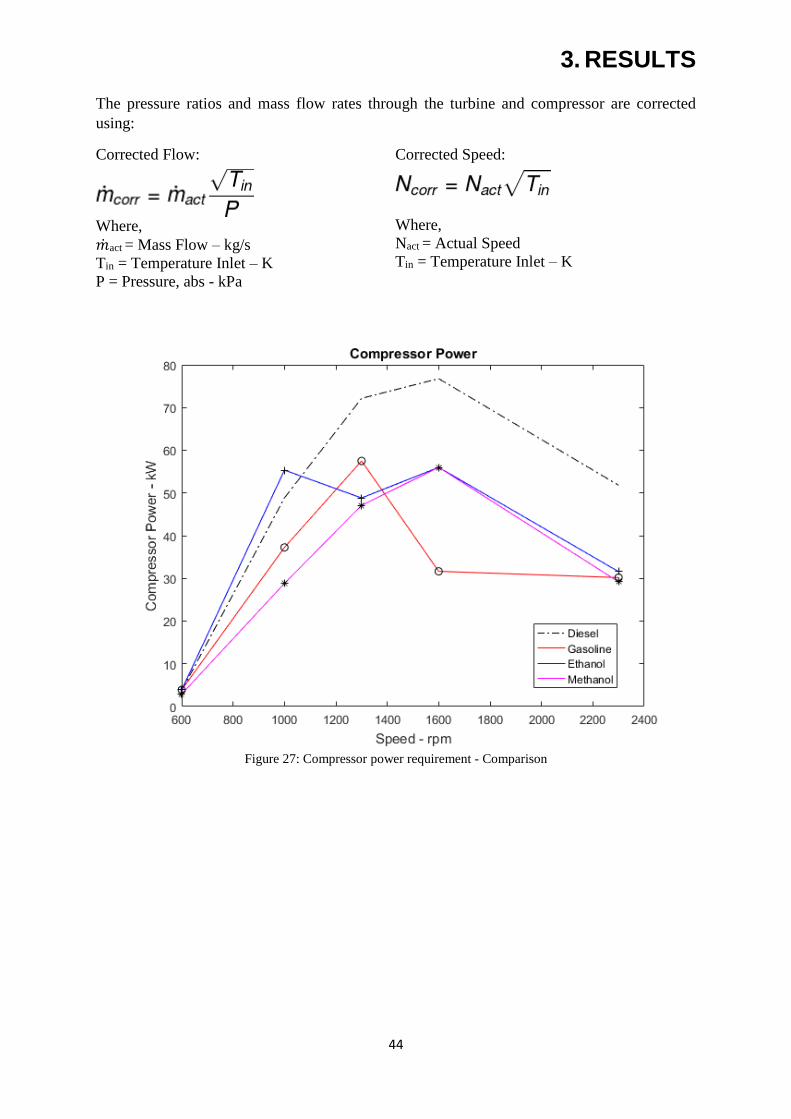
3.7. Turbocharging
The baseline diesel engine is boosted by a VGT. As explained in section 2.2, the turbocharger
system in modelled through a simple turbine and compressor. The turbine orifice diameter is
modelled by a PID controller and if the error between compressor and turbine power is
greater than 10%, there is a penalty function for the genetic algorithm to ensure it does not
converge to that solution. The compressor power requirement, boost pressures and exhaust
temperature are shown in Figure 27, Figure 28 and Figure 29 respectively.
3. RESULTS
44
The pressure ratios and mass flow rates through the turbine and compressor are corrected
using:
Corrected Flow: Corrected Speed:
Where,
�̇�act = Mass Flow – kg/s
Tin = Temperature Inlet – K
P = Pressure, abs - kPa
Where,
Nact = Actual Speed
Tin = Temperature Inlet – K
Figure 27: Compressor power requirement - Comparison
3. RESULTS
45
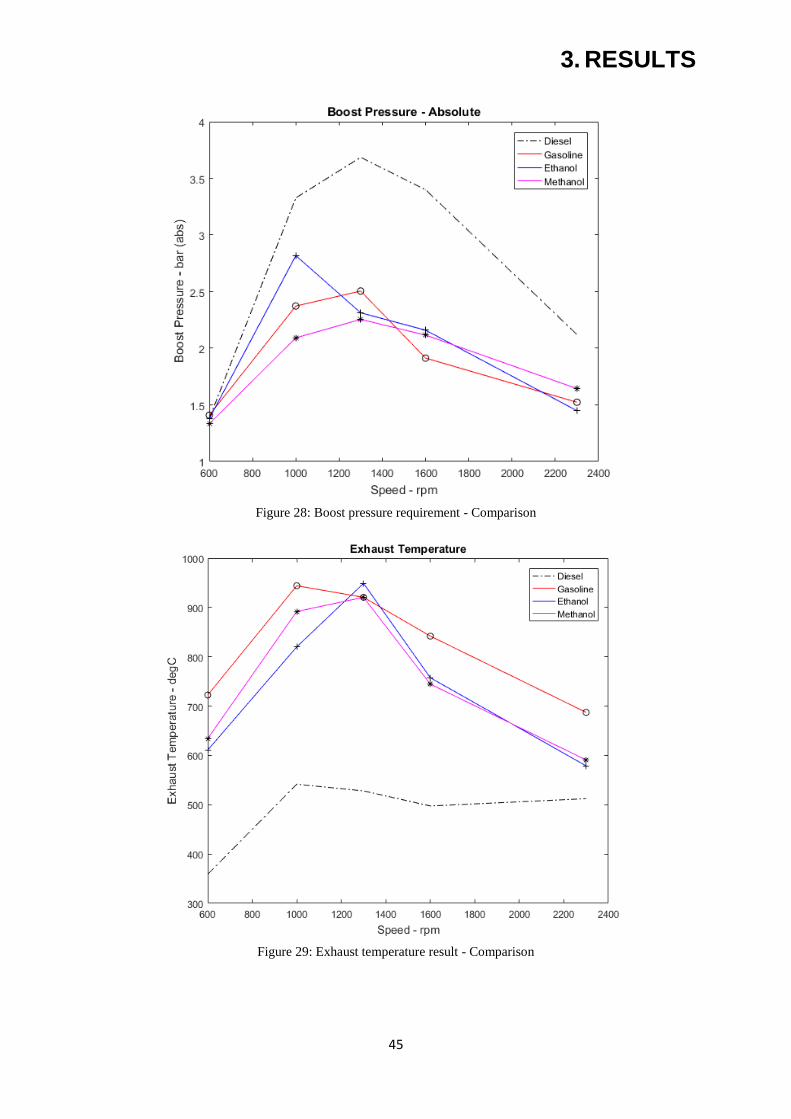
Figure 28: Boost pressure requirement - Comparison
Figure 29: Exhaust temperature result - Comparison
3. RESULTS
46
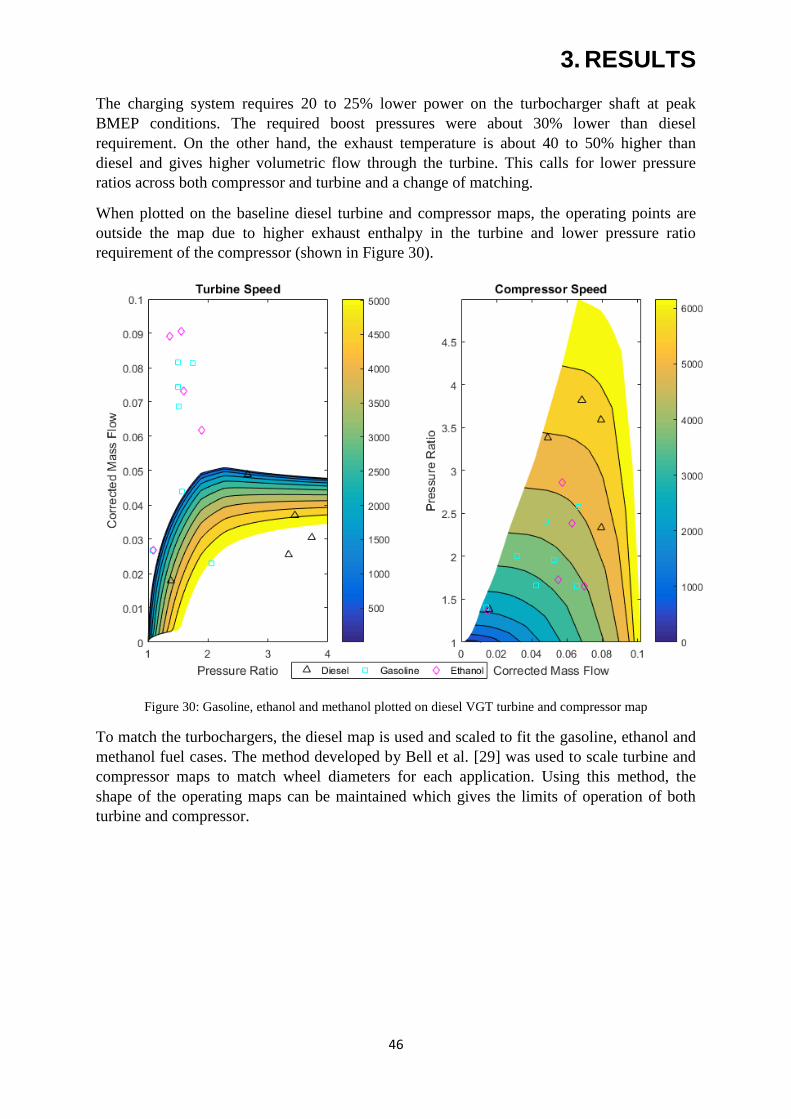
The charging system requires 20 to 25% lower power on the turbocharger shaft at peak
BMEP conditions. The required boost pressures were about 30% lower than diesel
requirement. On the other hand, the exhaust temperature is about 40 to 50% higher than
diesel and gives higher volumetric flow through the turbine. This calls for lower pressure
ratios across both compressor and turbine and a change of matching.
When plotted on the baseline diesel turbine and compressor maps, the operating points are
outside the map due to higher exhaust enthalpy in the turbine and lower pressure ratio
requirement of the compressor (shown in Figure 30).
Figure 30: Gasoline, ethanol and methanol plotted on diesel VGT turbine and compressor map
To match the turbochargers, the diesel map is used and scaled to fit the gasoline, ethanol and
methanol fuel cases. The method developed by Bell et al. [29] was used to scale turbine and
compressor maps to match wheel diameters for each application. Using this method, the
shape of the operating maps can be maintained which gives the limits of operation of both
turbine and compressor.
3. RESULTS
47
Compressor Wheel: Turbine Wheel:
Where,
Φc = Non-dimensional flow coefficient
�̇�corr,c = Corrected mass flow – Compressor
DC = Compressor wheel diameter
R = Gas constant, air
γ = Specific heat ratio, air
Ncorr = Corrected speed – Compressor
co,c = Rotor tip speed - Compressor
Where,
ΦT = Non-dimensional flow coefficient
�̇�corr,T = Corrected mass flow – Turbine
DT = Turbine wheel diameter
R = Gas constant, exhaust
γ = Specific heat ratio, exhaust
Ncorr = Corrected speed – Turbine
co,T = Rotor tip speed - Turbine
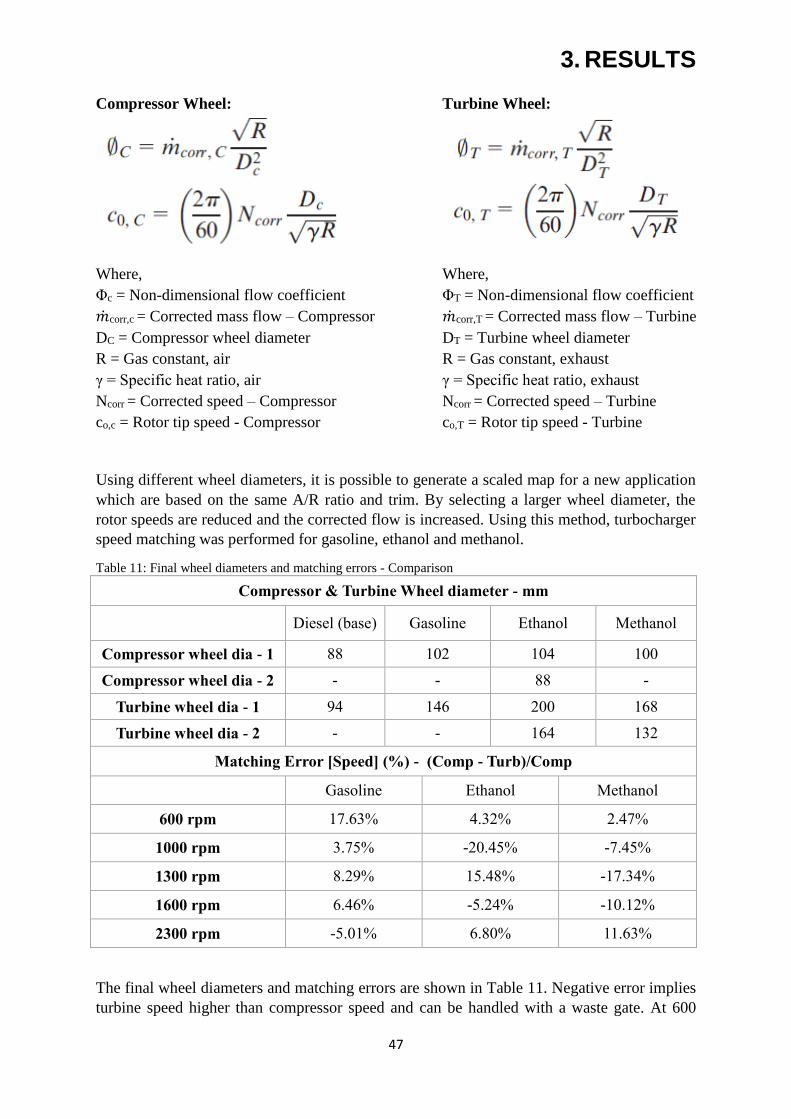
Using different wheel diameters, it is possible to generate a scaled map for a new application
which are based on the same A/R ratio and trim. By selecting a larger wheel diameter, the
rotor speeds are reduced and the corrected flow is increased. Using this method, turbocharger
speed matching was performed for gasoline, ethanol and methanol.
Table 11: Final wheel diameters and matching errors - Comparison
Compressor & Turbine Wheel diameter - mm
Diesel (base) Gasoline Ethanol Methanol
Compressor wheel dia - 1 88 102 104 100
Compressor wheel dia - 2 - - 88 -
Turbine wheel dia - 1 94 146 200 168
Turbine wheel dia - 2 - - 164 132
Matching Error [Speed] (%) - (Comp - Turb)/Comp
Gasoline Ethanol Methanol
600 rpm 17.63% 4.32% 2.47%
1000 rpm 3.75% -20.45% -7.45%
1300 rpm 8.29% 15.48% -17.34%
1600 rpm 6.46% -5.24% -10.12%
2300 rpm -5.01% 6.80% 11.63%
The final wheel diameters and matching errors are shown in Table 11. Negative error implies
turbine speed higher than compressor speed and can be handled with a waste gate. At 600
3. RESULTS
48
rpm, it is nearly naturally aspirated and error in that zone is not considered critical. The
gasoline engine showed good match with a single turbine wheel diameter and can be handled
with just a waste gate.
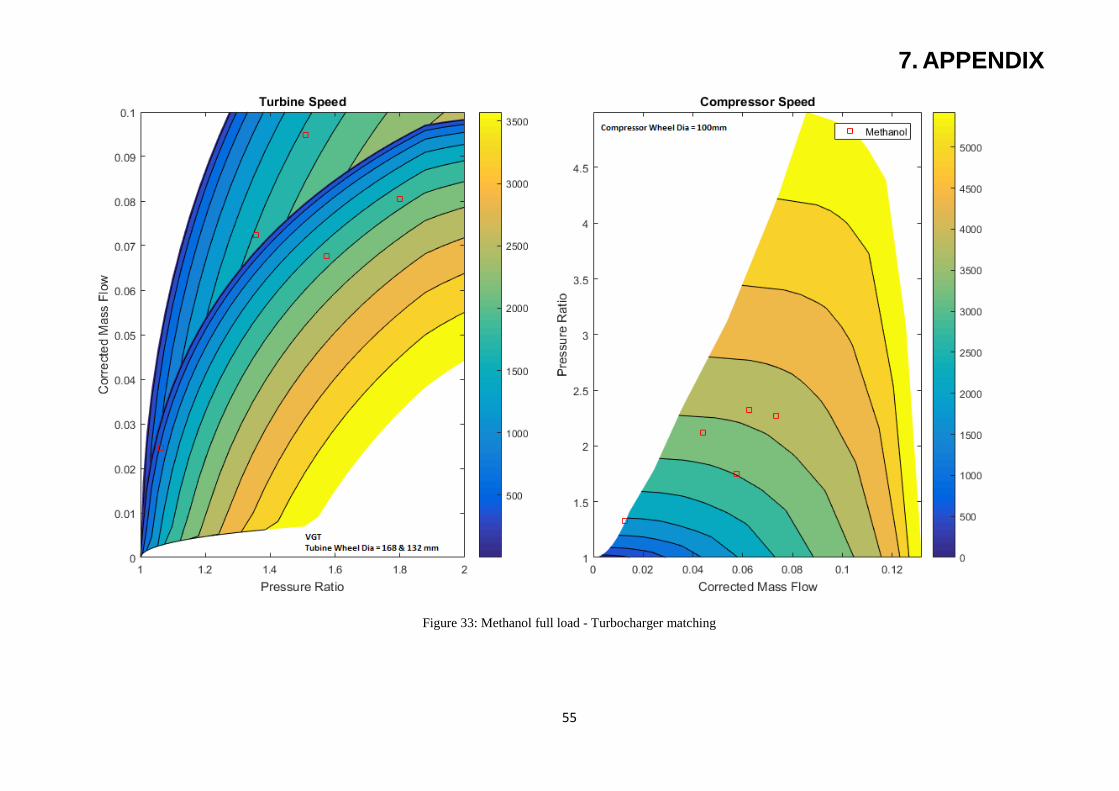
The methanol case showed a wider spread of mass flows and pressure ratios in operation and
it required modelling with 2 turbine wheels to ensure a good fit. This mostly requires a
variable geometry turbocharger to fit all operating points. The ethanol case however required
multiple compressor wheels as well to reduce error. This was due to the high boost pressure
requirement and lower exhaust temperature as compared to methanol case.
These scaled turbo maps would be highly useful to select operation maps from the
turbocharger manufacturer during the experimental validation phase. However, only with
experimental gas stand data can the fit be confirmed.
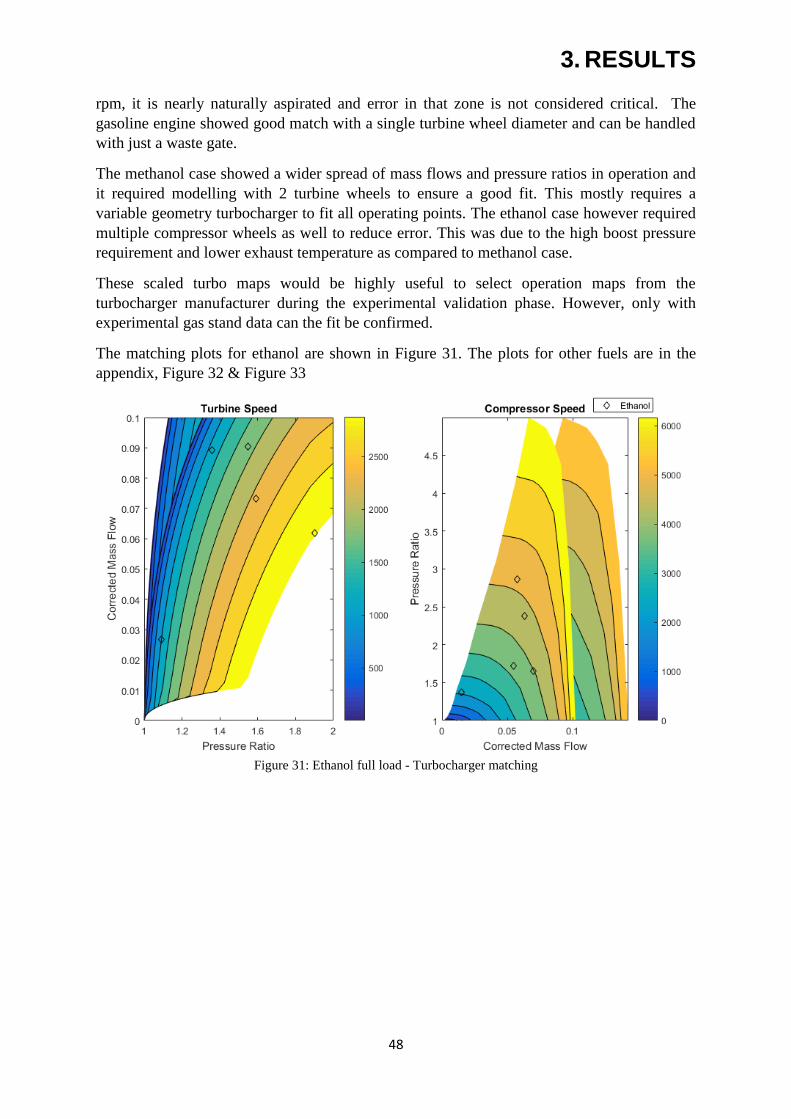
The matching plots for ethanol are shown in Figure 31. The plots for other fuels are in the
appendix, Figure 32 & Figure 33
Figure 31: Ethanol full load - Turbocharger matching
4. DISCUSSION
49
Ethanol and methanol shows only marginal improvement in thermal efficiency compared to
gasoline although this may not be the case in reality. The following are the simplifications made
in this study that could potentially improve the thermal efficiency of all fuels tested.
The peak pressures that were achieved for all cases is 20-30 bar lower than what has been
achieved in literature for a similar BMEP. This implies that the knock limited spark
timing could be advanced further and can improve BSFC for all fuels
The octane rating of ethanol and methanol do not consider the much higher latent heat of
vaporisation that the fuels offer to reduce knock. Since no data was available, the same
knock model with only octane number change was used. Hence a validated knock model
would show a larger improvement in alcohol fuels than gasoline in comparison to the
results shown in this study
The Compression ratio is a trade-off between part load and full load points. The chosen
compression ratio in comparison to literature seems acceptable considering 25 bar BMEP
has been achieved.
The laminar burn speed advantage of alcohol fuels is not translated to combustion
environment by the code. This calls for a combustion model tuning (all values were left
at default for this study).
The following parameters of the GT Power model must be tuned for better results
Combustion model - SITurb
Turbulence Length Multiplier
Flame Growth Multiplier
Dilution Exponent Multiplier
Knock Model – Kinetics Fit
Knock Integral Time Multiplier
Knock Exponent Multiplier
Part load operating in this study has been performed using a fixed lambda vs burn rate curve.
This in short makes the burn rate profile constant irrespective of the amount residual gas or spark
timing applied. This is a gross simplification. In case of availability of test data, the same can be
modelled as multiple Wiebe curves and sensitivity to other factors can be given. Additionally,
4oCA is the duration between end of injection and spark timing in a spray guided stratified
system. This may not be feasible given the high heat of vaporisation as it may cause more
particulate number and higher cyclic variations while using alcohol fuels. If the time to vaporise
is much higher, it may be necessary to revisit wall guided mixing mechanism (more advanced
injection than spray guided) to ensure higher vaporised content and still maintain the stratified
cloud. Also, global lambda 2.4 is fixed in this study. This may require a revisit with test data.
The in-cylinder flow has not been given much importance in this study. The tumble number has
been fixed at 1.13 and no swirl is the imposed conditions for all operating points. The effect of
these parameters needs to be verified with a validated combustion model and the requirement for
various fuels can be drawn from simulation. This would also determine the EGR rates and
compression ratios that the system can take.
Variable valve timing in this study only considers Cam Phasing to ±25 deg on the camshaft.
Variable lift and change of profiles have not been considered although it is quite feasible to do
4. DISCUSSION
50
so. The effects of this should be studied separately with a validated model to obtain the best
solution for each fuel.
An extensive test plan is required on a single cylinder engine to validate this model with multiple
fuels in homogenous operation with varying spark advance and EGR rates. A test schedule
would also give cyclic variation levels as it could not be modelled using GT Power. An
additional sub-model could be developed for COV IMEP prediction for a particular engine. For
stratification studies, fuel evaporation and penetration studies are required to assess the mixing
regime that needs to be followed for each fuel application.
It should also be considered when using alcohols as a fuel that the higher heat of vaporisation is
very desirable only in high load operation, however, this causes poor fuel evaporation in cold
start conditions. Unassisted cold start temperatures have been reported between 0 to 16 oC for
methanol fuels and around 43 oC for ethanol fuels. [25]. Neat methanol is conductive and hence
any liquid methanol in the electrode gap of the spark plug will cause a misfire adding to the cold
start issue and some possibility of cyclic variations (ethanol is not conductive as a liquid). Using
ethanol and methanol, lower exhaust gas temperatures would be observed causing delays in
catalyst light off at part loads in comparison to gasoline.
4.1. Future Work
Model validation for Knock and Combustion
In-Cylinder turbulence requirement for short alcohols as compared to gasoline (1D and
possibly 3D modelling with respect to characterise evaporation and wall wetting in
homogenous operation)
Fuel evaporation and penetration studies for short alcohols – to model wall wetting
Cyclic variation prediction – 1D subroutine development
Emission study and incorporation in GT power
Studies on blowback of fuel-air mixture and exhaust
Potential for wall guided mixing mechanism for short alcohols (if stratification studies
are required)
Effect of valve profiles and valve opening duration
Modelling cold start with ethanol and methanol and strategies to reduce light off time
Stratification of ethanol & methanol – Combustion stability with respect to global lambda
and EGR rate with spray guided injectors.
Injection timing in stratification and multiple injection on soot with ethanol and methanol
5. CONCLUSION
51
Gasoline, ethanol and methanol fuels were analysed in DISI process with homogenous operation
for 5 operating points and stratified operation for 2 part load points. The base engine was a HD
diesel engine with 25 bar BMEP and the full load operation of diesel was matched with these
fuels. A predictive GT Power model with a genetic algorithm optimiser was used and the
following results were observed
o Gasoline fuel had issues in meeting target BMEP due to knock and produced a peak of
23 bar. ethanol and methanol fuels were able to meet target curve due to lower knock
tendency
o A thermal efficiency of 33% was achieved at full load in gasoline as the spark timing
had to be severely retarded. An efficiency of 34 and 35% was recorded by ethanol and
methanol fuels respectively. This gain in efficiency is a conservative estimate as the
knock model employed was not tuned for each fuel
o A compression ratio of 10 for gasoline and 12 for ethanol and methanol was used for
better efficiency at all load points. This was also derived from a genetic algorithm (at
low speed full load) and maintained constant for all other points
o The air flow rate requirement is about 15% lower at peak BMEP points and about 48%
lower at 2300 rpm to maintain stochiometric condition for the three way catalyst. Hence
pumping loss has more significance than diesel engines
o Peak pressures were at least 50% lower than diesel engines. Ethanol and methanol were
slightly higher due to lower knock tendency
o A larger valve and pipe diameter is required in LP EGR than what was used in this study
as the rates were limited to 23% due to flow saturation. A back pressure valve might also
be required to improve EGR rate in both steady state and transient operation
o Variable valve timing does not play an important role in full load operation. The intake
valve advance was used to maximise volumetric efficiency for most operating points.
o In part load, internal EGR was used extensively to offset airflow (in 2 operating points).
A much more detailed study with other part load points is required to assess the
importance of internal EGR for each fuel application
o 25 to 40 % lower boost pressure is required by the SI process to limit knock tendency.
The exhaust gas enthalpy is also higher in SI process and requires lower pressure ratios
than diesel to achieve the same turbine power
o A larger turbine and compressor wheel diameter with lower speeds is required if a
turbocharger is selected from the same family (same A/R ratio and trim)
o The gasoline engine can be matched with a single turbine and a wastegate.
o Due to lower temperatures of ethanol and methanol exhaust gases with similar pressure
ratios, a variable geometry turbocharger is required for matching speeds.
6. REFERENCES
52
[1] T. V. Johnson, “Review of Vehicular Emissions Trends,” SAE Int. J. Engines, vol. 8, no.
3, 2015.
[2] IEA, Energy technology perspective 2008, no. June. 2008.
[3] A. C. Alkidas and S. H. El Tahry, “Contributors to the Fuel Economy Advantage of DISI
Engines Over PFI Engines,” SAE Tech. Pap. 2003-01-3101, 2003.
[4] C. Preussner, C. Doring, S. Fehler, and S. Kampmann, “GDI: Interaction Between
Mixture Preparation, Combustion System and Injector Performance,” SAE Tech. Pap.
980498, 1998.
[5] F. Zhao, M. Lai, and D. Harrington, “A Review of Mixture Preparation and Combustion
Control Strategies for Spark-Ignited Direct-Injection Gasoline Engines,” SAE Tech. Pap.
970627, no. 10.4271/970627., 1997.
[6] K. Noma, Y. Iwamoto, N. Murakami, K. Iida, and O. Nakayama, “Optimized Gasoline
Direct Injection Engine for the European Market,” SAE Tech. Pap. 980150, 1998.
[7] B. A. Vanderwege, Z. Han, C. O. Iyer, R. H. Muñoz, and J. Yi, “Development and
Analysis of a Spray-Guided DISI Combustion System Concept,” SAE Tech. Pap. 2003-
01-3105, 2003.
[8] C. Schwarz, E. Schünemann, B. Durst, J. Fischer, and A. Witt, “Potentials of the Spray-
Guided BMW DI Combustion System,” in SAE 2006 World Congress & Exhibition, 2006.
[9] C. Schwarz, S. Missy, H. Steyer, B. Durst, E. Schünemann, and W. Kern, “The New
BMW Four and Six-cylinder Spark-Ignition Engines with Stratified Combustion,” MTZ
Worldw., vol. 68, no. 05, pp. 2–5, 2007.
[10] “Emission Standards: Europe: Heavy-Duty Truck and Bus Engines.” [Online]. Available:
https://www.dieselnet.com/standards/eu/hd.php. [Accessed: 22-Mar-2016].
[11] T. H. Lake, R. G. Bending, G. P. Williams, and A. J. Beaumont, “Development of the
Control an Aftertreatment System for a Very Low Emission G-DI Vehicle,” no. 724,
2013.
[12] M. S. Peckham, A. Finch, and B. Campbell, “Analysis of Transient HC , CO , NOx and
CO2 Emissions from a GDI Engine using Fast Response Gas Analyzers,” Response, vol.
4, no. 1, pp. 1513–1522, 2012.
[13] G. Salameh, P. Chesse, D. Chalet, and V. Talon, “Experimental Study of Automotive
Turbocharger Turbine Performance Maps Extrapolation,” SAE Tech. Pap. 2016-01-1034,
2016.
[14] Y. C. Liu, A. J. Savas, and C. T. Avedisian, “Comparison of the burning characteristics of
indolene and commercial grade gasoline droplets without convection,” Energy and Fuels,
vol. 26, no. 9, pp. 5740–5749, 2012.
[15] P. Bollweg and A. Kaufmann, “Dynamic Burn Rate Modeling for the 1D Simulation of a
GDI Engine in Homogeneous and Stratified Operation Mode,” Sae Pap. 2008-01-2393,
vol. 1, no. 1, pp. 1045–1056, 2008.
[16] G. A. Szekely and A. C. Alkidas, “Combustion Characteristics of a Spray-Guided Direct-
Injection Stratified-Charge Engine with a High-Squish Piston,” SAE Tech. Pap. 2005-01-
6. REFERENCES
53
1937, 2005.
[17] G. P. Merker, C. Schwarz, and R. Teichmann, Combustion Engines Development. 2012.
[18] A. Douaud and P. Eyzat, “Four-Octane-Number Method for Predicting the Anti-Knock
Behavior of Fuels and Engines,” SAE Tech. Pap. 780080, 1978.
[19] W. S. Wayne, N. N. Clark, and C. M. Atkinson, “Numerical Prediction of Knock in a Bi-
Fuel Engine,” SAE Tech. Pap. 982533, 1998.
[20] E. P. Kasseris, “Knock Limits in Spark Ignited Direct Injected Engines Using Gasoline /
Ethanol Blends,” MASSACHUSETTS INSTITUTE OF TECHNOLOGY, 2011.
[21] L. Chen, T. Li, T. Yin, and B. Zheng, “A predictive model for knock onset in spark-
ignition engines with cooled EGR,” Energy Convers. Manag., vol. 87, pp. 946–955, 2014.
[22] J. Vancoillie, L. Sileghem, and S. Verhelst, “Development and Validation of a Knock
Prediction Model for Methanol-Fuelled SI Engines,” SAE Tech. Pap. 2013-01-1312, 2013.
[23] G. Stiesch, Modeling Engine Spray and Combustion Processes, 1st ed. Springer-Verlag
Berlin Heidelberg, 2013.
[24] F. Millo, L. Rolando, E. Pautasso, and E. Servetto, “A Methodology to Mimic Cycle to
Cycle Variations and to Predict Knock Occurrence through Numerical Simulation,” SAE
Tech. Pap. 2014-01-1070, 2014.
[25] K. Owen and T. Coley, Automotive fuels reference book, Second. 1995.
[26] Ö. L. Gülder, “Laminar burning velocities of methanol, ethanol and isooctane-air
mixtures,” Symp. Combust., vol. 19, no. 1, pp. 275–281, 1982.
[27] H. Liu, Z. Wang, M. Wooldridge, M. Fatouraie, Z. Jia, Y. Qi, X. He, M. Wang, and J.-X.
Wang, “Highly Turbocharged Gasoline Engine and Rapid Compression Machine Studies
of Super-Knock,” SAE Int. J. Engines, pp. 2016–01–0686, 2016.
[28] A. W. Berntsson, G. Josefsson, R. Ekdahl, R. Ogink, and B. Grandin, “The Effect of
Tumble Flow on Efficiency for a Direct Injected Turbocharged Downsized Gasoline
Engine,” SAE Int. J. Engines, vol. 4, no. 2, pp. 2298–2311, 2011.
[29] C. Bell, D. Zimmerle, T. Bradley, D. Olsen, and P. Young, “Scalable turbocharger
performance maps for dynamic state-based engine models,” Int. J. Engine Res., 2015.

7. APPENDIX
54
Figure 32: Gasoline full load - Turbocharger matching
7. APPENDIX
55
Figure 33: Methanol full load - Turbocharger matching