Embed Size (px)
Citation preview

75
BULGARIAN ACADEMY OF SCIENCES CYBERNETICS AND INFORMATION TECHNOLOGIES • Volume 10, No 4 Sofia • 2010
Numerical Analysis of Different Communication Signals Used in Passive Radar Systems
Avgust Kabakchiev1,2, Vladimir Kyovtorov1, Borislav Bedzev3, Christo Kabakchiev2, Andon Lazarov4 1 Institute of Information and Communication Technologies, 1113 Sofia 2 Faculty of Mathematics & Informatics, Sofia University, 1164 Sofia 3 Faculty of Technical Sciences, University of Shumen “Bishop Konstantin Preslavsky”, 9712 Shoumen 4 Faculty of Computer Science and Engineering, Burgas Free University, 8000 Burgas E-mails: [email protected] [email protected] [email protected] [email protected] [email protected]
Abstract: In this paper a new algorithm for automatic construction of direct-sequence complementary codes, which is based on theoretical methods for synthesis of complementary signals is developed and described. A numerical method for analysis and comparison of constructed complementary codes with well-known Barker and Z-complementary codes is also proposed. Using autocorrelation and ambiguity functions of signals, the numerical method estimates the volume of sidelobes separately for each signal. The results are obtained using the specialized software program in MATLAB R2007b.
Keywords: Passive radar, complementary codes, Peak Sidelobe Level, Integrated Sidelobe Level, ambiguity function.
1. Introduction
Recently in the world the numbers of wireless communication systems like radio, TV, navigation and communication systems has increased very much. All these systems transmit energy of electromagnetic signals in the frequency range from kHz to GHz. According to the recent publications “Development and Implementation of GSM Experimental Passive Radar”, presented in the proceedings of the international conference on radar technology held in Adelaide, Australia, 2003, and “Determination the Coordinates of the Moving Target Based on GSM Passive Radar”, presented in the proceedings of the international conference Radar’2004 held in Toulouse France, 2004, this energy could be used for secondary
76
application, such as detection of objects that reflect energy. This concept is known as “Secondary Application of Wireless Technology (SAWT)” [5]. According to this concept, all sensors work in the passive receive mode, i.e., they do not emit electromagnetic waveforms. In literature such systems are often known as “passive radar systems”.
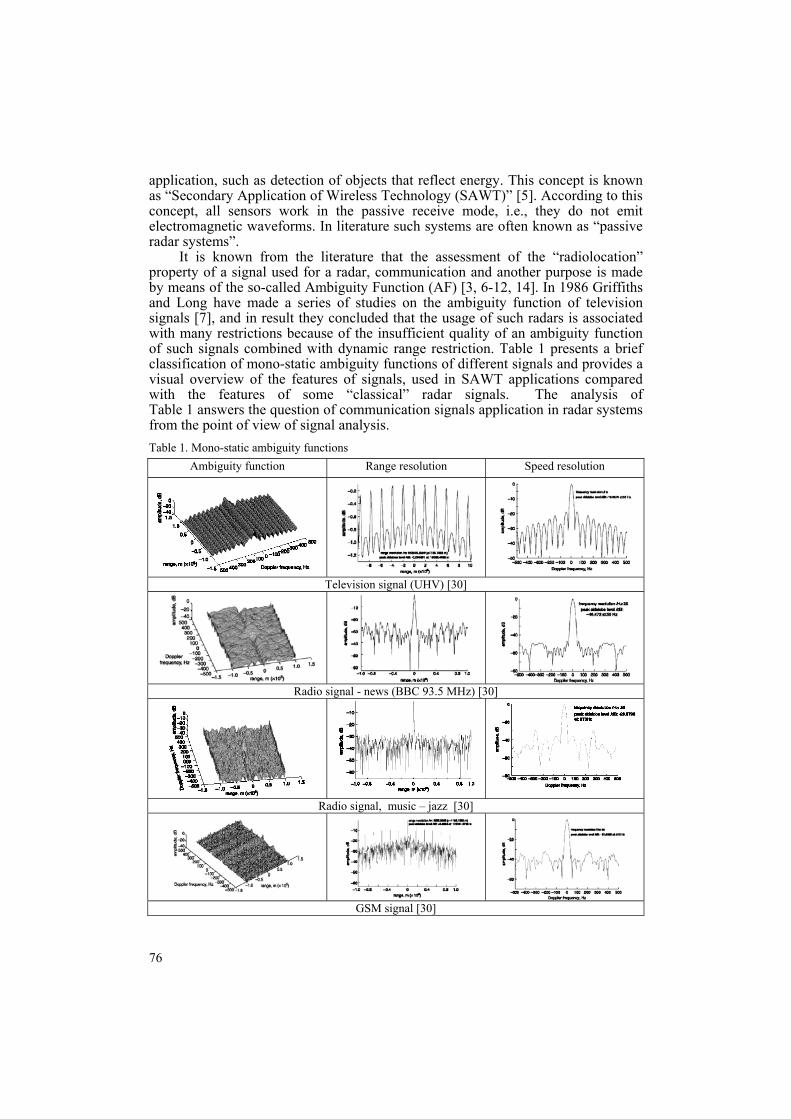
It is known from the literature that the assessment of the “radiolocation” property of a signal used for a radar, communication and another purpose is made by means of the so-called Ambiguity Function (AF) [3, 6-12, 14]. In 1986 Griffiths and Long have made a series of studies on the ambiguity function of television signals [7], and in result they concluded that the usage of such radars is associated with many restrictions because of the insufficient quality of an ambiguity function of such signals combined with dynamic range restriction. Table 1 presents a brief classification of mono-static ambiguity functions of different signals and provides a visual overview of the features of signals, used in SAWT applications compared with the features of some “classical” radar signals. The analysis of Table 1 answers the question of communication signals application in radar systems from the point of view of signal analysis. Table 1. Mono-static ambiguity functions
Ambiguity function Range resolution Speed resolution
Television signal (UHV) [30]
Radio signal - news (BBC 93.5 MHz) [30]
Radio signal, music – jazz [30]
GSM signal [30]

77
According to this approach a new algorithm for evaluating AF of different radar and communication signals is developed and realized in Matlab. It calculates both the Peak Sidelobe Level (PSL) and Average Sidelobe Level (ASL) of an ambiguity function of different signals with zero and non-zero Doppler frequency. The goal of the paper is to evaluate the properties of some direct sequence Complementary Codes (CC) constructed by the authors on the base of the extension of the classical concept of the Golay. The main idea is that direct-sequence complementary codes of high structural complexity can be generated on the basis of well-known Golay complementary codes [1, 2].
The first section of the article clarifies how to use communication signals in passive radar by using some examples. The second section of the article represents the analytical study of signals, while the third section includes a brief presentation of the theory about bounds of the volume of an ambiguity function. The computational algorithm and the results obtained are described in the last section.
2. Comparison of modern communication signals In this study, the radar properties of some complementary codes [15, 16] are estimated in respect of well-known communication or radar signals of different length [1, 2, 4, 13, 18-25]. The following types of modern communication signals are available: Orthogonal CDMA, Direct sequence complementary code (our designed codes [15, 16]), Z-complementary and Orthogonal Walsh sequences, and, finally, radar signals like Barker codes.
2.1. Orthogonal CDMA communication signals
CDMA as a standard for transmitting of data is exploited in cellular telephony systems, GPS, contemporary UMTS communication systems of the 3rd generation, etc. In the core of new CDMA architectures will be placed the usage of orthogonal complete complementary codes. As known, G o l a y [l] and T u r y n [3] studied pairs of binary complementary codes whose autocorrelation function is zero for all even shifts except the zero shift. S u e h i r o [4] extended this concept to the generation of CC code families whose autocorrelation function is zero for all even and odd shifts except the zero shift and whose cross-correlation function for any pair is zero for all possible shifts. There exist several fundamental distinctions between traditional CDMA codes (Gold codes, m-sequences, Walsh-Hadamard codes, etc.) and CC codes used in the new proposed architecture of the a CDMA system [18]. The orthogonality of CC codes is based on a “flock” of element codes jointly, instead of a single code as in traditional CDMA codes. In other words, every user in the new CDMA system will be assigned a flock of element codes as its signature code, which must be transmitted, possibly via different channels, and arrive at a correlator receiver at the same time to produce an autocorrelation peak. For example, CC codes of element code length L = 4, are shown in Table 2 (which lists two families of CC codes: for L = 4 and L = 16). There are in total four element codes (A0, A1 B0, and B1), and each user must use two еlemеnt codes (either A0, A1 or B0, B1).
78
Table 2 Element code length L = 4 Element code length L = 16
Flock1 A0; + + + − Flock1 A0; + + + + + – + – + + – – + – – + A1; + – + – + + + + + – – + + + – – A2; + + – – + – – + + + + + + – + – A3; + – – + + + – – + – + – + + + +
A1; + − ++ Flock2 B0; + + + + – + – + + + – – – + + – B1; + – + – – – – – + – – + – – + + B2; + + – – – + + – + + + + – + – + B3; + – – + – – + + + – + – – – – –
Flock2 B0; + + − + Flock3 C0 + + + + + – + – – – + + – + + – C1 + – + – + + + + – + + – – – + + C2 + + – – + – – + – – – – – + – + C3 + – – + + + – – – + – + – – – –
B1; + − − − Flock4 D0 + + + + – + – + – – + + + – – + D1 + – + – – – – – – + + – + + – – D2 + + – – – + + – – – – – + – + – D3 + – – + – – + + – + – + + + + +
2.2. Direct sequences complementary signals
In this section some methods for synthesis of complementary signals are described. As is well known, direct-sequence complementary signals are defined by G o l a y [1]. The code sequences 1
0)}({ −=
njjμ , 1
0)}({ −=
njjη composed by n numbers +1 and –1:
1–1,..., 0, 1}, {–1,)( };1,1{)( njjj =+∈+−∈ ημ , are called complementary signals or complementary codes if
(1) ⎩⎨⎧
−±±±==
=+=).1(,...,2,1;0
;0;2)()()(c nk
knkRkRkR ηημμ
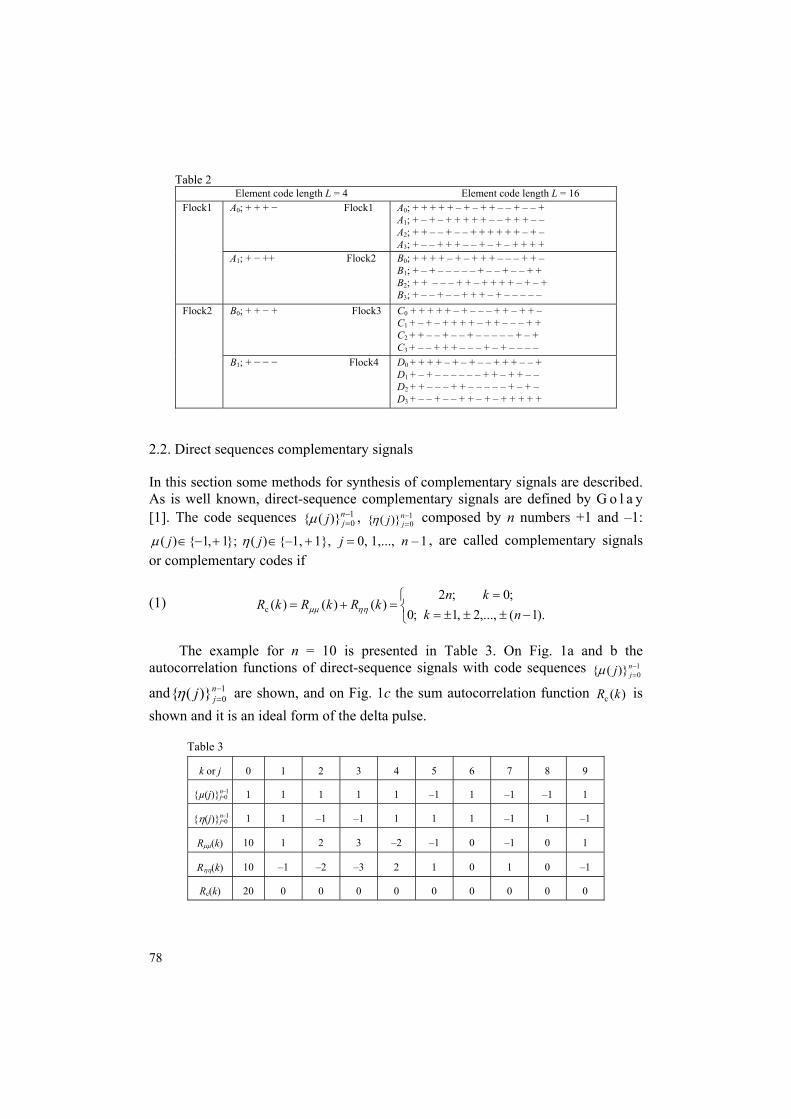
The example for n = 10 is presented in Table 3. On Fig. 1a and b the autocorrelation functions of direct-sequence signals with code sequences 1
0)}({ −=
njjμ
and 10)}({ −
=njjη are shown, and on Fig. 1c the sum autocorrelation function )(c kR is
shown and it is an ideal form of the delta pulse.
Table 3
k or j 0 1 2 3 4 5 6 7 8 9
{µ(j)}jn=–01 1 1 1 1 1 –1 1 –1 –1 1
{η(j)}jn=–01 1 1 –1 –1 1 1 1 –1 1 –1
Rμμ(k) 10 1 2 3 –2 –1 0 –1 0 1
Rηη(k) 10 –1 –2 –3 2 1 0 1 0 –1
Rc(k) 20 0 0 0 0 0 0 0 0 0

79
In [15-17], the authors developed a new algorithm and the corresponding software for synthesis of probing pulses for radar systems representing direct sequences complementary codes. This algorithm uses matrix multiplication of popular Golay codes. The principle of multiplication of the elements of composing codes is different and allows developing new complementary codes with long sequences, such as codes that are constructed using the proposed numerical method. Popular Golay codes are summarized in Fig. 2. A= [1] A1=[1 j 1] A2=[–j j 1 1 1] A3=[1 1 1 1 1–1 1–1–1 1] A4=[–1–1 1 1 1 1 1–1 1 1] A5=[–1 1–1–1 1 1–1 1 1 1 1–1 1–1 1 1 1 1–1–1 1 1 1–1 1–1]
B =[1] B1=[1 1 –1] B2=[1 j –1 1 –j] B3=[1 1–1–1 1 1 1–1 1–1] B4=[1 1–1–1 1–1 1–1 1 1] B5=[1–1 1 1–1–1 1–1–1–1–1 1 1 1 1 1 1 1–1–1 1 1 1–1 1–1]
Fig. 2. Well-known complementary codes of Golay
Rμμ(k)
Rηη(k)
10
10
20 Rc (k)
-9 9
a)
k
k
1 -8 -7 -6 -5 -4 -3 -2 -1 0 2 3 4 5 6 7 8
k
b)
c)
At the same like B ÷B 5
C C1 C2 C3 C4 C5
D D1 D2 D3 D4 D5
At the same like A-A5
Fig.1. The autocorrelation functions of direct-sequence signals with code sequences 10)}({ −
=njjμ (a, b) and 1
0)}({ −=
njjη (c)
At the same like B-B5

80
New complementary Code A N =200
–1 –1 –1 –1 –1 1 –1 1 1 –1 –1 –1 –1 –1 –1 1 –1 1 1 –1 1 1 1 1 1 –1 1 –1 –1 1 1 1 1 1 1 –1 1 –1 –1 1 1 1 1 1 1 –1 1 –1 –1 1 1 1 1 1 1 –1 1 –1 –1 1 1 1 1 1 1 –1 1 –1 –1 1 –1 –1 –1 –1 –1 1 –1 1 1 –1 1 1 1 1 1 –1 1 –1 –1 1 1 1 1 1 1 –1 1 –1 –1 1 1 1 –1 –1 1 1 1 –1 1 –1 1 1 –1 –1 1 1 1 –1 1 –1 –1 –1 1 1 –1 –1 –1 1 –1 1 –1 –1 1 1 –1 –1 –1 1 –1 1 1 1 –1 –1 1 1 1 –1 1 –1 –1 –1 1 1 –1 –1 –1 1 –1 1 1 1 –1 –1 1 1 1 –1 1 –1 –1 –1 1 1 –1 –1 –1 1 –1 1 1 1 –1 –1 1 1 1 –1 1 –1 1 1 –1 –1 1 1 1 –1 1 –1
New complementary Code B N =200
1 1 1 1 1 –1 1 –1 –1 1 1 1 1 1 1 –1 1 –1 –1 1 –1 –1 –1 –1 –1 1 –1 1 1 –1 1 1 1 1 1 –1 1 –1 –1 1 –1 –1 –1 –1 –1 1 –1 1 1 –1 1 1 1 1 1 –1 1 –1 –1 1 –1 –1 –1 –1 –1 1 –1 1 1 –1 –1 –1 –1 –1 –1 1 –1 1 1 –1 1 1 1 1 1 –1 1 –1 –1 1 1 1 1 1 1 –1 1 –1 –1 1 –1 –1 1 1 –1 –1 –1 1 –1 1 –1 –1 1 1 –1 –1 –1 1 –1 1 1 1 –1 –1 1 1 1 –1 1 –1 –1 –1 1 1 –1 –1 –1 1 –1 1 –1 –1 1 1 –1 –1 –1 1 –1 1 –1 –1 1 1 –1 –1 –1 1 –1 1 –1 –1 1 1 –1 –1 –1 1 –1 1 –1 –1 1 1 –1 –1 –1 1 –1 1 1 1 –1 –1 1 1 1 –1 1 –1 1 1 –1 –1 1 1 1 –1 1 –1
Fig. 3. Two new constructed complementary codes by the authors
Two new complementary code sequences, obtained using the algorithm that includes matrix multiplication are shown on Fig. 3. Each one of the new code sequences has two hundreds chips. The developed algorithm for synthesis is based on the following theorem:
Theorem of Golay. If Complementary codes 10)}({ −
== njjA μ , 1
0)}({ −== n
jjB η are known with length n and Complementary codes 1
0)}({ −== r
jjC ξ , 10)}({ −
== rjjD ζ with
length r then we have the sequences:
1) };)0(...,,)2(,)1(,)0(...,,)2(,)1({
};)1(...,,)1(,)0(,)1(...,,)1(,)0({BBrBrAArArL
BrBBArAAKξξξζζζ
ζζζξξξ−−−−−−−=
−−=
2) }.)0(,)0(...,,)2(,)2(,)1(,)1({
};)1(,)1(...,,)1(,)1(,)0(,)0({BABrArBrArN
BrArBABAMξζξζξζ
ζξζξζξ−−−−−−−=
−−=

81
Two software programs (a numerical method and synthesis of CC) have been uploaded on Matlab site: user community/file exchange.
2.3. Z-complementary
Z-complementary sequences include the conventional complementary sequences as special cases. Constructions of Z-complementary binary sequences and their mates are given together with some conjectures. It is shown that there exist many more Z-complementary binary sequences and many more Z-complementary mates in comparison with the normal complementary counterparts [21].
Let a = (a(0), a(1), …, a(N – 1)) and b = (b(0), b(1), …, b(N – 1)) be binary sequences of length N with a(i) ± 1, b(i) ± 1, respectively, 0 ≤ i ≤ N – 1. The aperiodic Cross-Correlation Function (CCF) of a and b is defined as
(2) ( ) ( ) ( ),1
0, kjbjakA
kN
jba += ∑
−−
=
10 −≤≤ Nk .
When ba = , the above definition becomes an aperiodic Auto-Correlation Function (ACF) ( )kA a . A set of P binary sequences {a1, a2, …, ap}, each having
length N, is called a set of Z-complementary sequences (Z-CSPN) if
(3) ∑= ⎩
⎨⎧
−≤≤=
=P
ia Zk
kNPkA
i1 11,0
,0,)(
Z is called as a Zero Correlation Zone (ZCZ). Obviously, the above definition includes the conventional complementary set as a special case when NZ = . For
2=P , it is well-known that the complementary binary sequences exist only for very limited lengths such as cba 26102 for a, b, c ≥ 0. In fact, for N ≤ 100, only Golay pairs of lengths 2, 4, 8, 10, 16, 20, 26, 32, 40, 52, 64, 80, 100 have been found. However, the Z-complementary pair of binary sequences exists for many more lengths when 100≤N . Another set of Z-CSP
N{b1, b2, …, bp} is called a
Z-complementary mate of Z-CSPN{a1, a2, …, ap} if
(4) ( ) 01
=∑=
kAP
iba ii
, 10 −≤≤ Zk .
When Z = N, the Z-complementary mate becomes the conventional complementary mate. For a given complementary set, containing P sequences, it is shown that there exist at most P distinct complementary mates. However, for a Z-complementary set with a zero correlation zone Z and P binary sequences each having length N, there exist more than P distinct Z-complementary mates. Similar to conventional complementary sequences, Z-complementary binary sequences can be constructed by basic sequence operations or from basic kernels.

82
Fig. 4. Kernels of Z-complementary sequences [21]
Table 4. Ortogonal Walsh sequences
2.4. Orthogonal Walsh sequences
Orthogonal Walsh sequences and their different possible variations are perfectly orthogonal binary (antipodal) block codes that are in use in many popular applications over several decades including synchronous multiuser communications and signal processing. It is well known that they perform poorly for the case of asynchronous multiuser communications like Direct Sequence – Code Division Multiple Access (DS-CDMA) communications standards [22-25]. 13 Orthogonal Walsh sequences are given in Table 4. Walsh codes are defined as a set of N codes, denoted Wj, for j = 0, 1, ... , N − 1, which has the following properties:

83
Wj takes on the values +1 and −1. Wj [0] = 1 for all j. Wj has exactly j zero crossings, for j = 0, 1, ... , N −1.
⎩⎨⎧
=≠
=,,,,0T
kjNkj
WW kj
∫ =T
0
.)()(1jkkj dttWtW
Tδ
Each code Wj is either even or odd with respect to its midpoint.
3. Algorithm for partial minimization of the volume of the body of ambiguity of communication signals
For evaluating the quality of the signals under study, we use the well-known practical approach used in radar applications [9-11, 13], according to which the “good” signal has the lowest level of sidelobes of its ambiguity function. Such a signal is called a signal with partially minimization of the volume of the body of ambiguity [9-11, 13] Vi(σm) in the area σm (Fig. 5). The optimization criterion is minimization of the integral estimate of AF: (5) Vi(σm) = min|),(|
m
d2
d =∫∫σ
ττχ dfdf
wherever ( ) ( ) dttfitutuf d*d
2)(, πττχ −+∫∞
∞−= l − an ambiguity function of signal ).(tu
Fig. 5. Preferred form of the ambiguity function of signal
by restriction max range and speed of target
This approach allows us to synthesize or select one of the known signals, in order to provide the required both resolution and measurement errors of coordinates ),( dfτ , and to guarantee the minimal level of sidelobes in the signal parameter space (in workspace): (6)
maxτ
maxττ ≤≤ ;
dmaxf .
dmaxd ff ≤≤
fd
τeff
1
T
τmax τmax 2Feff
2fdmax
2Тeff
a) b)

84
The solution of this problem is the complicated procedure for approximate estimating of the Peak Sidelobe Level (PSL) and the Average Sidelobe Level (ASL) of an ambiguity function with zero and non-zero Doppler frequency, in condition of partial minimization of the volume of the ambiguity body.
3.1. Numerical evaluation of sidelobes
In the study we use the general definition of the following quality factors: Maximal Peak Sidelobe Power (PSP), Peak Sidelobe Level (PSL), Integrated Sidelobe Level (ISL) and Golay Merit Factor (MF). These quality factors are often used in order to analyze the volume of signal sidelobes at the filter output:
• Max PSP = 1/N is the maximum amplitude at the filter output , and N is the code length,
• PSL – the highest sidelobe power level relative to the main lobe:
(7) PSL=Power Mainlobe Total
Power SidelobePeak log 10 ,
• ISL –the power distributed in all sidelobes and defined as:
(8) ISL=Power Mainlobe Total
Sidelobesover IntegratedPower log 10 .
Binary sequences with a high Merit Factor are desirable objects, having application in telecommunication and information theory. However, they are also very difficult for construction, in particular, when a sequence length increases. The Merit Factor metric was firstly proposed by Golay, as a way to measure sequences with low aperiodic autocorrelation sidelobes. The highest Merit Factor known as 14:08 is satisfied by a binary Barker sequence of length 13. Barker sequences are binary sequences with aperiodic autocorrelation coefficients, ak∈{–1, 0.1}, k ≠ 0.
• The Golay Merit Factor (MF) of a binary sequences of length N is given by
(9) MF = ∑ −
=
1
12
2
||2N
k ka
N ,
(10) ( ) ,1 ,1AACF1
0
NkakN
i
kisisk <≤−== ∑
−−
=
+−
AACF − an Aperiodic AutoCorrelation Function.
4. Experiment description
The effectiveness of various types of complex communication signals is evaluated for their use in a contemporary radar system. The computational algorithm approximately computes the Peak Sidelobe Level and the Integral volume of Sidelobe Level of an ambiguity function when Doppler velocity is equal or not to zero. The ambiguity function for the Doppler velocity in the range of [0,−50] m/s will be identical. In the study we use the algorithm for partially minimization of the

85
volume of an ambiguity function. The effectiveness of the algorithm depends on such parameters of a complex communication signal as the number of pulses and the amplitude of pulses.
The amplitudes of the communication signals are normalized in order to be compared in equal conditions. In order to carry out the experiment, the input data must be complex signals of type [−1 −1 −1 −1 −1 1 1 −1 −1 1 −1 1 −1].
The block diagram of the computational algorithm used in the study is given in Fig. 6.
Fig. 6. Block-diagram of the computational algorithm
Description of the experiment: The specialized program package, whose structure is presented in Fig. 6, is developed in Matlab environment. First this program package computes the PSL and the ISL of the autocorrelation function of the signals. Then it calculates the minimal volume of the ambiguity function and again calculates both PSL and ISL on the new area of the ambiguity function (Fig. 5a).
The following activities are made according to the block scheme of the program package. At the first stage, the ACF is computed according to the parameters of a signal and then normalized. In the case of a complementary signal two codes are input, their ACF are calculated and summed. After that, the Merit factor and both PSL and ISL are computed by using (7, 8 and 9), and finally the numerical and graphical results are displayed.
Fig. 7 demonstrates one type of a direct-sequence communication signal and its autocorrelation function.
At the next stage, the algorithm performs partial minimization of the volume of an ambiguity function by using (5) and a new matrix is then normalized. In the case of complementary codes their new matrices are summed. Next, the PSL and
Plot resulting pulse compression signal
Compute ISL and PSL
Minimize Volume of Ambiguity function and normalize.
If Signal complementary SUM their new minimize Ambiguity function
Compute Merit Factor
Compute ISL and PSL on New minimize Ambiguity function
End and Plot New Ambiguity function.
Input data to estimate signal
Complex signals
Compute Autocorrelation function and normalize result.
If Signal complementary SUM their Autocorrelation function

86
ISL of a new minimized matrix (i.e., a new ambiguity function) are calculated and the numerical and graphical results obtained are displayed. A new minimized ambiguity function is shown in Fig. 8. The main purpose of this study is to see which of these communication signals has the best PSL and ISL.
0 2 4 6 8 10 12 14-1
-0.5
0
0.5
1 Phase coded transmit waveform
0 5 10 15 20 250
0.2
0.4
0.6
0.8
1 Resulting Pulse Compression
main lobe power
range sidelobes
Fig. 7. Direct sequence communication signal Fig. 8. Graphic on a new minimized and its autocorrelation function ambiguity function
4.1. Results obtained for different communication signal
In the study different kinds of communication signals with different parameters of contemporary communications codes are divided in different groups. Our hypothesis, realized in this experiment is that all signals should be compared in equal conditions, which in practice means that different codes must be of equal or close length. For that reason we separated all codes under study in two groups: long and short.
The group of short codes includes 11 and 30 chips. We investigated the most famous codes like: Barker (n = 11; n = 13); the complementary codes of Golay with n = 10; two new constructed complementary codes with n = 18 (our designed codes); Z-complementary codes with n from 13 to 26; Walsh-Chirp with n =16. The group of long codes includes 150 and 300 chips. The following codes are considered: IS-95A (128 chips) from Matlab; direct-sequence complementary code (n = 200) shown in Fig. 3 [15, 17]; IS-95A Walsh code with n = 320 from MATLAB.
The values of PSL and ISL obtained for the ACF are presented in Table 5 – for short codes and in Table 6 − for long codes. The values of PSL and ISL obtained for the ambiguity function are presented in Table 7 – for short codes and in Table 8 – for long codes.
The results in Table 7 and Table 8 are obtained for the case when the Doppler frequency is different from zero and the partial minimization of the volume of an ambiguity function is performed.
510
1520
25
05
1015
2025
0
0.2
0.4
0.6
0.8
1
τ/ΤνΤ
|χ(τ
,ν)|

87
Table 5
No Short codes to ACF ASL PSL Merit Factor S(A)
1 Barker, n=11 –10.8279 dB –20.8279 dB 12.1000 1 2 Barker, n=13 –11.4871 dB –22.2789 dB 14.0833 1
3 Complementary code – Golay, n=10, (CodeA4, CodeB4); Fig. 1 [15] –169.5459 dB –176.0241 dB – 1
4
A1=[1 j 1] B1=[1 1 –1] Golay, complementary code n=3 Synthesize of two new complementary codes with n=18 [15]
–169.0883 dB –177.3394 dB – 1
5 Z-complementary sequences n=13 Fig. 4 –14.4974 dB –25.2892 dB – 1 6 Z-complementary sequences n=15 Fig. 4 –13.9794 dB –21.7609 dB – 1 7 Z-complementary sequences n=22 Fig. 4 –19.0669 dB –23.8382 dB – 1 8 Z-complementary sequences n=26 Fig. 4 –170.6853 dB –178.1928 dB – 1
9 Complementary code (A0, A1), n=16 from Table 2; [18] –15.0515 dB –21.0721 dB – 1
10 Complementary code (B0, B1), n=16 from Table 2; [18] –15.0515 dB –21.0721 dB – 1
11 Walsh-Chirp sequences, n=16 (1 from Table 4) –2.8767 dB –13.2906 dB 1.9394 1 12 Walsh-Chirp sequences, n=16 (2 from Table 4) –3.0103 dB –13.2906 dB 2 1 13 Walsh-Chirp sequences, n=16 (3 from Table 4) –3.9121 dB –15.0515 dB 2.4615 1
Table 6
№ Long codes to ACF ASL PSL Merit Factor S(A)
IS-95A (128 chips extract), MATLAB –13.2802 dB –32.2728 dB – 1
1 Complementary code, n=200, synthesize; Fig. 3 [15] –173.5253 dB –190.6529 dB – 1
2 IS-95A Walsh Code, n=320, MATLAB –10.9206 dB –26.9224 dB 12.3612 1
Table 7 No Short codes to MAF ASL PSL S(A) Volume
1 Barker, n=11 −12.4832 dB −25.1462 dB 1 t/2; f/2 2 Barker, n=13 −12.4716 dB −26.5362 dB 1 t/2; f/2
3 Complementary code – Golay, n=10 (Code A4, Code B4); Fig. 2 [15] −19.5044 dB −30.3786 dB 1 t/2; f/2
4
A1 =[1 j 1] B1=[1 1 −1] Golay Complementary code, n=3 Synthesize of two new complementary codes with n=18 [15]
−23.3011 dB −35.2902 dB 1 t/2; f/2
5 Z-complementary sequences, N=13, Fig. 4 −22.0817 dB −32.5568 dB 1 t/2; f/2
6 Z-complementary sequences, N=15, Fig. 4 −23.2595 dB −33.7550 dB 1 t/2; f/2
7 Z-complementary sequences, N=22, Fig. 4 −24.0284 dB −36.9892 dB 1 t/2; f/2
8 Z-complementary sequences, N=26, Fig. 4 −23.4602 dB −38.4098 dB 1 t/2; f/2
9 Complementary code (A0, A1), L=16 from Table 2;[18] −23.1129 dB −34.2974 dB 1 t/2; f/2
10 Complementary code(B0, B1), L=16 from Table 2; [18] −23.1129 dB −34.2974 dB 1 t/2; f/2
11 Walsh-Chirp Sequences, n=16 (1 from Table 4) −12.4636 dB −26.5812 dB 1 t/2; f/2
12 Walsh-Chirp Sequences, n=16 (2 from Table 4) −12.8136 dB −26.5812 dB 1 t/2; f/2 13 Walsh-Chirp Sequences, n=16 (3 from Table 4) −13.4391 dB −28.2768 dB 1 t/2; f/2

88
Table 8 No Long codes to MAF ASL PSL S(A) Volume
IS-95A (128 chips extract), MATLAB −28.2769 dB −52.1211 dB 1 t/2; f/2
14 Complementary code (n=200) synthesize; Fig. 3 [15] −24.1118 dB −49.9647 dB 1 t/2; f/2
15 IS-95A Walsh Code n=320, MATLAB −25.2661 dB −53.8447 dB 1 t/2; f/2
The experimental results given in Table 4 show that the constructed complementary signals with 18 chips and the Z-complementary signals composed of 26 chips have the lowest sidelobe level of the ACF, but the constructed complementary code is shorter than the Z-complementary code, and for this reason it is the best code. Similar results, obtained for the Minimized Ambiguity Function (MAF) of short signals, are shown in Table 7. As expected, the constructed complementary codes have the lowest sidelobe level of the ACF and the MAF, which decreases with increase of the code length. The other interesting result is that the short complementary codes have better characteristics (ACF, MAF) compared with some well-known very long communication codes. It can be concluded by analyzing the characteristics (ACF, MAF) of two different short and long (Z-complementary n = 26; IS-95A Walsh code n = 320, MATLAB) codes. It can be seen that the Z-complementary codes with n = 26 have better quality parameters (PSL and ISL) of ACF compared with the ones of the long code sequence IS-95A Walsh code with n = 320.
0 50 100 150 200 250 300 350-1
-0.5
0
0.5
1 Phase coded transmit waveform
0 100 200 300 400 500 600 7000
0.2
0.4
0.6
0.8
1 Resulting Pulse Compression
main lobe power
range sidelobes
Fig. 9. Autocorrelation function of two difference pair of codes
On Figs. 10 and 11 the minimized ambiguity functions of the following codes
are presented: two new constructed complementary codes with n = 18 and a Walsh code n = 16. The comparison analysis of the results presented in Figs. 10 and 11 shows that the Walsh codes have the highest side lobes of ACF and MAF.
0 10 20 30 40 50 60-10
0
10
20
30 Pulse Compression of Zcomplementary sets
Zcomlplementary 1Zcomplementary 2
0 10 20 30 40 50 600
0.2
0.4
0.6
0.8
1 Resulting Pulse Compression
main lobe power
range sidelobes
Z-complementary Walsh code

89
5. Conclusion
The study performed for different communication signals enables us conclude that: • The Barker code with 13 chips is used as a reference signal in order to test
the developed algorithm and its program version. The numerical results obtained for the ACF are: Average Sidelobes Level − 11.4871 dB, Peak Sidelobe Level − 22.2789 dB, Merit factor − 14.0833. These results are published earlier in the literature.
• During the experiment, all codes under test are divided into two groups: short and long. This means that all tested signals must be codes of the same or close length, i.e., all tested signals must be analyzed under equal conditions.
• The analysis shows that each group of signals contains such codes, ACF and MAF, which have much better parameters compared to the other codes.
• According to theory the code characteristics are improved with increase of the code length, but the comparison analysis of known long codes and shorter complementary code couple shows that the characteristics of the sum of ACF and MAF of the complementary code couple are better.
R e f e r e n c e s
1. G o l a y, M. J. E. Complementary Series. – IEEE Trans Info. Theory, Vol. IT-7, 1961, 82-87. 2. G o l a y, M. J. E. Seives for Low Autocorrelation Binary Sequences. – IEEE Trans. Inform.
Theory, Vol. IT-23, 1977, No 1, 43-51. 3. T u r y n, R. Ambiguity Function of Complementary Sequences. – IЕЕЕ Trans. Info. Theory,
Vol. IT-9, January 1963, 46-47. 4. S u e h i r o, N. Complete Complementary Code Composedof N-Multipleshift Orthogonal
Sequences. –Trans. ЕICЕ, Vol. J65-A, December 1982, 1247-1253 (in Japanese).
Fig. 11. Minimized ambiguity functions of Walsh code
Fig. 10. Minimized ambiguity functions of Synthesize of two new complementary codes

90
5. C h e r n i a k o v, M., M. K u b i k. Secondary Applications of Wireless Technology (SAWT). – In: 2000 European Conference on Wireless Technology, Paris, 2000.
6. P a p o u t s i s, I., C. B a k e r, H. G r i f f i t h s. Fundamental Performance Limitation of Radar Networks. – In: First EMRS DTC Technical Conference, Edinburgh, 2004.
7. G r i f f i t h s, H., B. L o n g. Television Based Bistatic Radar. – In: IEE Proc. F. Commun. Radar Signal Process, 133, 1986, 649-657.
8. L e v a n o n, N., F. A v r a h a m. Ambiguity Function of Quadraphase Coded Radar Pulse. – IEEE Transaction on Aerospace and Electronic Systems, Vol. 25, November 1989, No 6.
9. P r i c e, R., E. M. H o f s t e t t e r. Bounds on the Volume and Height Distributions of the Ambiguity Function. – IEEE Trans. on Information Theory, Vol. IT-11, 1965, 207-214.
10. V a k m a n, D. E., R. M. S e d l e t s k i i. Problems in Synthesis of Radar Signals. Moscow, Soviet Radio, 1973. 312 p. (in Russian).
11. V a k m a n, D. E. Complex Signals and Ambiguity Function. Moscow, Soviet Radio, 1965 (in Russian).
12. B a k e r, C., H. G r i f f i t h s, I. P a p o u t s i s. Passive Coherent Location Radar Systems. Part 2: Waveform properties. – In: IEE Proc.-Radar Sonar Navig., Vol. 152, June 2005, No 3.
13. S h i y a n o v s k i, E. N. Receive D – Cods with Discrete Complex Signal in SAR (in Russian). 14. T a n, T., H. S u n, Y. L u. Ground Moving Target Measurements Using a GSM Based Passive
Radar. – In: Radar 2004, Toulouse France, 2004. 15. K a b a k c h i e v, A. Automatics Synthesis of Discrete Complex Signals. MSc Thesis, National
Military University “V. Levsky”, Shumen, 2003. 96 p. ( in Bulgarian). 16. B e d z h e v, B. Increasing the Noise Resistance of the Radars on the Base of Methods of the
Modern Algebra. DSc Thesis, National Military University “V. Levsky”, Shumen, 2003. 273 p. ( in Bulgarian).
17. K y o v t o r o v, V. Detection and Assessment of Target Coordinates in a Radar Sensor Network. PhD thesis, Technical University of Sofia, 2006. 160 p. (in Bulgarian).
18. C h e n, H s i a o-H w a, J u n-F e n g Y e h, N a o k i S u e h i r o. A Multicarrier CDMA Architecture Based on Orthogonal Complementary Codes for New Generations of Wideband Wireless Communications. – Topics in Wireless Communication – IEEE Communication Magazine October 2001, Vol. 39, October 2001, Issue 10, 126-135.
19. P i n g z h i F a n, Senior Member, IEEE, W e i n a Y u a n, Y i f e n g T u. Z-complementary Binary Sequences. – IEEE Signal Processing Letters, Vol. 14, August 2007, No 8.
20. T s e n g, C.C., C. L. L i u. Complementary Sets of Sequences. – IEEE Trans. Information Theory, Vol. IT-18,1972, No 5, 644-652.
21. P i n g z h i, F., W. Y u a n, Y. T u. Z-Complementary Binary Sequences. – IEEE Signal Processing Letters, Vol. 14, August 2007, No 8.
22. W y s o c k i, B. J., A. T a d e u s z W y s o c k i, H.-J. Z e p e r n i c k. Walsh-Chirp Sequences for Wireless Applications. – Journal of Telecommunications and Information Technology, Vol. 2, 2001, No 2, 24-28.
23. W a l s h, J. L. A Closed Set of Normal Orthogonal Functions. – Amer. J. Math., Vol. 55, 1923, 5-24.
24. A k a n s u, A l i N., R a d h a P o l u r i. Walsh-Like Nonlinear Phase Orthogonal Codes for Direct Sequence CDMA Communications. – IEEE Transactions on Signal Processing, Vol. 55, July 2007, No 7, 3800-3806.
25. W y s o c k i, B e a t a J., T a d e u s z A. W y s o c k i, H a n s J. Z e p e r n i c k. Walsh-Chirp Sequences for Wireless Applications. – Journal of Telecommunications and Information Technology, Vol. 2, 2001, No 3, 24-28.