Embed Size (px)
Citation preview

Numerical analysis of ammonia homogenization for selective catalytic
reduction application
Jakov Baletaa, Matija Martinjakb, Milan Vujanovića, Klaus Pachlerc, Jin Wangd, Neven Duića
aFaculty of Mechanical Engineering and Naval Architecture
University of Zagreb,
Ivana Lučića 5, 10 002 Zagreb, Croatia
e-mail: [email protected], [email protected], [email protected]
bTE-TO Sisak, HEP Proizvodnja d.o.o.
Industrijska cesta 10, 44010 Sisak, Croatia
e-mail: [email protected]
cAVL List GmbH,
Alte Poststraße 152, 8020 Graz, Austria
e-mail: [email protected]
dSchool of Energy and Environmental Engineering
Hebei University of Technology,
Xiping Road No.5340,Beichen District, Tianjin, 300401,China
e-mail: [email protected]
Corresponding author

ABSTRACT
Selective catalytic reduction based on urea water solution as ammonia precursor is a
promising method for the NOx abatement form exhaust gasses of mobile diesel engine units.
It consists of injecting the urea-water solution in the hot flue gas stream and reaction of its
products with the NOx over the catalyst surface. During this process flue gas enthalpy is used
for the urea-water droplet heating and for the evaporation of water content. After water
evaporates, thermolysis of urea occurs, during which ammonia, a known NOx reductant, and
isocyanic acid are generated. The uniformity of the ammonia before the catalyst as well as
ammonia slip to the environment are important counteracting design requirements,
optimization of which is crucial for development of efficient deNOx systems.
The aim of this paper is to show capabilities of the developed mathematical framework
implemented in the commercial CFD code AVL FIRE®, to simulate physical processes of all
relevant phenomena occurring during the SCR process including chemical reactions taking
part in the catalyst. First, mathematical models for description of SCR process are presented
and afterwards, models are used on the 3D geometry of a real SCR reactor in order to predict
ammonia generation, NOx reduction and resulting ammonia slip. Influence of the injection
direction and droplet sizes was also investigated on the same geometry. The performed study
indicates importance of droplet sizes on the SCR process and shows that counterflow
injection is beneficial, especially in terms of minimizing harmful ammonia slip to
environment.
Key words: computational fluid dynamics, NOx reduction, selective catalytic reduction, spray
preparation, urea-water solution, ammonia slip

1. INTRODUCTION
Despite almost quarter century of global efforts on the reduction of harmful atmospheric
emissions, the latest reports on anthropogenic global warming indicate that still increased and
joint global action is necessary in order to reduce greenhouse gas emission and harmful
emissions in generally (“Cause of climate change,” n.d.). Among harmful emissions nitrogen
oxides, referred commonly as NOx, take important place. Although European Environment
Agency (EEA)-33 emissions of nitrogen oxides (NOx) from transport decreased by 39% between
1990 and 2014 (European Environment Agency, n.d.), they are still subject to ever increasing
emission standards (European Union, Regulation (EC) No 715/2007, 2007) in order to minimize
their harmful environmental impact. In 2014, the most significant sources of NOx emissions were
road transport (40.15 %), energy production and distribution (21.33%) and the commercial,
institutional and household (13.38%) sectors (EEA, 2014).
Methods of NOx control may be categorized according to the stage of combustion they tackle
into pre-combustion, combustion and post-combustion methods (Tayyeb Javed et al., 2007).
Selection of individual method or combination of methods is always conditioned by economic
balances and legislation. Pre-combustion methods imply fuel treatment in order to decrease
amount of fuel bounded nitrogen, which is fairly expensive and thus not applicable for real
industrial cases. Lately, there was increasing trend of replacing fossil fuels with alternative fuels
(Honus et al., 2016) to some extent, thereby co-firing the mixture of fossil and alternative fuel
(Mikulčić et al., 2016). Moreover, related to combustion NOx control methods, first option
consists of regulation of the excess air, keeping at the same time in mind the fact that it directly
affects unburned carbon emissions. Combustion air staging creates fuel-rich primary zone and
fuel-lean secondary zone, supressing that way creation of fuel NOx. Similarly like combustion
air, fuel can also be staggered through creating a fuel-rich secondary combustion zone, where
NOx formed in the primary combustion zone is decomposed. Exhaust gas recirculation, a

technique frequently employed in modern internal combustion engines (Kozarac et al., 2014), as
well represents one of the primary NOx reduction measures which can significantly reduce
thermal NOx generation by lowering combustion temperatures and excess air. Porous burners
have characteristics that make them suitable for NOx reburning and their usage has been growing
in extent lately (Mujeebu et al., 2009).
Recent tightened EURO 6 NOx emission standard introduced significant reduction of NOx
emissions to 80 mg/km compared against 180 mg/km defined in previous EURO 5 standard
(Grout et al., 2013). This requirement cannot be met using described primary NOx reduction
techniques anymore and solution should be found in utilizing exhaust gas aftertreatment
techniques. During the last decade urea water solution (UWS) based selective catalytic reduction
(SCR) broke through as a most promising deNOx method for transportation sector (Baleta,
2013). Since its inception in the early 1970s in stationary industrial applications (Fang and
DaCosta, 2003), UWS-SCR has grown in extent covering also mobile applications of road
vehicles and marine transport.
UWS is precursor for ammonia generation due to its toxicity and harmful environmental impact.
Usually a 32.5%w urea solution, commercially named AdBlue, is sprayed into hot exhaust gases
where few processes are taking part sequentially. First, the water evaporates from the droplets.
Then, ammonia is generated through thermal decomposition of urea and hydrolysis of isocyanic
acid if the temperature of the exhaust gases is suitably high. The resulting ammonia is dispersed
due to interaction with turbulent fluctuations within gas flow. So, the task of UWS-SCR system
before the catalyst is to provide suitable residence time for complete thermal decomposition and
to ensure ammonia uniformity before the catalyst. Otherwise, many problems can occur – from
deposit formation and passivation of the catalyst parts to the toxic ammonia slip in environment.
Additional design challenges to the equipment manufacturers are transient working conditions of
internal combustion engines for mobile applications and confined engine space, which makes
design of the SCR system and spray preparation task far more than trivial.
Presented literature overview is combination of recent experimental and numerical efforts in
order to better understand physical and chemical phenomena taking place in UWS-SCR system
and to provide optimal design guidelines. (Jeong et al., 2008) numerically investigated effects on
injector location, configuration and operating conditions on local uniformity of NH3 before the
catalyst. (Liao et al., 2015) experimentally analysed spray characteristics of four commercially
available injectors by employing non-intrusive measuring techniques with the aim of assessing
the spray quality in different flow conditions. (Lee et al., 2012) experimentally studied two types
of mixing chambers design effect on urea thermal decomposition. Experimental work carried in
(Grout et al., 2013) showed that UWS spray evaporation is an important step that could also
entail usage of additional evaporation strategy such as static mixer, especially in confined space
of engine. (Cho et al., 2014) performed numerical analysis of UWS-SCR system by varying
three different lengths of decomposition pipe and by employing two different types of static
mixers. (Oh and Lee, 2014) experimentally examined basic spray characteristics of urea injector.
They determined optimal location and mixer type in the flow conditions closely resembling those
in real exhaust systems of road vehicles diesel engines. (Tian et al., 2015) numerically
investigated the distance between UWS nozzle and reactor from the perspective of UWS droplet
evaporation and urea decomposition. Numerical simulation of marine SCR system under engine
like operating conditions was conducted by (Choi et al., 2015). Different combinations of
mixing chamber and swirl type static mixer were investigated with respect to ammonia
homogenization. Also, (Chen and Lv, 2015) were dealing with design of compact integrated
SCR and exhaust muffler unit for marine diesel applications. Numerical simulations were
performed with respect to unit pressure loss and NOx conversion efficiency. (Varna et al., 2015)
conducted experimental and numerical assessment of UWS droplets impingement and mixing

but they also analysed only processes upstream of the catalyst with respect to ammonia
preparation. (Smith et al., 2014) studied deposit formation in urea SCR system both
experimentally and numerically. They developed predictive subroutine for deposit occurrence
based on thorough parametric analysis. (Betageri et al., 2016) investigated effect of injection
configurations on the deposit formation in the SCR system of a diesel engine by combination of
vehicular trials and detailed CFD simulation. Work carried out by (Sadashiva Prabhu et al.,
2017) took into account deposit formation in SCR pipe for different flow rates in the low
temperature range between 150 and 250°C. However, the deposition formation model was not
developed, but solely the remaining wall film after water evaporation was assumed to become
deposit. From the standpoint of reductant dosing control, special challenge lies in managing the
SCR system in a way that will enable high denitrification efficiency together with low ammonia
slip. (Zhang and Wang, 2016) investigated the adaptive sliding-mode observer design problem
for the selective catalytic reduction (SCR) system in diesel-engine aftertreatment system as a
support for dosing system. Optimal dosing and sizing strategy of two-cell SCR system was
proposed in the work of (Zhang et al., 2016) on the basis of dynamic programming algorithm.
It can be seen that most of the research from the available literature deals with processes
happening upstream of the catalyst. Studies taking into account the complete SCR system
including dosage, mixing chamber and catalyst are not so frequently encountered. Therefore, the
aim of this work is the numerical analysis of ammonia homogenization in the geometry of real
SCR system. This research represents continuation of the research conducted previously where
validated numerical framework was established for SCR and SNCR applications (Baleta et al.,
2016). This manuscript is composed as follows. In the proceeding part, relevant mathematical
models composing numerical framework for UWS-SCR are described. Afterwards, a 3D
turbulent reacting flow CFD model involving reaction mechanism on the catalyst surface is
applied on the real SCR system geometry with exhaust gas composition, flow rate and

temperature resembling those of diesel engines. Six simulated cases are divided into two
simulation groups in order to study the influence of injection direction and droplet size on
ammonia generation and uniformity. Finally, important findings are summarized together with
recommendations for future research work.
2. MATHEMATICAL MODEL
In order to accurately represent all relevant physical phenomena occurring during the injection of
urea-water solution (UWS) into hot flue gases mathematical description of processes is needed
as follows:
solution of gas phase;
description of spray droplets motion inside the domain;
evaporation of urea-water solution droplets;
thermal decomposition of urea;
chemical reactions taking place on the catalyst surface;
accurate and computationally economical representation of turbulence.
2.1.Gas phase
Mass conservation law (continuity equation) for differential element of fluid in Cartesian
coordinate system can be expressed as follows:
0)(
j
j
uxt
(1)
where ρ is fluid density, t represents time, xj Cartesian coordinates and uj velocity vector
components. For incompressible fluid, equation (1) states that the divergence of velocity is
equal to zero.
Momentum conservation law for infinitesimal, incompressible Newtonian fluid element can
be stated as:

i
jj
i
i
ji
j
i fxx
u
x
puu
xu
t
2
)()( (2)
Momentum conservation law equations for Newtonian fluid together with continuity equation
(1) are also called Navier-Stokes equations according to the researchers who were first to
derive them.
Energy conservation law can be written as:
j
iji
ii
jjj
j
j
j x
vvf
x
T
xx
upiu
xi
t
)()()( (3)
where i is specific internal energy of fluid.
Significant commonalities between presented governing equations justify introduction of a
general variable φ, which enables us to write general conservative form of all fluid flow
equations as follows:
S
xxu
xt jj
j
j
)()()( (4)
General transport equation of scalar quantity could be decomposed on characteristic members,
each having distinguished physical meaning and inherent properties. First term on the left
hand side of the equation (4) represents time rate of change of general variable φ, second term
on the same side is convective transport of the same variable, first term on the right hand side
describes diffusional transport of φ, whilst the last term of the equation represents source/sink
of the variable φ due to various mechanisms, not being covered by the three previous ones.
General transport equation (4) represents basic equation upon which the numerical theory of
CFD is being built.
2.2. UWS spray
The most commonly used method for spray calculation today is Discrete Droplet Method
(DDM) (Yuen and Chen, 1976), although Euler Eulerian size of class model has drawn attention

recently for specific tasks, such as computation of spray in the vicinity of nozzle (Petranović et
al., 2017). Taking into account current state of CFD techniques, it would be impossible to solve
differential equations for the trajectory, momentum, heat and mass transfer of every single spray
droplet. DDM simplifies spray modelling by introducing parcels which are groups of droplets
with the same size and physical properties. That way, only differential equations of parcels are
numerically solved which significantly reduces computation time and required computing
power.
Droplet parcels are introduced in the flow domain with initial conditions of position, size,
velocity, temperature and number of particles inside the parcel. Lagrangian description of motion
is then used for tracking the parcels through the computational grid.
From the Newton’s second law of motion, which states that the net force on an object is equal to
the rate of change of its linear momentum in an inertial reference frame, follows droplet
momentum equation:
id
d idr ig ip ib
dum F F F F
dt (5)
where md and uid are droplet mass and droplet velocity respectively, Fidr is the drag force, Fig is a
force including the effects of gravity and buoyancy, Fip is the pressure force and Fib summarizes
other external forces. Comparing the magnitude of all forces (Ström et al., 2009), the drag force
and gravity effects are only relevant for UWS spray injection application. Therefore follows:
igidrid
d FFdt
dum (6)
After integrating above equation, uid could be obtained, and from this we can solve differential
equation for the trajectory:
idid u
dt
dx (7)
In commercial CFD code AVL FIRE® turbulent dispersion, evaporation of droplets, the droplet-

gas momentum exchange, secondary break-up, droplet collision and droplet-wall interaction are
covered with set of models that are summarized in (AVL, 2013).
Droplet evaporation can be described by different methods in the rising level of complexity, such
as: constant droplet temperature model, infinite diffusion model, effective diffusion model,
vortex model and Navier-Stokes solution. For the purpose of this research Abramzon/Sirignano
evaporation model was used to perform calculations (Abramzon and Sirignano, 1989). This
model represents the extension of classical droplet vaporization model (Dukowicz, 1979) and
includes important effects such as variable physical properties, non-unitary Lewis number in the
gas phase and influence of Stefan flow on the heat and mass transfer. It requires a relatively
small amount of computational time per droplet and therefore is convenient for spray
calculations. Despite numerous experimental studies (Musa, S. N. A., Saito, M., Furuhata, T.,
Arai, 2006; S. Kontin, A. Höfler, R. Koch, 2010; Wang et al., 2009) theoretical understanding of
evaporation and decomposition of UWS droplets is still far from satisfactory. Theoretical study
conducted by Birkhold et al. (Birkhold et al., 2007) is implemented in AVL FIRE® and
represents optimum between results accuracy and computational demands. At elevated
temperatures the evaporation of liquid starts. Since water has a boiling point below starting
temperature of urea thermolysis, the gaseous species first consist mainly of water. Whether is
urea vapour also produced is questionable, since urea is known to decompose directly via
thermolysis from solid or liquid. Birkhold’s approach assumes two stage process – pure water
evaporation until the droplet is composed of urea only and subsequent thermolysis. It is assumed
that droplets remain spherical throughout the evaporation and decomposition processes, as well
as that no crystallization of urea occurs.
In order to evaluate the influence of solved urea on the evaporation of water, Rapid Mixing
model is employed. Within this model infinite high transport coefficients are assumed for the
liquid phase, resulting in spatial uniform temperature, concentration and fluid properties in the

droplet, but those quantities will change in time (Abramzon and Sirignano, 1989). It has been
confirmed as satisfactory for UWS spray applications by several authors(Abu-Ramadan et al.,
2011; Birkhold et al., 2007). The variation of urea concentration of the droplet can be evaluated
by:
vapu
u
d
dY mY
dt m (8)
It should be noted that mass flow from liquid to gaseous phase is defined to be negative.
Urea melts at 406 K and the thermal decomposition of urea into ammonia and isocyanic acid
starts. It is generally accepted that two different ways for the thermal decomposition can be
assumed:
• evaporation of molten/solid urea to gaseous urea, which decomposes in gas phase into
NH3 and HNCO;
• direct thermolysis from molten/solid urea to gaseous NH3 and HNCO.
This model assumes the latter option and since there is no phase change of urea, an alternative
way as used for the evaporation of water must be taken to calculate the urea decomposition rate.
For this purpose Arrhenius-type expression is used:
( / )a dE RTu
d
dmD Ae
dt
(9)
where A is a frequency rate and Ea is activation energy. Experimental data from Yim et al. (Yim
et al., 2004) were used for a default parameter fit.
The most favoured method for modelling turbulent flows in industrial applications is the
Reynolds Averaged Navier Stokes equations (RANS) with an appropriate turbulence model.
Many turbulent models employ the concept of a turbulent viscosity or a turbulent diffusivity to
approximate the turbulent Reynolds stresses and the turbulent heat fluxes. Turbulence was
modelled by the advanced k-ζ-f model which was proved more suitable for strong swirling

flows such as those that can be found in internal combustion engines applications (Hanjalić et al.,
2004).
2.3. Selective catalytic reduction
Once urea-water-solution spray is injected into hot exhaust gas stream before SCR catalyst,
water content evaporates from UWS. Afterwards, ammonia is generated through thermal
decomposition of urea and hydrolysis of isocyanic acid (Birkhold et al., 2007):
2 2 3
(NH ) CO NH +HNCO (10)
Hydrolysis of isocyanic acid:
2 3 2
HNCO+H O NH +CO (11)
Generated ammonia takes part in various deNOx reactions as a reductant (Fang and DaCosta,
2003):
3 2 2 2
4NH 4NO O 4N 6H O (standard SCR) (12)
3 2 2
4NH 6NO 5N 6H O (13)
3 2 2 2
8NH 6NO 7N 12H O (14)
3 2 2 2
4NH 2NO 2NO 4N 6H O (fast SCR) (15)
2 2 2
4HNCO 6NO 5N 2H O 4CO (16)
The reaction model employed in this work is developed for the simulation of HSO (Hydrolysis-
SCR-Oxidation) catalysts. This type of NOx reduction system consists of three different coating
sections where following processes are taking place: the hydrolysis of isocyanic acid, the
selective catalytic reduction of NOx with ammonia and the oxidation of ammonia. The model
explicitly takes into account the ad/desorption of ammonia at the solid surface and therefore is
able to resolve transient operating conditions (AVL, 2013). This model is based on the work
carried by (Winkler et al., 2003; Wurzenberger and Wanker, 2005). The following reactions are
taken into account:
232 CONHOHHNCO (17)

(S)NHSNH 33 (18)
SNH(S)NH 33 (19)
O6H4NO4NO4NH 2223 (20)
O6H4N2NO2NO4NH 2223 (21)
OH217NNO68NH 2223 (22)
OH62NO34NH 2223 (23)
22 2NOO2NO (Winkler et al., 2003) (24)
22 NOO5.0NO (Wurzenberger and Wanker, 2005) (25)
It can be seen that catalyst is divided into three functional parts, depending upon which reactions
are taking place, namely hydrolysis part, deNOx part and oxidation part. More details about
reaction constants can be found in (Winkler et al., 2003; Wurzenberger and Wanker, 2005).
3. NUMERICAL SIMULATION SETTINGS
Figure 1. depicts the computational domain used in this research together with the boundary
surfaces. Simulation is performed by injecting UWS inside the given geometry having length
of 1.53 m. After grid dependency investigation domain consisting of 84 672 control volumes
was selected for parametric study.
Figure 1. Discretized geometry of the SCR system
Figure 1. also indicates nozzle position, which is located at the beginning of conically shaped
mixing chamber. Spray cone angle was 60°. Table 1. shows variation of time step size during

simulation progress. It can be seen that during the nozzle opening time from 0.1 to 0.4 s the
time step is refined in order to capture transient phenomena of UWS droplets evaporation and
thermal decomposition.
Table 1. Variation of time step size for simulation
Time step
Δt
up to 0.1 s 0.005 s
up to 0.4 s 0.002 s
up to 0.8 s 0.005 s
End time 0.8 s
At the inlet a mixture of gases represented by Table 2. with the temperature of 400 °C and a
mass flow rate of 850 kg/h enters the domain. The simulated mixture of gases approximates
the real exhaust gas composition of diesel road vehicles. Turbulence on the inlet is described
with turbulent kinetic energy of 0.001 m2/s2 and turbulent length scale of 0.00304 m.
Table 2. Exhaust gas composition on the inlet
Chemical species: Mass fraction:
NO 6.7553e-04
NO2 5.1709e-04
NH3 1.0e-10
H2O 7.7e-02
O2 1.3e-01
CO2 9.0e-02
HCNO 1.0e-10
N2 0.701807
Regarding the catalyst, following settings were used: density of the active site is 1700 kg/m3,
thermal conductivity is 0.4 W/(m∙K) and specific heat capacity is 1200 J/(kg∙K). The initial
temperature of the monolith is 400°C with cell density of 400 1/ in2. Pressure drop was
calculated by employing „Tube friction“ model (AVL, 2013). In order to save calculation

resources, calculation was initialized with catalyst substrate completely loaded with ammonia.
Thus, it was possible to draw conclusion after simulating only one injection cycle.
At the outlet of the domain, the pressure boundary condition with 100 000 Pa was applied,
whilst catalyst wall heat transfer was computed according to environment temperature of 300
K and by employing heat transfer coefficient of 5 W/(m2∙K). Although large eddy simulation
approach to turbulence modelling is already penetrating in the complex industrial applications
(Mikulčić et al., 2014), this work employs advanced k-ζ-f turbulence model from the well-
established Reynolds Averaged Navier-Stokes (RANS) model group. Compared to the
established k-ε model, the k-ζ-f turbulence model dispenses with the conventional practice of
introducing empirical damping functions. It is more suitable for strong swirling flows such as
those that can be found in internal combustion engines. For the turbulence and energy
transport equations a first order UPWIND differencing scheme was applied, whilst for the
continuity and species transport equations the central differencing scheme (CDS) was
employed. The CDS can generate numerical oscillations yielding unbounded and non-
monotonic solutions. Therefore, for the momentum equation a combination of CDS and
UPWIND was proposed by introducing the blending factor of 0.5 (AVL, 2013). For all
calculations the implicit time integration was employed ensuring unconditional solution
stability. The solution convergence criterion is achieved when the momentum, pressure,
energy and volume fraction residuals decrease under the value of 1e-4. The pressure velocity
coupling of the momentum and continuity equation was obtained using the SIMPLE
algorithm. Between 0.1 and 0.4 s the mass of 0.4 g of UWS spray with initial velocity of 27
m/s is injected into domain. The droplet disintegration models were replaced by presuming
the droplet size distribution. It is of utmost importance to correctly describe the spray process
since the evaporation rate and the mixing between the droplet phase and bulk phase directly
influence the thermolysis process and NO reduction. The Rosin–Rammler distribution with

exponent of 2.5 was used to represent the non-uniform droplet size distribution since it was
shown in previous research (Ström et al., 2009; Varna et al., 2015) to accurately captures
droplet size effects of real UWS injection systems. In the following Table, the droplet size
distribution was referred to as PSD and also expected droplet diameters are given. It is
important to note that still there is no reliable model of droplet interaction with porous
catalytic structure, thus during the simulations the option “stop droplet at porosity” was
enabled. The interaction of spray droplets with hot catalyst walls was modelled using well
established model from Kuhnke (Kuhnke, 2004), which identifies 4 characteristic interaction
regimes. The purpose of this work is research of influence of spray injection direction and
droplet size on uniformity of ammonia distribution as well as on ammonia slip out of the
catalyst. Six different cases were established according to settings depicted in the following
Table.
Table 3. Simulation settings –injection direction and droplet size influence
Name Injection direction Droplet size
Case_1 (co-flow ) PSD (160 μm)
Case _2 (co-flow) PSD (105 μm)
Case _3 (co-flow) PSD (90 μm)
Case _4 (perpendicular to the main flow) 100 μm
Case _5 (counterflow) 100 μm
Case _6 (co-flow) 100 μm
Simulated cases were divided into two groups depicted in the Table 4. according to effects
that were thoroughly studied, namely influence of droplet size and injection direction.
Following section presents simulation results.

Table 4. Simulation groups
Group 1
Influence of droplet size
Group 2
Influence of injection direction
Case _1 Case _3 Case _6 Case _4 Case _5 Case _6
4. RESULTS AND DISCUSSION
First, cases belonging to Group 1 are discussed. Two representative time instances were
chosen, namely 0.15 s and 0.4 s. At 0.15 s the spray development through the mixing chamber
can be seen, whilst at 0.4 s peak values of NOx reductants are realized. If we observe
distribution of the NH3 within the SCR system, the fastest propagation is visible in Case_3 at
0.15 s. At 0.4 s a fairly uniform distribution of NH3 in Case_1 and Case_6 can be observed,
while Case_3 has more dispersed NH3 mass fraction, as depicted in Figure 3. The mass
fraction of ammonia is higher in Case_6 and Case_1, which implies they achieve better urea
conversion.
Figure 2. NH3 mass fraction at 0.15 s

Figure 3. NH3 mass fraction at 0.4 s
Figure 4. and Figure 5. depict HNCO mass fraction at the same time instances. From the
Figure 4. it can be concluded that the mass fraction and distribution of HNCO are similar for
all of the three observed cases in the early stage of the spray injection. Contrary to that, Figure
5. shows that the highest HNCO fraction and most homogeneous HNCO distribution is
present in Case_6. Case_1 and Case_3 have less uniform distribution and HNCO mass
fraction is the lowest in Case_3.
Figure 4. HNCO mass fraction at 0.15 s

Figure 5. HNCO mass fraction at 0.4 s
NO reduction in Figure 6. is consistent with observations from Figure 2., since the
propagation of ammonia is fastest in Case_3, which consequently has strongest initial
reduction of NO. Here it should be noted that NO mass fraction drops solely by passing
through the catalyst due to the fact that catalyst is loaded with ammonia at the beginning of
simulation. Figure 7. shows that all three cases have reduced NO mass fractions on negligible
level. This is expected since in all simulated cases the amount of injected urea remains intact.
Similar reasoning is also valid for NO2 which is therefore not depicted.
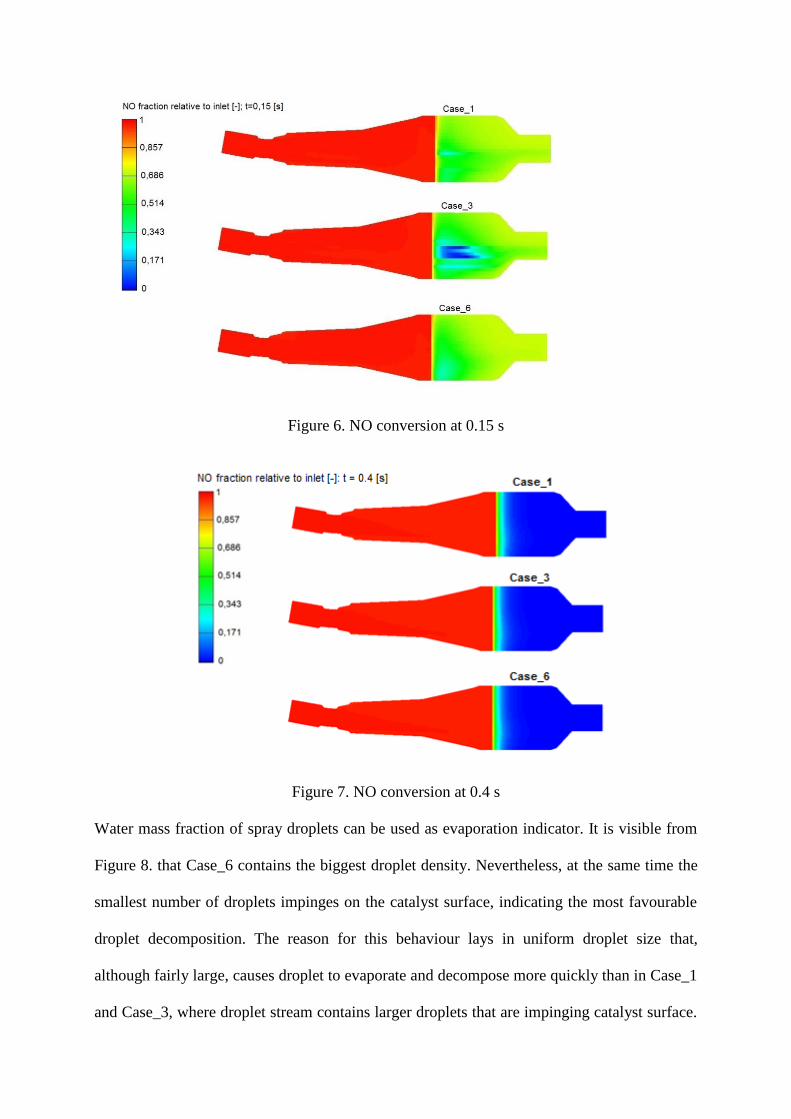
Figure 6. NO conversion at 0.15 s
Figure 7. NO conversion at 0.4 s
Water mass fraction of spray droplets can be used as evaporation indicator. It is visible from
Figure 8. that Case_6 contains the biggest droplet density. Nevertheless, at the same time the
smallest number of droplets impinges on the catalyst surface, indicating the most favourable
droplet decomposition. The reason for this behaviour lays in uniform droplet size that,
although fairly large, causes droplet to evaporate and decompose more quickly than in Case_1
and Case_3, where droplet stream contains larger droplets that are impinging catalyst surface.

It is also visible that droplets in Case_3 have lower evaporation rate. Case_1 has the highest
water mass fraction in the vicinity of nozzle, but the evaporation dynamics is similar to
Case_3.
Figure 8. Water fraction in spray droplets at 0.4 s – Group 1
As has been previously stated in Table 4, Group 2 studies the influence of injection direction
on the homogenization of ammonia. Figure 9. reveals that spray direction perpendicular to the
main flow has the most detrimental effect on the evaporation rate, resulting in a large number
of droplets sticking on the catalyst walls. Qualitative observation of Case_5 and Case_6
doesn’t reveal significant differences in evaporation dynamics. In order to better study
behaviour of two simulation groups, the following section presents analyses of the uniformity
of reductant in cross sections bounding the catalyst.

Figure 9. Water fraction in spray droplets at 0.4 s – Group 2
The following analysis has been carried out for the simulation time of 0.4 s since than the
maximum of NH3 concentration is achieved within the system. Thus, it is representative for
the evaluation of uniformity of distribution on the catalyst inlet and outlet as one of the key
parameters of the SCR process quality.
Figure 10. NH3 and NO mass fraction – Case_1 at 0.4 s

Figure 10. shows fairly uniform distribution of NH3 on the catalyst inlet with lower right part
of cross section deviating from the mean value. After the catalyst exit ammonia mass
fractions fall down one order of magnitude indicating favourable ammonia consumption in
deNOx reactions. NO is almost completely reduced at the catalyst exit as only a few ppm of
NO slips into environment.
Figure 11. NH3 and NO mass fraction – Case_2 at 0.4 s
Figure 11. depicts similar ammonia distribution compared to the Case_1 on the catalyst inlet,
with higher span of mass fractions. However, more ammonia is consumed during the
reactions, so that ammonia slip is lower in this case. There is small area of very low ammonia
fraction which is also reflected in the NO distribution on the catalyst exit, where locally
higher amount of NO slips to environment. Comparable trend can be observed also on the
following Figure 12., which is expected due to similar mean droplet size in Rosin Rammler
distribution. This case has the best ammonia uniformity of all the simulated cases, and at this
stage is expected that it will have low ammonia slip. Non uniform ammonia distribution may
cause uneven catalyst load and consequently deactivation of the catalyst surface due to
occurrence of deposits.

Figure 12. NH3 and NO mass fraction – Case_3 at 0.4 s
Figure 13. NH3 and NO mass fraction – Case_4 at 0.4 s
Figure 13. shows strong ammonia non-uniformity on the catalyst inlet as a consequence of
perpendicular injection direction. This causes stronger activation of the one half of the
catalyst, leading to uneven catalyst aging and with it connected difficulties. Also, it should be
noted that this is the only case where NO slip is one order of magnitude higher, exactly on the
side where ammonia mass fractions are lower. Case_5 and Case_6 demonstrate somewhat

worse uniformity compared to Case_1, Case_2 and Case_3, but the range of the ammonia slip
mass fraction is narrower compared to the same cases. This means that more ammonia is
consumed and consequently there will be less ammonia slip, at least on the basis of qualitative
observation. In order to quantify all cases following section analyses average species mass
fractions along SCR system and finally ammonia slip to environment.
Figure 14. NH3 and NO mass fraction – Case_5 at 0.4 s
Figure 15. NH3 and NO mass fraction – Case_6 at 0.4 s

At the beginning of the injection the highest ammonia mass fraction is achieved in the Case_2
which is depicted in the Figure 16. Also, there can be seen slight decrease of mass fraction in
Case_2 and Case_3 at 0.7 m due to catalyst geometry, since it facilitates expansion of the
geometry on that location, so that generated ammonia can be spread in larger volume. Case_1
doesn’t follow observed trend due to larger droplets which evaporate and start to decompose
in the expansion of mixing chamber. Here should be also noted that Case_4, Case_5 and
Case_6 don’t reach the same magnitude of mass fractions, so their value is not depicted.
Figure 17. reveals following time step where Case_3 has the highest ammonia mass fraction
due to the smallest UWS droplets of all simulated cases. The rest of simulated cases show
similar ammonia mass fraction along SCR system with previously explained Case_4 as an
exception.
Figure 16. NH3 mass fraction along SCR system at 0.11 s

Figure 17. NH3 mass fraction along SCR system at 0.15 s
The time instance 0.4 s after the beginning of simulation was chosen due to the fact that then
the highest reductant fraction is achieved before the catalyst inlet. It can be seen in Figure 18.
that the highest ammonia mass fraction was achieved for the Case_1 followed by Case_2,
Case_6, Case_5 and finally, Case_3 and Case_4 with the lowest mass fraction. Counterflow
injection is by no means worse than co-flow injection. Sudden peak of ammonia for all cases
depicted in the Figure 18. is the consequence of hydrolysis of isocyanic acid in the catalyst
during which the additional ammonia is generated.
Figure 18. NH3 mass fraction along SCR system at 0.4 s

Figure 19. shows isocyanic acid results after 0.4 s where similar trends as in ammonia case
can be observed. The sudden drop in mass fraction is attributed to the beginning of the
catalyst where hydrolysis of HNCO is taking place. Finally, this section can be concluded by
the fact that larger droplets achieve higher ammonia and isocyanic acid mass fractions at the
catalyst inlet, but one should bear in mind that larger droplets also result in more intense
impingement on catalyst wall, which can, depending on local flow conditions, lead to
difficulties associated with deposit formation.
Figure 19. HNCO mass fraction along SCR system at 0.4 s
Figure 20. shows ammonia slip from the catalyst as important design parameter due to its
toxicity and harmful environmental impact. All of the simulated cases have similar ammonia
slip, except Case_5 which has a reduction of around 40 % compared to other cases.
Regardless the fact that Case_3 has the most uniform ammonia distribution, counterflow
direction provided longer residence time of ammonia, enabling thus greater consumption of
ammonia and therefore lowest ammonia slip. Exhaust gas stream should first decelerate
droplets and change their direction, then accelerate them again, which finally has beneficial
impact on the generation of ammonia and reaction progress before the catalyst.

Figure 20. Comparison of ammonia slip for simulated cases
5. CONCLUSION
This paper presented CFD modelling capabilities of physical phenomena taking place in the SCR
process, from the urea injection, to the catalyst monolith exit. After the literature review, relevant
mathematical models composing numerical framework for UWS-SCR were described.
Afterwards, a 3D turbulent reacting flow CFD model involving reaction mechanism on the
catalyst surface was applied on the real SCR system geometry with exhaust gas composition,
flow rate and temperature resembling those of diesel engines. Six simulated cases were divided
into two simulation groups in order to study the influence of injection direction and droplet size
on ammonia generation and uniformity. It has been shown that the best result in terms of
ammonia uniformity gives Case_3. Case_4, where UWS was injected perpendicularly to the
main flow, was the worst one in terms of ammonia uniformity and NOx reduction, since this was
the only case where one order of magnitude higher mass fraction of NOx slipped in the
environment. Although injection direction didn’t provide better ammonia uniformity, it has
strong impact on minimization of ammonia slip to environment due to longer residence time of

droplets and ammonia in the system in the case of counterflow injection. This finding indicates
that ammonia uniformity before the catalyst is not the only indicator of SCR process quality, but
also residence time of the reagent should be taken into account. Counterflow injection of UWS
achieved minimum ammonia slip, 40 % lower than in other cases. This becomes more important
in the light of the fact that ammonia slip is also regulated by EURO 6 standard for heavy duty
diesel vehicles. Despite the fact that counterflow injection is still in the research phase, it should
be taken into account in the further research, especially regarding deposit formation and injector
device clogging. From numerical point of view, there is still lack of suitable droplet/porosity
interaction model which should be subjected tu future work.
ACKNOWLEDGMENTS
Financial support for conducting this research, as well as software support from the AVL List
GmbH is gratefully acknowledged.
REFERENCES
Abramzon, B., Sirignano, W.A., 1989. Droplet vaporization model for spray combustion
calculations. Int. J. Heat Mass Transf. 32, 1605–1618. doi:10.1016/0017-
9310(89)90043-4
Abu-Ramadan, E., Saha, K., Li, X., 2011. Modeling the depleting mechanism of urea-water-
solution droplet for automotive selective catalytic reduction systems. AIChE J. 57, 3210–
3225. doi:10.1002/aic.12523
AVL, 2013. FIRE ® VERSION 2013.2 manual.
Baleta, J., 2013. Numerical investigation of wallfilm formation for selective catalytic
reduction applications. University of Zagreb.
Baleta, J., Mikulčić, H., Vujanović, M., Petranović, Z., Duić, N., 2016. Numerical simulation

of urea based selective non-catalytic reduction deNOx process for industrial applications.
Energy Convers. Manag. doi:10.1016/j.enconman.2016.01.062
Betageri, V., Rajagopalan, M., Dhakshina Murthy, S., Thondavadi, A., 2016. Effects of
Diesel Exhaust Fluid (DEF) Injection Configurations on Deposit Formation in the SCR
System of a Diesel Engine. doi:10.4271/2016-28-0109
Birkhold, F., Meingast, U., Wassermann, P., Deutschmann, O., 2007. Modeling and
simulation of the injection of urea-water-solution for automotive SCR DeNOx-systems.
Appl. Catal. B Environ. 70, 119–127. doi:10.1016/j.apcatb.2005.12.035
Cause of climate change [WWW Document], n.d. URL
http://ec.europa.eu/clima/change/causes/index_en.htm (accessed 7.28.15).
Chen, Y., Lv, L., 2015. Design and evaluation of an Integrated SCR and exhaust Muffler from
marine diesels. J. Mar. Sci. Technol. 20, 505–519. doi:10.1007/s00773-014-0302-1
Cho, Y.S., Lee, S.W., Choi, W.C., Yoon, Y.B., 2014. Urea-SCR system optimization with
various combinations of mixer types and decomposition pipe lengths. Int. J. Automot.
Technol. 15, 723–731. doi:10.1007/s12239-014-0075-x
Choi, C., Sung, Y., Choi, G.M., Kim, D.J., 2015. Numerical analysis of NOx reduction for
compact design in marine urea-SCR system. Int. J. Nav. Archit. Ocean Eng. 7, 1020–
1034. doi:10.1515/ijnaoe-2015-0071
Dukowicz, J.K., 1979. Quasi-steady droplet phase change in the presence of convection.
EEA, 2014. Emissions of the main air pollutants in Europe [WWW Document]. URL
http://www.eea.europa.eu/data-and-maps/indicators/main-anthropogenic-air-pollutant-
emissions/assessment-3 (accessed 12.30.16).

European Environment Agency, n.d. Nitrogen oxides (NOx) emissions [WWW Document].
URL http://www.eea.europa.eu/data-and-maps/indicators/eea-32-nitrogen-oxides-nox-
emissions-1/assessment.2010-08-19.0140149032-3 (accessed 7.15.15).
European Union, Regulation (EC) No 715/2007, 2007.
Fang, H.L., DaCosta, H.F.M., 2003. Urea thermolysis and NOx reduction with and without
SCR catalysts. Appl. Catal. B Environ. 46, 17–34. doi:10.1016/S0926-3373(03)00177-2
Grout, S., Blaisot, J.-B., Pajot, K., Osbat, G., 2013. Experimental investigation on the
injection of an urea–water solution in hot air stream for the SCR application:
Evaporation and spray/wall interaction. Fuel 106, 166–177.
doi:10.1016/j.fuel.2012.09.022
Hanjalić, K., Popovac, M., Hadžiabdić, M., 2004. A robust near-wall elliptic-relaxation eddy-
viscosity turbulence model for CFD. Int. J. Heat Fluid Flow 25, 1047–1051.
doi:10.1016/j.ijheatfluidflow.2004.07.005
Honus, S., Kumagai, S., Němček, O., Yoshioka, T., 2016. Replacing conventional fuels in
USA, Europe, and UK with plastic pyrolysis gases – Part I: Experiments and graphical
interchangeability methods. Energy Convers. Manag. 126, 1118–1127.
doi:10.1016/j.enconman.2016.08.055
Jeong, S.-J., Lee, S.-J., Kim, W.-S., 2008. Numerical Study on the Optimum Injection of
Urea–Water Solution for SCR DeNOx System of a Heavy-Duty Diesel Engine to
Improve DeNOx Performance and Reduce NH 3 Slip. Environ. Eng. Sci. 25, 1017–1036.
doi:10.1089/ees.2007.0224
Kozarac, D., Vuilleumier, D., Saxena, S., Dibble, R.W., 2014. Analysis of benefits of using

internal exhaust gas recirculation in biogas-fueled HCCI engines. Energy Convers.
Manag. 87, 1186–1194. doi:10.1016/j.enconman.2014.04.085
Kuhnke, D., 2004. Spray Wall Interaction Modelling by Dimensionless Data Analysis. PhD
thesis. TU Darmstadt.
Lee, J.-G., Kim, Y.-D., Kim, W.-S., 2012. Design and Implementation of Mixing Chambers
to Improve Thermal Decomposition of Urea for NO X Abatement. Environ. Eng. Sci. 29,
979–986. doi:10.1089/ees.2011.0414
Liao, Y., Dimopoulos Eggenschwiler, P., Spiteri, A., Nocivelli, L., Montenegro, G.,
Boulouchos, K., 2015. Fluid Dynamic Comparison of AdBlue Injectors for SCR
Applications. SAE Int. J. Engines 8, 2015-24–2502. doi:10.4271/2015-24-2502
Mikulčić, H., von Berg, E., Vujanović, M., Wang, X., Tan, H., Duić, N., 2016. Numerical
evaluation of different pulverized coal and solid recovered fuel co-firing modes inside a
large-scale cement calciner. Appl. Energy. doi:10.1016/j.apenergy.2016.05.012
Mikulčić, H., Vujanović, M., Ashhab, M.S., Duić, N., 2014. Large eddy simulation of a two-
phase reacting swirl flow inside a cement cyclone. Energy 75, 89–96.
doi:10.1016/j.energy.2014.04.064
Mujeebu, M.A., Abdullah, M.Z., Bakar, M.Z.A., Mohamad, A.A., Muhad, R.M.N., Abdullah,
M.K., 2009. Combustion in porous media and its applications – A comprehensive
survey. J. Environ. Manage. 90, 2287–2312. doi:10.1016/j.jenvman.2008.10.009
Musa, S. N. A., Saito, M., Furuhata, T., Arai, M., 2006. Evaporation Characteristics of a
Single Aqueous Urea Solution Droplet, in: ICLASS 2006.
Oh, J., Lee, K., 2014. Spray characteristics of a urea solution injector and optimal mixer

location to improve droplet uniformity and NOx conversion efficiency for selective
catalytic reduction. Fuel 119, 90–97. doi:10.1016/j.fuel.2013.11.032
Petranović, Z., Edelbauer, W., Vujanović, M., Duić, N., 2017. Modelling of spray and
combustion processes by using the Eulerian multiphase approach and detailed chemical
kinetics. Fuel 191, 25–35. doi:10.1016/j.fuel.2016.11.051
S. Kontin, A. Höfler, R. Koch, H.-J.B., 2010. Heat and Mass Transfer accompanied by
Crystallisation of single Particles containing Urea-water-solution, in: Proceedings of
23rd ILASS-2010. ILASS, Brno.
Sadashiva Prabhu, S., Nayak, N.S., Kapilan, N., Hindasageri, V., 2017. An experimental and
numerical study on effects of exhaust gas temperature and flow rate on deposit formation
in Urea-Selective Catalytic Reduction (SCR) system of modern automobiles. Appl.
Therm. Eng. 111, 1211–1231. doi:10.1016/j.applthermaleng.2016.09.134
Smith, H., Lauer, T., Mayer, M., Pierson, S., 2014. Optical and Numerical Investigations on
the Mechanisms of Deposit Formation in SCR Systems. SAE Int. J. Fuels Lubr. 7, 2014-
01–1563. doi:10.4271/2014-01-1563
Ström, H., Lundström, A., Andersson, B., 2009. Choice of urea-spray models in CFD
simulations of urea-SCR systems. Chem. Eng. J. 150, 69–82.
doi:10.1016/j.cej.2008.12.003
Tayyeb Javed, M., Irfan, N., Gibbs, B.M., 2007. Control of combustion-generated nitrogen
oxides by selective non-catalytic reduction. J. Environ. Manage. 83, 251–289.
doi:10.1016/j.jenvman.2006.03.006
Tian, X., Xiao, Y., Zhou, P., Zhang, W., 2015. Optimization of the location of injector in

urea-selective catalytic reduction system. J. Mar. Sci. Technol. 20, 238–248.
doi:10.1007/s00773-014-0267-0
Varna, A., Spiteri, A.C., Wright, Y.M., Dimopoulos Eggenschwiler, P., Boulouchos, K.,
2015. Experimental and numerical assessment of impingement and mixing of urea–water
sprays for nitric oxide reduction in diesel exhaust. Appl. Energy 157, 824–837.
doi:10.1016/j.apenergy.2015.03.015
Wang, T.J., Baek, S.W., Lee, S.Y., Kang, D.H., Yeo, G.K., 2009. Experimental investigation
on evaporation of urea-water-solution droplet for SCR applications. AIChE J. 55, 3267–
3276. doi:10.1002/aic.11939
Winkler, C., Flörchinger, P., Patil, M.D., Gieshoff, J., Spurk, P., Pfeifer, M., 2003. Modeling
of SCR DeNOx Catalyst - Looking at the Impact of Substrate Attributes.
doi:10.4271/2003-01-0845
Wurzenberger, J.C., Wanker, R., 2005. Multi-Scale SCR Modeling, 1D Kinetic Analysis and
3D System Simulation. doi:10.4271/2005-01-0948
Yim, S.D., Kim, S.J., Baik, J.H., Nam, I.S., Mok, Y.S., Lee, J.H., Cho, B.K., Oh, S.H., 2004.
Decomposition of urea into NH3 for the SCR process. Ind. Eng. Chem. Res. 43, 4856–
4863. doi:10.1021/ie034052j
Yuen, M.C., Chen, L.W., 1976. On Drag of Evaporating Liquid Droplets. Combust. Sci.
Technol. 14, 147–154. doi:10.1080/00102207608547524
Zhang, H., Wang, J., 2016. Adaptive Sliding-Mode Observer Design for a Selective Catalytic
Reduction System of Ground-Vehicle Diesel Engines. IEEE/ASME Trans. Mechatronics
21, 2027–2038. doi:10.1109/TMECH.2016.2542362

Zhang, H., Wang, J., Wang, Y.-Y., 2016. Optimal Dosing and Sizing Optimization for a
Ground-Vehicle Diesel-Engine Two-Cell Selective Catalytic Reduction System. IEEE
Trans. Veh. Technol. 65, 4740–4751. doi:10.1109/TVT.2015.2476760
Figure captions:
Figure 1. Discretized geometry of the SCR system
Figure 2. NH3 mass fraction at 0.15 s
Figure 3. NH3 mass fraction at 0.4 s
Figure 4. HNCO mass fraction at 0.15 s
Figure 5. HNCO mass fraction at 0.4 s
Figure 6. NO conversion at 0.15 s
Figure 7. NO conversion at 0.4 s
Figure 8. Water fraction in spray droplets at 0.4 s – Group 1
Figure 9. Water fraction in spray droplets at 0.4 s – Group 2
Figure 10. NH3 and NO mass fraction – Case_1 at 0.4 s
Figure 11. NH3 and NO mass fraction – Case_2 at 0.4 s
Figure 12. NH3 and NO mass fraction – Case_3 at 0.4 s
Figure 13. NH3 and NO mass fraction – Case_4 at 0.4 s
Figure 14. NH3 and NO mass fraction – Case_5 at 0.4 s
Figure 15. NH3 and NO mass fraction – Case_6 at 0.4 s
Figure 16. NH3 mass fraction along SCR system at 0.11 s
Figure 17. NH3 mass fraction along SCR system at 0.15 s
Figure 18. NH3 mass fraction along SCR system at 0.4 s
Figure 19. HNCO mass fraction along SCR system at 0.4 s
Figure 20. Comparison of ammonia slip for simulated cases

Table captions:
Table 1. Variation of time step size for simulation
Table 2. Exhaust gas composition on the inlet
Table 3. Simulation settings –injection direction and droplet size influence
Table 4. Simulation groups


![Homogenization of Metric Hamilton- Jacobi equations · lation is that it leads to a more tractable homogenization problem: the homogenization of Finsler metrics [2]. 1.1. Particle](https://img.pdfslide.us/doc/110x75/5edcc50fad6a402d666794e4/homogenization-of-metric-hamilton-jacobi-equations-lation-is-that-it-leads-to-a.jpg)