Embed Size (px)
Citation preview
Numerical Aerospace ATD Validation and Testing Procedures
G. Olivares, J. GuarddonThe Fifth Triennial International Aircraft Fire and Cabin Safety Research Conference, Atlantic City
October 30th 2007
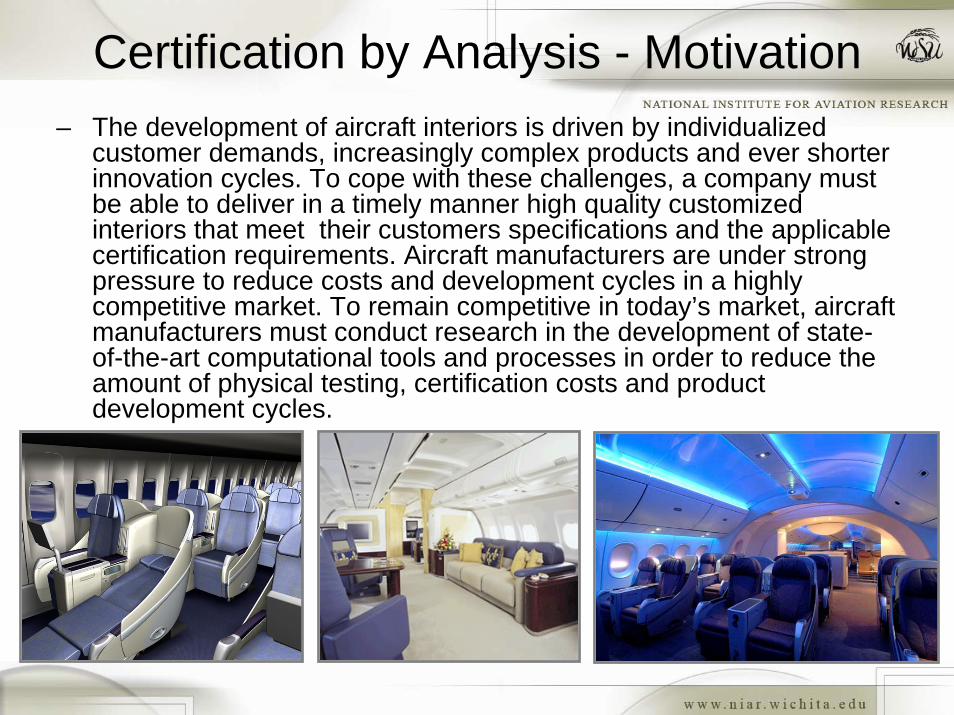
Certification by Analysis - Motivation– The development of aircraft interiors is driven by individualized
customer demands, increasingly complex products and ever shorterinnovation cycles. To cope with these challenges, a company mustbe able to deliver in a timely manner high quality customized interiors that meet their customers specifications and the applicable certification requirements. Aircraft manufacturers are under strong pressure to reduce costs and development cycles in a highly competitive market. To remain competitive in today’s market, aircraft manufacturers must conduct research in the development of state-of-the-art computational tools and processes in order to reduce the amount of physical testing, certification costs and product development cycles.
AC 20-146 - Scope
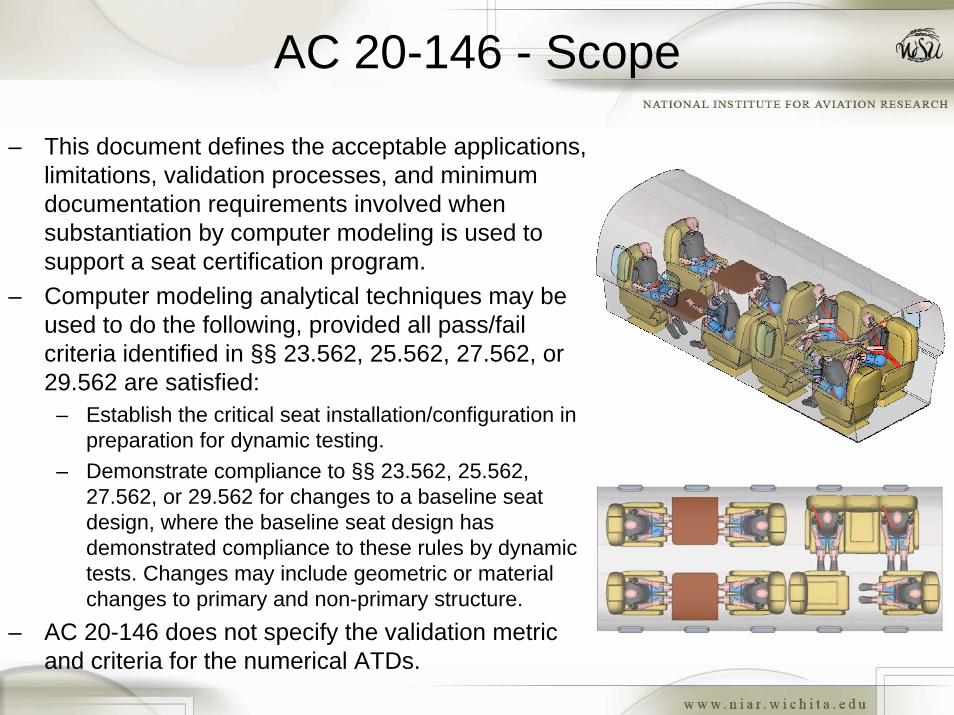
– This document defines the acceptable applications, limitations, validation processes, and minimum documentation requirements involved when substantiation by computer modeling is used to support a seat certification program.
– Computer modeling analytical techniques may be used to do the following, provided all pass/fail criteria identified in §§ 23.562, 25.562, 27.562, or 29.562 are satisfied:
– Establish the critical seat installation/configuration in preparation for dynamic testing.
– Demonstrate compliance to §§ 23.562, 25.562, 27.562, or 29.562 for changes to a baseline seat design, where the baseline seat design has demonstrated compliance to these rules by dynamic tests. Changes may include geometric or material changes to primary and non-primary structure.
– AC 20-146 does not specify the validation metric and criteria for the numerical ATDs.
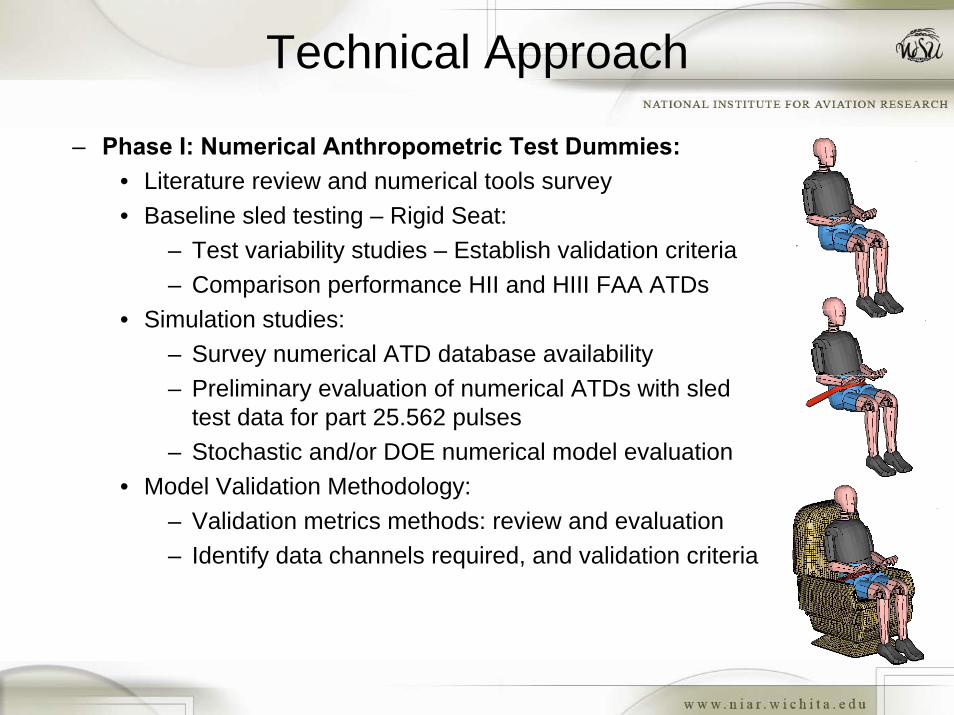
Technical Approach
– Phase I: Numerical Anthropometric Test Dummies:• Literature review and numerical tools survey• Baseline sled testing – Rigid Seat:
– Test variability studies – Establish validation criteria– Comparison performance HII and HIII FAA ATDs
• Simulation studies:– Survey numerical ATD database availability– Preliminary evaluation of numerical ATDs with sled
test data for part 25.562 pulses– Stochastic and/or DOE numerical model evaluation
• Model Validation Methodology:– Validation metrics methods: review and evaluation– Identify data channels required, and validation criteria
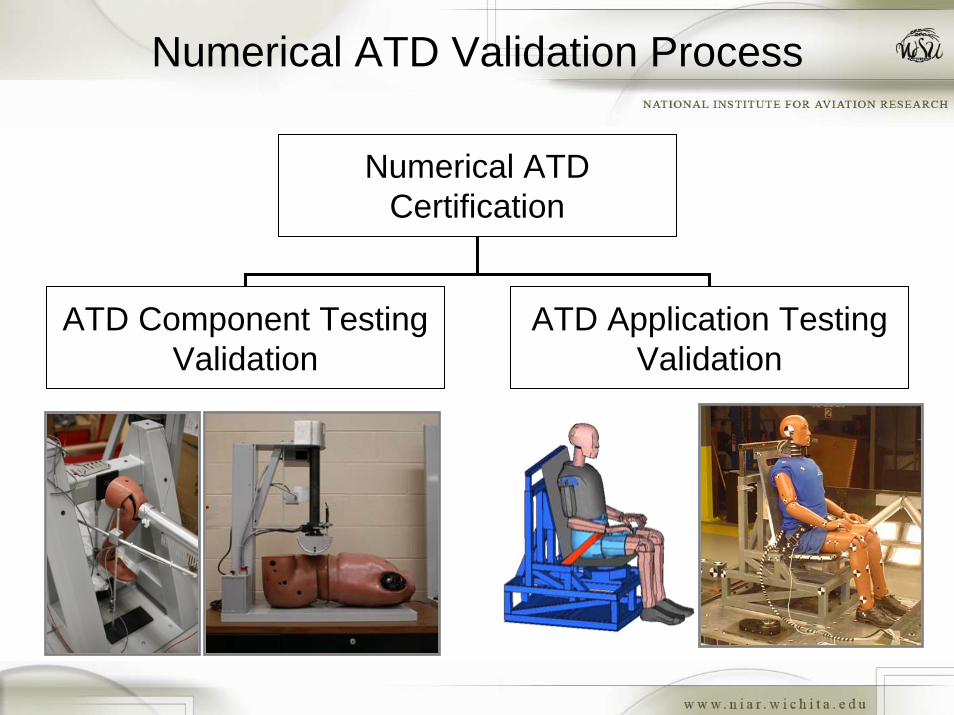
Numerical ATD Validation Process
Numerical ATD Certification
ATD Component Testing Validation
ATD Application Testing Validation
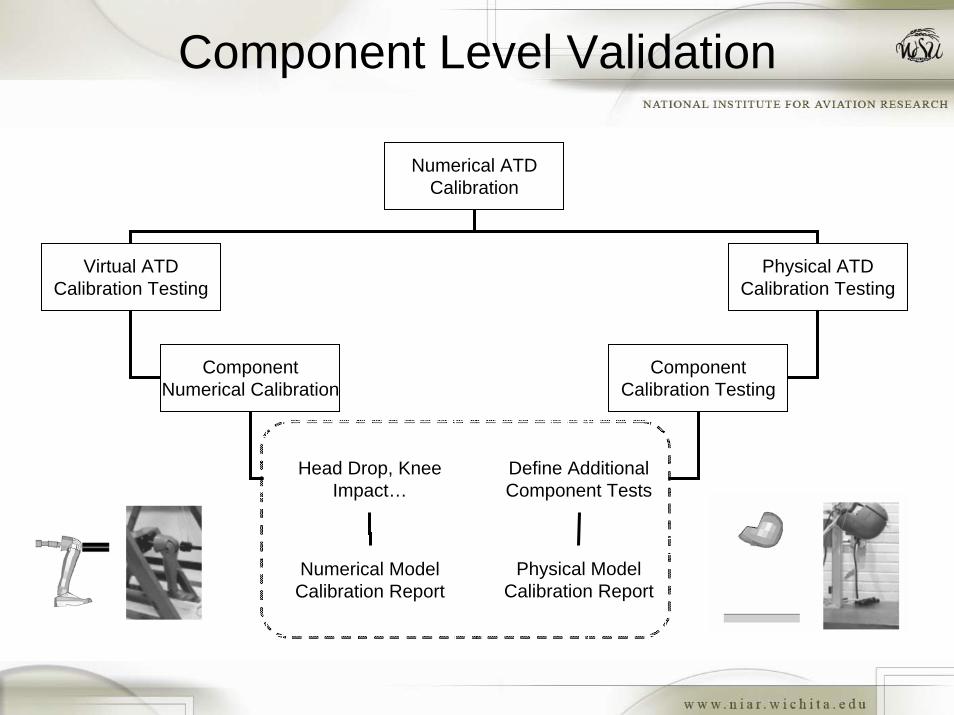
Component Level Validation
Numerical ATD Calibration
Virtual ATD Calibration Testing
Physical ATD Calibration Testing
Component Numerical Calibration
Component Calibration Testing
Head Drop, Knee Impact…
Define Additional Component Tests
Numerical Model Calibration Report
Physical Model Calibration Report
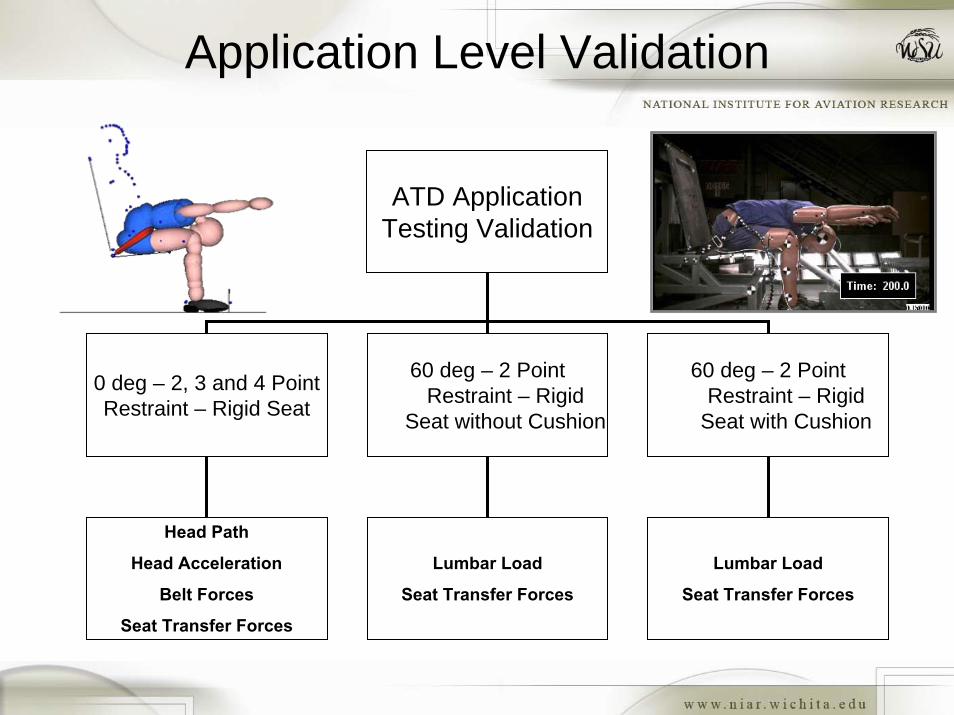
Application Level Validation
ATD Application Testing Validation
0 deg – 2, 3 and 4 Point Restraint – Rigid Seat
60 deg – 2 Point Restraint – Rigid
Seat without Cushion
60 deg – 2 Point Restraint – Rigid
Seat with Cushion
Head Path
Head Acceleration
Belt Forces
Seat Transfer Forces
Lumbar Load
Seat Transfer Forces
Lumbar Load
Seat Transfer Forces
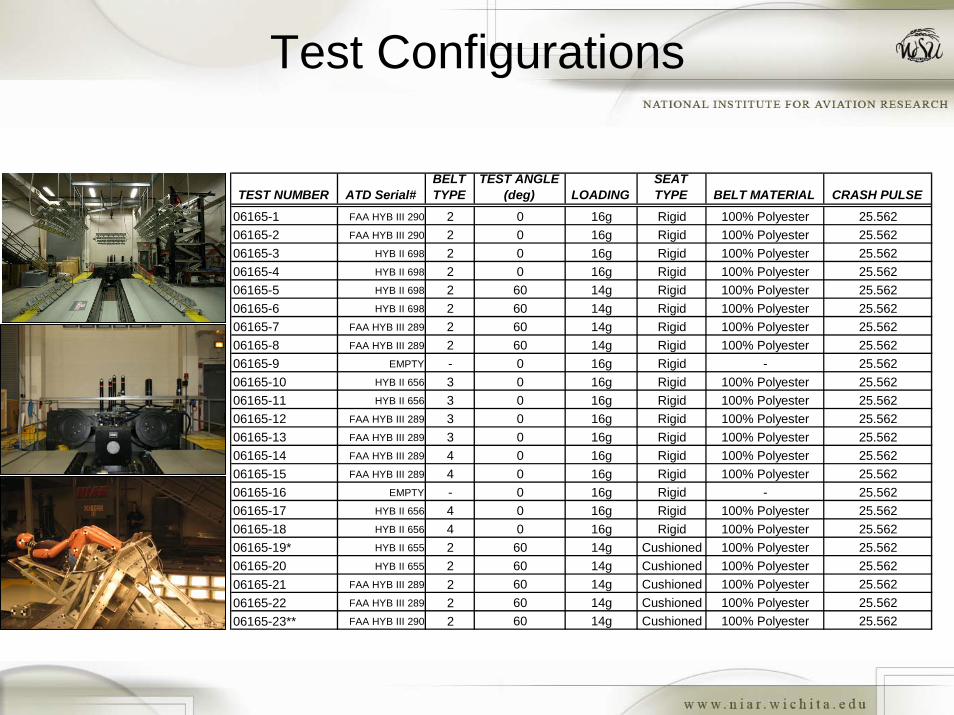
Test Configurations
TEST NUMBER ATD Serial#BELT TYPE
TEST ANGLE (deg) LOADING
SEAT TYPE BELT MATERIAL CRASH PULSE
06165-1 FAA HYB III 290 2 0 16g Rigid 100% Polyester 25.56206165-2 FAA HYB III 290 2 0 16g Rigid 100% Polyester 25.56206165-3 HYB II 698 2 0 16g Rigid 100% Polyester 25.56206165-4 HYB II 698 2 0 16g Rigid 100% Polyester 25.56206165-5 HYB II 698 2 60 14g Rigid 100% Polyester 25.56206165-6 HYB II 698 2 60 14g Rigid 100% Polyester 25.56206165-7 FAA HYB III 289 2 60 14g Rigid 100% Polyester 25.56206165-8 FAA HYB III 289 2 60 14g Rigid 100% Polyester 25.56206165-9 EMPTY - 0 16g Rigid - 25.56206165-10 HYB II 656 3 0 16g Rigid 100% Polyester 25.56206165-11 HYB II 656 3 0 16g Rigid 100% Polyester 25.56206165-12 FAA HYB III 289 3 0 16g Rigid 100% Polyester 25.56206165-13 FAA HYB III 289 3 0 16g Rigid 100% Polyester 25.56206165-14 FAA HYB III 289 4 0 16g Rigid 100% Polyester 25.56206165-15 FAA HYB III 289 4 0 16g Rigid 100% Polyester 25.56206165-16 EMPTY - 0 16g Rigid - 25.56206165-17 HYB II 656 4 0 16g Rigid 100% Polyester 25.56206165-18 HYB II 656 4 0 16g Rigid 100% Polyester 25.56206165-19* HYB II 655 2 60 14g Cushioned 100% Polyester 25.56206165-20 HYB II 655 2 60 14g Cushioned 100% Polyester 25.56206165-21 FAA HYB III 289 2 60 14g Cushioned 100% Polyester 25.56206165-22 FAA HYB III 289 2 60 14g Cushioned 100% Polyester 25.56206165-23** FAA HYB III 290 2 60 14g Cushioned 100% Polyester 25.562
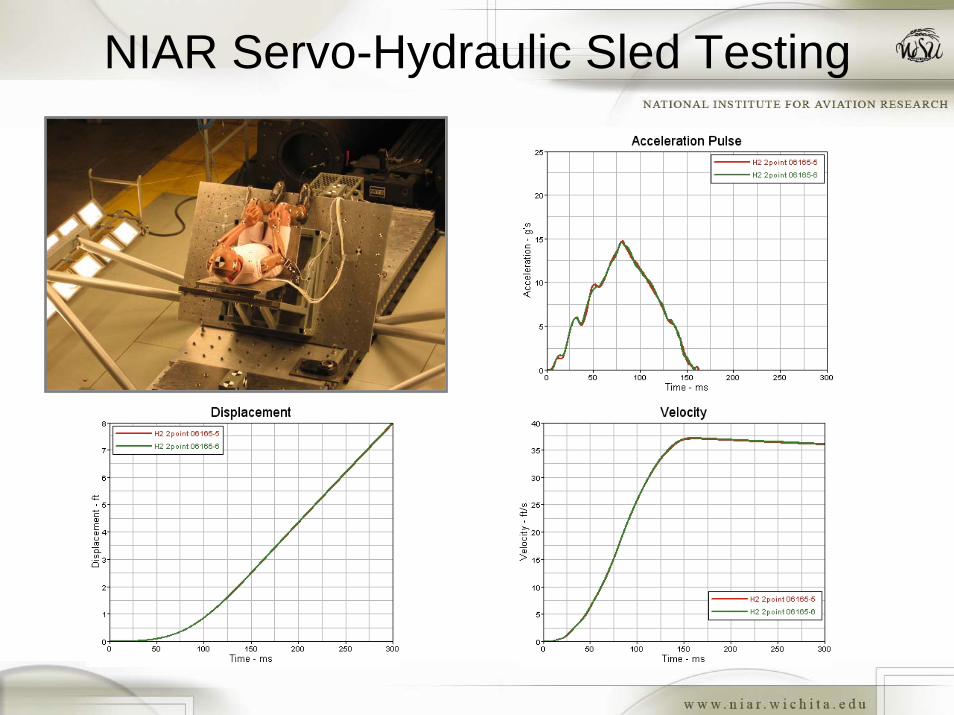
NIAR Servo-Hydraulic Sled Testing
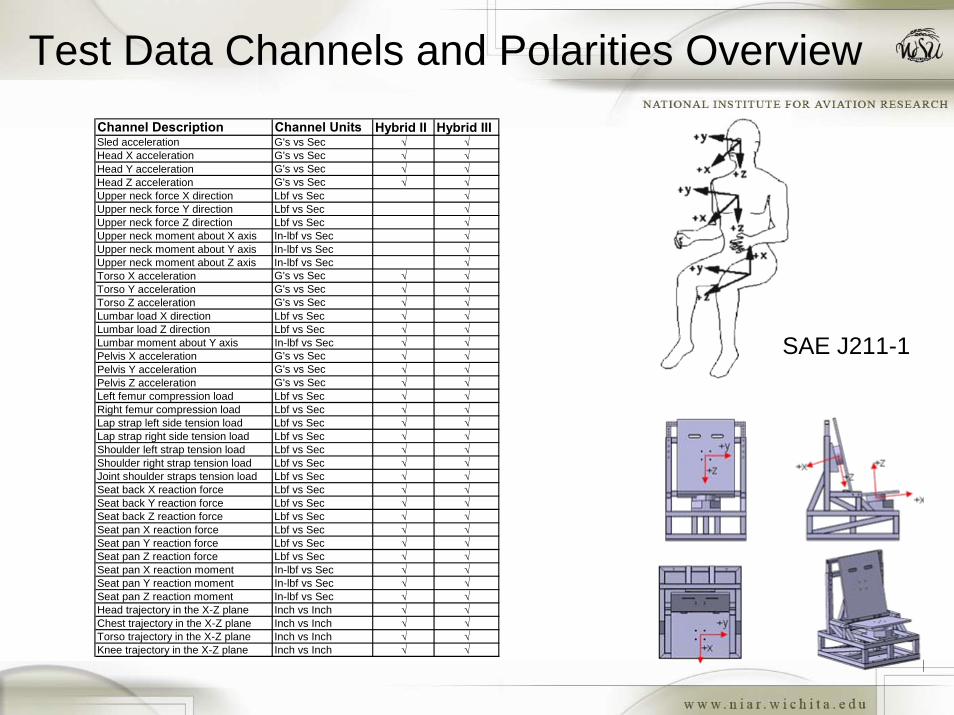
Test Data Channels and Polarities OverviewChannel Description Channel Units Hybrid II Hybrid IIISled acceleration G's vs Sec √ √Head X acceleration G's vs Sec √ √Head Y acceleration G's vs Sec √ √Head Z acceleration G's vs Sec √ √Upper neck force X direction Lbf vs Sec √Upper neck force Y direction Lbf vs Sec √Upper neck force Z direction Lbf vs Sec √Upper neck moment about X axis In-lbf vs Sec √Upper neck moment about Y axis In-lbf vs Sec √Upper neck moment about Z axis In-lbf vs Sec √Torso X acceleration G's vs Sec √ √Torso Y acceleration G's vs Sec √ √Torso Z acceleration G's vs Sec √ √Lumbar load X direction Lbf vs Sec √ √Lumbar load Z direction Lbf vs Sec √ √Lumbar moment about Y axis In-lbf vs Sec √ √Pelvis X acceleration G's vs Sec √ √Pelvis Y acceleration G's vs Sec √ √Pelvis Z acceleration G's vs Sec √ √Left femur compression load Lbf vs Sec √ √Right femur compression load Lbf vs Sec √ √Lap strap left side tension load Lbf vs Sec √ √Lap strap right side tension load Lbf vs Sec √ √Shoulder left strap tension load Lbf vs Sec √ √Shoulder right strap tension load Lbf vs Sec √ √Joint shoulder straps tension load Lbf vs Sec √ √Seat back X reaction force Lbf vs Sec √ √Seat back Y reaction force Lbf vs Sec √ √Seat back Z reaction force Lbf vs Sec √ √Seat pan X reaction force Lbf vs Sec √ √Seat pan Y reaction force Lbf vs Sec √ √Seat pan Z reaction force Lbf vs Sec √ √Seat pan X reaction moment In-lbf vs Sec √ √Seat pan Y reaction moment In-lbf vs Sec √ √Seat pan Z reaction moment In-lbf vs Sec √ √Head trajectory in the X-Z plane Inch vs Inch √ √Chest trajectory in the X-Z plane Inch vs Inch √ √Torso trajectory in the X-Z plane Inch vs Inch √ √Knee trajectory in the X-Z plane Inch vs Inch √ √
SAE J211-1
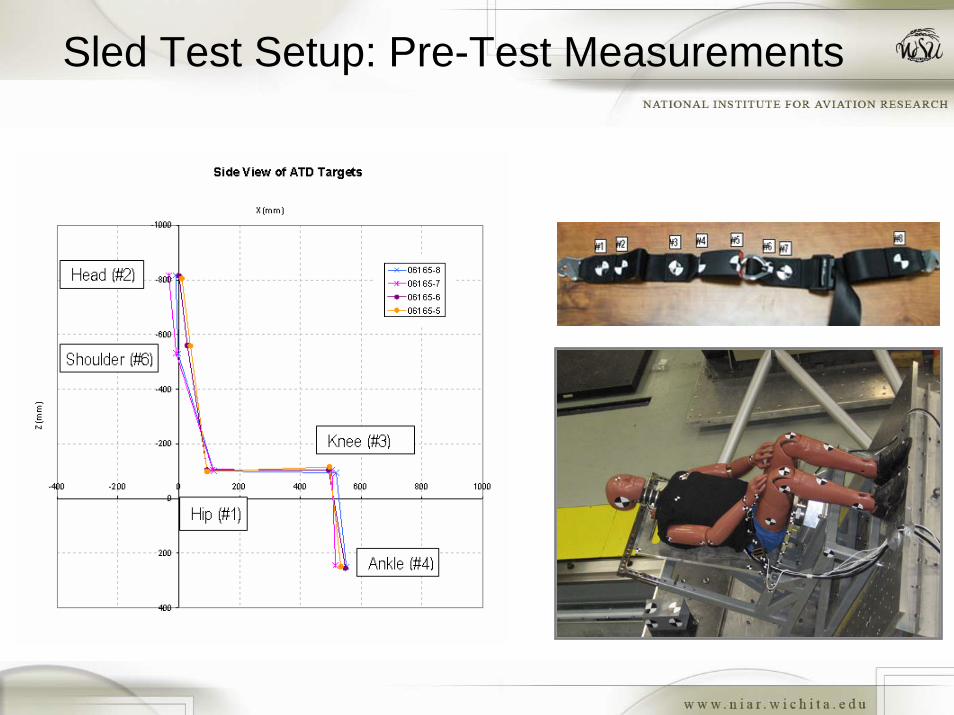
Sled Test Setup: Pre-Test Measurements
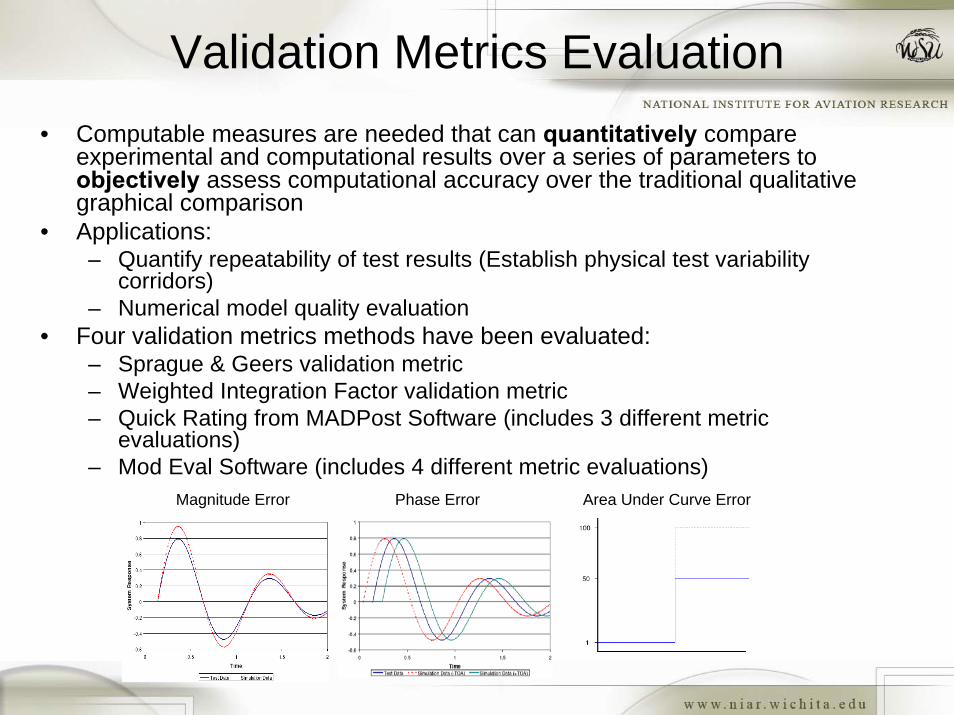
Validation Metrics Evaluation• Computable measures are needed that can quantitatively compare
experimental and computational results over a series of parameters to objectively assess computational accuracy over the traditional qualitative graphical comparison
• Applications:– Quantify repeatability of test results (Establish physical test variability
corridors)– Numerical model quality evaluation
• Four validation metrics methods have been evaluated:– Sprague & Geers validation metric– Weighted Integration Factor validation metric– Quick Rating from MADPost Software (includes 3 different metric
evaluations)– Mod Eval Software (includes 4 different metric evaluations)
Magnitude Error Area Under Curve ErrorPhase Error
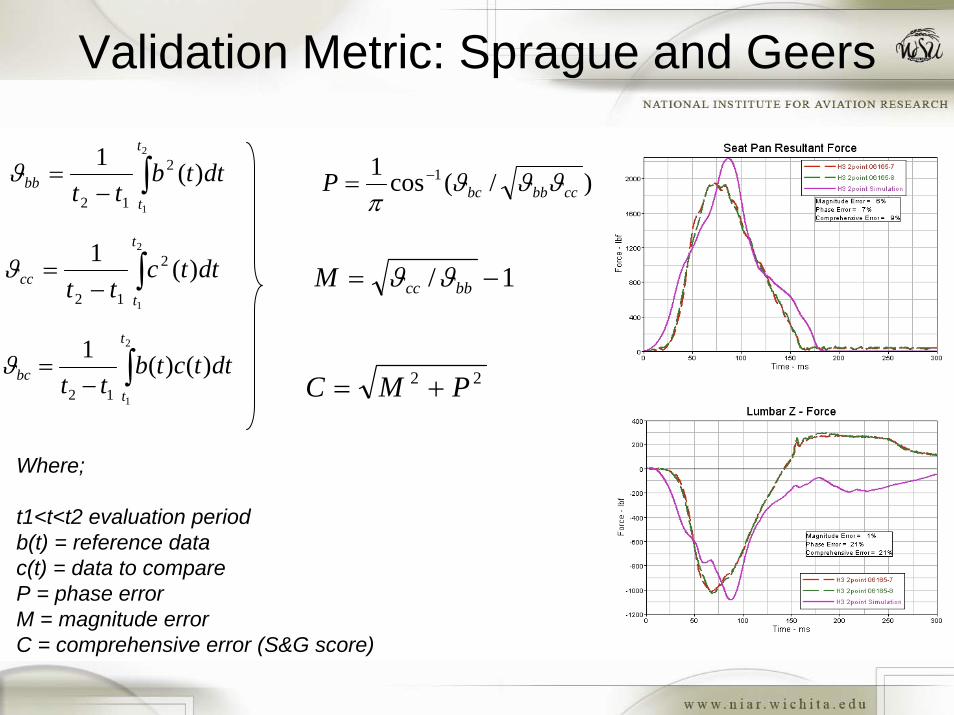
Validation Metric: Sprague and Geers
22 PMC +=
1/ −= bbccM ϑϑ
)/(cos1 1ccbbbcP ϑϑϑ
π−=∫−
=2
1
)(1 2
12
t
tbb dttb
ttϑ
∫−=
2
1
)(1 2
12
t
tcc dttc
ttϑ
∫−=
2
1
)()(1
12
t
tbc dttctb
ttϑ
Where;
t1<t<t2 evaluation periodb(t) = reference datac(t) = data to compareP = phase errorM = magnitude errorC = comprehensive error (S&G score)
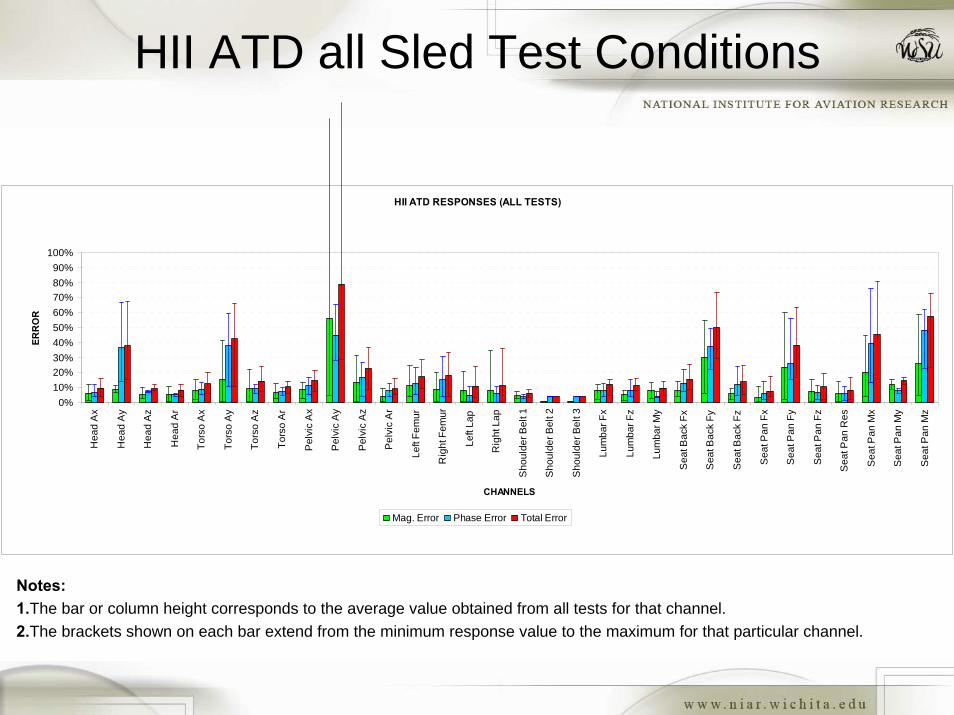
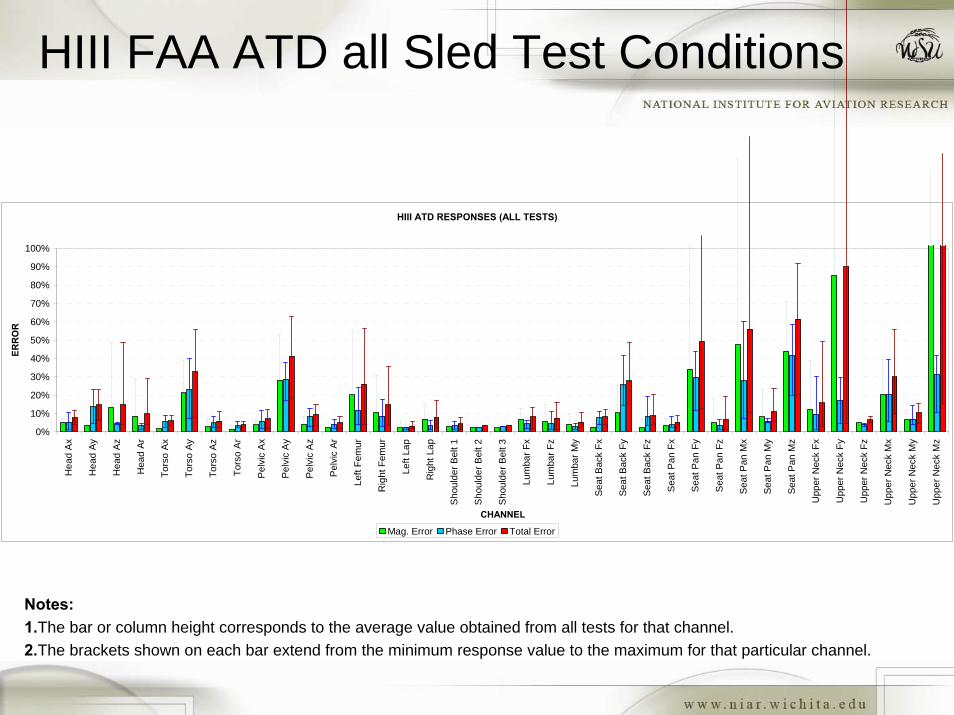
Notes:1.The bar or column height corresponds to the average value obtained from all tests for that channel.2.The brackets shown on each bar extend from the minimum response value to the maximum for that particular channel.
HII ATD all Sled Test Conditions
HII ATD RESPONSES (ALL TESTS)
0%10%20%30%40%50%60%70%80%90%
100%
Hea
d A
x
Hea
d A
y
Hea
d A
z
Hea
d A
r
Tors
o A
x
Tors
o A
y
Tors
o A
z
Tors
o A
r
Pel
vic
Ax
Pel
vic
Ay
Pel
vic
Az
Pel
vic
Ar
Left
Fem
ur
Rig
ht F
emur
Left
Lap
Rig
ht L
ap
Sho
ulde
r Bel
t 1
Sho
ulde
r Bel
t 2
Sho
ulde
r Bel
t 3
Lum
bar F
x
Lum
bar F
z
Lum
bar M
y
Sea
t Bac
k Fx
Sea
t Bac
k Fy
Sea
t Bac
k Fz
Sea
t Pan
Fx
Sea
t Pan
Fy
Sea
t Pan
Fz
Sea
t Pan
Res
Sea
t Pan
Mx
Sea
t Pan
My
Sea
t Pan
Mz
CHANNELS
ERR
OR
Mag. Error Phase Error Total Error
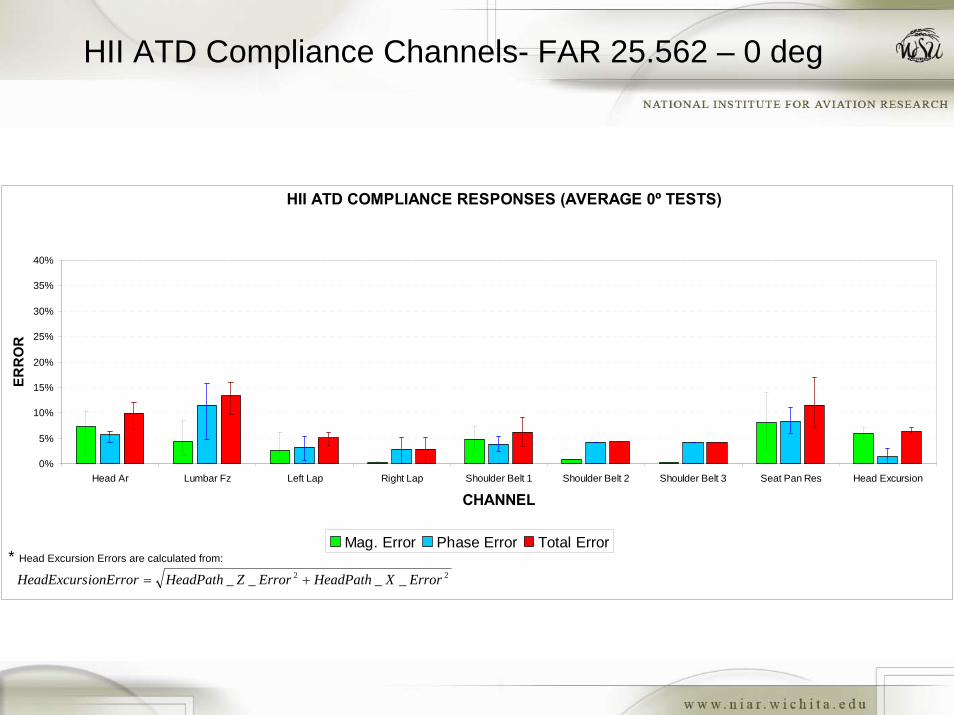
HII ATD Compliance Channels- FAR 25.562 – 0 deg
HII ATD COMPLIANCE RESPONSES (AVERAGE 0º TESTS)
0%
5%
10%
15%
20%
25%
30%
35%
40%
Head Ar Lumbar Fz Left Lap Right Lap Shoulder Belt 1 Shoulder Belt 2 Shoulder Belt 3 Seat Pan Res Head Excursion
CHANNEL
ERR
OR
Mag. Error Phase Error Total Error
22 ____ ErrorXHeadPathErrorZHeadPathionErrorHeadExcurs +=
* Head Excursion Errors are calculated from:
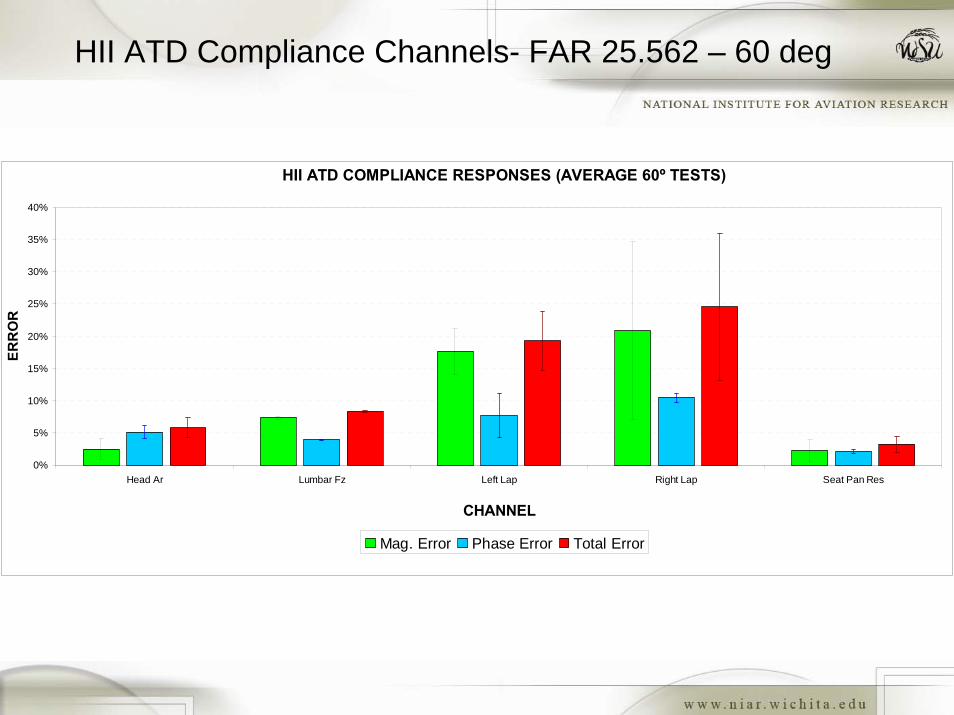
HII ATD Compliance Channels- FAR 25.562 – 60 deg
HII ATD COMPLIANCE RESPONSES (AVERAGE 60º TESTS)
0%
5%
10%
15%
20%
25%
30%
35%
40%
Head Ar Lumbar Fz Left Lap Right Lap Seat Pan Res
CHANNEL
ERR
OR
Mag. Error Phase Error Total Error
Notes:1.The bar or column height corresponds to the average value obtained from all tests for that channel.2.The brackets shown on each bar extend from the minimum response value to the maximum for that particular channel.
HIII ATD RESPONSES (ALL TESTS)
0%
10%
20%
30%
40%
50%
60%
70%
80%
90%
100%
Hea
d Ax
Hea
d Ay
Hea
d Az
Hea
d A
r
Tors
o Ax
Tors
o Ay
Tors
o Az
Tors
o A
r
Pelv
ic A
x
Pelv
ic A
y
Pelv
ic A
z
Pel
vic
Ar
Left
Fem
ur
Rig
ht F
emur
Left
Lap
Rig
ht L
ap
Sho
ulde
r Bel
t 1
Sho
ulde
r Bel
t 2
Sho
ulde
r Bel
t 3
Lum
bar F
x
Lum
bar F
z
Lum
bar M
y
Seat
Bac
k Fx
Seat
Bac
k Fy
Seat
Bac
k Fz
Sea
t Pan
Fx
Sea
t Pan
Fy
Sea
t Pan
Fz
Seat
Pan
Mx
Seat
Pan
My
Seat
Pan
Mz
Upp
er N
eck
Fx
Upp
er N
eck
Fy
Upp
er N
eck
Fz
Upp
er N
eck
Mx
Upp
er N
eck
My
Upp
er N
eck
Mz
CHANNEL
ERR
OR
Mag. Error Phase Error Total Error
HIII FAA ATD all Sled Test Conditions
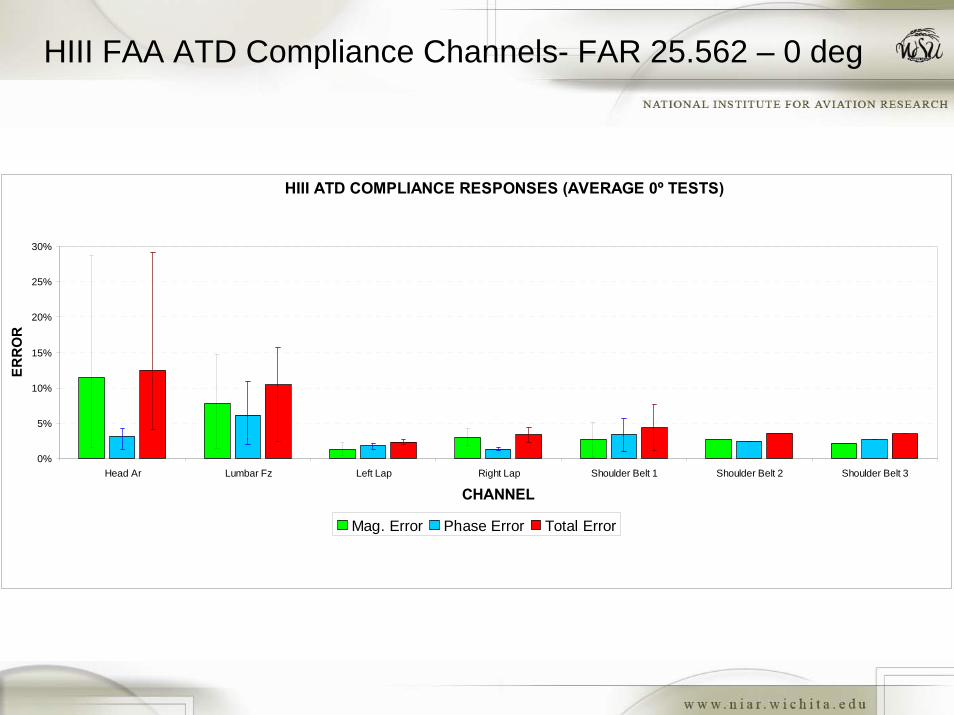
HIII ATD COMPLIANCE RESPONSES (AVERAGE 0º TESTS)
0%
5%
10%
15%
20%
25%
30%
Head Ar Lumbar Fz Left Lap Right Lap Shoulder Belt 1 Shoulder Belt 2 Shoulder Belt 3
CHANNEL
ERR
OR
Mag. Error Phase Error Total Error
HIII FAA ATD Compliance Channels- FAR 25.562 – 0 deg
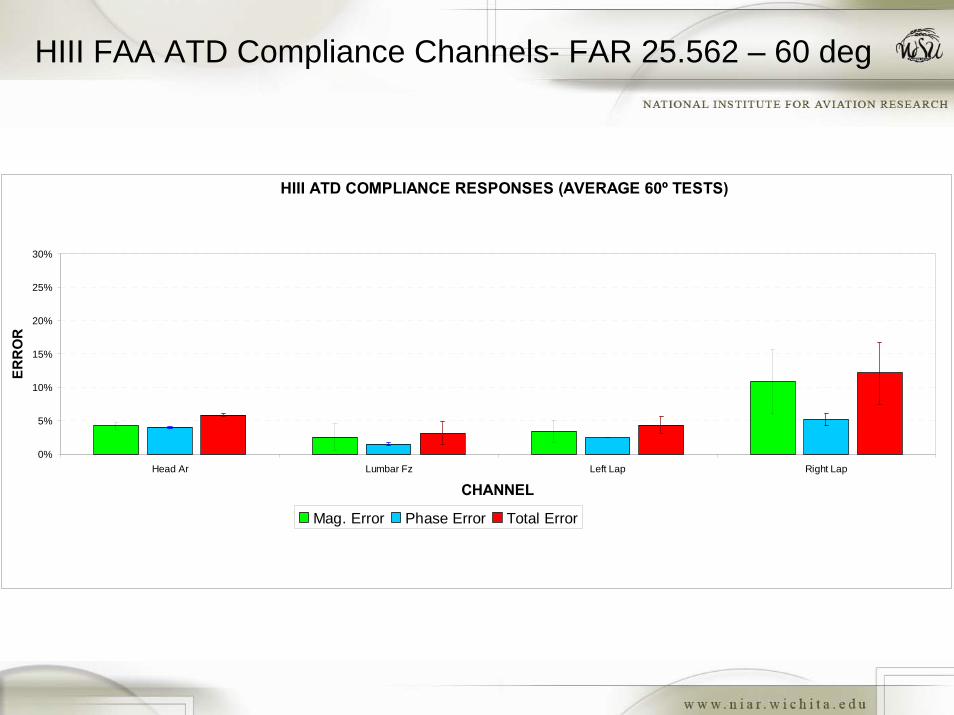
HIII ATD COMPLIANCE RESPONSES (AVERAGE 60º TESTS)
0%
5%
10%
15%
20%
25%
30%
Head Ar Lumbar Fz Left Lap Right Lap
CHANNEL
ERR
OR
Mag. Error Phase Error Total Error
HIII FAA ATD Compliance Channels- FAR 25.562 – 60 deg
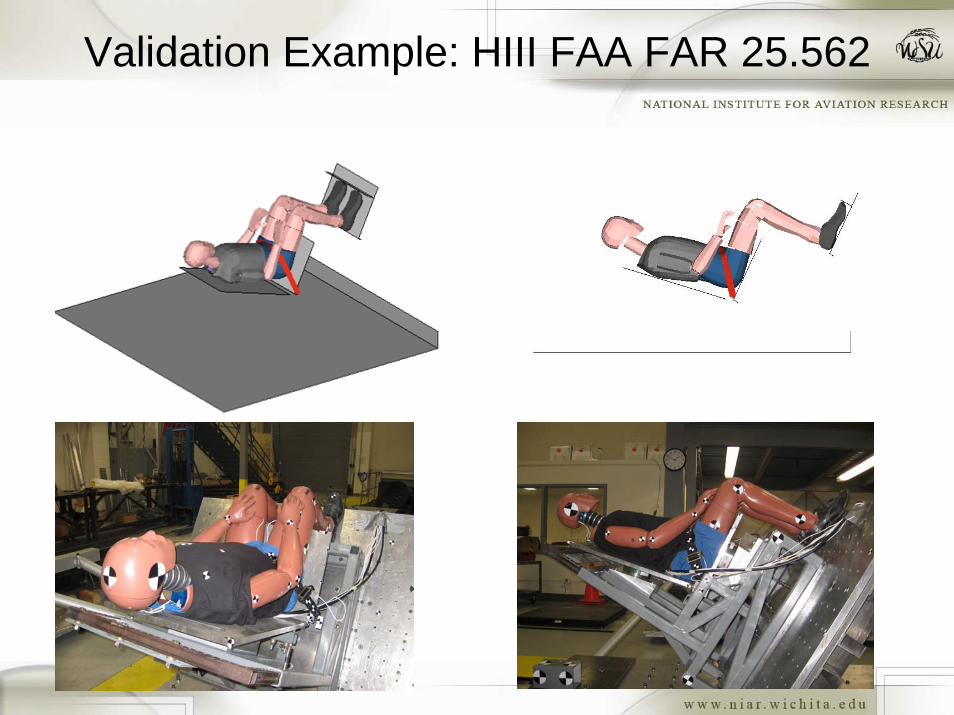
Validation Example: HIII FAA FAR 25.562
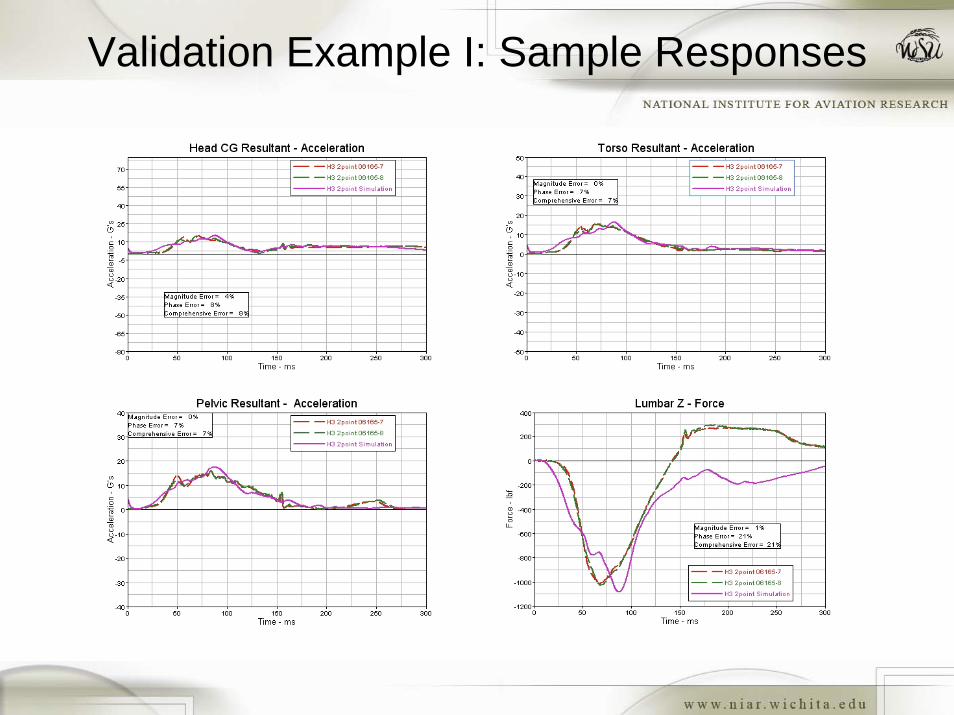
Validation Example I: Sample Responses
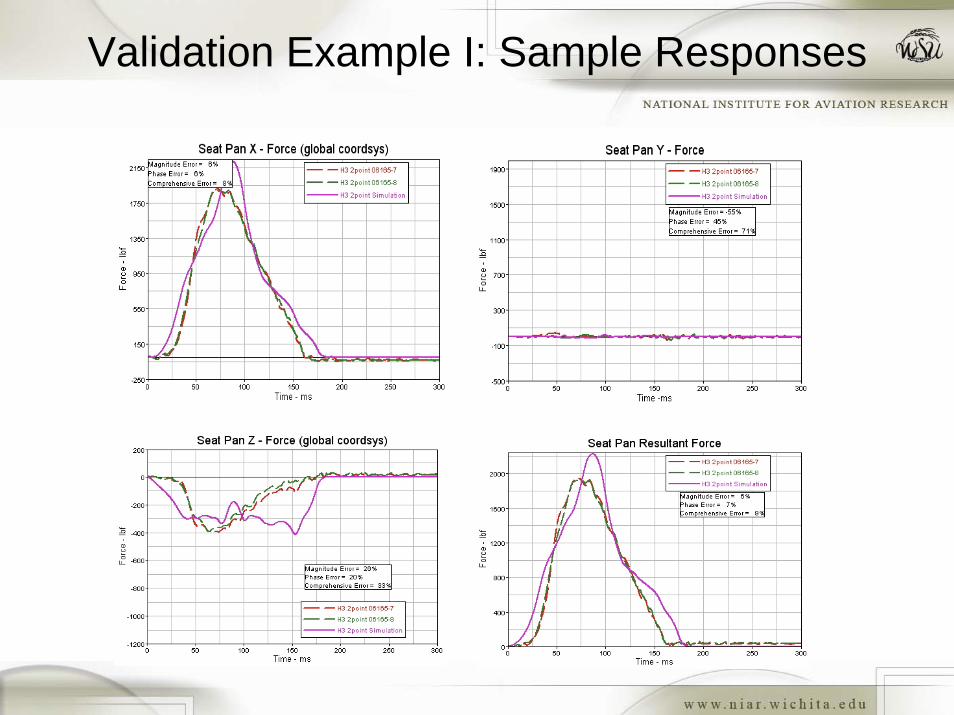
Validation Example I: Sample Responses
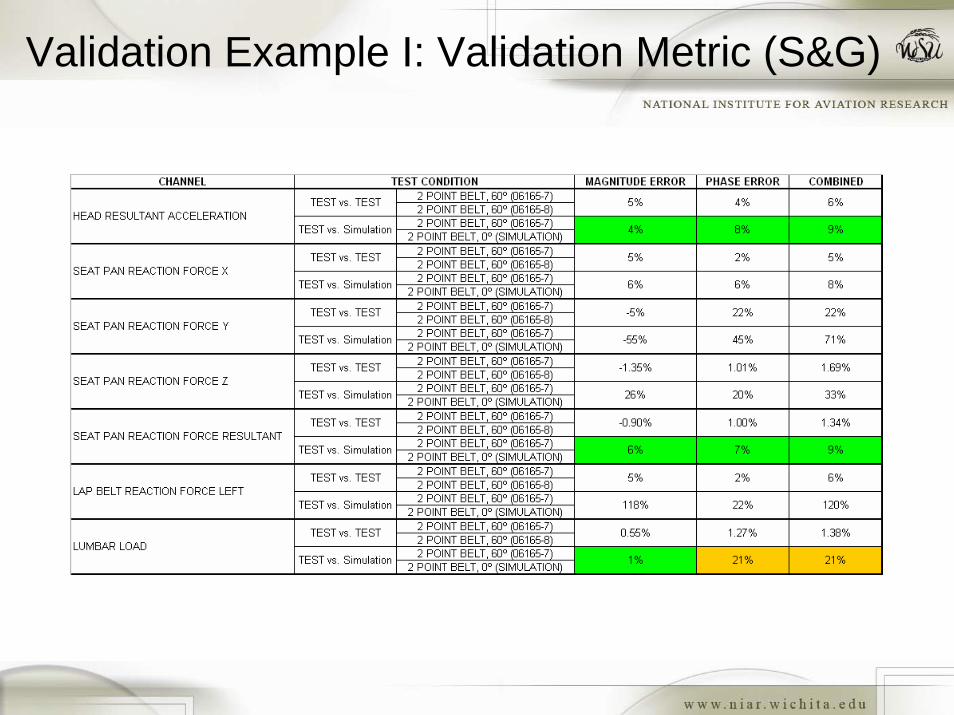
Validation Example I: Validation Metric (S&G)

Validation Example I: Occupant Kinematics
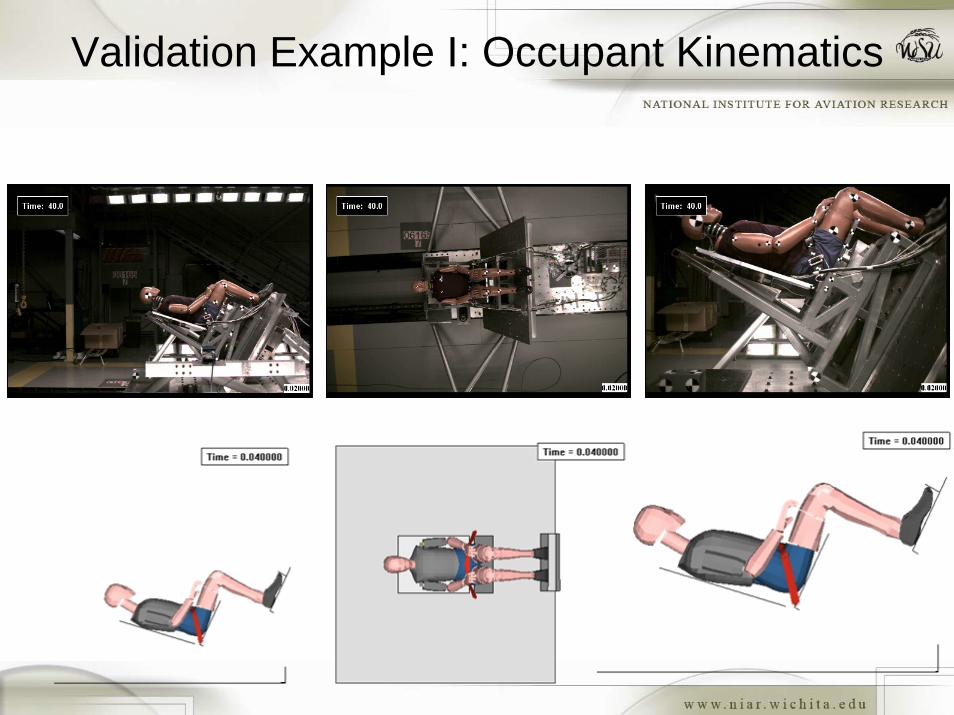
Validation Example I: Occupant Kinematics
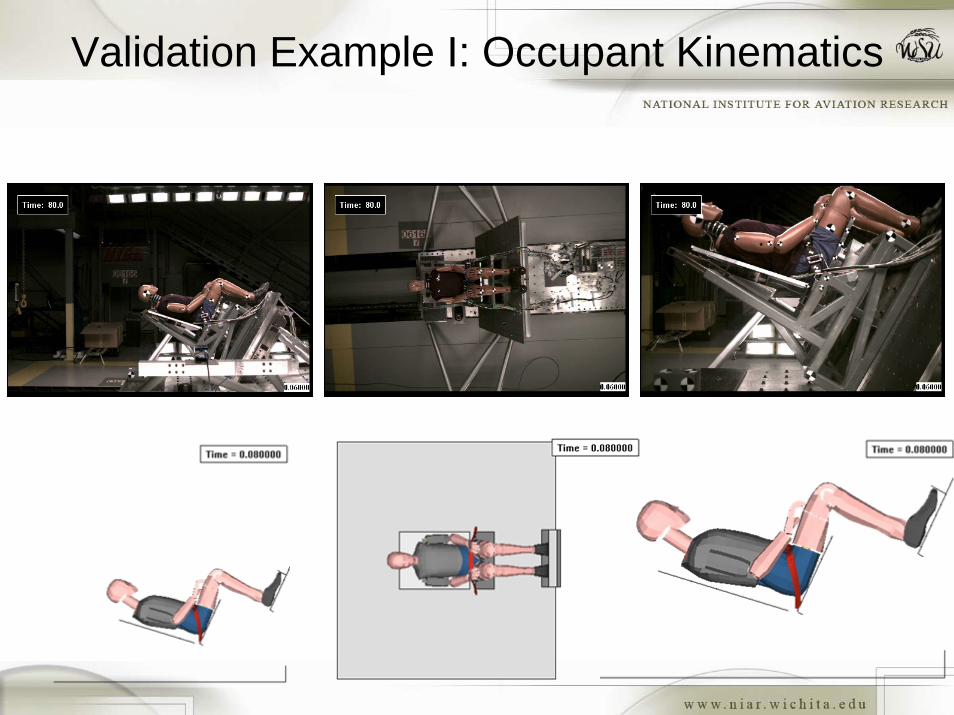
Validation Example I: Occupant Kinematics
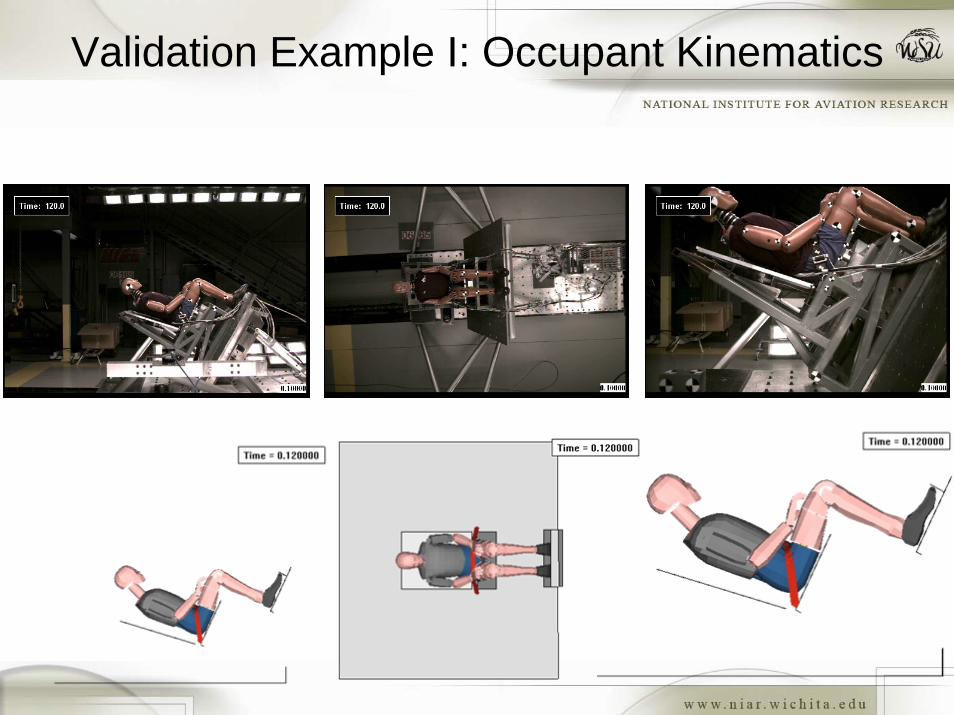
Validation Example I: Occupant Kinematics
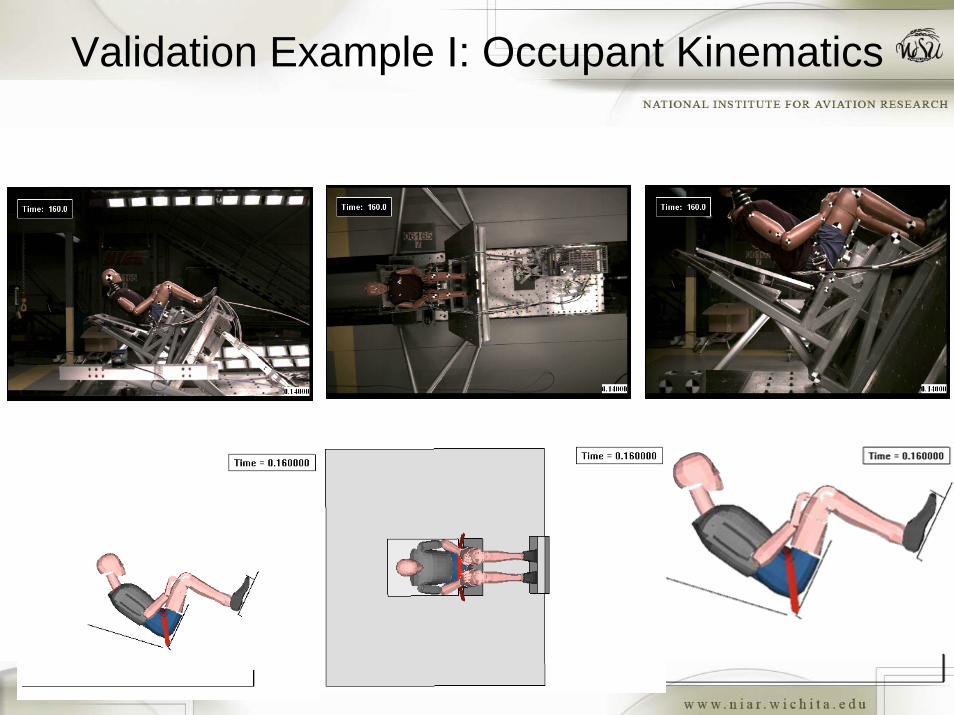
Validation Example I: Occupant Kinematics
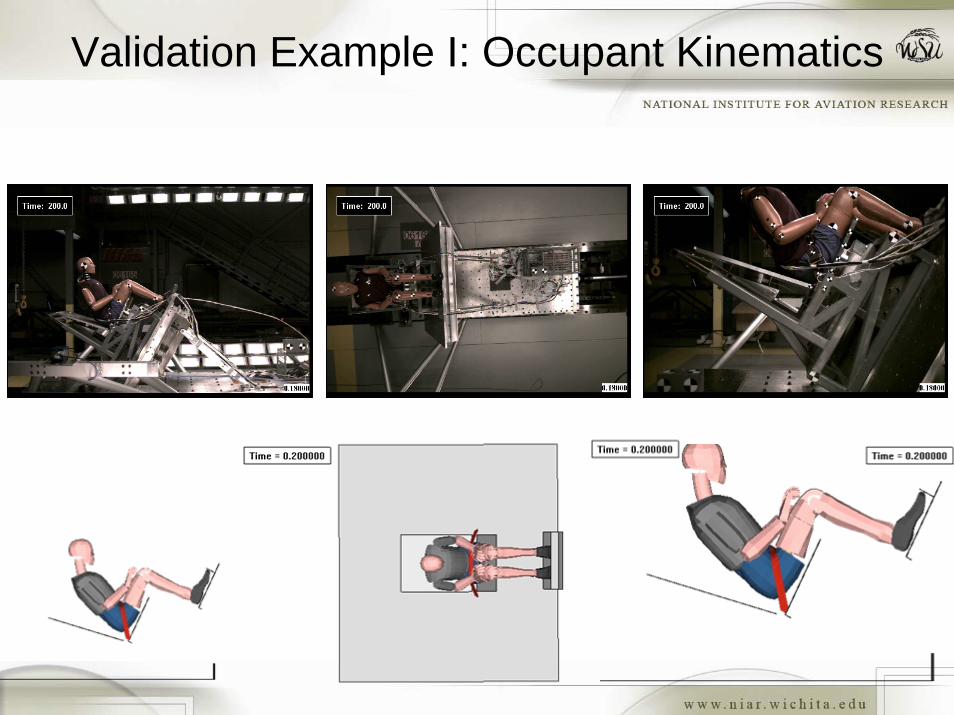
Validation Example I: Occupant Kinematics
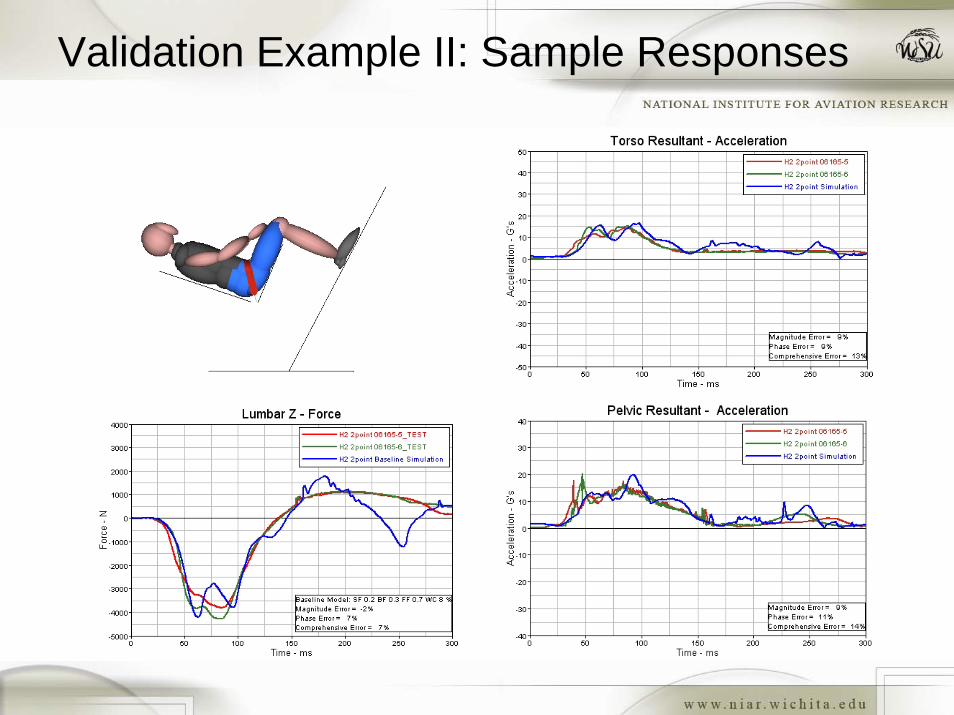
Validation Example II: Sample Responses
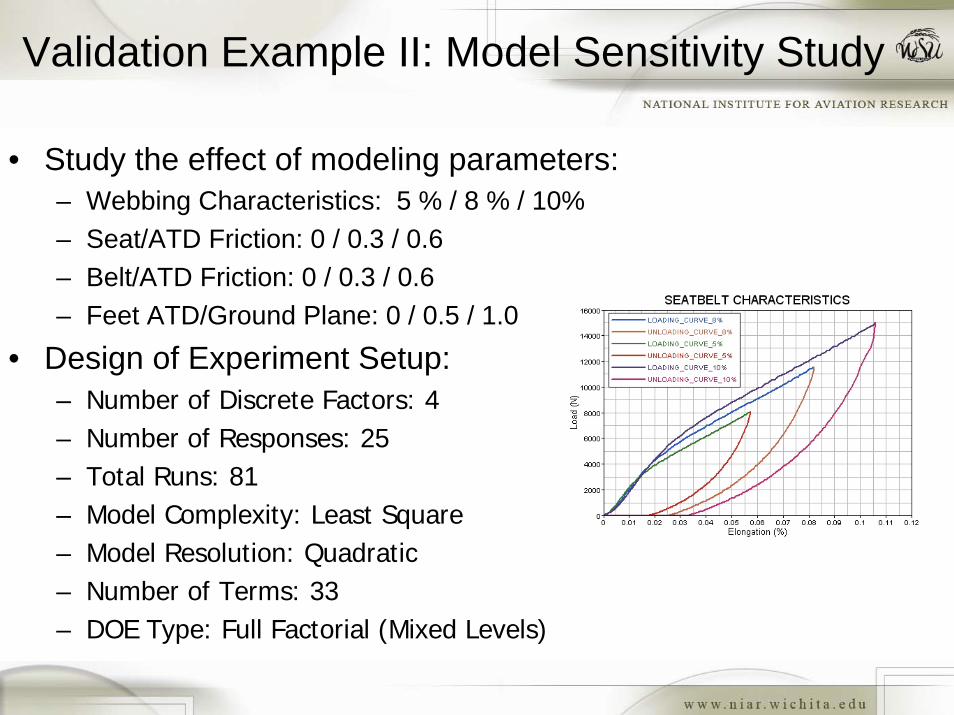
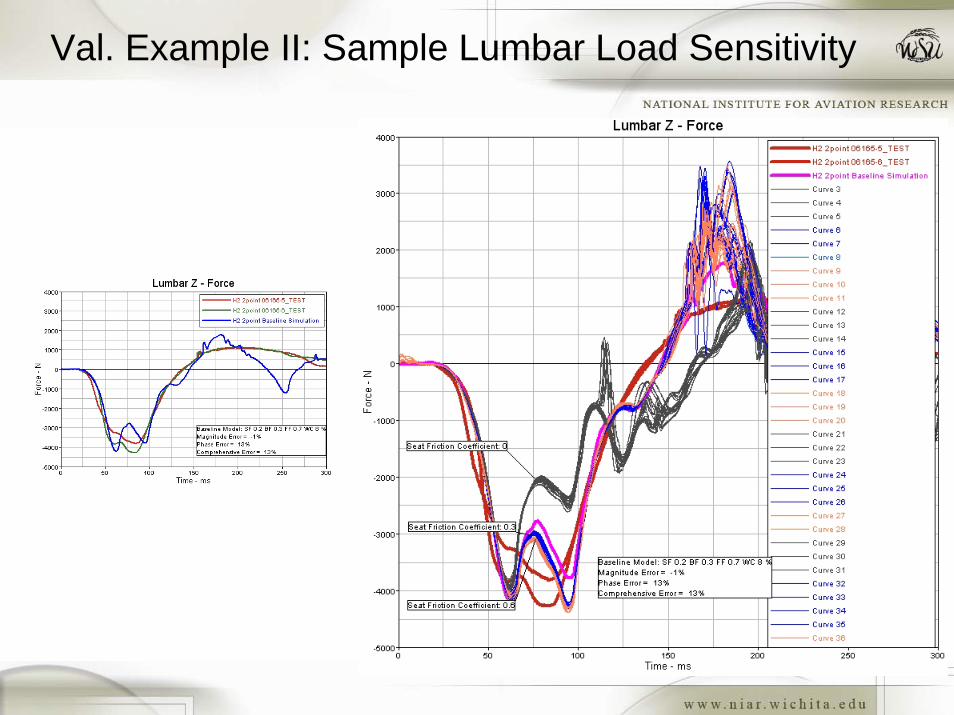
Validation Example II: Model Sensitivity Study
• Study the effect of modeling parameters:– Webbing Characteristics: 5 % / 8 % / 10%– Seat/ATD Friction: 0 / 0.3 / 0.6– Belt/ATD Friction: 0 / 0.3 / 0.6– Feet ATD/Ground Plane: 0 / 0.5 / 1.0
• Design of Experiment Setup:– Number of Discrete Factors: 4– Number of Responses: 25– Total Runs: 81– Model Complexity: Least Square– Model Resolution: Quadratic– Number of Terms: 33– DOE Type: Full Factorial (Mixed Levels)
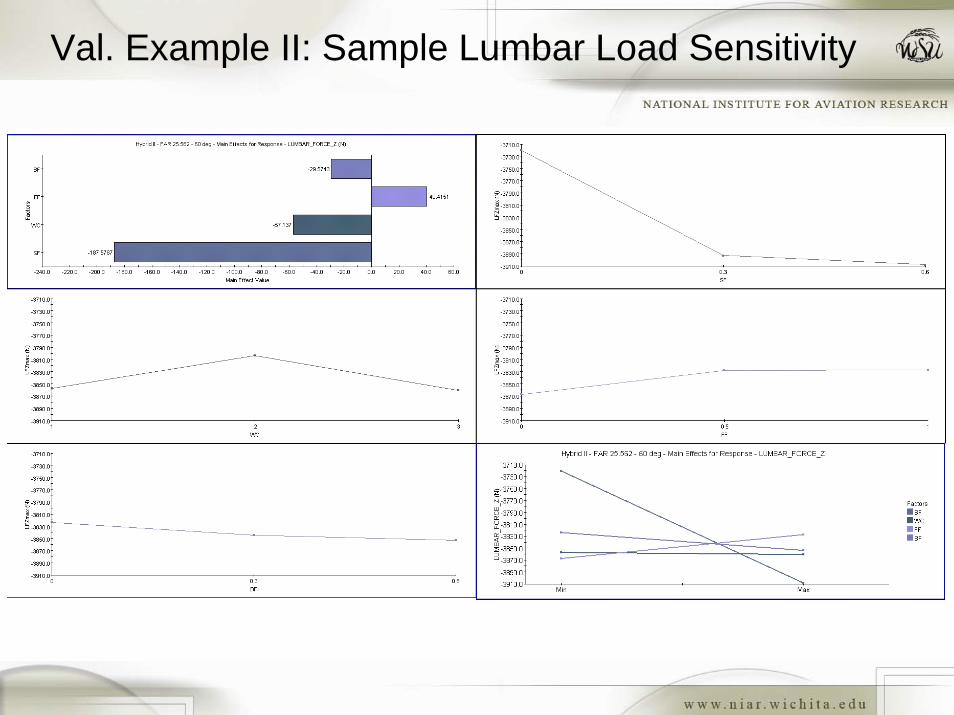
Val. Example II: Sample Lumbar Load Sensitivity
Val. Example II: Sample Lumbar Load Sensitivity
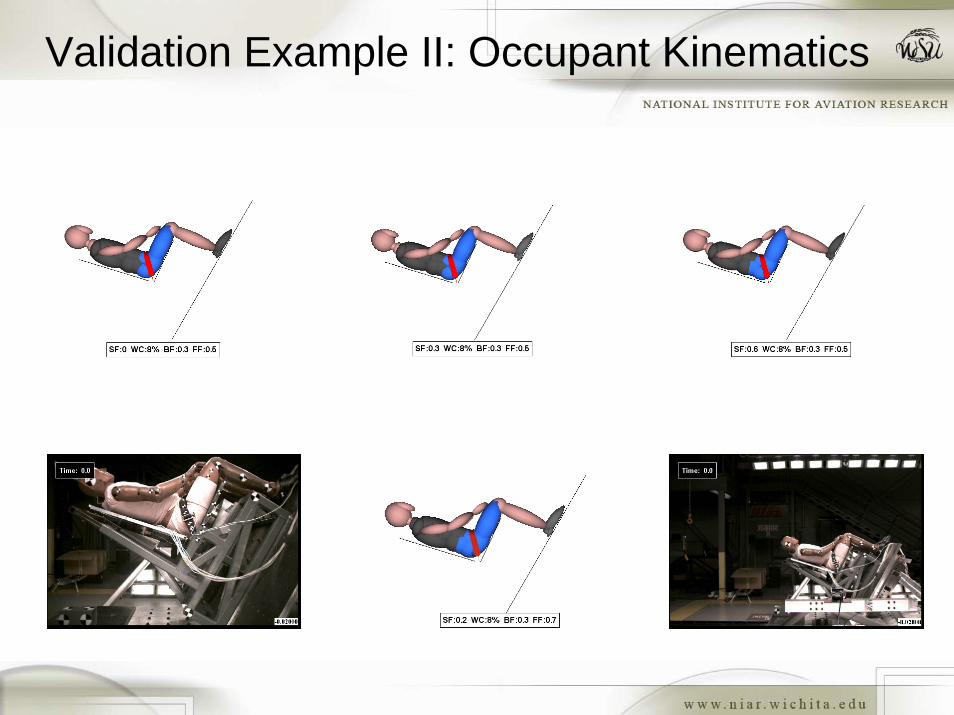
Validation Example II: Occupant Kinematics
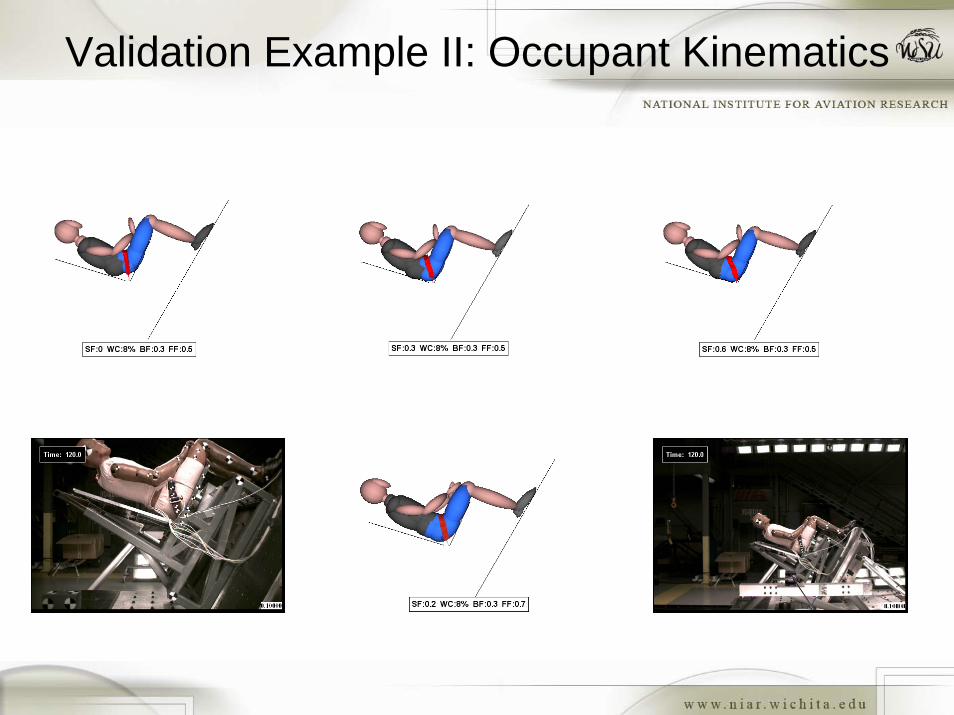
Validation Example II: Occupant Kinematics
Conclusion• A set of test data is available to numerical ATD developers and the
aerospace industry to evaluate numerical ATD performance.• Sprague and Geers validation metric provide an objective method to
quantitatively compare experimental and computational results over a series of parameters.
• The test variability data obtained during this project may be used in the future to establish ATD numerical model validation criteria.
• Preliminary simulation studies indicate that current ATD Databases (Multibody and Finite Element) need improvement in the abdomen/belt interaction area in order to improve the accuracy of head and pelvis kinematics, as well as lap belt reaction forces.
• Future work:– SAE Seat Committee CBA Working Group to define ARP document with validation
metric and criteria. – System level computational Stochastic and DOE analyses:
• Eliminate deterministic models and designs hence improving the “robustness” of the designs
– Research additional applications such as row-to-row, bulkhead, HUD installations, and side facing seats
– Develop Virtual Certification protocols
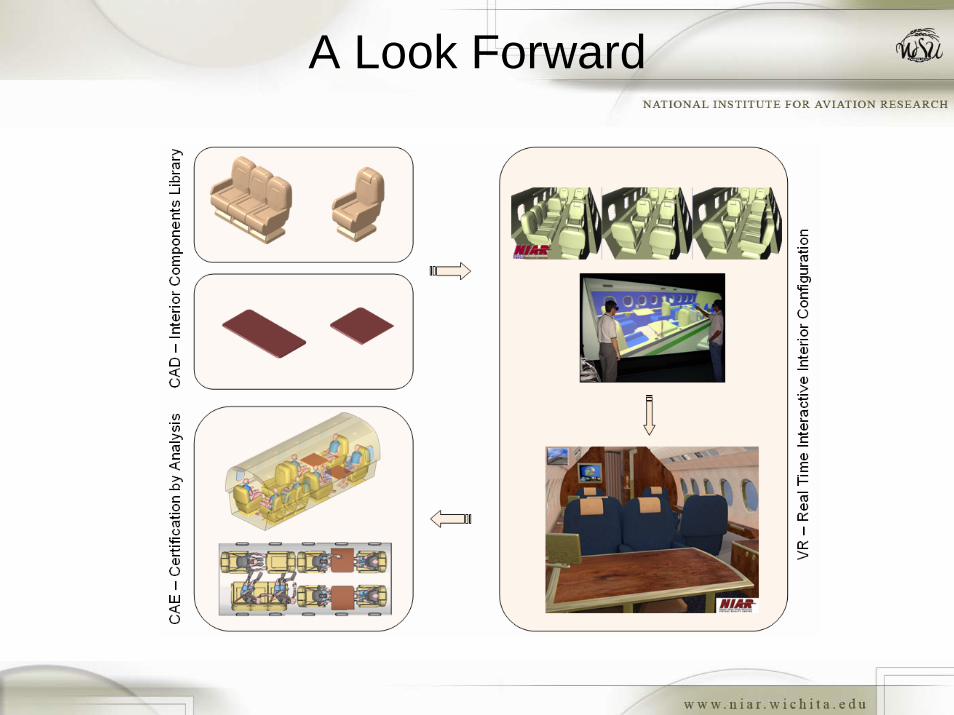
A Look Forward


![Analytical Validation Tools for Safety Critical Systems [12pt] … 2/Analytical Validation... · 2014-04-14 · Aerospace Working Group Aerospace Challenges and Open Issues • High](https://img.pdfslide.us/doc/110x75/5ec0d7bf43489c0cce2a6e03/analytical-validation-tools-for-safety-critical-systems-12pt-2analytical-validation.jpg)