Embed Size (px)
Citation preview
THE 19TH INTERNATIONAL CONFERENCE ON COMPOSITE MATERIALS
1 Introduction
Composite materials are more and more present in many industries, such as aircraft, aeronautic or automobile industries. There are many different types of composite materials. The present work focuses on textile reinforcements. The manufacturing processes of these various types of preforms are complex and diversified (weaving, braiding, knitting processes...). Many works about forming of textile reinforcements have been published [1-3]. However, few information is available about the quality of the textile reinforcement after the manufacturing process (local damages, defects, residual stresses...) and the textile reinforcement is supposed to be free of residual stresses. The aim of this study is to determine the effects of the weaving process on textile reinforcements. Two different scales could be used: the microscopic scale which considers the behaviour of the fibres into the yarn and the mesoscopic scale which considers the tow as a continuous material. Y. Wang [4-5] used a microscopic scale, the multi-chain digital-element simulation, to obtain the deformation during the weaving and braiding processes and the textile geometry after the process. But this method is very CPU expensive because of the number of fibres needed to be modelled (several thousands in technical fabrics). Another study at microscopic scale published by Duhovic and Bhattacharyya [6] concerns the knitted fabric composites. Pickett developed a mesoscopic method to determine the geometry of a rotary braided fabric [7]. He first determined the path of the yarns in the fabric and then applied the right section with a contact method. The geometry of the fabric obtained is correct but the manufacturing process itself is not studied and there are no results about residual stresses. The present approach consists in defining a mesoscopic model to simulate the weaving process for glass fibre reinforcements. We consider the tows
as a transversally isotropic material (continuous) and the behaviour at the scale of the fibres (microscopic scale) is ignored. The software used to simulate the process is ABAQUS/Standard®, and the specific behaviour of the yarn is defined in a user subroutine. The first part of this study concerns the implementation of this subroutine. The second part deals with the characterisation of the material parameters corresponding to the constitutive equations. Finally the model to simulate the weaving process is defined.
2 Constitutive law for yarn's behaviour
A user subroutine is necessary to define the mechanical behaviour of the yarn because of the specific ratio between transversal and longitudinal rigidity. Indeed the longitudinal rigidity is very high in comparison to the transverse behaviour. Two types of law could be used: hypo- and hyper-elastic law.
2.1 Hypoelastic constitutive equation
Most of the previous works about the behaviour of the yarn used hypoelastic laws to describe mechanical behaviour of the tow. One of the first modelling of the yarn using a hypoelastic law was published by Gasser [8]: only the longitudinal rigidity in the direction of the fibres and the compaction in the transverse plane are taken into account. The rate constitutive equations for a hypoelastic law can be written:
C : Dσ ∇ =
σ and D are, respectively, the Cauchy stress and the
strain rate tensor. σ ∇ is an objective derivative of
σ . Hagège [9] established that the classical
objective derivative (Jaumann or Green-Naghdi) are
NUMERIC MODELING OF THE FIBROUS MATERIAL WEAVING PROCESS FOR COMPOSITE MATERIAL
C. Florimond1*, J. Vilfayeau1,2, E. Vidal-Sallé1, P. Boisse1
1 Université de Lyon, CNRS, INSA-Lyon, LaMCoS UMR5259, F-69621, France 2 ENSAIT–GEMTEX, 2 allée Louise et Victor Champier, BP 30329, 59056 Roubaix Cedex, France
* Corresponding author ([email protected])
Keywords: weaving process, glass fibre, residual stresses, implicit simulation
not suitable for fibrous material: the longitudinal rigidity is very high in comparison to the transversal behaviour, and the fibre direction, which is not defined by an average rotation, has to be strictly followed in order to fulfil the principle of objectivity. In this way, Badel [10] defined a specific objective derivative:
t
C : D . . σ σ σ σ∇Φ ∇ΦΦ Φ
Φ
= = + Ω − Ω
Ω = ΦΦ
&
&
where Φ is the rotation of the material basis, defined by the direction of the fibres.
2.2 Hyperelastic constitutive equation
An alternative to a hypoelastic law is a hyperelastic law. Charmetant [11] proposed an anisotropic hyperelastic constitutive equation for composite preforms:
wS 2.
C
∂=∂
The strain energy density w is function of five invariants of C for an isotropic transverse material:
( )( )
( ) ( )( )( )
1 2 3 4 5
1
2 22
3
4
25
w w I , I , I , I , I
I Tr C
1I Tr C Tr C
2
I Det C
I C : M
I C : M
=
=
= −
=
=
=
Four deformation modes can be identified: stretch in the fibre direction (longitudinal behaviour), transverse compression, in-plane shear and transverse shear. A strain invariant is defined for each deformation mode, based on physical observations:
elong comp ish tshw w(I , I , I , I )=
It is assumed that the contribution of each deformation mode is independent from the others. The strain energy density is then a summation of each strain energy density of each deformation mode. So we can write:
ti i
i
w I2F F
J I Cσ ∂ ∂=
∂ ∂
where i corresponds to the ith deformation mode.
2.3 ABAQUS/Standard subroutine
A User MATerial subroutine is necessary to define such hypoelastic law in ABAQUS/ Standard®. Some information are passed in for every increment : the transformation gradient Fat the beginning and the
end of the increment and the increment of deformation ε∆ . These are stored in the global
basis G. The definition of the objective derivative proposed by Badel [10] enable us to exactly follow the direction of the fibres in the tow and to calculate the rate of stress in this new basis. The updated quantities (stresses and Jacobian tensor of the constitutive model) are passed to ABAQUS® at the end of the increment. But these have to be stored in the Jaumann basis. The rotation between the global basis and the Jaumann basis Ω is known and the updated stresses are:
[ ] [ ] [ ] [ ] [ ] [ ]t t
J m. . . .σ σ= Ω Φ Φ Ω
The definition of the updated Jacobian tensor of the constitutive model is more complicated [12]:
J spinC C C∇ ∇Φ= − where
( ) ( )spin t tC : D W W σ σ σ σΦ Φ= + − Ω + Ω
Because of the difficulties to calculate these quantities, a hyperelastic law is preferred. It can be implemented in a UANISOHYPER_INV subroutine. It is used to directly define the strain energy potential:
i
i
with i from 1 to 5w
I
∂∂
With this subroutine, no calculation of the Jacobian tensor of the constitutive model is needed, so the implementation of the algorithm is simpler.
3 The weaving process
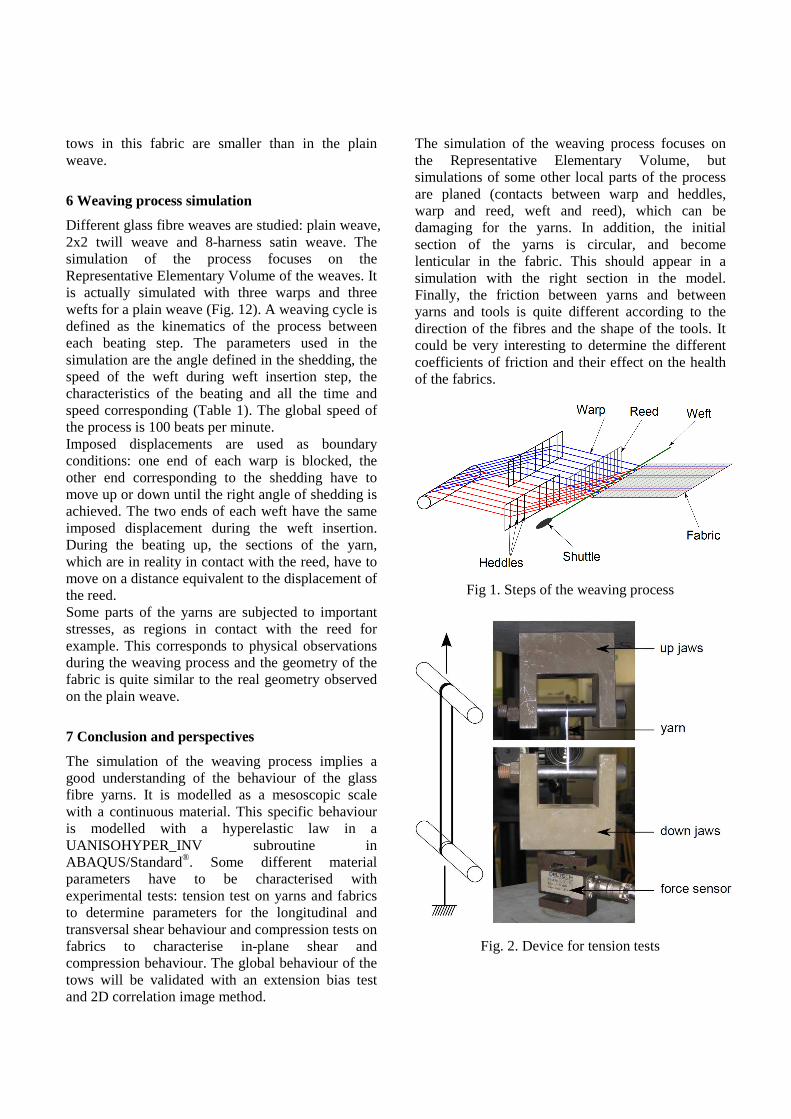
The loom used to obtain the fabrics studied in this work is a Dornier device. There are many steps during the weaving process [13] which can damage the tows: let-off, shedding, weft insertion, beating, take-up. The let-off is the first step at the beginning of the process, during which the warp yarns are drawn off the bobbins. The tows are passed though rings often made of Teflon, which are not very damaging for the yarns. Then the yarns are passed through the heddles which control the vertical motion of the warps: this is the shedding. The heddles are made of metallic materials and their thickness is very small, so it is a critical step for the
health of the yarns. The shedding allows the weft insertion between the warp yarns with the shuttle. When the weft yarn is entirely passed through the loom, they are packed into the fabric using a reed during the beating step. The friction between the shuttle (or the reed) and the warps is very strong and any little rough spots could damage the fibres. Finally, the take-up mechanism pulls the fabric along the weaving machine and all the previous steps are repeated. Those steps are the most important steps during the process (Fig. 1), but many other tools like the drop wires (which detect if a warp is broken) can damage the yarns.
4 Behaviour of the fibre
The simulation of any step of the weaving process requires the knowledge of the specific behaviour of the tows. Different glass fibre weaves (300 tex) are studied: plain weave, 2x2 twill weave, 8-harness satin weave.
4.1 Longitudinal behaviour
The longitudinal modulus is the easiest parameter to determine: a tension test on a single yarn only activates the longitudinal behaviour. This test is normalised [14]. The tow is impregnated with resin and cast resin end tabs are moulding to install properly grips in the jaws of the tension testing machine. The machine used is a 250 kN tension-compression machine Schenk. However, the test specimen slipped in the used jaws and the results obtained were not approved. Another experimental protocol was set up. A special device was realised with two rods: one put on the bottom jaws, the other one putted on the up jaws. The yarn can be balled-up around this rod and the tension test is realised on an equivalent specimen of two yarns (Fig. 2), but the results are presented for one yarn. The length of this equivalent yarn is around 600 mm, it is precisely measured for every test. The measured forces are very small compared with the measuring range of the testing machine: an external force sensor (500 N) is used. The displacement is measured by the internal sensor of the machine. The speed testing is imposed at 1 mm/min. The yarns are taken off each type of weave and also bobbin. The tests are realised on five specimens of each types of yarn. The results are presented as a force/deformation curve (Fig. 3). The Hencky deformation is calculated as :
0
0
L dln
Lε
+=
L0 is the initial length of the sample and d is the measured displacement. A non-linearity appears at the beginning of the curve. It corresponds to rearrangement of the fibres into the tow. In addition, all the fibres are not under tension exactly at the same time. The tensile stiffness is 8455 N. The results are identical for all the different types of yarn: the weaving process does not break filaments into the tows and not influence the tension modulus. This result is in agreement with the study of B. Lee [13, 15].
4.2 Transversal shear
The transversal shear appears during a tension test on a fabric sample. So it is important to previously characterise the longitudinal behaviour because it has a major role in this test. This experiment is very difficult to realise because the sample slides in the jaws. Different solutions were tested: sandpaper on the ends of the sample, 2D image correlation to determine the real deformation during the test, but none of them was successful. The better solution was proposed by the industrial TRP Charvet, who realised theses experiments. The machine used to realise this tests is a traction device with corrugated pneumatic jaws. Indeed the pressure has to be strong to avoid the sliding of the sample into the jaws. A mechanical locking is used to assure the tightening of the fabric (Fig. 4). The length of the tested specimens is 200 mm. The number of yarns along the width is 12 for plain weave and 18 for 2x2 twill weave. The results are presented for one yarn. The speed testing is imposed at 100 mm/min. The results are presented as a force/deformation curve (Fig. 5). The curves can be divided into two stages. First, the fabrics have a very small tension modulus because of the undulation of the warps. Then the warps are totally straight and the behaviour of the fabric corresponds to the longitudinal behaviour of the yarns. The first part of these curves characterises the transversal shear behaviour. Indeed, the transversal shear appears when the warps increase the undulation of the wefts. The behaviour is similar between the plain weave and the 2x2 twill weave. However, the 2x2 twill weave is less strong than the plain weave: the shrinkage of the warps in the plain weave is more important than in the twill weave, and the necessary deformation to have straight warps is more important.
4.3 Transversal plane behaviour
The transversal plane behaviour is characterised with a compression test on fabric. The machine used is a Zwick 100 kN tension-compression machine. The force and displacement measured are very small, so external tensors are setting up to determine theses values during the test. The force sensor is a 500 daN and the displacement sensor has a limit of 5 mm. A pinned plate is putting on the bottom jaw to assure the parallelism between the two plates (Fig. 6). The specimens are prepared in such a way that it exceeds the size of the punch. However, it must be small enough to stay horizontal and not bend: the sample is 110 mm square. The speed testing is imposed at 2 mm/min. The results are presented as a force/displacement curve (Fig. 7). The behaviour of the plain weave and the 2x2 twill weave is similar, when the behaviour of the 8-harness satin is quite different. Indeed, the spaces between the tows in the satin are larger than in the other weaves and the compression of the yarns can be more important.
5 Pure shear behaviour of fabric
The global behaviour of a yarn can be entirely determined with all the previous experiments. It is validated with a pure shear test. The shear rigidity is very small, so this is a major deformation mode for a fabric. In addition, the friction between yarns is important in a pure shear test and it could be characterised then. Two tests can be used [16]: the picture frame test and the extension bias test. The picture frame test consists to put a square sample in a frame and apply a tension on two opposite corners [17]. This kinematics leads to pure in-plane shear into the frame, so into the fabric. But this experiment can easily lead to unexpected tension in the yarns [18], which could influence a lot the results of the test, considering that the longitudinal rigidity is very important compared to the shear modulus. The extension bias test will be preferred in this study. The extension bias test consists in realising a classical tension test on a sample with the wefts and the warps initially orientated at ± 45° to the direction of the applied force [19]. The kinematics of this test is quite complex and different zones appear during the deformation of the weaving (Fig. 9): the region A is not deformed and the shear angle in the region C is twice than in the region B. The deformation in the region C is the same as the deformation produced by a picture frame test, and can be
considered equivalent to a pure shear deformation [20-21]. Three points have to be verified to realise this test. First of all, the extension bias test is valid only if no slippage appears between the tows. This hypothesis was validated during weaving forming [22]. Secondly, the longitudinal rigidity of the yarns has to be more important than the shear rigidity, which is true. Finally, the length of the sample must be at least twice the width to assure the right cinematic during the test [23]. The machine used is a 250 kN tension-compression machine Schenk. The force is very small, so external sensor is set up to determine theses values during the test. The force sensor is a 500 daN (Fig. 8). The speed testing is imposed at 30 mm/min. Unweaving is observed during the bias extension test. That is in contradiction with the hypothesis of non-slippage of the yarns. This hypothesis is true only if the shear angle is under a maximum value [23]. This value corresponds to the moment when the shear is blocked. It can be determined with the comparison between the theoretical shear angle and the experimental shear angle. The theoretical shear angle in the region C is:
1
0 a
2 d2.cos . 1
2 2 L L
πγ − = − + −
d is the displacement of the up jaws, L0 and La are respectively the initial length and width of the sample. The experimental shear angle can be determined with 2D correlation image method [24]. This method follows the local deformation into the fabric during the test thanks to a speckle on the sample. A stack of images are saved and synchronised with the force values. The software IcaSoft [25] determines the deformation on every image, so a force/deformation curve can be plotted. The three different regions in the sample appear clearly during the test (Fig. 9) and the experimental shear angle is the same as the theoretical shear angle (Fig. 10) for an angle under 25°. It is not necessary to validate the bias extension test for a more important angle, the point of this test is just to validate the behaviour of the tows for reasonable shear. The bias extension test was realised on five samples of each type of fabric. The behaviour is similar between the plain weave and the 2x2 twill weave (Fig 11). The shear is blocked for a smaller deformation with 2x2 twill weave samples than with plain weave samples, because the slacks between
tows in this fabric are smaller than in the plain weave.
6 Weaving process simulation
Different glass fibre weaves are studied: plain weave, 2x2 twill weave and 8-harness satin weave. The simulation of the process focuses on the Representative Elementary Volume of the weaves. It is actually simulated with three warps and three wefts for a plain weave (Fig. 12). A weaving cycle is defined as the kinematics of the process between each beating step. The parameters used in the simulation are the angle defined in the shedding, the speed of the weft during weft insertion step, the characteristics of the beating and all the time and speed corresponding (Table 1). The global speed of the process is 100 beats per minute. Imposed displacements are used as boundary conditions: one end of each warp is blocked, the other end corresponding to the shedding have to move up or down until the right angle of shedding is achieved. The two ends of each weft have the same imposed displacement during the weft insertion. During the beating up, the sections of the yarn, which are in reality in contact with the reed, have to move on a distance equivalent to the displacement of the reed. Some parts of the yarns are subjected to important stresses, as regions in contact with the reed for example. This corresponds to physical observations during the weaving process and the geometry of the fabric is quite similar to the real geometry observed on the plain weave.
7 Conclusion and perspectives
The simulation of the weaving process implies a good understanding of the behaviour of the glass fibre yarns. It is modelled as a mesoscopic scale with a continuous material. This specific behaviour is modelled with a hyperelastic law in a UANISOHYPER_INV subroutine in ABAQUS/Standard®. Some different material parameters have to be characterised with experimental tests: tension test on yarns and fabrics to determine parameters for the longitudinal and transversal shear behaviour and compression tests on fabrics to characterise in-plane shear and compression behaviour. The global behaviour of the tows will be validated with an extension bias test and 2D correlation image method.
The simulation of the weaving process focuses on the Representative Elementary Volume, but simulations of some other local parts of the process are planed (contacts between warp and heddles, warp and reed, weft and reed), which can be damaging for the yarns. In addition, the initial section of the yarns is circular, and become lenticular in the fabric. This should appear in a simulation with the right section in the model. Finally, the friction between yarns and between yarns and tools is quite different according to the direction of the fibres and the shape of the tools. It could be very interesting to determine the different coefficients of friction and their effect on the health of the fabrics.
Fig 1. Steps of the weaving process
Fig. 2. Device for tension tests
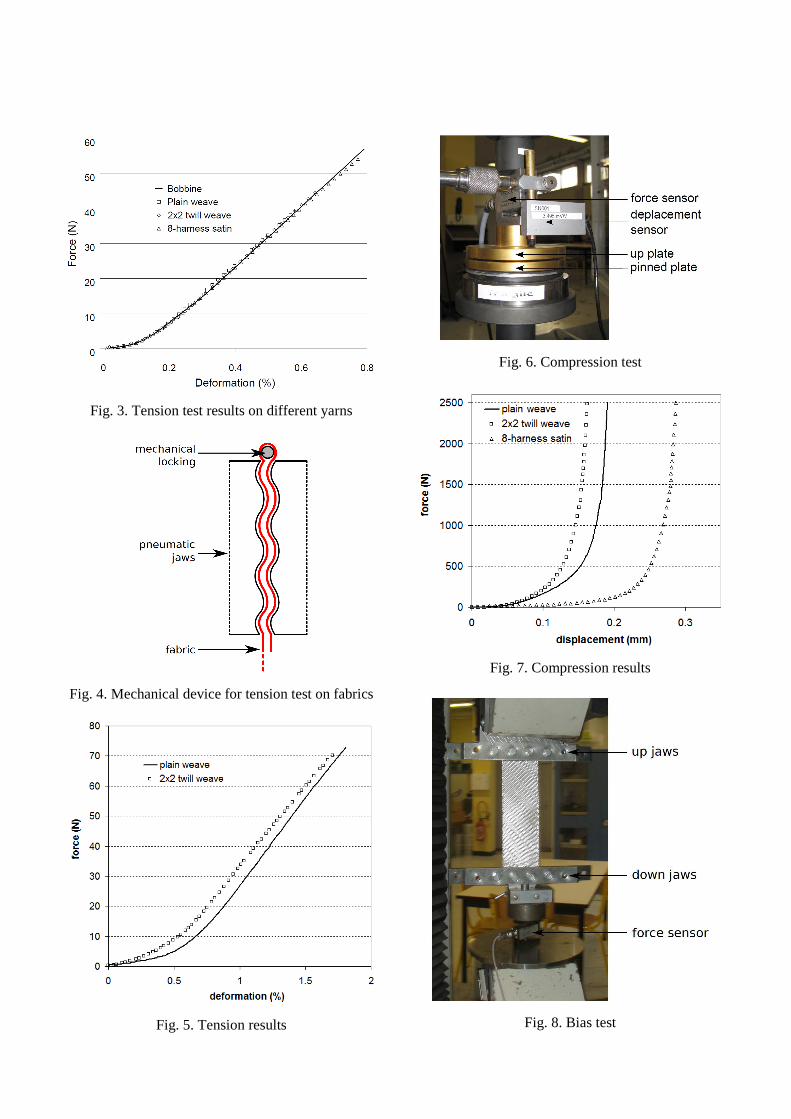
Fig. 3. Tension test results on different yarns
Fig. 4. Mechanical device for tension test on fabrics
Fig. 5. Tension results
Fig. 6. Compression test
Fig. 7. Compression results
Fig. 8. Bias test
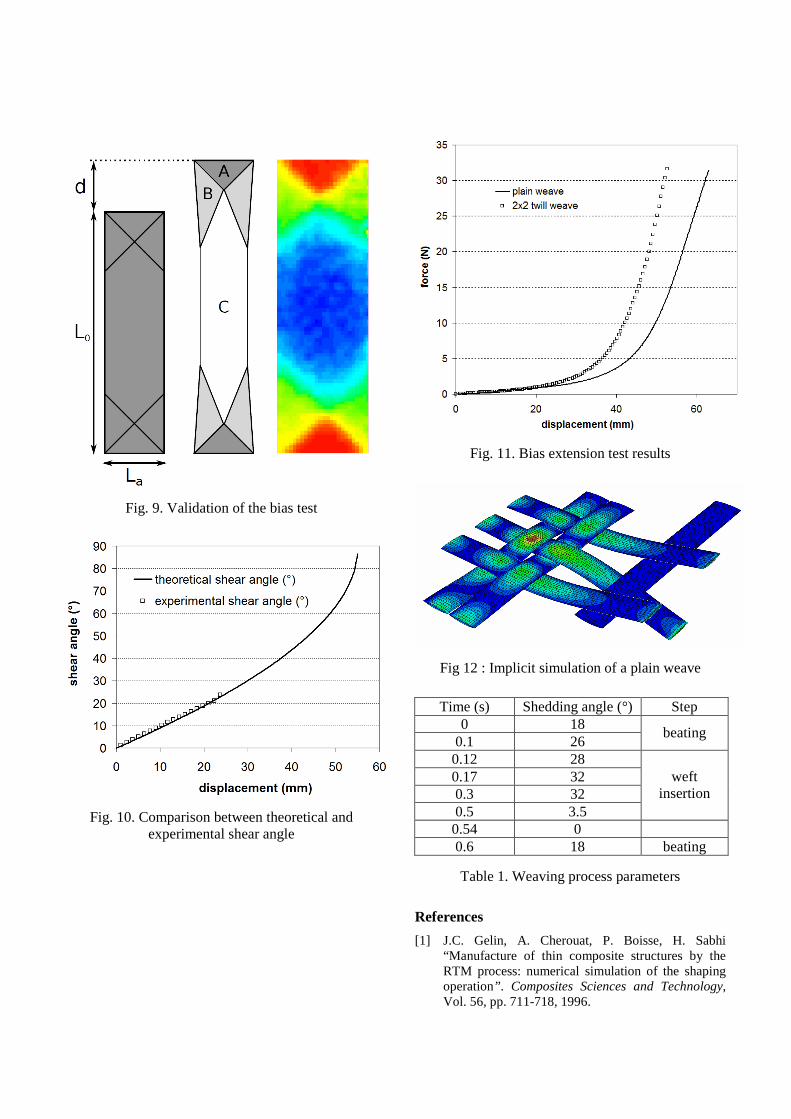
Fig. 9. Validation of the bias test
Fig. 10. Comparison between theoretical and experimental shear angle
Fig. 11. Bias extension test results
Fig 12 : Implicit simulation of a plain weave
Time (s) Shedding angle (°) Step
0 18 0.1 26
beating
0.12 28 0.17 32 0.3 32 0.5 3.5
weft insertion
0.54 0 0.6 18 beating
Table 1. Weaving process parameters
References
[1] J.C. Gelin, A. Cherouat, P. Boisse, H. Sabhi “Manufacture of thin composite structures by the RTM process: numerical simulation of the shaping operation”. Composites Sciences and Technology, Vol. 56, pp. 711-718, 1996.
[2] X. Chen “Modelling and predicting textile behaviour”. Woodhead Publishing Limited, 2010.
[3] N. Hamila, P. Boisse “Simulations of textile composite reinforcement draping using a new semi-discrete three node finite element” . Composites Part B : Engineering, Vol. 39, pp. 999-1010, 2008.
[4] Y. Wang, X. Sun “Digital-element simulation of textile processes” . Composites Science and Technology, Vol. 61, pp. 311-319, 2001.
[5] G. Zhou, X. Sun, Y. Wang, “Multi-chain digital element analysis in textile mechanics” . Composites Science and Technology, Vol. 64, pp. 239-244, 2004.
[6] M. Duhovic, D. Bahattacharyya “Simulating the deformation mechanisms of knitted fabric composites” . Composites Part A : Applied Science and Manufacturing, Vol. 37, pp. 1897-1915, 2006.
[7] K. Pickett, A.J. Sirtautas, A. Erber “Braiding simulation and prediction of mechanical properties” . Applied Composite Materials, Vol. 16, pp. 345-364, 2009.
[8] A. Gasser, P. Boisse, S. Hanklar “Mechanical behaviour of dry fabric reinforcements. 3D simulations versus biaxial tests”. Computational Materials Science, Vol. 17, pp. 7-20, 2000.
[9] B. Hagège, P. Boisse, J.L. Billoët “Finite element analyses of knitted composite reinforcement at large strain”. Revue Européenne des Eléments Finis, Vol. 14, pp. 767-776, 2005.
[10] P. Badel, E. Vidal-Sallé, P. Boisse “Large deformation analysis of fibrous materials using rate constitutive equations”. Computers and Structures, Vol. 86, pp. 1164-1175, 2008.
[11] A. Charmetant, J.G. Orliac, E. Vidal-Sallé, P. Boisse “Hyperelastic model for large deformation analyses of 3D interlock composite preforms”. Composites Science and Technology, Vol. 72, pp. 1352-1360, 2012.
[12] T. Belytschko, W.K. Liu, B. Moran “Nonlinear Finite Elements for Continua and Structures”. Wiley Editions, 2000.
[13] B. Lee, S. Rudov-Clark, A.P. Mouritz, M.K. Bannister, I. Herszberg “Effect of weaving damage on the tensile properties of three-dimensional woven composites”. Composites Structures, Vol. 57, pp. 405-413, 2002.
[14] “ASTM standards and literature references for composite materials”. ASTM, 1990.
[15] B. Lee, K.H. Leong, I. Herszberg “Effect of weaving on the tensile properties of carbon fibre tows and woven composites”. Journal of Reinforced Plastics and Composites, Vol. 20, pp. 652-670, 2001.
[16] J. Cao, R. Akkerman, P. Boisse, J. Chen, H.S. Cheng, E.F. de Graaf, J.L. Gorczyca, P. Harrison, G. Hivet, J. Launay, W. Lee, L. Liu, S.V. Lomov, A. Long, E. de Luycker, F. Morestin, J. Padvoiskis, X.Q. Peng, J. Sherwood, Tz. Stoilova, X.M. Tao, I. Verpoest, A. Willems, J. Wiggers, T.X. Yu, B. Zhu
“Characterization of mechanical behaviour of woven fabrics: Experimental methods and benchmark results”. Composites Part A: Applied Science and Manufacturing, Vol. 39, pp. 1037-1053, 2008.
[17] X.Q. Peng, J. Cao, J. Chen, P. Xue, D.S. Lussier, L. Liu “Experimental and numerical analysis on normalization of picture frame tests for composite materials”. Composites Science and Technology, Vol. 64, pp. 11-21, 2004.
[18] G. Lebrun, M.N. Bureau, J. Denault “Evaluation of bias-extension and picture-frame test methods for the measurement of intraply shear properties of pp/glass commingled fabrics”. Composite Structures, Vol. 61, pp. 341-352, 2003.
[19] J. Wang, J.R. Page, R. Paton “Experimental investigation of the draping properties of reinforcement fabrics”. Composites Science and Technology, Vol. 58, pp. 229-237, 1998.
[20] X.Q. Peng, J. Cao “A continuum mechanics-based non-orthogonal constitutive model for woven composite fabrics”. Composites Part A: Applied Science and Manufacturing, Vol. 36, pp. 859-874, 2005.
[21] P. Potluri, D.A. Perez Ciurezu, R.B. Ramgulam “Measurement of meso-scale shear deformations for modelling textile composites”. Composites Part A: Applied Science and Manufacturing, Vol. 37, pp. 303-314, 2006.
[22] P. Boisse, A. Cherouat, J.C. Gelin, H. Sabhi “Experimental study and finite element simulation of a glass fibre fabric shaping process”. Polymer Composites, Vol. 16, pp. 83-95, 1995.
[23] P. Harrison, M.J. Clifford, A.C. Long “Shear characterisation of viscous woven textile composites: a comparison between picture frame and bias extension experiments”. Composites Science and Technology, Vol. 64, pp. 1453-1465, 2004.
[24] S.V. Lomov, P. Boisse, E. De Luycker, F. Morestin, K. Vanclooster, D. Vandepitte, I. Verpoest, A. Willems “Full-field strain measurements in textile deformability studies”. Composites Part A: Applied Science and Manufacturing, Vol. 39, pp. 1232-1244, 2008.
[25] S. Dridi, F. Morestin, A. Dogui “Use of digital image correlation to analyse the shearing deformation in woven fabric”. Experimental Techniques, Vol. 36 pp. 46-52, 2011.


![Improvement of Interfacial Shear Strength Using ...confsys.encs.concordia.ca/ICCM19/AllPapers/FinalVersion/RUT80577.pdf · modified by introducing nano, ... the IFSS [15] and, based](https://img.pdfslide.us/doc/110x75/5abd66f07f8b9a8e3f8bba70/improvement-of-interfacial-shear-strength-using-by-introducing-nano-the.jpg)