Embed Size (px)
Citation preview
Numbering Resource Utilization in the United States:Status as of December 31, 2018
Industry Analysis Division Office of Economics and Analytics
October 2020
This report is available for reference in the FCC's Reference Information Center, 45 L Street NE, Washington, DC. Copies may be purchased by contacting Best Copy and Printing, Inc., 45 L Street NE, Washington, DC, telephone (800) 378-3160, or via their website at www.bcpiweb.com. The report can also be downloaded from the Office of Economics and Analytics Telephone Numbering website at www.fcc.gov/general/telephone-numbering-data.
Table of Contents
Executive Summary.................................................................................................................................................... 1 Highlights ................................................................................................................................................................... 1 Background ................................................................................................................................................................ 2 Analysis and Results................................................................................................................................................... 4
Tables 1. Number Utilization by Carrier Type as of December 31, 2018 ........................................................................ 92. Detail of Number Utilization: Non-rural Carriers (Reported at the Thousands-block Level) .......................... 93. Detail of Number Utilization: Rural Carriers (Reported at the NXX Level) ................................................... 94. Number Utilization by State as of December 31, 2018 .................................................................................. 105. Number of Carriers Reporting Numbering Resources as of December 31, 2018 ........................................... 116. Number Utilization by Area Code as of December 31, 2018 ......................................................................... 127. Assigned, Aging, and Available Numbers by Area Code as of December 31, 2018 ..................................... 178. Pooled Thousands-blocks as of December 31, 2018 ...................................................................................... 229. Increased Utilization and Numbers Saved due to Thousands-Block Pooling as of December 31, 2018 ....... 23
10. Number Utilization for Specialized Non-Geographic Area Codes ................................................................. 23 11. Alternate Sources of NPA-NXX Assignments ............................................................................................... 23 12. Number Utilization over Time ........................................................................................................................ 25 13. NPA-NXX Assignments, Returns, and Net Assignments .............................................................................. 26 14. Porting Activity Since Wireless Porting Started ............................................................................................. 28 15. Numbers in the Porting Database Over Time ................................................................................................. 29 16. Numbers in the Porting Database by Porting Date as of December 31, 2018 ................................................ 30 17. Numbers Ported from Wireline Carriers by State and Recipient Carrier Type .............................................. 31 18. Numbers Ported from Wireless Carriers by State and Recipient Carrier Type .............................................. 32 19. Numbers Ported from VoIP Providers by State and Recipient Carrier Type ................................................. 33 20. Percentage of Assigned Numbers Currently Ported as of December 31, 2018 .............................................. 34 21. Numbers Assigned for Toll-Free Service ....................................................................................................... 35 22. Numbers Assigned for 800 Toll-Free Service ................................................................................................ 36 23. Numbers Assigned for 888 Toll-Free Service ................................................................................................ 37 24. Numbers Assigned for 877 Toll-Free Service ................................................................................................ 38 25. Numbers Assigned for 866 Toll-Free Service ................................................................................................ 39 26. Numbers Assigned for 855 Toll-Free Service ................................................................................................ 40 27. Numbers Assigned for 844 Toll-Free Service ................................................................................................ 40 28. Numbers Assigned for 833 Toll-Free Service ................................................................................................ 40 29. Area Codes by State (1947 - 2018) ................................................................................................................. 4130. Area Code Assignments (2005 - 2018)........................................................................................................... 42
Charts 1. Average Utilization Rates by Number of Thousands-blocks Held in a Rate Center ...................................... 242. NPA-NXX Assignments, Returns, and Net Assignments .............................................................................. 27
Numbering Resource Utilization in the United States: Status as of December 31, 2018
Executive Summary
This report summarizes an ongoing, systematic collection of comprehensive data on the utilization of telephone numbers within the United States.1 The information was acquired from telecommunications carriers holding numbering resources and was analyzed as part of our ongoing assessment of the efficacy of numbering resource optimization measures prescribed by the Commission’s Numbering Resource Optimization (NRO) Orders.2
Highlights
As of December 31, 2018:
• Overall, 52.6% of all numbers were assigned to end users.
• The overall utilization rate for Competitive Local Exchange Carriers (LECs) was 47.6%.
• The overall utilization rate for Incumbent LECs was 38.1%.
• The overall utilization rate for Mobile Wireless carriers was 76.2%.
• The overall utilization rate for Paging carriers was 4.6%.
• The overall utilization rate for Voice over Internet Protocol (VoIP) providers was 6.8%.
• The utilization rate of numbers assigned at the thousands-block level was 54.0%.
• The utilization rate of numbers assigned at the NXX level was 10.2%.
• Thousands-block pooling has made it unnecessary to distribute over 937 million telephone numbers.
• Carriers returned 1.3 million telephone numbers to the NANPA in the second-half of 2018.
• Since wireless porting began in 2003, there have been over 590 million numbers ported.
• Over 246 million numbers are currently ported.
• 97% of ports have been intramodal, meaning numbers are ported between providers of the same service type.
• There are currently 41 million working toll-free numbers.
1 The previous edition of this report with data as of December 31, 2017 was released in August 2019. 2 See Numbering Resource Optimization, CC Docket No. 99-200, Report and Order and Further Notice of Proposed Rulemaking, 15 FCC Rcd 7574 (2000) (First NRO Order); Numbering Resource Optimization, CC Docket Nos. 99-200, 96-98, Second Report and Order, Order on Reconsideration in CC Docket No. 96-98 and CC Docket No. 99-200, and Second Further Notice of Proposed Rulemaking in CC Docket No. 99-200, 16 FCC Rcd 306 (2000) (Second NRO Order); Numbering Resource Optimization, CC Docket Nos. 99-200, 96-98, 95-116, Third Report and Order and Second Order on Reconsideration in CC Docket No. 96-98 and CC Docket No. 99-200, 17 FCC Rcd 252 (2001) (Third NRO Order); Numbering Resource Optimization, CC Docket Nos. 99-200, 96-98, 95-116, Fourth Report and Order in CC Docket No. 99-200 and CC Docket No. 95-116, and Fourth Further Notice of Proposed Rulemaking in CC Docket No. 99-200, 18 FCC Rcd 12472 (2003) (Fourth NRO Order).
U.S. Federal Communications Commission 1 Numbering Resource Utilization in the United States
Background
The United States uses ten-digit telephone numbers, organized in accordance with the North American Numbering Plan (NANP).3 The NANP divides the country into separate geographic areas called numbering plan areas (NPAs), more commonly called area codes. Calls between these areas are generally dialed using the three-digit area code, followed by a seven-digit local telephone number.
When the NANP was established in 1947, only 78 area codes were assigned to telecommunications service providers in the United States. Only 36 new codes were added through 1989, but the rate of activation increased dramatically in the 1990s, when 112 new area codes were activated.4 Because the remaining supply of unassigned area codes was diminishing, and because a premature exhaust of area codes imposes significant costs on consumers, the Commission in 1999 initiated a proceeding to ensure that the limited numbering resources are used efficiently.
In the First NRO Order, in 2000, the Commission required users of numbering resources to file utilization data and forecasts twice a year.5 Data as of December 31 are due to the North American Numbering Plan Administrator (NANPA) by February 1, and data as of June 30 are due by August 1. The data are submitted using FCC Form 502, the Numbering Resource Utilization/Forecast (NRUF) form.6
The vast majority of numbering resources reported were part of geographic area codes. That is, the numbers were part of area codes associated with specific regions of the United States or another country. For instance, area code 406 is associated with Montana, and area code 506 is associated with New Brunswick, Canada. Carriers are also required to report on utilization of some non-geographic area codes, such as 500 numbers and 900 numbers (described later in this report). Carriers use other types of non-geographic numbering resources as well: millions of numbers are used to provide toll-free services using non-geographic area codes such as 800, 888, 877 and 866. These numbering resources are managed separately.
Historically, local telephone companies received geographic numbers in blocks of 10,000. These ten-thousands-blocks of numbers are often called NXXs, or central office codes, and are identifiable as the first three digits of a seven-digit telephone number.7 To conserve numbers, the Commission’s NRO Orders established “thousands-block number pooling,” where an NXX is broken into ten sequential blocks of 1,000 numbers.8 Carriers may then be required to donate unused or underutilized blocks to the Pooling Administrator (PA), which then assigns those thousands-blocks to other carriers in need of numbers.9 This effectively allows the assignment of numbers in blocks of 1,000 rather than 10,000. Most carriers are required to report their number utilization information at the thousands-block level so that the Commission can evaluate the efficacy of telephone number
3 The North American Numbering Plan is used in the United States and its territories, and in Canada, Bermuda, and many Caribbean nations, including Anguilla, Antigua and Barbuda, the Bahamas, Barbados, British Virgin Islands, Cayman Islands, Dominica, Dominican Republic, Grenada, Jamaica, Montserrat, St. Kitts and Nevis, St. Lucia, St. Vincent and the Grenadines, Trinidad and Tobago, and the Turks and Caicos Islands. The data contained in this report are limited to the United States and its overseas territories. 4 A database containing information about each area code is available at https://www.nationalnanpa.com/nanp1/npa_report.csv. 5 First NRO Order, 15 FCC Rcd at 7603, para. 67. On October 16, 2018, the FCC selected Somos, Inc. as the current NANPA and PA. FCC Selects Somos as North American Numbering Plan Administrator & Pooling Administrator Under One-Year Bridge Contracts, News Release (rel. Oct. 16, 2018) available at https://docs.fcc.gov/public/attachments/DOC-354567A1.pdf (News Release). 6 FCC Form 502 and most other FCC forms can be downloaded via http://www.fcc.gov/formpage.html, 7 That is, a ten-thousands-block is the block of 10,000 telephone numbers that have the same area code and the same NXX. 8 Pooling for wireline and wireless carriers started in November 2002. For a discussion of this requirement, see Fourth NRO Order, 18 FCC Rcd at 12474-77, paras. 5–14. 9 As noted above, on October 16, 2018, the FCC selected Somos, Inc. as the NANPA and PA. See News Release.
U.S. Federal Communications Commission 2 Numbering Resource Utilization in the United States
pooling. However, carriers that meet the statutory definition of “rural telephone company”10 and operate in non-pooling areas submit their number utilization information at the NXX level. In this report, we present utilization data for five types of carriers:11 • Competitive LECs • Incumbent LECs • Mobile Wireless Carriers • Paging Carriers • VoIP Providers In June 2015, the Commission adopted the Direct Access Order12 granting VoIP providers the ability to obtain numbers directly from the NANPA or PA. Prior to this order, VoIP providers were required to partner with a provider to obtain numbers. With almost all VoIP providers receiving their numbers from Competitive LECs, reports prior to this Order attributed VoIP numbers to Competitive LECs. Carriers report on numbering resources in the following six categories: 13 • Assigned: Numbers in use by an end user. • Intermediate: Numbers made available by one carrier for use by another. • Reserved: Numbers held out of use at the request of an end user for future use. • Aging: Numbers held out of use after the end user discontinues service. • Administrative: Numbers in use by service providers for network management purposes. • Available: Numbers available for assignment to end users. Some carriers receive telephone numbers from other carriers, as opposed to directly from the NANPA. When this occurs, the receiver is required to report utilization data for those numbers, and to mark those numbers as having been received from other carriers.14 In the past, when numbers were transferred from an Incumbent LEC to another carrier, they were classified as “assigned” because they could not be used elsewhere in the Incumbent LEC’s own system. According to the Commission’s standardized definitions such numbers are “intermediate” numbers, yet some large carriers have not reported these numbers as such. Because in some cases we were unable to match submissions that report intermediate numbers with submissions that report numbers as being received from another carrier, we created filters to ensure that numbers were not double counted.
10 See 47 U.S.C. § 153(37). 11 Carriers classified themselves in a variety of ways on their NRUF forms. Except for interexchange carriers, each carrier type was aggregated into one of five categories for the purposes of this report. Interexchange carriers reported data for area codes 500 and 900, which are summarized in Table 10 of this report. Therefore, there was no need to classify interexchange carriers as one of the five carrier types listed above. Also, carriers may provide multiple types of services but may only indicate their primary line of business on the NRUF form. Only small carriers seem to do this, so the effects of this misclassification should be minor. 12 Numbering Policies for Modern Communications, et al., Report and Order, WC Docket No. 13-97, et al., 30 FCC Rcd 6839 (2015) (Direct Access Order). 13 Reserved numbers can be held for up to 180 days. Aging numbers may be aged no less than 45 days and no more than 90 days for residential customers and 365 days for commercial customers. For precise definitions of these categories, see 47 C.F.R. § 52.15. 14 This means that sometimes more than one carrier can report utilization data for the same thousands-block (or NXX). The NRUF form contains separate sections for reporting utilization data for numbers received from another carrier and numbers received directly from the NANPA. Some carriers that receive numbers only from other carriers use the incorrect section of the form, however, so within the database it can appear that more than one carrier reported data for the same block of numbers.
U.S. Federal Communications Commission 3 Numbering Resource Utilization in the United States
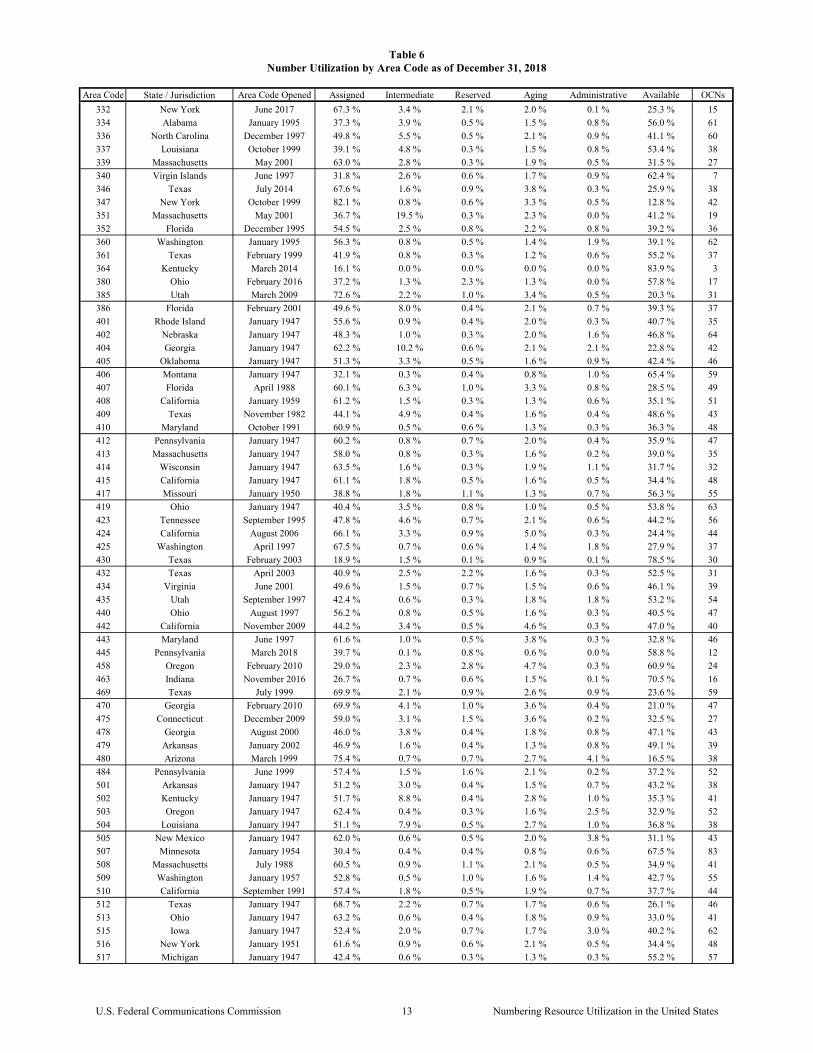
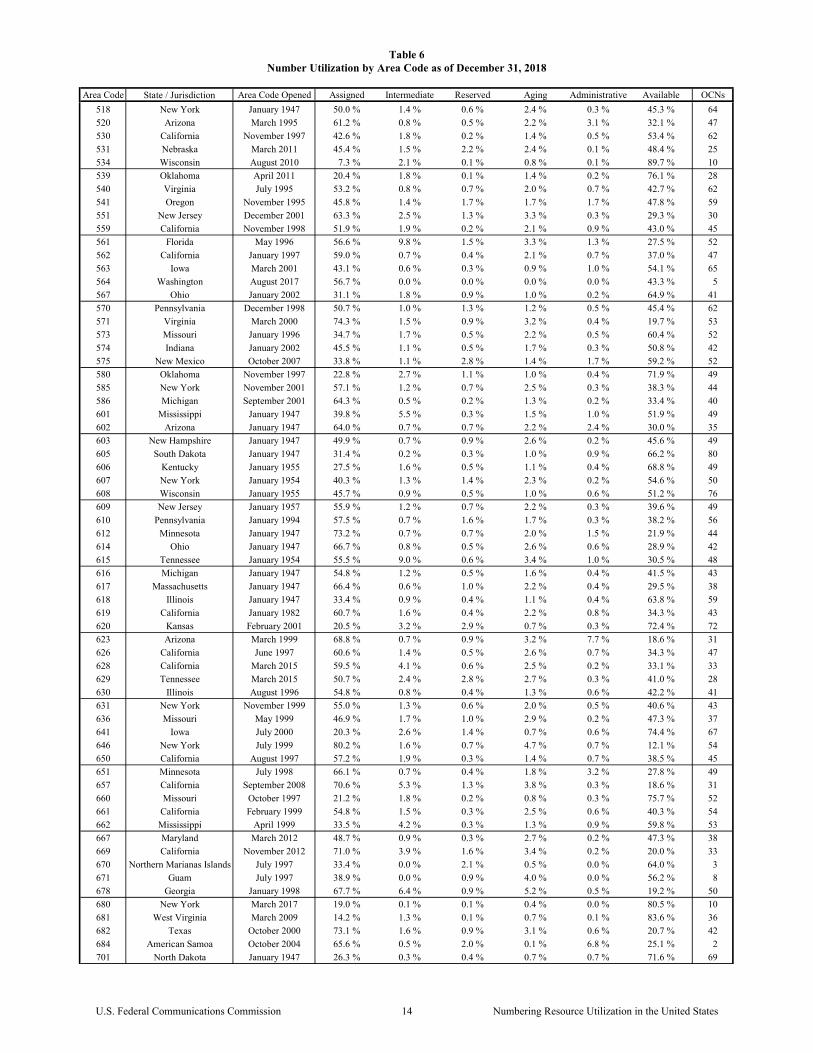
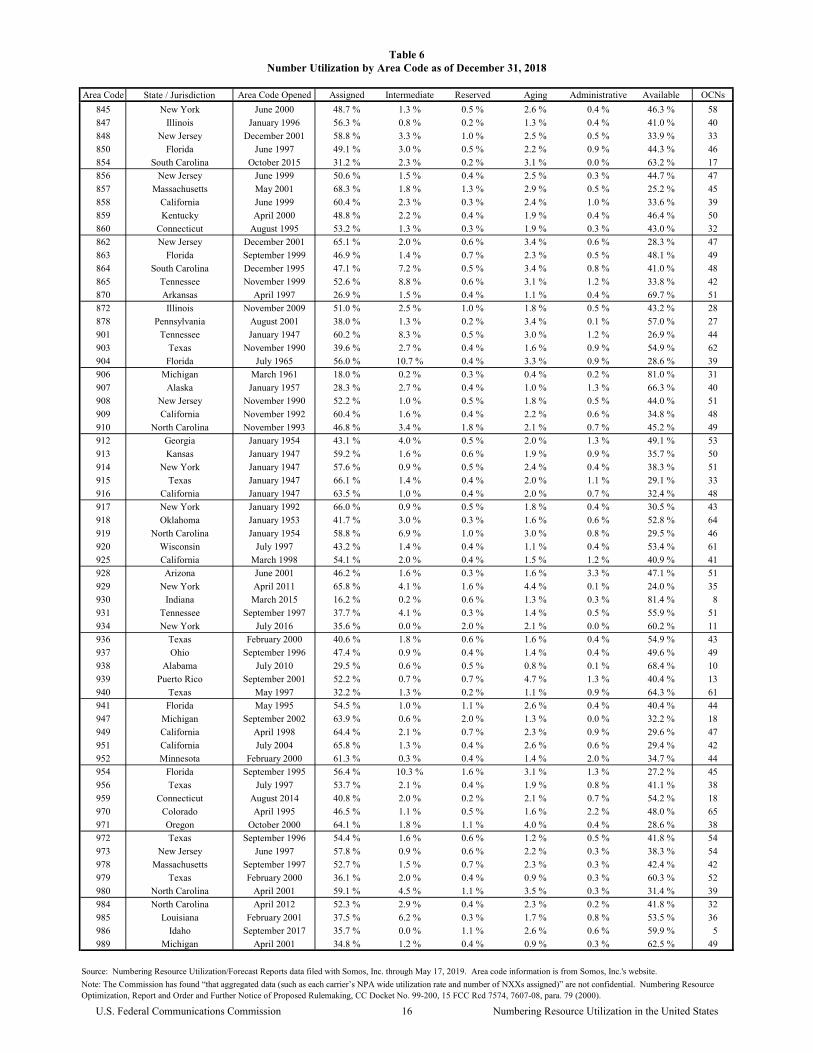
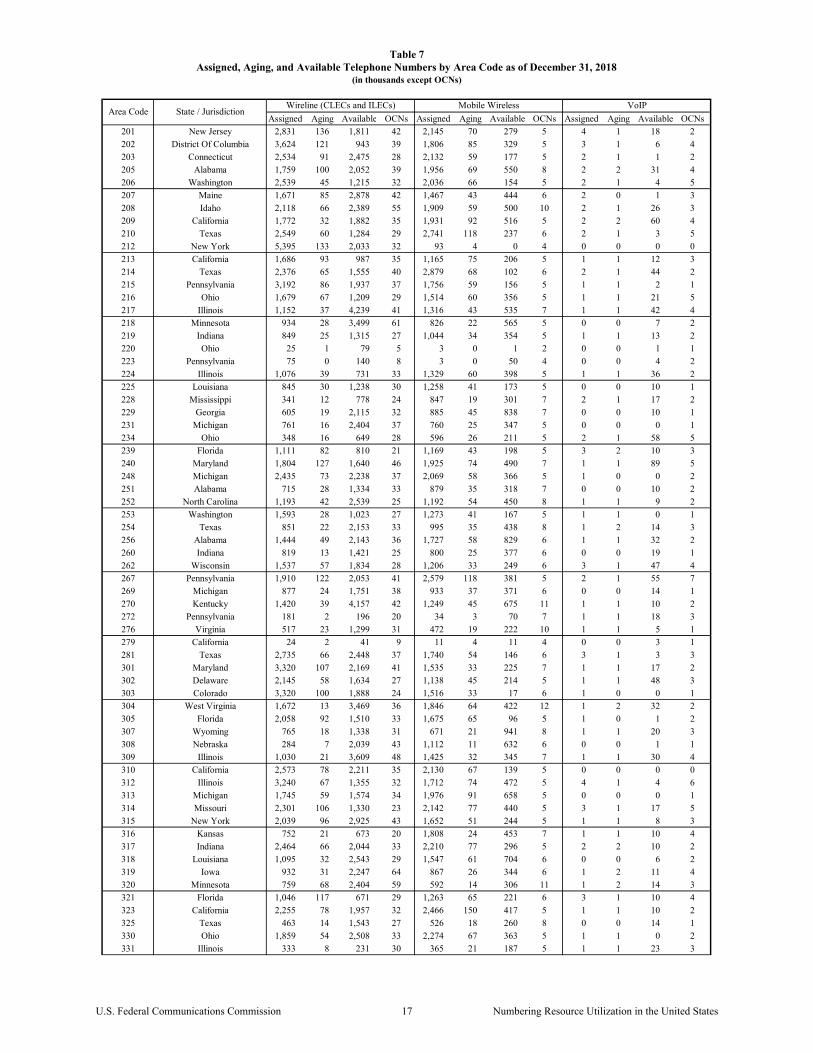
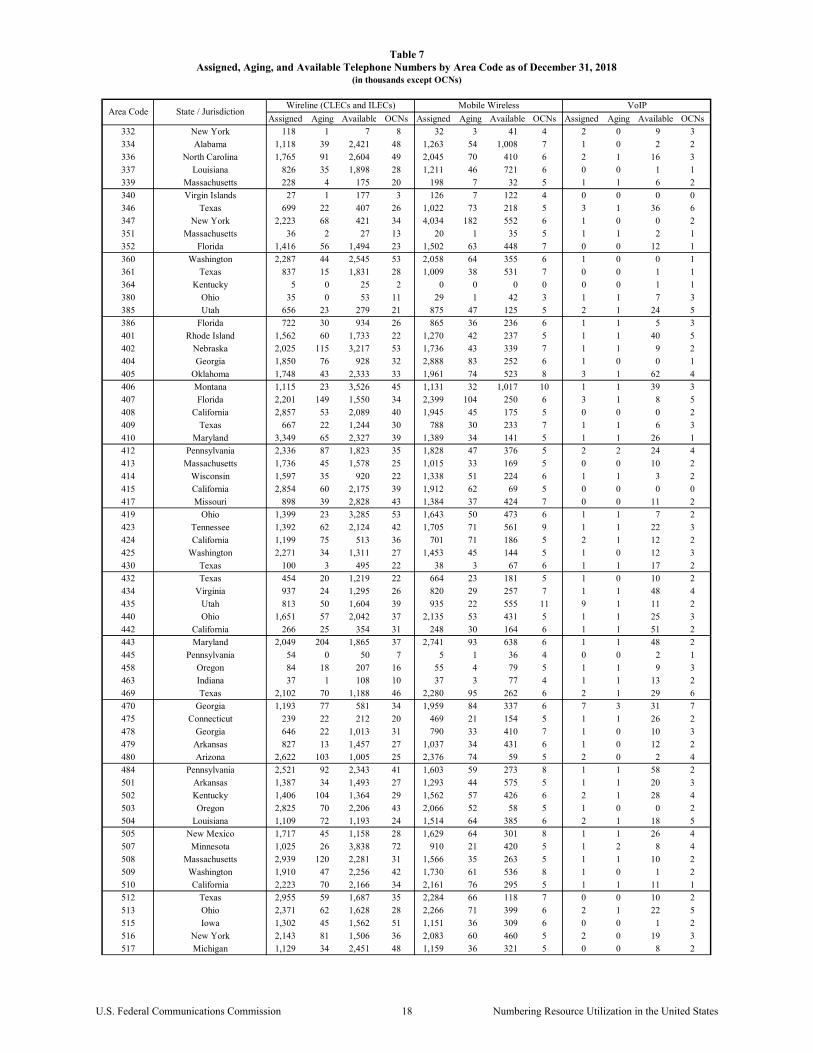
Where a Regional Bell Operating Company (RBOC) acquired a carrier with Competitive LEC services in the RBOC's operating region, the numbering resources of the acquired Competitive LEC in the RBOC's operating region were counted as Incumbent LEC resources. Where the acquired Competitive LEC provides services outside of the acquirer's operating region, the numbering resources are treated as Competitive LEC resources. Analysis and Results Table 1 shows the quantity of telephone numbers and NXXs reported by telecommunications carriers for each of the six categories listed above, as well as the total. Note that the number of unique NXXs for each carrier type does not add up to the total number of unique NXXs.15 This occurs when multiple carriers report data for the same numbering resource. In addition, some carriers reported at the thousands-block level and other carriers reported at the NXX level for the same NXX. Table 2 presents statistics for numbers where carriers report the utilization information at the thousands-block level. Only carriers that do not meet the statutory definition of a rural carrier are required to report in this manner. Table 3 presents statistics for rural carriers, which are required to report only at the NXX level.16 As might be expected, overall utilization rates are lower in rural areas than in more urban areas. Table 4 shows utilization statistics on a state-by-state basis. States that are relatively rural and have low population densities have a lower percentage of assigned numbers than more urban, populous states. Again, carriers report only numbers that have been assigned to them, so the quantity of available numbers does not include NXXs not yet assigned to a carrier. Table 5 shows the number of Operating Company Numbers (OCNs) that reported telephone number utilization data for each state. Carriers are required to report their NRUF data at the OCN level.17 Carriers typically obtain one or more OCNs for each state in which they operate. Table 6 shows utilization statistics by area code. The table also shows the total number of OCNs reporting each area code. Since carriers report only numbers assigned to them, the quantity of available numbers does not include any NXXs in the state not yet assigned to a carrier. Table 7 shows assigned, aging, and available numbers for wireline carriers (Incumbent LECs and Competitive LECs), mobile wireless carriers, and VoIP providers, by area code. The information in Table 7 is useful for at least two reasons. First, Table 7 provides some indication of the number of working telephone lines in each area code. The number of working lines per area code cannot be perfectly divined from this information, because the relationship between lines and numbers is not always one-to-one. Although mobile wireless carriers typically assign one geographic telephone number to each subscriber, wireline carriers sometimes do not. Some wireline customers want multiple telephone numbers associated with a smaller number of lines, for example, when the customer has a private branch exchange. Other customers, especially those expecting many inbound calls, such as to a help line, may want a single telephone number that serves many lines. Thus, the quantity of telephone numbers in an area code provides only a rough guide to the number of lines in service in each area code.
15 In some instances, more than one carrier reported numbering utilization data for the same NPA-NXX. Tables 1-3 show the numbers of unique NPA-NXXs reported by each carrier type and by the industry as a whole. 16 See First NRO Order, 15 FCC Rcd at 7604-05, para. 71. A small number of rural carriers may operate in areas with pooling. As all carriers in pooling areas are required to report at the thousands-block level, rural carriers in pooling areas, if any, should be included in Table 2 rather than Table 3. 17 See First NRO Order, 15 FCC Rcd at 7594, para. 41. Carriers obtain OCNs from the National Exchange Carrier Association.
U.S. Federal Communications Commission 4 Numbering Resource Utilization in the United States
Second, the information in Table 7 provides the only information the FCC collects for examining churn.18 After a customer disconnects from a carrier’s network and chooses not to port the number to another carrier, that carrier will hold that number out of circulation (“age” the number) for up to ninety days if the customer was a residential subscriber, and up to one year if the customer was a business subscriber. Therefore, the quantity of aging numbers gives some indication of the number of customers that have disconnected in the previous three months to a year. Aging numbers, however, do not give a perfect indication of churn. Aside from not measuring numbers ported to another carrier, not all carriers age their numbers for the full time allowed. Where carriers have limited numbers and cannot immediately obtain new numbers from the NANPA or PA because of area code rationing, they may assign telephone numbers that have not been aged for the full time that the state regulatory commissions have prescribed. (Thousands-block pooling alleviates this problem by making more numbering resources available.) Therefore, at any given time, the number of aging numbers is likely smaller than the number of customers that have changed providers or disconnected service. Table 8 focuses on telephone number pooling. It shows the number of thousands-blocks carriers received from the PA, the total number of thousands-blocks in telephone rate centers where pooling exists,19 and the percentage of those thousands-blocks that are pooled. A thousands-block is potentially poolable when 90% or more of the numbers are classified as available for assignment. Pooling is required in the top 100 Metropolitan Statistical Areas (MSAs).20 Pooling also occurs in areas where a state regulatory commission has exercised delegated authority to require pooling and where carriers have voluntarily implemented pooling.21 The Commission established an initial national roll-out schedule for thousands-block number pooling for wireline carriers – completed in December 200322 – and required most mobile wireless telephony carriers to participate in that schedule starting in August 2003.23 Table 9 examines the efficacy of thousands-block pooling by showing the utilization of the thousands-blocks that were distributed by the PA and the utilization rate that would have resulted had whole NXXs been issued.24 Overall, the utilization rate for numbers in pooled blocks was 56.1%. If whole NXXs had been issued instead of individual thousands-blocks, utilization within those blocks would have been 28.2%. Another way of measuring the benefit of pooling is examining the quantity of telephone numbers saved through pooling. With pooling, 926 million telephone numbers were distributed to carriers in pooling areas. Had there been no pooling, over 1.8 billion telephone numbers would have been distributed. More than 900 million telephone numbers have been saved through thousands-block pooling.
18 Churn is the rate at which customers change carriers or disconnect service. 19 A rate center is a geographic area used to determine distances and prices for local and long-distance calls. 20 The composition of MSAs may change over time. If a rate center is part of a top 100 MSA at any time after 1990, then the FCC generally requires number pooling. See Fourth NRO Order, 18 FCC Rcd at 12473, para. 2. 21Thousands-block pooling now exists in some portion of every state. See National Pooling Administrator, Reports – Block Report by Region available at https://www.nationalpooling.com/reports/block-by-region/index.htm. See generally WC Docket No. 07-118 (orders adopting rules on number pooling). 22 See The Common Carrier Bureau Announces The First Quarter Schedule For National Thousands-Block Number Pooling, CC Docket No. 99-200, Public Notice, 17 FCC Rcd 103 (2001). See also Numbering Resource Optimization, CC Docket No. 99-200, Order, 17 FCC Rcd 7347 (2002). 23 See Fourth NRO Order, 18 FCC Rcd at 12473, para 1; 68 F.R, 43009, July 21, 2003. Thus, the Commission required wireless telephone carriers to participate in thousands-block number pooling (starting on August 20, 2003) somewhat before they were required to begin deploying local number portability (by November 24, 2003). 24 Calculating the utilization rate had whole NXXs been issued was a 4-step process: 1) the number of thousands-blocks that a carrier held in a rate center was determined; 2) that number was rounded up to the next ten, which is the number of thousands-blocks the carrier would have received if it had received whole NXXs; 3) the number in step 2 was multiplied by 1,000 to calculate the total quantity of telephone numbers the carrier would have had in the rate center; and 4) the number of telephone numbers that the carrier actually has in that rate center is then subtracted from the quantity calculated in step 3.
U.S. Federal Communications Commission 5 Numbering Resource Utilization in the United States
Table 10 shows utilization data for specialized non-geographic area codes. Originally, area code 500 was used for “follow me” service, which, among other things, can be used to route an incoming call to different phone numbers, depending on the time of day. Recently, more non-geographic area codes in the 500 series have been opened and numbers within them are often used for machine-to-machine communications, such as for alarm systems. 25 Area code 900 is used for information services where the caller is not charged long-distance rates set by the caller’s long-distance carrier, but usually is charged much higher prices that are preset by the call’s recipient.
Table 11 focuses on NPA-NXX assignment information. There are three different databases that contain sources of NPA-NXX assignment information: the NANPA’s NRUF database, the NANPA’s NANP Administration System (NAS) database of NPA-NXX assignments, and the Local Exchange Routing Guide (LERG).26 For a variety of reasons, the databases are not identical. Timing is a large factor in the differences. For instance, during an area code split, a carrier will maintain both the old and new NPA-NXXs in its systems during the phase called permissive dialing.27 During permissive dialing, some carriers report utilization data for both the old and the new NPA-NXXs. After permissive dialing ends, the carrier should immediately remove the old NPA-NXXs from the LERG and its own systems. The NANPA also updates its information as well. Some carriers may not remove the old NPA-NXXs from their systems promptly after permissive dialing ends and may therefore report utilization data on both the old and the new NPA-NXXs. Also, carriers sometimes delay updating the LERG after an NPA-NXX has been removed from their switch or when the carrier has given the NPA-NXX back to the NANPA. Consequently, the NRUF database, the NANPA assignment database, and the LERG may not be identical. Table 11 shows the number of NPA-NXXs that appear in the three databases.
Chart 1 shows average utilization rates as a function of the number of thousands-blocks held by carriers of different types within a local geographic area.28 We used rate centers as our local geographic area because thousands-blocks are assigned to carriers on a rate-center basis. Carriers serving densely populated areas may need more than a single thousands-block to provide service. In these densely populated areas, carriers should generally be able to achieve higher utilization rates than carriers serving less densely populated areas, where one thousands-block (or in many rural areas, an NXX) may be used to serve just a few customers.
For ease of comparison, Chart 1 plots utilization rates only when there were 1,000 or fewer thousands-blocks in a rate center. While some Incumbent LECs reported more than 1,000 unique thousands-blocks in a single rate center, the average utilization rates in these rate centers were the same as those where the carrier has just fewer than 1,000 thousands-blocks. In some cases Competitive LECs had many thousands-blocks in a single rate center. This is likely because some Competitive LECs provide service to unified messaging services, such as
25 For more information, see ATIS Non-Geographic 5XX-NXX Code Assignment Guidelines at https://access.atis.org/apps/group_public/download.php/51937/ATIS-0300052%282020-03%29.zip. Also, see 5XX-NXX Assignments at https://nationalnanpa.com/number_resource_info/5XX_codes.html. 26 The NANPA’s assignment information can be found online: http://www.nanpa.com/reports/reports_cocodes_assign.html. The analysis in Table 11 examines only those codes that NANPA marked “assigned” (i.e., this study does not examine those codes marked “protected”, “reserved”, “unassignable”, or “vacant”). The LERG is published monthly by Telcordia Technologies d/b/a iconectiv. 27 During permissive dialing, a phone number may be called by using either the old or the new NPA. 28 The points in Chart 1 were calculated using a three-step process. First, thousands-blocks were grouped depending on the number of thousands-blocks held by a carrier within a rate center. Second, the number of thousands-blocks held in a rate center was rounded to the nearest twenty, to help protect the confidentiality of the data. Third, the average utilization rates were calculated for each of the groups (i.e., from the group of 10 thousands-blocks per rate center through the group of 1,000 thousands-blocks per rate center). For example, for all instances where a carrier reported from 10 to 29 (which round to 20) thousands-blocks in a rate center, the average utilization rate was calculated. A similar average utilization rate was calculated for all instances where, for a carrier in a rate center, the number of thousands-blocks in a rate center was rounded to 40, 60, and so on through 1,000. To preserve carrier confidentiality, some data points have been collapsed into a single data point. For example, if there were only two companies with 350 thousands-blocks in a rate center, and another two companies with 360 thousands-blocks in a rate center, those data points were collapsed. This way, no carrier-specific data are released.
U.S. Federal Communications Commission 6 Numbering Resource Utilization in the United States
e-fax.29 These services use large quantities of numbers.30 Also, before the Direct Access Order allowed them to obtain numbers directly from the NANPA or PA, many VoIP providers obtained telephone numbers by partnering with a local exchange carrier through a commercial arrangement. Not all of these numbers have been ported to the VoIP provider, so those numbers remain with the LEC.
Table 12 shows the percentage of numbers that have been assigned to end users over time. The utilization rate for Incumbent LECs is slowly declining and mobile wireless and Competitive LEC utilization rates are generally increasing. The utilization rate for paging services continues to drop.
Table 13 shows, on a semi-annual basis, the number of NXX assignments made by the NANPA, the number of NXXs that have been returned to the NANPA, and the number of net NXX assignments to carriers. The table shows that fewer NXXs generally are being issued each quarter, and that carriers continue to return unneeded NPA-NXXs to the NANPA for reassignment.
Tables 14 through 20 display information on telephone number porting. All telephone number porting information in this report is derived from the local number portability database, which was designed solely for routing calls.31 There are several reasons the quantity of ported numbers in the database at any given time does not equal the sum of numbers ported in prior months. When consumers who have already ported their telephone numbers do so again, the porting database retains only the most recent porting activity for those numbers.Consumers can also port their numbers back to the original carrier, which are counted as ports even though the numbers drop out of the porting database.32 Also, carriers sometimes port blocks of numbers to other carriers before reassigning them in the LERG. Once the numbers are reassigned, they can be dropped from the porting database.
Table 14 shows, on a semi-annual basis, the quantities of telephone numbers that have been ported since wireless porting started on November 24, 2003. The table shows that most porting activity is intramodal, meaning numbers are usually ported to providers of the same service type. Table 15 shows the quantity of telephone numbers in the porting database over time. Table 16 is based on ports currently in the porting database and shows the period in which the numbers were most recently ported. In June 2013, a technical trial began allowing VoIP providers to obtain numbering resources directly from the NANPA and PA.33 Prior to this trial, any ports to or from a VoIP provider would appear as ports to or from a wireline carrier, as most VoIP providers obtained their numbers from a wireline carrier.
29 Unified messaging services allow end users to receive multiple types of messages (such as voice mail and faxes) at one phone number. Typically, these messages are then digitized and e-mailed to the end user. Because the end user does not need to answer the call personally, the messages can be sent to any phone number in the United States. Thus, unified messaging service providers can operate efficiently by obtaining many thousands-blocks in a single rate center. 30 Carriers assigning numbers to unified messaging services are instructed to report numbers as “intermediate” until the numbers are assigned by the unified messaging service providers to end users. Some carriers have assigned large quantities of numbers to unified messaging services but may not have received information back from the unified messaging company as to whether those numbers had been assigned to end users. This may explain why some carriers reported dozens of NXXs in a single rate center yet classified all those numbers as intermediate rather than assigned. 31 The current Local Number Portability Administrator is Telcordia Technologies d/b/a iconectiv. Telcordia Technologies, Inc. Petition to Reform Amendment 57 and to Order a Competitive Bidding Process for Number Portability Administration, et al., WC Docket Nos. 07-149, 09-109, 95-116, Order, 31 FCC Rcd 8406 (2016). 32 When a consumer using a ported number discontinues service entirely, the number drops out of the porting database and is returned to the original carrier. 33 Numbering Policies for Modern Communications; IP-Enabled Services; Telephone Number Requirements for IP-Enabled Services Providers; Telephone Number Portability; Developing a Unified Intercarrier Compensation Regime; Connect America Fund; Numbering Resource Optimization; Petition of Vonage Holdings Corp. for Limited Waiver of Section 52.15(f)(2)(i) of the Commission’s Rules Regarding Access to Numbering Resources, WC Docket Nos. 13-97, 04-36, 07-243, 10-90, CC Docket Nos. 95-116, 01-92, Order, 28 FCC Rcd 8889, para. 1 (WCB 2013).
U.S. Federal Communications Commission 7 Numbering Resource Utilization in the United States
Tables 17 through 19 show the number of ports in the database along with the number of carriers involved in porting. The data are presented on a state-by-state basis with each table representing a carrier type: wireline, wireless, and VoIP. Paging carriers are not required to port numbers. Table 20 shows the percentage of assigned numbers that were ported. Customers may port numbers multiple times, and in doing so, change the nature of their service (wireline versus wireless versus VoIP). As a result, there are two possible methods of determining whether a number was ported from a wireline carrier. The first method is to use the type of carrier that most recently ported the number away from itself, and the second is to determine which type of carrier originally held the number. The choice of methodologies depends on what is being measured. Because it is useful to know porting patterns for numbers as they are currently being used, Tables 14 and 20 use the porting carrier’s type to establish whether a wireline or wireless number is being ported. For the rest of the tables, the original carrier’s type is used to determine the porting carrier’s type. This is done so that the number of wireless subscribers can be better determined.34 For instance, to properly calculate the number of wireless units at a particular point in time using telephone number data, one can add the quantity of wireless assigned numbers as reported on NRUF forms to the number of ports to wireless carriers and subtract the number of ports from wireless carriers.35 Tables 21 through 28 show information about toll-free numbers in the North American Numbering Plan. AT&T introduced toll-free service in 1967. The Commission changed procedures for routing toll-free calls on May 1, 1993 to make toll-free numbers "portable." This change enabled customers to switch service providers yet retain their toll-free numbers. The quantity of assigned toll-free numbers grew rapidly, and new toll-free calling codes were opened to meet the demand. In March 1996, calling code 888 was placed into service. The third toll-free calling code (877) went into effect April 4, 1998, and the fourth toll-free calling code (866) went into effect July 29, 2000. The fifth toll-free calling code (855) went into effect October 10, 2010, the sixth toll-free calling code (844) went into effect December 7, 2013 and the seventh toll-free calling code (833) went into effect June 3, 2017. Tables 21 through 28 show the growth of each individual toll-free code over the past decade: 800, 888, 877, 866, 855, 844, and 833, respectively. Table 29 shows the current list of area codes, the state or territory they serve and the month the code was opened. Table 30 shows area code assignments since January 2005, along with the month the code was added and the code that served the area previously.
34 According to NRUF rules, a number that is ported to another carrier is classified as assigned. To avoid double counting, the recipient of the ported number does not report ported numbers in NRUF. See 47 C.F.R. § 52.15 (f)(1)(v). 35 If carriers assign more than one number to a mobile wireless unit, this method will slightly overestimate the number of wireless units.
U.S. Federal Communications Commission 8 Numbering Resource Utilization in the United States
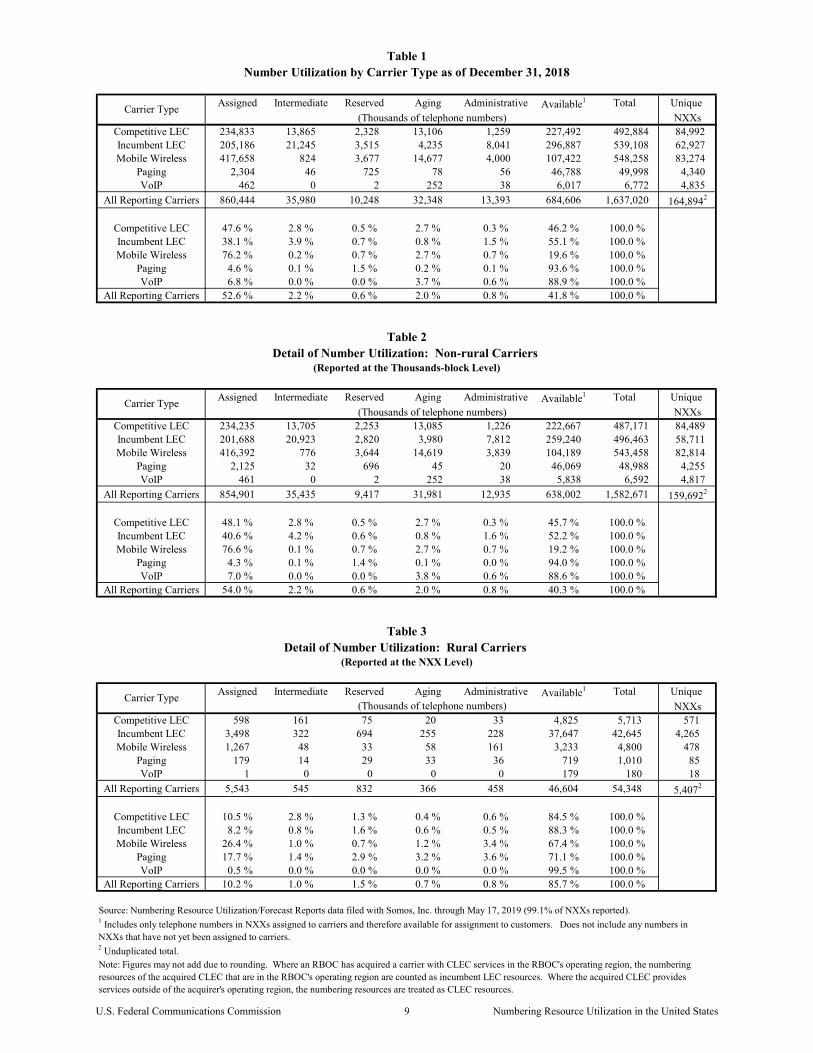
Assigned Intermediate Reserved Aging Administrative Available1 Total Unique
(Thousands of telephone numbers) NXXsCompetitive LEC 234,833 13,865 2,328 13,106 1,259 227,492 492,884 84,992Incumbent LEC 205,186 21,245 3,515 4,235 8,041 296,887 539,108 62,927Mobile Wireless 417,658 824 3,677 14,677 4,000 107,422 548,258 83,274
Paging 2,304 46 725 78 56 46,788 49,998 4,340VoIP 462 0 2 252 38 6,017 6,772 4,835
All Reporting Carriers 860,444 35,980 10,248 32,348 13,393 684,606 1,637,020 164,8942
Competitive LEC 47.6 % 2.8 % 0.5 % 2.7 % 0.3 % 46.2 % 100.0 %Incumbent LEC 38.1 % 3.9 % 0.7 % 0.8 % 1.5 % 55.1 % 100.0 %Mobile Wireless 76.2 % 0.2 % 0.7 % 2.7 % 0.7 % 19.6 % 100.0 %
Paging 4.6 % 0.1 % 1.5 % 0.2 % 0.1 % 93.6 % 100.0 %VoIP 6.8 % 0.0 % 0.0 % 3.7 % 0.6 % 88.9 % 100.0 %
All Reporting Carriers 52.6 % 2.2 % 0.6 % 2.0 % 0.8 % 41.8 % 100.0 %
Assigned Intermediate Reserved Aging Administrative Available1 Total Unique
(Thousands of telephone numbers) NXXsCompetitive LEC 234,235 13,705 2,253 13,085 1,226 222,667 487,171 84,489Incumbent LEC 201,688 20,923 2,820 3,980 7,812 259,240 496,463 58,711Mobile Wireless 416,392 776 3,644 14,619 3,839 104,189 543,458 82,814
Paging 2,125 32 696 45 20 46,069 48,988 4,255VoIP 461 0 2 252 38 5,838 6,592 4,817
All Reporting Carriers 854,901 35,435 9,417 31,981 12,935 638,002 1,582,671 159,6922
Competitive LEC 48.1 % 2.8 % 0.5 % 2.7 % 0.3 % 45.7 % 100.0 %Incumbent LEC 40.6 % 4.2 % 0.6 % 0.8 % 1.6 % 52.2 % 100.0 %Mobile Wireless 76.6 % 0.1 % 0.7 % 2.7 % 0.7 % 19.2 % 100.0 %
Paging 4.3 % 0.1 % 1.4 % 0.1 % 0.0 % 94.0 % 100.0 %VoIP 7.0 % 0.0 % 0.0 % 3.8 % 0.6 % 88.6 % 100.0 %
All Reporting Carriers 54.0 % 2.2 % 0.6 % 2.0 % 0.8 % 40.3 % 100.0 %
Assigned Intermediate Reserved Aging Administrative Available1 Total Unique
NXXsCompetitive LEC 598 161 75 20 33 4,825 5,713 571Incumbent LEC 3,498 322 694 255 228 37,647 42,645 4,265Mobile Wireless 1,267 48 33 58 161 3,233 4,800 478
Paging 179 14 29 33 36 719 1,010 85VoIP 1 0 0 0 0 179 180 18
All Reporting Carriers 5,543 545 832 366 458 46,604 54,348 5,4072
Competitive LEC 10.5 % 2.8 % 1.3 % 0.4 % 0.6 % 84.5 % 100.0 %Incumbent LEC 8.2 % 0.8 % 1.6 % 0.6 % 0.5 % 88.3 % 100.0 %Mobile Wireless 26.4 % 1.0 % 0.7 % 1.2 % 3.4 % 67.4 % 100.0 %
Paging 17.7 % 1.4 % 2.9 % 3.2 % 3.6 % 71.1 % 100.0 %VoIP 0.5 % 0.0 % 0.0 % 0.0 % 0.0 % 99.5 % 100.0 %
All Reporting Carriers 10.2 % 1.0 % 1.5 % 0.7 % 0.8 % 85.7 % 100.0 %
Note: Figures may not add due to rounding. Where an RBOC has acquired a carrier with CLEC services in the RBOC's operating region, the numbering resources of the acquired CLEC that are in the RBOC's operating region are counted as incumbent LEC resources. Where the acquired CLEC provides services outside of the acquirer's operating region, the numbering resources are treated as CLEC resources.
1 Includes only telephone numbers in NXXs assigned to carriers and therefore available for assignment to customers. Does not include any numbers in NXXs that have not yet been assigned to carriers.
(Thousands of telephone numbers)
Detail of Number Utilization: Rural Carriers
2 Unduplicated total.
(Reported at the NXX Level)
Source: Numbering Resource Utilization/Forecast Reports data filed with Somos, Inc. through May 17, 2019 (99.1% of NXXs reported).
Carrier Type
Number Utilization by Carrier Type as of December 31, 2018Table 1
Table 2Detail of Number Utilization: Non-rural Carriers
Table 3
(Reported at the Thousands-block Level)
Carrier Type
Carrier Type
U.S. Federal Communications Commission 9 Numbering Resource Utilization in the United States
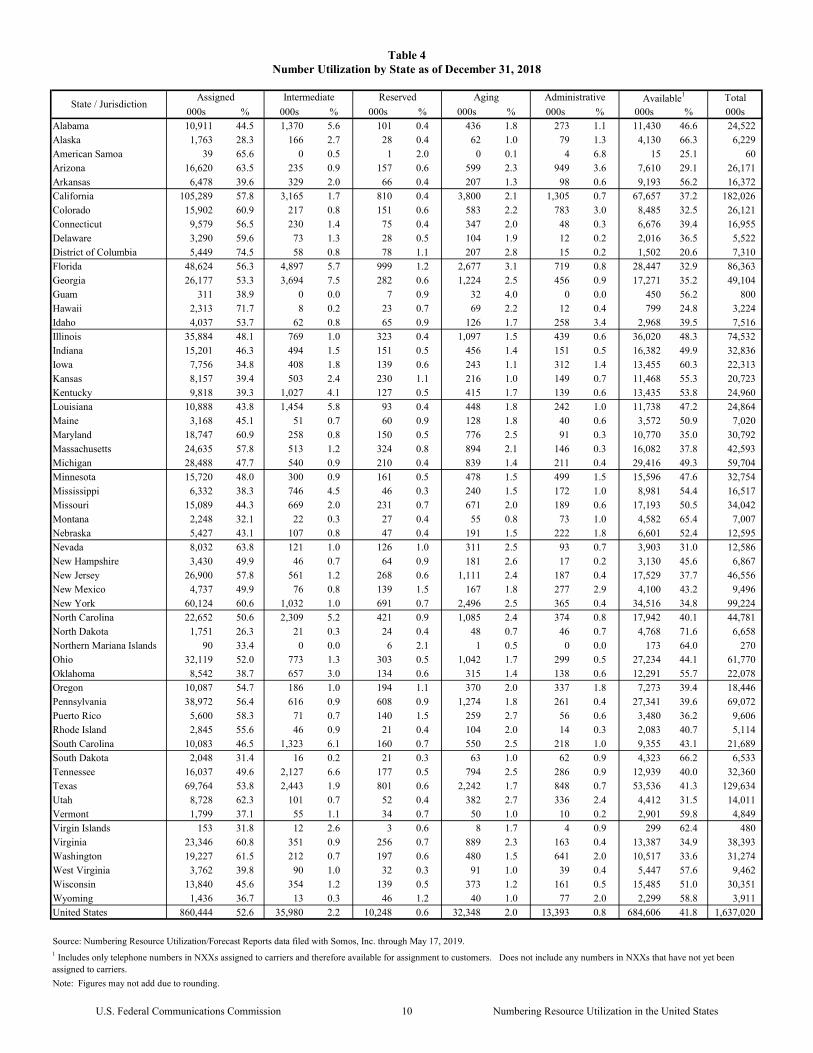
Total000s % 000s % 000s % 000s % 000s % 000s % 000s
Alabama 10,911 44.5 1,370 5.6 101 0.4 436 1.8 273 1.1 11,430 46.6 24,522Alaska 1,763 28.3 166 2.7 28 0.4 62 1.0 79 1.3 4,130 66.3 6,229American Samoa 39 65.6 0 0.5 1 2.0 0 0.1 4 6.8 15 25.1 60Arizona 16,620 63.5 235 0.9 157 0.6 599 2.3 949 3.6 7,610 29.1 26,171Arkansas 6,478 39.6 329 2.0 66 0.4 207 1.3 98 0.6 9,193 56.2 16,372California 105,289 57.8 3,165 1.7 810 0.4 3,800 2.1 1,305 0.7 67,657 37.2 182,026Colorado 15,902 60.9 217 0.8 151 0.6 583 2.2 783 3.0 8,485 32.5 26,121Connecticut 9,579 56.5 230 1.4 75 0.4 347 2.0 48 0.3 6,676 39.4 16,955Delaware 3,290 59.6 73 1.3 28 0.5 104 1.9 12 0.2 2,016 36.5 5,522District of Columbia 5,449 74.5 58 0.8 78 1.1 207 2.8 15 0.2 1,502 20.6 7,310Florida 48,624 56.3 4,897 5.7 999 1.2 2,677 3.1 719 0.8 28,447 32.9 86,363Georgia 26,177 53.3 3,694 7.5 282 0.6 1,224 2.5 456 0.9 17,271 35.2 49,104Guam 311 38.9 0 0.0 7 0.9 32 4.0 0 0.0 450 56.2 800Hawaii 2,313 71.7 8 0.2 23 0.7 69 2.2 12 0.4 799 24.8 3,224Idaho 4,037 53.7 62 0.8 65 0.9 126 1.7 258 3.4 2,968 39.5 7,516Illinois 35,884 48.1 769 1.0 323 0.4 1,097 1.5 439 0.6 36,020 48.3 74,532Indiana 15,201 46.3 494 1.5 151 0.5 456 1.4 151 0.5 16,382 49.9 32,836Iowa 7,756 34.8 408 1.8 139 0.6 243 1.1 312 1.4 13,455 60.3 22,313Kansas 8,157 39.4 503 2.4 230 1.1 216 1.0 149 0.7 11,468 55.3 20,723Kentucky 9,818 39.3 1,027 4.1 127 0.5 415 1.7 139 0.6 13,435 53.8 24,960Louisiana 10,888 43.8 1,454 5.8 93 0.4 448 1.8 242 1.0 11,738 47.2 24,864Maine 3,168 45.1 51 0.7 60 0.9 128 1.8 40 0.6 3,572 50.9 7,020Maryland 18,747 60.9 258 0.8 150 0.5 776 2.5 91 0.3 10,770 35.0 30,792Massachusetts 24,635 57.8 513 1.2 324 0.8 894 2.1 146 0.3 16,082 37.8 42,593Michigan 28,488 47.7 540 0.9 210 0.4 839 1.4 211 0.4 29,416 49.3 59,704Minnesota 15,720 48.0 300 0.9 161 0.5 478 1.5 499 1.5 15,596 47.6 32,754Mississippi 6,332 38.3 746 4.5 46 0.3 240 1.5 172 1.0 8,981 54.4 16,517Missouri 15,089 44.3 669 2.0 231 0.7 671 2.0 189 0.6 17,193 50.5 34,042Montana 2,248 32.1 22 0.3 27 0.4 55 0.8 73 1.0 4,582 65.4 7,007Nebraska 5,427 43.1 107 0.8 47 0.4 191 1.5 222 1.8 6,601 52.4 12,595Nevada 8,032 63.8 121 1.0 126 1.0 311 2.5 93 0.7 3,903 31.0 12,586New Hampshire 3,430 49.9 46 0.7 64 0.9 181 2.6 17 0.2 3,130 45.6 6,867New Jersey 26,900 57.8 561 1.2 268 0.6 1,111 2.4 187 0.4 17,529 37.7 46,556New Mexico 4,737 49.9 76 0.8 139 1.5 167 1.8 277 2.9 4,100 43.2 9,496New York 60,124 60.6 1,032 1.0 691 0.7 2,496 2.5 365 0.4 34,516 34.8 99,224North Carolina 22,652 50.6 2,309 5.2 421 0.9 1,085 2.4 374 0.8 17,942 40.1 44,781North Dakota 1,751 26.3 21 0.3 24 0.4 48 0.7 46 0.7 4,768 71.6 6,658Northern Mariana Islands 90 33.4 0 0.0 6 2.1 1 0.5 0 0.0 173 64.0 270Ohio 32,119 52.0 773 1.3 303 0.5 1,042 1.7 299 0.5 27,234 44.1 61,770Oklahoma 8,542 38.7 657 3.0 134 0.6 315 1.4 138 0.6 12,291 55.7 22,078Oregon 10,087 54.7 186 1.0 194 1.1 370 2.0 337 1.8 7,273 39.4 18,446Pennsylvania 38,972 56.4 616 0.9 608 0.9 1,274 1.8 261 0.4 27,341 39.6 69,072Puerto Rico 5,600 58.3 71 0.7 140 1.5 259 2.7 56 0.6 3,480 36.2 9,606Rhode Island 2,845 55.6 46 0.9 21 0.4 104 2.0 14 0.3 2,083 40.7 5,114South Carolina 10,083 46.5 1,323 6.1 160 0.7 550 2.5 218 1.0 9,355 43.1 21,689South Dakota 2,048 31.4 16 0.2 21 0.3 63 1.0 62 0.9 4,323 66.2 6,533Tennessee 16,037 49.6 2,127 6.6 177 0.5 794 2.5 286 0.9 12,939 40.0 32,360Texas 69,764 53.8 2,443 1.9 801 0.6 2,242 1.7 848 0.7 53,536 41.3 129,634Utah 8,728 62.3 101 0.7 52 0.4 382 2.7 336 2.4 4,412 31.5 14,011Vermont 1,799 37.1 55 1.1 34 0.7 50 1.0 10 0.2 2,901 59.8 4,849Virgin Islands 153 31.8 12 2.6 3 0.6 8 1.7 4 0.9 299 62.4 480Virginia 23,346 60.8 351 0.9 256 0.7 889 2.3 163 0.4 13,387 34.9 38,393Washington 19,227 61.5 212 0.7 197 0.6 480 1.5 641 2.0 10,517 33.6 31,274West Virginia 3,762 39.8 90 1.0 32 0.3 91 1.0 39 0.4 5,447 57.6 9,462Wisconsin 13,840 45.6 354 1.2 139 0.5 373 1.2 161 0.5 15,485 51.0 30,351Wyoming 1,436 36.7 13 0.3 46 1.2 40 1.0 77 2.0 2,299 58.8 3,911United States 860,444 52.6 35,980 2.2 10,248 0.6 32,348 2.0 13,393 0.8 684,606 41.8 1,637,020
Source: Numbering Resource Utilization/Forecast Reports data filed with Somos, Inc. through May 17, 2019.
Table 4Number Utilization by State as of December 31, 2018
Note: Figures may not add due to rounding.
State / JurisdictionAssigned Intermediate Reserved Aging Administrative Available1
1 Includes only telephone numbers in NXXs assigned to carriers and therefore available for assignment to customers. Does not include any numbers in NXXs that have not yet been assigned to carriers.
U.S. Federal Communications Commission 10 Numbering Resource Utilization in the United States
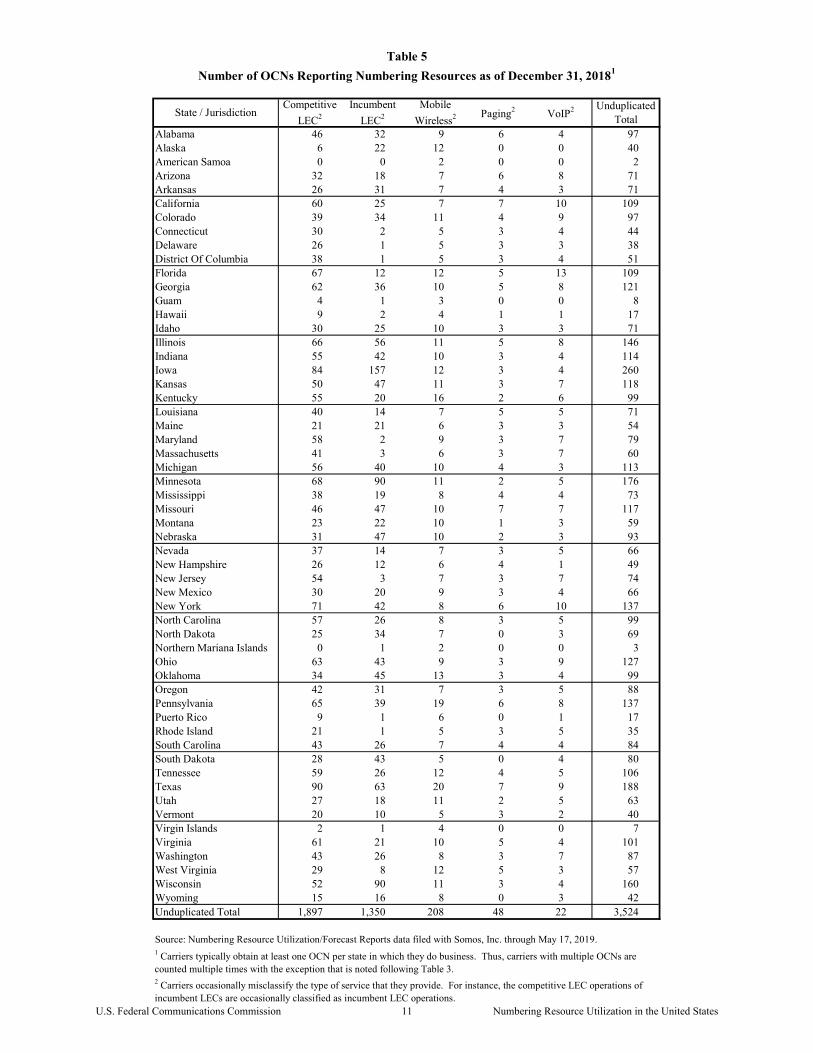
Alabama 46 32 9 6 4 97Alaska 6 22 12 0 0 40American Samoa 0 0 2 0 0 2Arizona 32 18 7 6 8 71Arkansas 26 31 7 4 3 71California 60 25 7 7 10 109Colorado 39 34 11 4 9 97Connecticut 30 2 5 3 4 44Delaware 26 1 5 3 3 38District Of Columbia 38 1 5 3 4 51Florida 67 12 12 5 13 109Georgia 62 36 10 5 8 121Guam 4 1 3 0 0 8Hawaii 9 2 4 1 1 17Idaho 30 25 10 3 3 71Illinois 66 56 11 5 8 146Indiana 55 42 10 3 4 114Iowa 84 157 12 3 4 260Kansas 50 47 11 3 7 118Kentucky 55 20 16 2 6 99Louisiana 40 14 7 5 5 71Maine 21 21 6 3 3 54Maryland 58 2 9 3 7 79Massachusetts 41 3 6 3 7 60Michigan 56 40 10 4 3 113Minnesota 68 90 11 2 5 176Mississippi 38 19 8 4 4 73Missouri 46 47 10 7 7 117Montana 23 22 10 1 3 59Nebraska 31 47 10 2 3 93Nevada 37 14 7 3 5 66New Hampshire 26 12 6 4 1 49New Jersey 54 3 7 3 7 74New Mexico 30 20 9 3 4 66New York 71 42 8 6 10 137North Carolina 57 26 8 3 5 99North Dakota 25 34 7 0 3 69Northern Mariana Islands 0 1 2 0 0 3Ohio 63 43 9 3 9 127Oklahoma 34 45 13 3 4 99Oregon 42 31 7 3 5 88Pennsylvania 65 39 19 6 8 137Puerto Rico 9 1 6 0 1 17Rhode Island 21 1 5 3 5 35South Carolina 43 26 7 4 4 84South Dakota 28 43 5 0 4 80Tennessee 59 26 12 4 5 106Texas 90 63 20 7 9 188Utah 27 18 11 2 5 63Vermont 20 10 5 3 2 40Virgin Islands 2 1 4 0 0 7Virginia 61 21 10 5 4 101Washington 43 26 8 3 7 87West Virginia 29 8 12 5 3 57Wisconsin 52 90 11 3 4 160Wyoming 15 16 8 0 3 42Unduplicated Total 1,897 1,350 208 48 22 3,524
Table 5
Number of OCNs Reporting Numbering Resources as of December 31, 20181
Source: Numbering Resource Utilization/Forecast Reports data filed with Somos, Inc. through May 17, 2019.
2 Carriers occasionally misclassify the type of service that they provide. For instance, the competitive LEC operations of incumbent LECs are occasionally classified as incumbent LEC operations.
State / JurisdictionCompetitive
LEC2
Incumbent
LEC2
Mobile
Wireless2 Paging2 VoIP2 Unduplicated Total
1 Carriers typically obtain at least one OCN per state in which they do business. Thus, carriers with multiple OCNs are counted multiple times with the exception that is noted following Table 3.
U.S. Federal Communications Commission 11 Numbering Resource Utilization in the United States
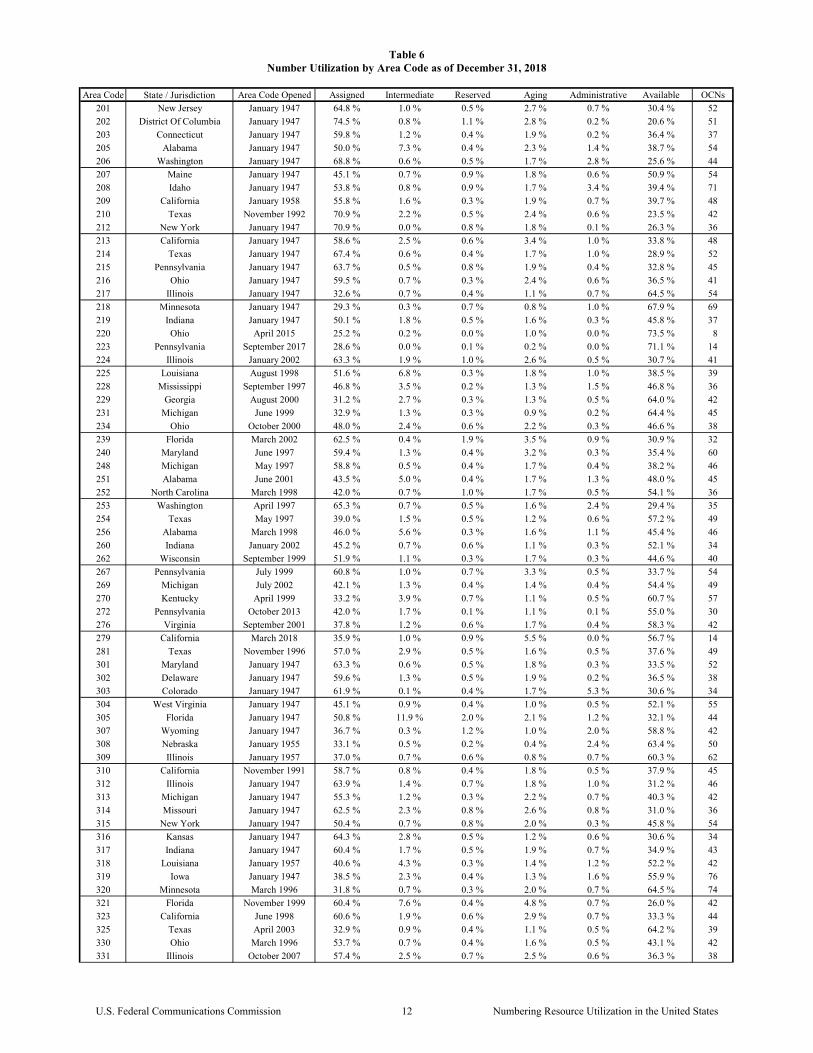
Area Code State / Jurisdiction Area Code Opened Assigned Intermediate Reserved Aging Administrative Available OCNs
201 New Jersey January 1947 64.8 % 1.0 % 0.5 % 2.7 % 0.7 % 30.4 % 52
202 District Of Columbia January 1947 74.5 % 0.8 % 1.1 % 2.8 % 0.2 % 20.6 % 51
203 Connecticut January 1947 59.8 % 1.2 % 0.4 % 1.9 % 0.2 % 36.4 % 37
205 Alabama January 1947 50.0 % 7.3 % 0.4 % 2.3 % 1.4 % 38.7 % 54
206 Washington January 1947 68.8 % 0.6 % 0.5 % 1.7 % 2.8 % 25.6 % 44
207 Maine January 1947 45.1 % 0.7 % 0.9 % 1.8 % 0.6 % 50.9 % 54
208 Idaho January 1947 53.8 % 0.8 % 0.9 % 1.7 % 3.4 % 39.4 % 71
209 California January 1958 55.8 % 1.6 % 0.3 % 1.9 % 0.7 % 39.7 % 48
210 Texas November 1992 70.9 % 2.2 % 0.5 % 2.4 % 0.6 % 23.5 % 42
212 New York January 1947 70.9 % 0.0 % 0.8 % 1.8 % 0.1 % 26.3 % 36
213 California January 1947 58.6 % 2.5 % 0.6 % 3.4 % 1.0 % 33.8 % 48
214 Texas January 1947 67.4 % 0.6 % 0.4 % 1.7 % 1.0 % 28.9 % 52
215 Pennsylvania January 1947 63.7 % 0.5 % 0.8 % 1.9 % 0.4 % 32.8 % 45
216 Ohio January 1947 59.5 % 0.7 % 0.3 % 2.4 % 0.6 % 36.5 % 41
217 Illinois January 1947 32.6 % 0.7 % 0.4 % 1.1 % 0.7 % 64.5 % 54
218 Minnesota January 1947 29.3 % 0.3 % 0.7 % 0.8 % 1.0 % 67.9 % 69
219 Indiana January 1947 50.1 % 1.8 % 0.5 % 1.6 % 0.3 % 45.8 % 37
220 Ohio April 2015 25.2 % 0.2 % 0.0 % 1.0 % 0.0 % 73.5 % 8
223 Pennsylvania September 2017 28.6 % 0.0 % 0.1 % 0.2 % 0.0 % 71.1 % 14
224 Illinois January 2002 63.3 % 1.9 % 1.0 % 2.6 % 0.5 % 30.7 % 41
225 Louisiana August 1998 51.6 % 6.8 % 0.3 % 1.8 % 1.0 % 38.5 % 39
228 Mississippi September 1997 46.8 % 3.5 % 0.2 % 1.3 % 1.5 % 46.8 % 36
229 Georgia August 2000 31.2 % 2.7 % 0.3 % 1.3 % 0.5 % 64.0 % 42
231 Michigan June 1999 32.9 % 1.3 % 0.3 % 0.9 % 0.2 % 64.4 % 45
234 Ohio October 2000 48.0 % 2.4 % 0.6 % 2.2 % 0.3 % 46.6 % 38
239 Florida March 2002 62.5 % 0.4 % 1.9 % 3.5 % 0.9 % 30.9 % 32
240 Maryland June 1997 59.4 % 1.3 % 0.4 % 3.2 % 0.3 % 35.4 % 60
248 Michigan May 1997 58.8 % 0.5 % 0.4 % 1.7 % 0.4 % 38.2 % 46
251 Alabama June 2001 43.5 % 5.0 % 0.4 % 1.7 % 1.3 % 48.0 % 45
252 North Carolina March 1998 42.0 % 0.7 % 1.0 % 1.7 % 0.5 % 54.1 % 36
253 Washington April 1997 65.3 % 0.7 % 0.5 % 1.6 % 2.4 % 29.4 % 35
254 Texas May 1997 39.0 % 1.5 % 0.5 % 1.2 % 0.6 % 57.2 % 49
256 Alabama March 1998 46.0 % 5.6 % 0.3 % 1.6 % 1.1 % 45.4 % 46
260 Indiana January 2002 45.2 % 0.7 % 0.6 % 1.1 % 0.3 % 52.1 % 34
262 Wisconsin September 1999 51.9 % 1.1 % 0.3 % 1.7 % 0.3 % 44.6 % 40
267 Pennsylvania July 1999 60.8 % 1.0 % 0.7 % 3.3 % 0.5 % 33.7 % 54
269 Michigan July 2002 42.1 % 1.3 % 0.4 % 1.4 % 0.4 % 54.4 % 49
270 Kentucky April 1999 33.2 % 3.9 % 0.7 % 1.1 % 0.5 % 60.7 % 57
272 Pennsylvania October 2013 42.0 % 1.7 % 0.1 % 1.1 % 0.1 % 55.0 % 30
276 Virginia September 2001 37.8 % 1.2 % 0.6 % 1.7 % 0.4 % 58.3 % 42
279 California March 2018 35.9 % 1.0 % 0.9 % 5.5 % 0.0 % 56.7 % 14
281 Texas November 1996 57.0 % 2.9 % 0.5 % 1.6 % 0.5 % 37.6 % 49
301 Maryland January 1947 63.3 % 0.6 % 0.5 % 1.8 % 0.3 % 33.5 % 52
302 Delaware January 1947 59.6 % 1.3 % 0.5 % 1.9 % 0.2 % 36.5 % 38
303 Colorado January 1947 61.9 % 0.1 % 0.4 % 1.7 % 5.3 % 30.6 % 34
304 West Virginia January 1947 45.1 % 0.9 % 0.4 % 1.0 % 0.5 % 52.1 % 55
305 Florida January 1947 50.8 % 11.9 % 2.0 % 2.1 % 1.2 % 32.1 % 44
307 Wyoming January 1947 36.7 % 0.3 % 1.2 % 1.0 % 2.0 % 58.8 % 42
308 Nebraska January 1955 33.1 % 0.5 % 0.2 % 0.4 % 2.4 % 63.4 % 50
309 Illinois January 1957 37.0 % 0.7 % 0.6 % 0.8 % 0.7 % 60.3 % 62
310 California November 1991 58.7 % 0.8 % 0.4 % 1.8 % 0.5 % 37.9 % 45
312 Illinois January 1947 63.9 % 1.4 % 0.7 % 1.8 % 1.0 % 31.2 % 46
313 Michigan January 1947 55.3 % 1.2 % 0.3 % 2.2 % 0.7 % 40.3 % 42
314 Missouri January 1947 62.5 % 2.3 % 0.8 % 2.6 % 0.8 % 31.0 % 36
315 New York January 1947 50.4 % 0.7 % 0.8 % 2.0 % 0.3 % 45.8 % 54
316 Kansas January 1947 64.3 % 2.8 % 0.5 % 1.2 % 0.6 % 30.6 % 34
317 Indiana January 1947 60.4 % 1.7 % 0.5 % 1.9 % 0.7 % 34.9 % 43
318 Louisiana January 1957 40.6 % 4.3 % 0.3 % 1.4 % 1.2 % 52.2 % 42
319 Iowa January 1947 38.5 % 2.3 % 0.4 % 1.3 % 1.6 % 55.9 % 76
320 Minnesota March 1996 31.8 % 0.7 % 0.3 % 2.0 % 0.7 % 64.5 % 74
321 Florida November 1999 60.4 % 7.6 % 0.4 % 4.8 % 0.7 % 26.0 % 42
323 California June 1998 60.6 % 1.9 % 0.6 % 2.9 % 0.7 % 33.3 % 44
325 Texas April 2003 32.9 % 0.9 % 0.4 % 1.1 % 0.5 % 64.2 % 39
330 Ohio March 1996 53.7 % 0.7 % 0.4 % 1.6 % 0.5 % 43.1 % 42
331 Illinois October 2007 57.4 % 2.5 % 0.7 % 2.5 % 0.6 % 36.3 % 38
Number Utilization by Area Code as of December 31, 2018Table 6
U.S. Federal Communications Commission 12 Numbering Resource Utilization in the United States
Area Code State / Jurisdiction Area Code Opened Assigned Intermediate Reserved Aging Administrative Available OCNs
Number Utilization by Area Code as of December 31, 2018Table 6
332 New York June 2017 67.3 % 3.4 % 2.1 % 2.0 % 0.1 % 25.3 % 15
334 Alabama January 1995 37.3 % 3.9 % 0.5 % 1.5 % 0.8 % 56.0 % 61
336 North Carolina December 1997 49.8 % 5.5 % 0.5 % 2.1 % 0.9 % 41.1 % 60
337 Louisiana October 1999 39.1 % 4.8 % 0.3 % 1.5 % 0.8 % 53.4 % 38
339 Massachusetts May 2001 63.0 % 2.8 % 0.3 % 1.9 % 0.5 % 31.5 % 27
340 Virgin Islands June 1997 31.8 % 2.6 % 0.6 % 1.7 % 0.9 % 62.4 % 7
346 Texas July 2014 67.6 % 1.6 % 0.9 % 3.8 % 0.3 % 25.9 % 38
347 New York October 1999 82.1 % 0.8 % 0.6 % 3.3 % 0.5 % 12.8 % 42
351 Massachusetts May 2001 36.7 % 19.5 % 0.3 % 2.3 % 0.0 % 41.2 % 19
352 Florida December 1995 54.5 % 2.5 % 0.8 % 2.2 % 0.8 % 39.2 % 36
360 Washington January 1995 56.3 % 0.8 % 0.5 % 1.4 % 1.9 % 39.1 % 62
361 Texas February 1999 41.9 % 0.8 % 0.3 % 1.2 % 0.6 % 55.2 % 37
364 Kentucky March 2014 16.1 % 0.0 % 0.0 % 0.0 % 0.0 % 83.9 % 3
380 Ohio February 2016 37.2 % 1.3 % 2.3 % 1.3 % 0.0 % 57.8 % 17
385 Utah March 2009 72.6 % 2.2 % 1.0 % 3.4 % 0.5 % 20.3 % 31
386 Florida February 2001 49.6 % 8.0 % 0.4 % 2.1 % 0.7 % 39.3 % 37
401 Rhode Island January 1947 55.6 % 0.9 % 0.4 % 2.0 % 0.3 % 40.7 % 35
402 Nebraska January 1947 48.3 % 1.0 % 0.3 % 2.0 % 1.6 % 46.8 % 64
404 Georgia January 1947 62.2 % 10.2 % 0.6 % 2.1 % 2.1 % 22.8 % 42
405 Oklahoma January 1947 51.3 % 3.3 % 0.5 % 1.6 % 0.9 % 42.4 % 46
406 Montana January 1947 32.1 % 0.3 % 0.4 % 0.8 % 1.0 % 65.4 % 59
407 Florida April 1988 60.1 % 6.3 % 1.0 % 3.3 % 0.8 % 28.5 % 49
408 California January 1959 61.2 % 1.5 % 0.3 % 1.3 % 0.6 % 35.1 % 51
409 Texas November 1982 44.1 % 4.9 % 0.4 % 1.6 % 0.4 % 48.6 % 43
410 Maryland October 1991 60.9 % 0.5 % 0.6 % 1.3 % 0.3 % 36.3 % 48
412 Pennsylvania January 1947 60.2 % 0.8 % 0.7 % 2.0 % 0.4 % 35.9 % 47
413 Massachusetts January 1947 58.0 % 0.8 % 0.3 % 1.6 % 0.2 % 39.0 % 35
414 Wisconsin January 1947 63.5 % 1.6 % 0.3 % 1.9 % 1.1 % 31.7 % 32
415 California January 1947 61.1 % 1.8 % 0.5 % 1.6 % 0.5 % 34.4 % 48
417 Missouri January 1950 38.8 % 1.8 % 1.1 % 1.3 % 0.7 % 56.3 % 55
419 Ohio January 1947 40.4 % 3.5 % 0.8 % 1.0 % 0.5 % 53.8 % 63
423 Tennessee September 1995 47.8 % 4.6 % 0.7 % 2.1 % 0.6 % 44.2 % 56
424 California August 2006 66.1 % 3.3 % 0.9 % 5.0 % 0.3 % 24.4 % 44
425 Washington April 1997 67.5 % 0.7 % 0.6 % 1.4 % 1.8 % 27.9 % 37
430 Texas February 2003 18.9 % 1.5 % 0.1 % 0.9 % 0.1 % 78.5 % 30
432 Texas April 2003 40.9 % 2.5 % 2.2 % 1.6 % 0.3 % 52.5 % 31
434 Virginia June 2001 49.6 % 1.5 % 0.7 % 1.5 % 0.6 % 46.1 % 39
435 Utah September 1997 42.4 % 0.6 % 0.3 % 1.8 % 1.8 % 53.2 % 54
440 Ohio August 1997 56.2 % 0.8 % 0.5 % 1.6 % 0.3 % 40.5 % 47
442 California November 2009 44.2 % 3.4 % 0.5 % 4.6 % 0.3 % 47.0 % 40
443 Maryland June 1997 61.6 % 1.0 % 0.5 % 3.8 % 0.3 % 32.8 % 46
445 Pennsylvania March 2018 39.7 % 0.1 % 0.8 % 0.6 % 0.0 % 58.8 % 12
458 Oregon February 2010 29.0 % 2.3 % 2.8 % 4.7 % 0.3 % 60.9 % 24
463 Indiana November 2016 26.7 % 0.7 % 0.6 % 1.5 % 0.1 % 70.5 % 16
469 Texas July 1999 69.9 % 2.1 % 0.9 % 2.6 % 0.9 % 23.6 % 59
470 Georgia February 2010 69.9 % 4.1 % 1.0 % 3.6 % 0.4 % 21.0 % 47
475 Connecticut December 2009 59.0 % 3.1 % 1.5 % 3.6 % 0.2 % 32.5 % 27
478 Georgia August 2000 46.0 % 3.8 % 0.4 % 1.8 % 0.8 % 47.1 % 43
479 Arkansas January 2002 46.9 % 1.6 % 0.4 % 1.3 % 0.8 % 49.1 % 39
480 Arizona March 1999 75.4 % 0.7 % 0.7 % 2.7 % 4.1 % 16.5 % 38
484 Pennsylvania June 1999 57.4 % 1.5 % 1.6 % 2.1 % 0.2 % 37.2 % 52
501 Arkansas January 1947 51.2 % 3.0 % 0.4 % 1.5 % 0.7 % 43.2 % 38
502 Kentucky January 1947 51.7 % 8.8 % 0.4 % 2.8 % 1.0 % 35.3 % 41
503 Oregon January 1947 62.4 % 0.4 % 0.3 % 1.6 % 2.5 % 32.9 % 52
504 Louisiana January 1947 51.1 % 7.9 % 0.5 % 2.7 % 1.0 % 36.8 % 38
505 New Mexico January 1947 62.0 % 0.6 % 0.5 % 2.0 % 3.8 % 31.1 % 43
507 Minnesota January 1954 30.4 % 0.4 % 0.4 % 0.8 % 0.6 % 67.5 % 83
508 Massachusetts July 1988 60.5 % 0.9 % 1.1 % 2.1 % 0.5 % 34.9 % 41
509 Washington January 1957 52.8 % 0.5 % 1.0 % 1.6 % 1.4 % 42.7 % 55
510 California September 1991 57.4 % 1.8 % 0.5 % 1.9 % 0.7 % 37.7 % 44
512 Texas January 1947 68.7 % 2.2 % 0.7 % 1.7 % 0.6 % 26.1 % 46
513 Ohio January 1947 63.2 % 0.6 % 0.4 % 1.8 % 0.9 % 33.0 % 41
515 Iowa January 1947 52.4 % 2.0 % 0.7 % 1.7 % 3.0 % 40.2 % 62
516 New York January 1951 61.6 % 0.9 % 0.6 % 2.1 % 0.5 % 34.4 % 48
517 Michigan January 1947 42.4 % 0.6 % 0.3 % 1.3 % 0.3 % 55.2 % 57
U.S. Federal Communications Commission 13 Numbering Resource Utilization in the United States
Area Code State / Jurisdiction Area Code Opened Assigned Intermediate Reserved Aging Administrative Available OCNs
Number Utilization by Area Code as of December 31, 2018Table 6
518 New York January 1947 50.0 % 1.4 % 0.6 % 2.4 % 0.3 % 45.3 % 64
520 Arizona March 1995 61.2 % 0.8 % 0.5 % 2.2 % 3.1 % 32.1 % 47
530 California November 1997 42.6 % 1.8 % 0.2 % 1.4 % 0.5 % 53.4 % 62
531 Nebraska March 2011 45.4 % 1.5 % 2.2 % 2.4 % 0.1 % 48.4 % 25
534 Wisconsin August 2010 7.3 % 2.1 % 0.1 % 0.8 % 0.1 % 89.7 % 10
539 Oklahoma April 2011 20.4 % 1.8 % 0.1 % 1.4 % 0.2 % 76.1 % 28
540 Virginia July 1995 53.2 % 0.8 % 0.7 % 2.0 % 0.7 % 42.7 % 62
541 Oregon November 1995 45.8 % 1.4 % 1.7 % 1.7 % 1.7 % 47.8 % 59
551 New Jersey December 2001 63.3 % 2.5 % 1.3 % 3.3 % 0.3 % 29.3 % 30
559 California November 1998 51.9 % 1.9 % 0.2 % 2.1 % 0.9 % 43.0 % 45
561 Florida May 1996 56.6 % 9.8 % 1.5 % 3.3 % 1.3 % 27.5 % 52
562 California January 1997 59.0 % 0.7 % 0.4 % 2.1 % 0.7 % 37.0 % 47
563 Iowa March 2001 43.1 % 0.6 % 0.3 % 0.9 % 1.0 % 54.1 % 65
564 Washington August 2017 56.7 % 0.0 % 0.0 % 0.0 % 0.0 % 43.3 % 5
567 Ohio January 2002 31.1 % 1.8 % 0.9 % 1.0 % 0.2 % 64.9 % 41
570 Pennsylvania December 1998 50.7 % 1.0 % 1.3 % 1.2 % 0.5 % 45.4 % 62
571 Virginia March 2000 74.3 % 1.5 % 0.9 % 3.2 % 0.4 % 19.7 % 53
573 Missouri January 1996 34.7 % 1.7 % 0.5 % 2.2 % 0.5 % 60.4 % 52
574 Indiana January 2002 45.5 % 1.1 % 0.5 % 1.7 % 0.3 % 50.8 % 42
575 New Mexico October 2007 33.8 % 1.1 % 2.8 % 1.4 % 1.7 % 59.2 % 52
580 Oklahoma November 1997 22.8 % 2.7 % 1.1 % 1.0 % 0.4 % 71.9 % 49
585 New York November 2001 57.1 % 1.2 % 0.7 % 2.5 % 0.3 % 38.3 % 44
586 Michigan September 2001 64.3 % 0.5 % 0.2 % 1.3 % 0.2 % 33.4 % 40
601 Mississippi January 1947 39.8 % 5.5 % 0.3 % 1.5 % 1.0 % 51.9 % 49
602 Arizona January 1947 64.0 % 0.7 % 0.7 % 2.2 % 2.4 % 30.0 % 35
603 New Hampshire January 1947 49.9 % 0.7 % 0.9 % 2.6 % 0.2 % 45.6 % 49
605 South Dakota January 1947 31.4 % 0.2 % 0.3 % 1.0 % 0.9 % 66.2 % 80
606 Kentucky January 1955 27.5 % 1.6 % 0.5 % 1.1 % 0.4 % 68.8 % 49
607 New York January 1954 40.3 % 1.3 % 1.4 % 2.3 % 0.2 % 54.6 % 50
608 Wisconsin January 1955 45.7 % 0.9 % 0.5 % 1.0 % 0.6 % 51.2 % 76
609 New Jersey January 1957 55.9 % 1.2 % 0.7 % 2.2 % 0.3 % 39.6 % 49
610 Pennsylvania January 1994 57.5 % 0.7 % 1.6 % 1.7 % 0.3 % 38.2 % 56
612 Minnesota January 1947 73.2 % 0.7 % 0.7 % 2.0 % 1.5 % 21.9 % 44
614 Ohio January 1947 66.7 % 0.8 % 0.5 % 2.6 % 0.6 % 28.9 % 42
615 Tennessee January 1954 55.5 % 9.0 % 0.6 % 3.4 % 1.0 % 30.5 % 48
616 Michigan January 1947 54.8 % 1.2 % 0.5 % 1.6 % 0.4 % 41.5 % 43
617 Massachusetts January 1947 66.4 % 0.6 % 1.0 % 2.2 % 0.4 % 29.5 % 38
618 Illinois January 1947 33.4 % 0.9 % 0.4 % 1.1 % 0.4 % 63.8 % 59
619 California January 1982 60.7 % 1.6 % 0.4 % 2.2 % 0.8 % 34.3 % 43
620 Kansas February 2001 20.5 % 3.2 % 2.9 % 0.7 % 0.3 % 72.4 % 72
623 Arizona March 1999 68.8 % 0.7 % 0.9 % 3.2 % 7.7 % 18.6 % 31
626 California June 1997 60.6 % 1.4 % 0.5 % 2.6 % 0.7 % 34.3 % 47
628 California March 2015 59.5 % 4.1 % 0.6 % 2.5 % 0.2 % 33.1 % 33
629 Tennessee March 2015 50.7 % 2.4 % 2.8 % 2.7 % 0.3 % 41.0 % 28
630 Illinois August 1996 54.8 % 0.8 % 0.4 % 1.3 % 0.6 % 42.2 % 41
631 New York November 1999 55.0 % 1.3 % 0.6 % 2.0 % 0.5 % 40.6 % 43
636 Missouri May 1999 46.9 % 1.7 % 1.0 % 2.9 % 0.2 % 47.3 % 37
641 Iowa July 2000 20.3 % 2.6 % 1.4 % 0.7 % 0.6 % 74.4 % 67
646 New York July 1999 80.2 % 1.6 % 0.7 % 4.7 % 0.7 % 12.1 % 54
650 California August 1997 57.2 % 1.9 % 0.3 % 1.4 % 0.7 % 38.5 % 45
651 Minnesota July 1998 66.1 % 0.7 % 0.4 % 1.8 % 3.2 % 27.8 % 49
657 California September 2008 70.6 % 5.3 % 1.3 % 3.8 % 0.3 % 18.6 % 31
660 Missouri October 1997 21.2 % 1.8 % 0.2 % 0.8 % 0.3 % 75.7 % 52
661 California February 1999 54.8 % 1.5 % 0.3 % 2.5 % 0.6 % 40.3 % 54
662 Mississippi April 1999 33.5 % 4.2 % 0.3 % 1.3 % 0.9 % 59.8 % 53
667 Maryland March 2012 48.7 % 0.9 % 0.3 % 2.7 % 0.2 % 47.3 % 38
669 California November 2012 71.0 % 3.9 % 1.6 % 3.4 % 0.2 % 20.0 % 33
670 Northern Marianas Islands July 1997 33.4 % 0.0 % 2.1 % 0.5 % 0.0 % 64.0 % 3
671 Guam July 1997 38.9 % 0.0 % 0.9 % 4.0 % 0.0 % 56.2 % 8
678 Georgia January 1998 67.7 % 6.4 % 0.9 % 5.2 % 0.5 % 19.2 % 50
680 New York March 2017 19.0 % 0.1 % 0.1 % 0.4 % 0.0 % 80.5 % 10
681 West Virginia March 2009 14.2 % 1.3 % 0.1 % 0.7 % 0.1 % 83.6 % 36
682 Texas October 2000 73.1 % 1.6 % 0.9 % 3.1 % 0.6 % 20.7 % 42
684 American Samoa October 2004 65.6 % 0.5 % 2.0 % 0.1 % 6.8 % 25.1 % 2
701 North Dakota January 1947 26.3 % 0.3 % 0.4 % 0.7 % 0.7 % 71.6 % 69
U.S. Federal Communications Commission 14 Numbering Resource Utilization in the United States

Area Code State / Jurisdiction Area Code Opened Assigned Intermediate Reserved Aging Administrative Available OCNs
Number Utilization by Area Code as of December 31, 2018Table 6
702 Nevada January 1947 72.0 % 0.8 % 1.4 % 3.1 % 0.7 % 22.0 % 45
703 Virginia January 1947 68.2 % 0.5 % 0.6 % 2.7 % 0.2 % 27.9 % 44
704 North Carolina January 1947 54.9 % 8.5 % 0.6 % 2.9 % 1.1 % 32.0 % 47
706 Georgia May 1992 48.8 % 5.3 % 0.5 % 1.9 % 0.9 % 42.6 % 72
707 California January 1959 49.0 % 2.3 % 0.3 % 1.2 % 0.8 % 46.3 % 50
708 Illinois November 1989 45.6 % 0.9 % 0.2 % 1.5 % 0.6 % 51.1 % 41
712 Iowa January 1947 21.9 % 1.4 % 0.3 % 0.8 % 0.7 % 74.9 % 109
713 Texas January 1947 57.6 % 2.2 % 0.4 % 1.3 % 0.7 % 37.9 % 40
714 California January 1951 59.7 % 0.7 % 0.4 % 2.0 % 1.7 % 35.5 % 45
715 Wisconsin January 1947 31.9 % 1.0 % 0.7 % 0.7 % 0.3 % 65.4 % 89
716 New York January 1947 55.5 % 1.0 % 0.6 % 2.4 % 0.3 % 40.1 % 50
717 Pennsylvania January 1947 63.8 % 0.6 % 0.6 % 1.6 % 0.5 % 32.8 % 51
718 New York September 1984 58.4 % 0.2 % 0.7 % 2.1 % 0.4 % 38.3 % 40
719 Colorado March 1988 54.0 % 0.7 % 0.6 % 2.3 % 2.7 % 39.8 % 53
720 Colorado June 1998 79.4 % 1.6 % 0.8 % 3.4 % 1.3 % 13.5 % 48
724 Pennsylvania February 1998 48.4 % 1.2 % 0.4 % 1.3 % 0.3 % 48.3 % 58
725 Nevada June 2014 55.4 % 3.1 % 0.8 % 4.8 % 0.0 % 35.8 % 23
726 Texas October 2017 58.5 % 4.7 % 0.2 % 1.5 % 0.1 % 35.0 % 12
727 Florida July 1998 53.1 % 0.7 % 0.9 % 2.6 % 0.3 % 42.3 % 41
731 Tennessee February 2001 37.3 % 4.0 % 0.3 % 1.1 % 0.7 % 56.5 % 45
732 New Jersey June 1997 59.2 % 1.0 % 0.5 % 2.4 % 0.3 % 36.5 % 46
734 Michigan December 1997 55.8 % 0.7 % 0.3 % 1.5 % 0.3 % 41.4 % 50
737 Texas July 2013 55.0 % 1.5 % 1.3 % 3.0 % 0.4 % 38.7 % 33
740 Ohio December 1997 38.7 % 1.3 % 0.3 % 1.3 % 0.3 % 58.0 % 48
743 North Carolina May 2016 38.2 % 7.3 % 0.6 % 2.0 % 0.0 % 51.8 % 11
747 California May 2009 62.7 % 3.6 % 0.7 % 5.1 % 0.2 % 27.7 % 30
754 Florida August 2001 75.9 % 4.7 % 0.6 % 4.7 % 0.4 % 13.8 % 32
757 Virginia July 1996 66.2 % 0.7 % 0.6 % 2.1 % 0.4 % 29.9 % 36
760 California March 1997 53.7 % 2.0 % 0.3 % 1.7 % 0.5 % 41.9 % 57
762 Georgia May 2006 28.2 % 2.3 % 0.2 % 1.7 % 0.4 % 67.3 % 37
763 Minnesota February 2000 60.3 % 4.3 % 0.6 % 2.1 % 2.7 % 30.0 % 53
765 Indiana February 1997 35.9 % 2.3 % 0.3 % 1.0 % 0.4 % 60.1 % 61
769 Mississippi March 2005 35.9 % 1.1 % 0.3 % 2.8 % 1.4 % 58.6 % 28
770 Georgia August 1995 51.5 % 17.6 % 0.3 % 1.6 % 0.6 % 28.4 % 46
772 Florida February 2002 50.3 % 8.1 % 1.1 % 3.6 % 1.9 % 35.0 % 44
773 Illinois October 1996 52.8 % 0.7 % 0.4 % 2.2 % 0.5 % 43.3 % 41
774 Massachusetts May 2001 50.2 % 2.0 % 0.3 % 1.9 % 0.3 % 45.3 % 36
775 Nevada December 1998 50.9 % 1.0 % 0.3 % 1.2 % 0.9 % 45.7 % 46
779 Illinois March 2007 44.4 % 2.6 % 1.2 % 1.9 % 0.1 % 49.8 % 39
781 Massachusetts September 1997 51.7 % 0.9 % 0.6 % 1.9 % 0.3 % 44.6 % 39
785 Kansas July 1997 26.4 % 2.0 % 0.3 % 0.7 % 1.0 % 69.6 % 69
786 Florida March 1998 72.4 % 3.4 % 2.4 % 5.5 % 0.6 % 15.8 % 53
787 Puerto Rico March 1996 60.1 % 0.8 % 1.7 % 2.1 % 0.4 % 35.0 % 15
801 Utah January 1947 70.1 % 0.4 % 0.3 % 3.1 % 3.2 % 22.9 % 33
802 Vermont January 1947 37.1 % 1.1 % 0.7 % 1.0 % 0.2 % 59.8 % 40
803 South Carolina January 1947 46.6 % 6.8 % 0.7 % 2.1 % 1.2 % 42.7 % 62
804 Virginia June 1973 61.8 % 0.9 % 0.8 % 2.7 % 0.4 % 33.5 % 40
805 California January 1957 55.0 % 1.8 % 1.1 % 1.5 % 0.6 % 40.0 % 56
806 Texas January 1957 28.1 % 1.6 % 2.4 % 1.0 % 0.7 % 66.1 % 45
808 Hawaii January 1957 71.7 % 0.2 % 0.7 % 2.2 % 0.4 % 24.8 % 17
810 Michigan December 1993 43.5 % 1.4 % 0.3 % 1.6 % 0.5 % 52.8 % 42
812 Indiana January 1947 40.5 % 1.1 % 0.5 % 1.2 % 0.5 % 56.2 % 61
813 Florida January 1953 58.5 % 0.8 % 1.0 % 3.1 % 0.3 % 36.3 % 49
814 Pennsylvania January 1947 48.7 % 0.7 % 0.3 % 1.7 % 0.4 % 48.2 % 56
815 Illinois January 1947 44.2 % 1.2 % 0.2 % 1.1 % 0.6 % 52.7 % 66
816 Missouri January 1947 53.0 % 2.3 % 0.5 % 2.0 % 0.6 % 41.7 % 53
817 Texas January 1953 56.0 % 1.7 % 0.3 % 1.4 % 0.7 % 39.9 % 53
818 California January 1984 57.3 % 1.1 % 0.3 % 2.1 % 0.6 % 38.6 % 43
820 California June 2018 83.3 % 0.0 % 0.0 % 0.0 % 0.0 % 16.6 % 3
828 North Carolina March 1998 43.8 % 4.9 % 0.7 % 2.1 % 1.2 % 47.2 % 47
830 Texas July 1997 34.5 % 1.9 % 0.1 % 1.7 % 0.3 % 61.5 % 50
831 California July 1998 49.1 % 2.5 % 0.2 % 1.3 % 1.0 % 45.9 % 42
832 Texas January 1999 76.1 % 1.4 % 0.6 % 3.0 % 0.7 % 18.2 % 45
838 New York September 2017 15.0 % 0.3 % 0.1 % 0.4 % 0.1 % 84.2 % 13
843 South Carolina March 1998 46.1 % 4.6 % 1.0 % 2.3 % 1.0 % 45.0 % 56
U.S. Federal Communications Commission 15 Numbering Resource Utilization in the United States
Area Code State / Jurisdiction Area Code Opened Assigned Intermediate Reserved Aging Administrative Available OCNs
Number Utilization by Area Code as of December 31, 2018Table 6
845 New York June 2000 48.7 % 1.3 % 0.5 % 2.6 % 0.4 % 46.3 % 58
847 Illinois January 1996 56.3 % 0.8 % 0.2 % 1.3 % 0.4 % 41.0 % 40
848 New Jersey December 2001 58.8 % 3.3 % 1.0 % 2.5 % 0.5 % 33.9 % 33
850 Florida June 1997 49.1 % 3.0 % 0.5 % 2.2 % 0.9 % 44.3 % 46
854 South Carolina October 2015 31.2 % 2.3 % 0.2 % 3.1 % 0.0 % 63.2 % 17
856 New Jersey June 1999 50.6 % 1.5 % 0.4 % 2.5 % 0.3 % 44.7 % 47
857 Massachusetts May 2001 68.3 % 1.8 % 1.3 % 2.9 % 0.5 % 25.2 % 45
858 California June 1999 60.4 % 2.3 % 0.3 % 2.4 % 1.0 % 33.6 % 39
859 Kentucky April 2000 48.8 % 2.2 % 0.4 % 1.9 % 0.4 % 46.4 % 50
860 Connecticut August 1995 53.2 % 1.3 % 0.3 % 1.9 % 0.3 % 43.0 % 32
862 New Jersey December 2001 65.1 % 2.0 % 0.6 % 3.4 % 0.6 % 28.3 % 47
863 Florida September 1999 46.9 % 1.4 % 0.7 % 2.3 % 0.5 % 48.1 % 49
864 South Carolina December 1995 47.1 % 7.2 % 0.5 % 3.4 % 0.8 % 41.0 % 48
865 Tennessee November 1999 52.6 % 8.8 % 0.6 % 3.1 % 1.2 % 33.8 % 42
870 Arkansas April 1997 26.9 % 1.5 % 0.4 % 1.1 % 0.4 % 69.7 % 51
872 Illinois November 2009 51.0 % 2.5 % 1.0 % 1.8 % 0.5 % 43.2 % 28
878 Pennsylvania August 2001 38.0 % 1.3 % 0.2 % 3.4 % 0.1 % 57.0 % 27
901 Tennessee January 1947 60.2 % 8.3 % 0.5 % 3.0 % 1.2 % 26.9 % 44
903 Texas November 1990 39.6 % 2.7 % 0.4 % 1.6 % 0.9 % 54.9 % 62
904 Florida July 1965 56.0 % 10.7 % 0.4 % 3.3 % 0.9 % 28.6 % 39
906 Michigan March 1961 18.0 % 0.2 % 0.3 % 0.4 % 0.2 % 81.0 % 31
907 Alaska January 1957 28.3 % 2.7 % 0.4 % 1.0 % 1.3 % 66.3 % 40
908 New Jersey November 1990 52.2 % 1.0 % 0.5 % 1.8 % 0.5 % 44.0 % 51
909 California November 1992 60.4 % 1.6 % 0.4 % 2.2 % 0.6 % 34.8 % 48
910 North Carolina November 1993 46.8 % 3.4 % 1.8 % 2.1 % 0.7 % 45.2 % 49
912 Georgia January 1954 43.1 % 4.0 % 0.5 % 2.0 % 1.3 % 49.1 % 53
913 Kansas January 1947 59.2 % 1.6 % 0.6 % 1.9 % 0.9 % 35.7 % 50
914 New York January 1947 57.6 % 0.9 % 0.5 % 2.4 % 0.4 % 38.3 % 51
915 Texas January 1947 66.1 % 1.4 % 0.4 % 2.0 % 1.1 % 29.1 % 33
916 California January 1947 63.5 % 1.0 % 0.4 % 2.0 % 0.7 % 32.4 % 48
917 New York January 1992 66.0 % 0.9 % 0.5 % 1.8 % 0.4 % 30.5 % 43
918 Oklahoma January 1953 41.7 % 3.0 % 0.3 % 1.6 % 0.6 % 52.8 % 64
919 North Carolina January 1954 58.8 % 6.9 % 1.0 % 3.0 % 0.8 % 29.5 % 46
920 Wisconsin July 1997 43.2 % 1.4 % 0.4 % 1.1 % 0.4 % 53.4 % 61
925 California March 1998 54.1 % 2.0 % 0.4 % 1.5 % 1.2 % 40.9 % 41
928 Arizona June 2001 46.2 % 1.6 % 0.3 % 1.6 % 3.3 % 47.1 % 51
929 New York April 2011 65.8 % 4.1 % 1.6 % 4.4 % 0.1 % 24.0 % 35
930 Indiana March 2015 16.2 % 0.2 % 0.6 % 1.3 % 0.3 % 81.4 % 8
931 Tennessee September 1997 37.7 % 4.1 % 0.3 % 1.4 % 0.5 % 55.9 % 51
934 New York July 2016 35.6 % 0.0 % 2.0 % 2.1 % 0.0 % 60.2 % 11
936 Texas February 2000 40.6 % 1.8 % 0.6 % 1.6 % 0.4 % 54.9 % 43
937 Ohio September 1996 47.4 % 0.9 % 0.4 % 1.4 % 0.4 % 49.6 % 49
938 Alabama July 2010 29.5 % 0.6 % 0.5 % 0.8 % 0.1 % 68.4 % 10
939 Puerto Rico September 2001 52.2 % 0.7 % 0.7 % 4.7 % 1.3 % 40.4 % 13
940 Texas May 1997 32.2 % 1.3 % 0.2 % 1.1 % 0.9 % 64.3 % 61
941 Florida May 1995 54.5 % 1.0 % 1.1 % 2.6 % 0.4 % 40.4 % 44
947 Michigan September 2002 63.9 % 0.6 % 2.0 % 1.3 % 0.0 % 32.2 % 18
949 California April 1998 64.4 % 2.1 % 0.7 % 2.3 % 0.9 % 29.6 % 47
951 California July 2004 65.8 % 1.3 % 0.4 % 2.6 % 0.6 % 29.4 % 42
952 Minnesota February 2000 61.3 % 0.3 % 0.4 % 1.4 % 2.0 % 34.7 % 44
954 Florida September 1995 56.4 % 10.3 % 1.6 % 3.1 % 1.3 % 27.2 % 45
956 Texas July 1997 53.7 % 2.1 % 0.4 % 1.9 % 0.8 % 41.1 % 38
959 Connecticut August 2014 40.8 % 2.0 % 0.2 % 2.1 % 0.7 % 54.2 % 18
970 Colorado April 1995 46.5 % 1.1 % 0.5 % 1.6 % 2.2 % 48.0 % 65
971 Oregon October 2000 64.1 % 1.8 % 1.1 % 4.0 % 0.4 % 28.6 % 38
972 Texas September 1996 54.4 % 1.6 % 0.6 % 1.2 % 0.5 % 41.8 % 54
973 New Jersey June 1997 57.8 % 0.9 % 0.6 % 2.2 % 0.3 % 38.3 % 54
978 Massachusetts September 1997 52.7 % 1.5 % 0.7 % 2.3 % 0.3 % 42.4 % 42
979 Texas February 2000 36.1 % 2.0 % 0.4 % 0.9 % 0.3 % 60.3 % 52
980 North Carolina April 2001 59.1 % 4.5 % 1.1 % 3.5 % 0.3 % 31.4 % 39
984 North Carolina April 2012 52.3 % 2.9 % 0.4 % 2.3 % 0.2 % 41.8 % 32
985 Louisiana February 2001 37.5 % 6.2 % 0.3 % 1.7 % 0.8 % 53.5 % 36
986 Idaho September 2017 35.7 % 0.0 % 1.1 % 2.6 % 0.6 % 59.9 % 5
989 Michigan April 2001 34.8 % 1.2 % 0.4 % 0.9 % 0.3 % 62.5 % 49
Source: Numbering Resource Utilization/Forecast Reports data filed with Somos, Inc. through May 17, 2019. Area code information is from Somos, Inc.'s website.
Note: The Commission has found “that aggregated data (such as each carrier’s NPA wide utilization rate and number of NXXs assigned)” are not confidential. Numbering Resource Optimization, Report and Order and Further Notice of Proposed Rulemaking, CC Docket No. 99-200, 15 FCC Rcd 7574, 7607-08, para. 79 (2000).
U.S. Federal Communications Commission 16 Numbering Resource Utilization in the United States
Assigned Aging Available OCNs Assigned Aging Available OCNs Assigned Aging Available OCNs201 New Jersey 2,831 136 1,811 42 2,145 70 279 5 4 1 18 2202 District Of Columbia 3,624 121 943 39 1,806 85 329 5 3 1 6 4203 Connecticut 2,534 91 2,475 28 2,132 59 177 5 2 1 1 2205 Alabama 1,759 100 2,052 39 1,956 69 550 8 2 2 31 4206 Washington 2,539 45 1,215 32 2,036 66 154 5 2 1 4 5207 Maine 1,671 85 2,878 42 1,467 43 444 6 2 0 1 3208 Idaho 2,118 66 2,389 55 1,909 59 500 10 2 1 26 3209 California 1,772 32 1,882 35 1,931 92 516 5 2 2 60 4210 Texas 2,549 60 1,284 29 2,741 118 237 6 2 1 3 5212 New York 5,395 133 2,033 32 93 4 0 4 0 0 0 0213 California 1,686 93 987 35 1,165 75 206 5 1 1 12 3214 Texas 2,376 65 1,555 40 2,879 68 102 6 2 1 44 2215 Pennsylvania 3,192 86 1,937 37 1,756 59 156 5 1 1 2 1216 Ohio 1,679 67 1,209 29 1,514 60 356 5 1 1 21 5217 Illinois 1,152 37 4,239 41 1,316 43 535 7 1 1 42 4218 Minnesota 934 28 3,499 61 826 22 565 5 0 0 7 2219 Indiana 849 25 1,315 27 1,044 34 354 5 1 1 13 2220 Ohio 25 1 79 5 3 0 1 2 0 0 1 1223 Pennsylvania 75 0 140 8 3 0 50 4 0 0 4 2224 Illinois 1,076 39 731 33 1,329 60 398 5 1 1 36 2225 Louisiana 845 30 1,238 30 1,258 41 173 5 0 0 10 1228 Mississippi 341 12 778 24 847 19 301 7 2 1 17 2229 Georgia 605 19 2,115 32 885 45 838 7 0 0 10 1231 Michigan 761 16 2,404 37 760 25 347 5 0 0 0 1234 Ohio 348 16 649 28 596 26 211 5 2 1 58 5239 Florida 1,111 82 810 21 1,169 43 198 5 3 2 10 3240 Maryland 1,804 127 1,640 46 1,925 74 490 7 1 1 89 5248 Michigan 2,435 73 2,238 37 2,069 58 366 5 1 0 0 2251 Alabama 715 28 1,334 33 879 35 318 7 0 0 10 2252 North Carolina 1,193 42 2,539 25 1,192 54 450 8 1 1 9 2253 Washington 1,593 28 1,023 27 1,273 41 167 5 1 1 0 1254 Texas 851 22 2,153 33 995 35 438 8 1 2 14 3256 Alabama 1,444 49 2,143 36 1,727 58 829 6 1 1 32 2260 Indiana 819 13 1,421 25 800 25 377 6 0 0 19 1262 Wisconsin 1,537 57 1,834 28 1,206 33 249 6 3 1 47 4267 Pennsylvania 1,910 122 2,053 41 2,579 118 381 5 2 1 55 7269 Michigan 877 24 1,751 38 933 37 371 6 0 0 14 1270 Kentucky 1,420 39 4,157 42 1,249 45 675 11 1 1 10 2272 Pennsylvania 181 2 196 20 34 3 70 7 1 1 18 3276 Virginia 517 23 1,299 31 472 19 222 10 1 1 5 1279 California 24 2 41 9 11 4 11 4 0 0 3 1281 Texas 2,735 66 2,448 37 1,740 54 146 6 3 1 3 3301 Maryland 3,320 107 2,169 41 1,535 33 225 7 1 1 17 2302 Delaware 2,145 58 1,634 27 1,138 45 214 5 1 1 48 3303 Colorado 3,320 100 1,888 24 1,516 33 17 6 1 0 0 1304 West Virginia 1,672 13 3,469 36 1,846 64 422 12 1 2 32 2305 Florida 2,058 92 1,510 33 1,675 65 96 5 1 0 1 2307 Wyoming 765 18 1,338 31 671 21 941 8 1 1 20 3308 Nebraska 284 7 2,039 43 1,112 11 632 6 0 0 1 1309 Illinois 1,030 21 3,609 48 1,425 32 345 7 1 1 30 4310 California 2,573 78 2,211 35 2,130 67 139 5 0 0 0 0312 Illinois 3,240 67 1,355 32 1,712 74 472 5 4 1 4 6313 Michigan 1,745 59 1,574 34 1,976 91 658 5 0 0 0 1314 Missouri 2,301 106 1,330 23 2,142 77 440 5 3 1 17 5315 New York 2,039 96 2,925 43 1,652 51 244 5 1 1 8 3316 Kansas 752 21 673 20 1,808 24 453 7 1 1 10 4317 Indiana 2,464 66 2,044 33 2,210 77 296 5 2 2 10 2318 Louisiana 1,095 32 2,543 29 1,547 61 704 6 0 0 6 2319 Iowa 932 31 2,247 64 867 26 344 6 1 2 11 4320 Minnesota 759 68 2,404 59 592 14 306 11 1 2 14 3321 Florida 1,046 117 671 29 1,263 65 221 6 3 1 10 4323 California 2,255 78 1,957 32 2,466 150 417 5 1 1 10 2325 Texas 463 14 1,543 27 526 18 260 8 0 0 14 1330 Ohio 1,859 54 2,508 33 2,274 67 363 5 1 1 0 2331 Illinois 333 8 231 30 365 21 187 5 1 1 23 3
VoIP
Table 7Assigned, Aging, and Available Telephone Numbers by Area Code as of December 31, 2018
(in thousands except OCNs)
Mobile WirelessWireline (CLECs and ILECs)Area Code State / Jurisdiction
U.S. Federal Communications Commission 17 Numbering Resource Utilization in the United States
Assigned Aging Available OCNs Assigned Aging Available OCNs Assigned Aging Available OCNs
VoIP
Table 7Assigned, Aging, and Available Telephone Numbers by Area Code as of December 31, 2018
(in thousands except OCNs)
Mobile WirelessWireline (CLECs and ILECs)Area Code State / Jurisdiction
332 New York 118 1 7 8 32 3 41 4 2 0 9 3334 Alabama 1,118 39 2,421 48 1,263 54 1,008 7 1 0 2 2336 North Carolina 1,765 91 2,604 49 2,045 70 410 6 2 1 16 3337 Louisiana 826 35 1,898 28 1,211 46 721 6 0 0 1 1339 Massachusetts 228 4 175 20 198 7 32 5 1 1 6 2340 Virgin Islands 27 1 177 3 126 7 122 4 0 0 0 0346 Texas 699 22 407 26 1,022 73 218 5 3 1 36 6347 New York 2,223 68 421 34 4,034 182 552 6 1 0 0 2351 Massachusetts 36 2 27 13 20 1 35 5 1 1 2 1352 Florida 1,416 56 1,494 23 1,502 63 448 7 0 0 12 1360 Washington 2,287 44 2,545 53 2,058 64 355 6 1 0 0 1361 Texas 837 15 1,831 28 1,009 38 531 7 0 0 1 1364 Kentucky 5 0 25 2 0 0 0 0 0 0 1 1380 Ohio 35 0 53 11 29 1 42 3 1 1 7 3385 Utah 656 23 279 21 875 47 125 5 2 1 24 5386 Florida 722 30 934 26 865 36 236 6 1 1 5 3401 Rhode Island 1,562 60 1,733 22 1,270 42 237 5 1 1 40 5402 Nebraska 2,025 115 3,217 53 1,736 43 339 7 1 1 9 2404 Georgia 1,850 76 928 32 2,888 83 252 6 1 0 0 1405 Oklahoma 1,748 43 2,333 33 1,961 74 523 8 3 1 62 4406 Montana 1,115 23 3,526 45 1,131 32 1,017 10 1 1 39 3407 Florida 2,201 149 1,550 34 2,399 104 250 6 3 1 8 5408 California 2,857 53 2,089 40 1,945 45 175 5 0 0 0 2409 Texas 667 22 1,244 30 788 30 233 7 1 1 6 3410 Maryland 3,349 65 2,327 39 1,389 34 141 5 1 1 26 1412 Pennsylvania 2,336 87 1,823 35 1,828 47 376 5 2 2 24 4413 Massachusetts 1,736 45 1,578 25 1,015 33 169 5 0 0 10 2414 Wisconsin 1,597 35 920 22 1,338 51 224 6 1 1 3 2415 California 2,854 60 2,175 39 1,912 62 69 5 0 0 0 0417 Missouri 898 39 2,828 43 1,384 37 424 7 0 0 11 2419 Ohio 1,399 23 3,285 53 1,643 50 473 6 1 1 7 2423 Tennessee 1,392 62 2,124 42 1,705 71 561 9 1 1 22 3424 California 1,199 75 513 36 701 71 186 5 2 1 12 2425 Washington 2,271 34 1,311 27 1,453 45 144 5 1 0 12 3430 Texas 100 3 495 22 38 3 67 6 1 1 17 2432 Texas 454 20 1,219 22 664 23 181 5 1 0 10 2434 Virginia 937 24 1,295 26 820 29 257 7 1 1 48 4435 Utah 813 50 1,604 39 935 22 555 11 9 1 11 2440 Ohio 1,651 57 2,042 37 2,135 53 431 5 1 1 25 3442 California 266 25 354 31 248 30 164 6 1 1 51 2443 Maryland 2,049 204 1,865 37 2,741 93 638 6 1 1 48 2445 Pennsylvania 54 0 50 7 5 1 36 4 0 0 2 1458 Oregon 84 18 207 16 55 4 79 5 1 1 9 3463 Indiana 37 1 108 10 37 3 77 4 1 1 13 2469 Texas 2,102 70 1,188 46 2,280 95 262 6 2 1 29 6470 Georgia 1,193 77 581 34 1,959 84 337 6 7 3 31 7475 Connecticut 239 22 212 20 469 21 154 5 1 1 26 2478 Georgia 646 22 1,013 31 790 33 410 7 1 0 10 3479 Arkansas 827 13 1,457 27 1,037 34 431 6 1 0 12 2480 Arizona 2,622 103 1,005 25 2,376 74 59 5 2 0 2 4484 Pennsylvania 2,521 92 2,343 41 1,603 59 273 8 1 1 58 2501 Arkansas 1,387 34 1,493 27 1,293 44 575 5 1 1 20 3502 Kentucky 1,406 104 1,364 29 1,562 57 426 6 2 1 28 4503 Oregon 2,825 70 2,206 43 2,066 52 58 5 1 0 0 2504 Louisiana 1,109 72 1,193 24 1,514 64 385 6 2 1 18 5505 New Mexico 1,717 45 1,158 28 1,629 64 301 8 1 1 26 4507 Minnesota 1,025 26 3,838 72 910 21 420 5 1 2 8 4508 Massachusetts 2,939 120 2,281 31 1,566 35 263 5 1 1 10 2509 Washington 1,910 47 2,256 42 1,730 61 536 8 1 0 1 2510 California 2,223 70 2,166 34 2,161 76 295 5 1 1 11 1512 Texas 2,955 59 1,687 35 2,284 66 118 7 0 0 10 2513 Ohio 2,371 62 1,628 28 2,266 71 399 6 2 1 22 5515 Iowa 1,302 45 1,562 51 1,151 36 309 6 0 0 1 2516 New York 2,143 81 1,506 36 2,083 60 460 5 2 0 19 3517 Michigan 1,129 34 2,451 48 1,159 36 321 5 0 0 8 2
U.S. Federal Communications Commission 18 Numbering Resource Utilization in the United States
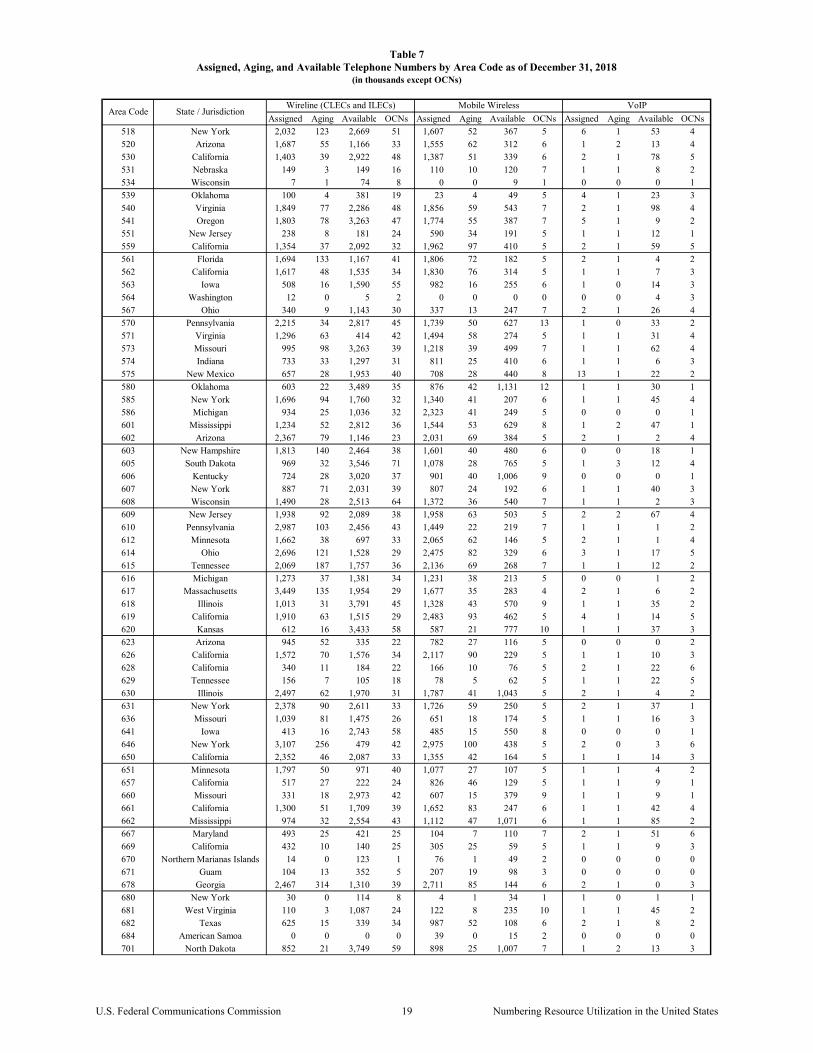
Assigned Aging Available OCNs Assigned Aging Available OCNs Assigned Aging Available OCNs
VoIP
Table 7Assigned, Aging, and Available Telephone Numbers by Area Code as of December 31, 2018
(in thousands except OCNs)
Mobile WirelessWireline (CLECs and ILECs)Area Code State / Jurisdiction
518 New York 2,032 123 2,669 51 1,607 52 367 5 6 1 53 4520 Arizona 1,687 55 1,166 33 1,555 62 312 6 1 2 13 4530 California 1,403 39 2,922 48 1,387 51 339 6 2 1 78 5531 Nebraska 149 3 149 16 110 10 120 7 1 1 8 2534 Wisconsin 7 1 74 8 0 0 9 1 0 0 0 1539 Oklahoma 100 4 381 19 23 4 49 5 4 1 23 3540 Virginia 1,849 77 2,286 48 1,856 59 543 7 2 1 98 4541 Oregon 1,803 78 3,263 47 1,774 55 387 7 5 1 9 2551 New Jersey 238 8 181 24 590 34 191 5 1 1 12 1559 California 1,354 37 2,092 32 1,962 97 410 5 2 1 59 5561 Florida 1,694 133 1,167 41 1,806 72 182 5 2 1 4 2562 California 1,617 48 1,535 34 1,830 76 314 5 1 1 7 3563 Iowa 508 16 1,590 55 982 16 255 6 1 0 14 3564 Washington 12 0 5 2 0 0 0 0 0 0 4 3567 Ohio 340 9 1,143 30 337 13 247 7 2 1 26 4570 Pennsylvania 2,215 34 2,817 45 1,739 50 627 13 1 0 33 2571 Virginia 1,296 63 414 42 1,494 58 274 5 1 1 31 4573 Missouri 995 98 3,263 39 1,218 39 499 7 1 1 62 4574 Indiana 733 33 1,297 31 811 25 410 6 1 1 6 3575 New Mexico 657 28 1,953 40 708 28 440 8 13 1 22 2580 Oklahoma 603 22 3,489 35 876 42 1,131 12 1 1 30 1585 New York 1,696 94 1,760 32 1,340 41 207 6 1 1 45 4586 Michigan 934 25 1,036 32 2,323 41 249 5 0 0 0 1601 Mississippi 1,234 52 2,812 36 1,544 53 629 8 1 2 47 1602 Arizona 2,367 79 1,146 23 2,031 69 384 5 2 1 2 4603 New Hampshire 1,813 140 2,464 38 1,601 40 480 6 0 0 18 1605 South Dakota 969 32 3,546 71 1,078 28 765 5 1 3 12 4606 Kentucky 724 28 3,020 37 901 40 1,006 9 0 0 0 1607 New York 887 71 2,031 39 807 24 192 6 1 1 40 3608 Wisconsin 1,490 28 2,513 64 1,372 36 540 7 1 1 2 3609 New Jersey 1,938 92 2,089 38 1,958 63 503 5 2 2 67 4610 Pennsylvania 2,987 103 2,456 43 1,449 22 219 7 1 1 1 2612 Minnesota 1,662 38 697 33 2,065 62 146 5 2 1 1 4614 Ohio 2,696 121 1,528 29 2,475 82 329 6 3 1 17 5615 Tennessee 2,069 187 1,757 36 2,136 69 268 7 1 1 12 2616 Michigan 1,273 37 1,381 34 1,231 38 213 5 0 0 1 2617 Massachusetts 3,449 135 1,954 29 1,677 35 283 4 2 1 6 2618 Illinois 1,013 31 3,791 45 1,328 43 570 9 1 1 35 2619 California 1,910 63 1,515 29 2,483 93 462 5 4 1 14 5620 Kansas 612 16 3,433 58 587 21 777 10 1 1 37 3623 Arizona 945 52 335 22 782 27 116 5 0 0 0 2626 California 1,572 70 1,576 34 2,117 90 229 5 1 1 10 3628 California 340 11 184 22 166 10 76 5 2 1 22 6629 Tennessee 156 7 105 18 78 5 62 5 1 1 22 5630 Illinois 2,497 62 1,970 31 1,787 41 1,043 5 2 1 4 2631 New York 2,378 90 2,611 33 1,726 59 250 5 2 1 37 1636 Missouri 1,039 81 1,475 26 651 18 174 5 1 1 16 3641 Iowa 413 16 2,743 58 485 15 550 8 0 0 0 1646 New York 3,107 256 479 42 2,975 100 438 5 2 0 3 6650 California 2,352 46 2,087 33 1,355 42 164 5 1 1 14 3651 Minnesota 1,797 50 971 40 1,077 27 107 5 1 1 4 2657 California 517 27 222 24 826 46 129 5 1 1 9 1660 Missouri 331 18 2,973 42 607 15 379 9 1 1 9 1661 California 1,300 51 1,709 39 1,652 83 247 6 1 1 42 4662 Mississippi 974 32 2,554 43 1,112 47 1,071 6 1 1 85 2667 Maryland 493 25 421 25 104 7 110 7 2 1 51 6669 California 432 10 140 25 305 25 59 5 1 1 9 3670 Northern Marianas Islands 14 0 123 1 76 1 49 2 0 0 0 0671 Guam 104 13 352 5 207 19 98 3 0 0 0 0678 Georgia 2,467 314 1,310 39 2,711 85 144 6 2 1 0 3680 New York 30 0 114 8 4 1 34 1 1 0 1 1681 West Virginia 110 3 1,087 24 122 8 235 10 1 1 45 2682 Texas 625 15 339 34 987 52 108 6 2 1 8 2684 American Samoa 0 0 0 0 39 0 15 2 0 0 0 0701 North Dakota 852 21 3,749 59 898 25 1,007 7 1 2 13 3
U.S. Federal Communications Commission 19 Numbering Resource Utilization in the United States
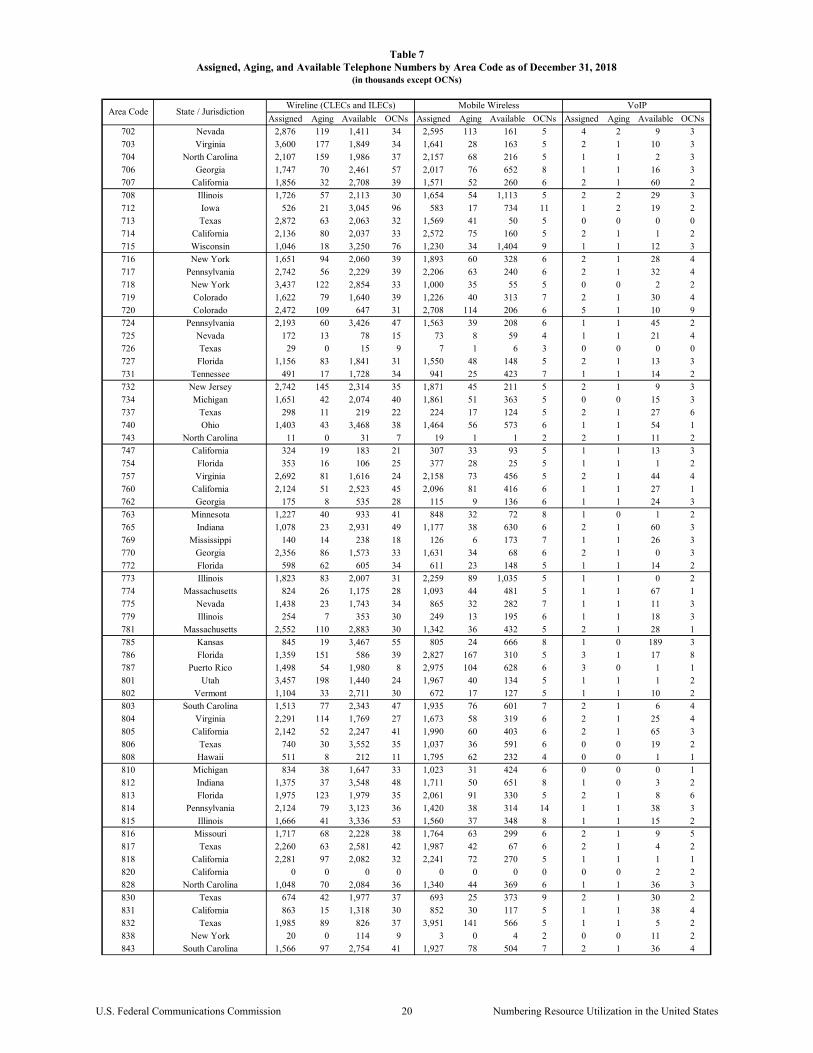
Assigned Aging Available OCNs Assigned Aging Available OCNs Assigned Aging Available OCNs
VoIP
Table 7Assigned, Aging, and Available Telephone Numbers by Area Code as of December 31, 2018
(in thousands except OCNs)
Mobile WirelessWireline (CLECs and ILECs)Area Code State / Jurisdiction
702 Nevada 2,876 119 1,411 34 2,595 113 161 5 4 2 9 3703 Virginia 3,600 177 1,849 34 1,641 28 163 5 2 1 10 3704 North Carolina 2,107 159 1,986 37 2,157 68 216 5 1 1 2 3706 Georgia 1,747 70 2,461 57 2,017 76 652 8 1 1 16 3707 California 1,856 32 2,708 39 1,571 52 260 6 2 1 60 2708 Illinois 1,726 57 2,113 30 1,654 54 1,113 5 2 2 29 3712 Iowa 526 21 3,045 96 583 17 734 11 1 2 19 2713 Texas 2,872 63 2,063 32 1,569 41 50 5 0 0 0 0714 California 2,136 80 2,037 33 2,572 75 160 5 2 1 1 2715 Wisconsin 1,046 18 3,250 76 1,230 34 1,404 9 1 1 12 3716 New York 1,651 94 2,060 39 1,893 60 328 6 2 1 28 4717 Pennsylvania 2,742 56 2,229 39 2,206 63 240 6 2 1 32 4718 New York 3,437 122 2,854 33 1,000 35 55 5 0 0 2 2719 Colorado 1,622 79 1,640 39 1,226 40 313 7 2 1 30 4720 Colorado 2,472 109 647 31 2,708 114 206 6 5 1 10 9724 Pennsylvania 2,193 60 3,426 47 1,563 39 208 6 1 1 45 2725 Nevada 172 13 78 15 73 8 59 4 1 1 21 4726 Texas 29 0 15 9 7 1 6 3 0 0 0 0727 Florida 1,156 83 1,841 31 1,550 48 148 5 2 1 13 3731 Tennessee 491 17 1,728 34 941 25 423 7 1 1 14 2732 New Jersey 2,742 145 2,314 35 1,871 45 211 5 2 1 9 3734 Michigan 1,651 42 2,074 40 1,861 51 363 5 0 0 15 3737 Texas 298 11 219 22 224 17 124 5 2 1 27 6740 Ohio 1,403 43 3,468 38 1,464 56 573 6 1 1 54 1743 North Carolina 11 0 31 7 19 1 1 2 2 1 11 2747 California 324 19 183 21 307 33 93 5 1 1 13 3754 Florida 353 16 106 25 377 28 25 5 1 1 1 2757 Virginia 2,692 81 1,616 24 2,158 73 456 5 2 1 44 4760 California 2,124 51 2,523 45 2,096 81 416 6 1 1 27 1762 Georgia 175 8 535 28 115 9 136 6 1 1 24 3763 Minnesota 1,227 40 933 41 848 32 72 8 1 0 1 2765 Indiana 1,078 23 2,931 49 1,177 38 630 6 2 1 60 3769 Mississippi 140 14 238 18 126 6 173 7 1 1 26 3770 Georgia 2,356 86 1,573 33 1,631 34 68 6 2 1 0 3772 Florida 598 62 605 34 611 23 148 5 1 1 14 2773 Illinois 1,823 83 2,007 31 2,259 89 1,035 5 1 1 0 2774 Massachusetts 824 26 1,175 28 1,093 44 481 5 1 1 67 1775 Nevada 1,438 23 1,743 34 865 32 282 7 1 1 11 3779 Illinois 254 7 353 30 249 13 195 6 1 1 18 3781 Massachusetts 2,552 110 2,883 30 1,342 36 432 5 2 1 28 1785 Kansas 845 19 3,467 55 805 24 666 8 1 0 189 3786 Florida 1,359 151 586 39 2,827 167 310 5 3 1 17 8787 Puerto Rico 1,498 54 1,980 8 2,975 104 628 6 3 0 1 1801 Utah 3,457 198 1,440 24 1,967 40 134 5 1 1 1 2802 Vermont 1,104 33 2,711 30 672 17 127 5 1 1 10 2803 South Carolina 1,513 77 2,343 47 1,935 76 601 7 2 1 6 4804 Virginia 2,291 114 1,769 27 1,673 58 319 6 2 1 25 4805 California 2,142 52 2,247 41 1,990 60 403 6 2 1 65 3806 Texas 740 30 3,552 35 1,037 36 591 6 0 0 19 2808 Hawaii 511 8 212 11 1,795 62 232 4 0 0 1 1810 Michigan 834 38 1,647 33 1,023 31 424 6 0 0 0 1812 Indiana 1,375 37 3,548 48 1,711 50 651 8 1 0 3 2813 Florida 1,975 123 1,979 35 2,061 91 330 5 2 1 8 6814 Pennsylvania 2,124 79 3,123 36 1,420 38 314 14 1 1 38 3815 Illinois 1,666 41 3,336 53 1,560 37 348 8 1 1 15 2816 Missouri 1,717 68 2,228 38 1,764 63 299 6 2 1 9 5817 Texas 2,260 63 2,581 42 1,987 42 67 6 2 1 4 2818 California 2,281 97 2,082 32 2,241 72 270 5 1 1 1 1820 California 0 0 0 0 0 0 0 0 0 0 2 2828 North Carolina 1,048 70 2,084 36 1,340 44 369 6 1 1 36 3830 Texas 674 42 1,977 37 693 25 373 9 2 1 30 2831 California 863 15 1,318 30 852 30 117 5 1 1 38 4832 Texas 1,985 89 826 37 3,951 141 566 5 1 1 5 2838 New York 20 0 114 9 3 0 4 2 0 0 11 2843 South Carolina 1,566 97 2,754 41 1,927 78 504 7 2 1 36 4
U.S. Federal Communications Commission 20 Numbering Resource Utilization in the United States
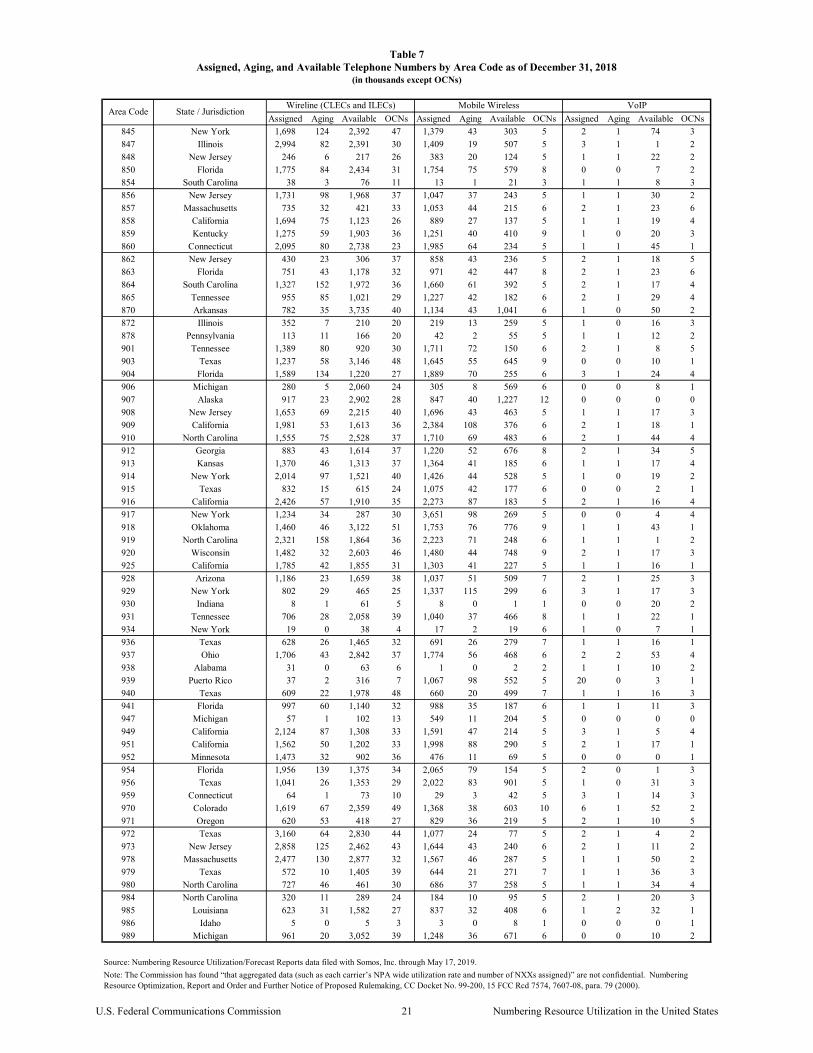
Assigned Aging Available OCNs Assigned Aging Available OCNs Assigned Aging Available OCNs
VoIP
Table 7Assigned, Aging, and Available Telephone Numbers by Area Code as of December 31, 2018
(in thousands except OCNs)
Mobile WirelessWireline (CLECs and ILECs)Area Code State / Jurisdiction
845 New York 1,698 124 2,392 47 1,379 43 303 5 2 1 74 3847 Illinois 2,994 82 2,391 30 1,409 19 507 5 3 1 1 2848 New Jersey 246 6 217 26 383 20 124 5 1 1 22 2850 Florida 1,775 84 2,434 31 1,754 75 579 8 0 0 7 2854 South Carolina 38 3 76 11 13 1 21 3 1 1 8 3856 New Jersey 1,731 98 1,968 37 1,047 37 243 5 1 1 30 2857 Massachusetts 735 32 421 33 1,053 44 215 6 2 1 23 6858 California 1,694 75 1,123 26 889 27 137 5 1 1 19 4859 Kentucky 1,275 59 1,903 36 1,251 40 410 9 1 0 20 3860 Connecticut 2,095 80 2,738 23 1,985 64 234 5 1 1 45 1862 New Jersey 430 23 306 37 858 43 236 5 2 1 18 5863 Florida 751 43 1,178 32 971 42 447 8 2 1 23 6864 South Carolina 1,327 152 1,972 36 1,660 61 392 5 2 1 17 4865 Tennessee 955 85 1,021 29 1,227 42 182 6 2 1 29 4870 Arkansas 782 35 3,735 40 1,134 43 1,041 6 1 0 50 2872 Illinois 352 7 210 20 219 13 259 5 1 0 16 3878 Pennsylvania 113 11 166 20 42 2 55 5 1 1 12 2901 Tennessee 1,389 80 920 30 1,711 72 150 6 2 1 8 5903 Texas 1,237 58 3,146 48 1,645 55 645 9 0 0 10 1904 Florida 1,589 134 1,220 27 1,889 70 255 6 3 1 24 4906 Michigan 280 5 2,060 24 305 8 569 6 0 0 8 1907 Alaska 917 23 2,902 28 847 40 1,227 12 0 0 0 0908 New Jersey 1,653 69 2,215 40 1,696 43 463 5 1 1 17 3909 California 1,981 53 1,613 36 2,384 108 376 6 2 1 18 1910 North Carolina 1,555 75 2,528 37 1,710 69 483 6 2 1 44 4912 Georgia 883 43 1,614 37 1,220 52 676 8 2 1 34 5913 Kansas 1,370 46 1,313 37 1,364 41 185 6 1 1 17 4914 New York 2,014 97 1,521 40 1,426 44 528 5 1 0 19 2915 Texas 832 15 615 24 1,075 42 177 6 0 0 2 1916 California 2,426 57 1,910 35 2,273 87 183 5 2 1 16 4917 New York 1,234 34 287 30 3,651 98 269 5 0 0 4 4918 Oklahoma 1,460 46 3,122 51 1,753 76 776 9 1 1 43 1919 North Carolina 2,321 158 1,864 36 2,223 71 248 6 1 1 1 2920 Wisconsin 1,482 32 2,603 46 1,480 44 748 9 2 1 17 3925 California 1,785 42 1,855 31 1,303 41 227 5 1 1 16 1928 Arizona 1,186 23 1,659 38 1,037 51 509 7 2 1 25 3929 New York 802 29 465 25 1,337 115 299 6 3 1 17 3930 Indiana 8 1 61 5 8 0 1 1 0 0 20 2931 Tennessee 706 28 2,058 39 1,040 37 466 8 1 1 22 1934 New York 19 0 38 4 17 2 19 6 1 0 7 1936 Texas 628 26 1,465 32 691 26 279 7 1 1 16 1937 Ohio 1,706 43 2,842 37 1,774 56 468 6 2 2 53 4938 Alabama 31 0 63 6 1 0 2 2 1 1 10 2939 Puerto Rico 37 2 316 7 1,067 98 552 5 20 0 3 1940 Texas 609 22 1,978 48 660 20 499 7 1 1 16 3941 Florida 997 60 1,140 32 988 35 187 6 1 1 11 3947 Michigan 57 1 102 13 549 11 204 5 0 0 0 0949 California 2,124 87 1,308 33 1,591 47 214 5 3 1 5 4951 California 1,562 50 1,202 33 1,998 88 290 5 2 1 17 1952 Minnesota 1,473 32 902 36 476 11 69 5 0 0 0 1954 Florida 1,956 139 1,375 34 2,065 79 154 5 2 0 1 3956 Texas 1,041 26 1,353 29 2,022 83 901 5 1 0 31 3959 Connecticut 64 1 73 10 29 3 42 5 3 1 14 3970 Colorado 1,619 67 2,359 49 1,368 38 603 10 6 1 52 2971 Oregon 620 53 418 27 829 36 219 5 2 1 10 5972 Texas 3,160 64 2,830 44 1,077 24 77 5 2 1 4 2973 New Jersey 2,858 125 2,462 43 1,644 43 240 6 2 1 11 2978 Massachusetts 2,477 130 2,877 32 1,567 46 287 5 1 1 50 2979 Texas 572 10 1,405 39 644 21 271 7 1 1 36 3980 North Carolina 727 46 461 30 686 37 258 5 1 1 34 4984 North Carolina 320 11 289 24 184 10 95 5 2 1 20 3985 Louisiana 623 31 1,582 27 837 32 408 6 1 2 32 1986 Idaho 5 0 5 3 3 0 8 1 0 0 0 1989 Michigan 961 20 3,052 39 1,248 36 671 6 0 0 10 2
Note: The Commission has found “that aggregated data (such as each carrier’s NPA wide utilization rate and number of NXXs assigned)” are not confidential. Numbering Resource Optimization, Report and Order and Further Notice of Proposed Rulemaking, CC Docket No. 99-200, 15 FCC Rcd 7574, 7607-08, para. 79 (2000).
Source: Numbering Resource Utilization/Forecast Reports data filed with Somos, Inc. through May 17, 2019.
U.S. Federal Communications Commission 21 Numbering Resource Utilization in the United States
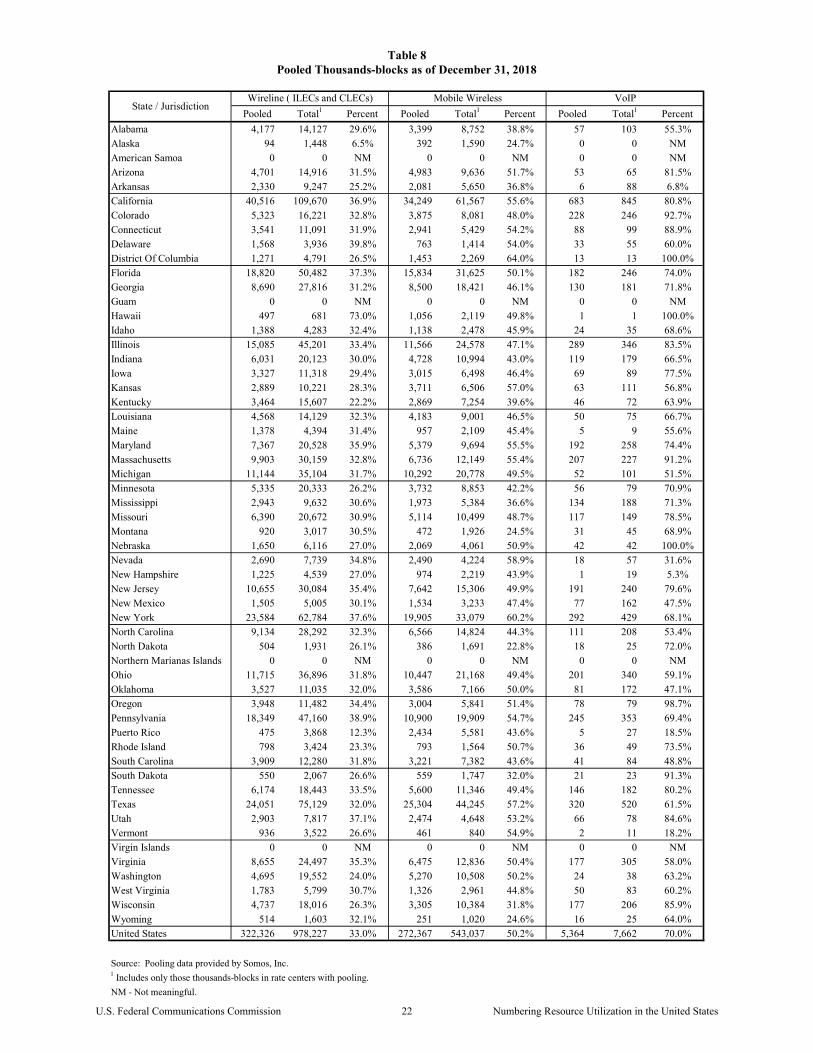
Pooled Total1 Percent Pooled Total1 Percent Pooled Total1 Percent
Alabama 4,177 14,127 29.6% 3,399 8,752 38.8% 57 103 55.3%
Alaska 94 1,448 6.5% 392 1,590 24.7% 0 0 NM
American Samoa 0 0 NM 0 0 NM 0 0 NM
Arizona 4,701 14,916 31.5% 4,983 9,636 51.7% 53 65 81.5%
Arkansas 2,330 9,247 25.2% 2,081 5,650 36.8% 6 88 6.8%
California 40,516 109,670 36.9% 34,249 61,567 55.6% 683 845 80.8%
Colorado 5,323 16,221 32.8% 3,875 8,081 48.0% 228 246 92.7%
Connecticut 3,541 11,091 31.9% 2,941 5,429 54.2% 88 99 88.9%
Delaware 1,568 3,936 39.8% 763 1,414 54.0% 33 55 60.0%
District Of Columbia 1,271 4,791 26.5% 1,453 2,269 64.0% 13 13 100.0%
Florida 18,820 50,482 37.3% 15,834 31,625 50.1% 182 246 74.0%
Georgia 8,690 27,816 31.2% 8,500 18,421 46.1% 130 181 71.8%
Guam 0 0 NM 0 0 NM 0 0 NM
Hawaii 497 681 73.0% 1,056 2,119 49.8% 1 1 100.0%
Idaho 1,388 4,283 32.4% 1,138 2,478 45.9% 24 35 68.6%
Illinois 15,085 45,201 33.4% 11,566 24,578 47.1% 289 346 83.5%
Indiana 6,031 20,123 30.0% 4,728 10,994 43.0% 119 179 66.5%
Iowa 3,327 11,318 29.4% 3,015 6,498 46.4% 69 89 77.5%
Kansas 2,889 10,221 28.3% 3,711 6,506 57.0% 63 111 56.8%
Kentucky 3,464 15,607 22.2% 2,869 7,254 39.6% 46 72 63.9%
Louisiana 4,568 14,129 32.3% 4,183 9,001 46.5% 50 75 66.7%
Maine 1,378 4,394 31.4% 957 2,109 45.4% 5 9 55.6%
Maryland 7,367 20,528 35.9% 5,379 9,694 55.5% 192 258 74.4%
Massachusetts 9,903 30,159 32.8% 6,736 12,149 55.4% 207 227 91.2%
Michigan 11,144 35,104 31.7% 10,292 20,778 49.5% 52 101 51.5%
Minnesota 5,335 20,333 26.2% 3,732 8,853 42.2% 56 79 70.9%
Mississippi 2,943 9,632 30.6% 1,973 5,384 36.6% 134 188 71.3%
Missouri 6,390 20,672 30.9% 5,114 10,499 48.7% 117 149 78.5%
Montana 920 3,017 30.5% 472 1,926 24.5% 31 45 68.9%
Nebraska 1,650 6,116 27.0% 2,069 4,061 50.9% 42 42 100.0%
Nevada 2,690 7,739 34.8% 2,490 4,224 58.9% 18 57 31.6%
New Hampshire 1,225 4,539 27.0% 974 2,219 43.9% 1 19 5.3%
New Jersey 10,655 30,084 35.4% 7,642 15,306 49.9% 191 240 79.6%
New Mexico 1,505 5,005 30.1% 1,534 3,233 47.4% 77 162 47.5%
New York 23,584 62,784 37.6% 19,905 33,079 60.2% 292 429 68.1%
North Carolina 9,134 28,292 32.3% 6,566 14,824 44.3% 111 208 53.4%
North Dakota 504 1,931 26.1% 386 1,691 22.8% 18 25 72.0%
Northern Marianas Islands 0 0 NM 0 0 NM 0 0 NM
Ohio 11,715 36,896 31.8% 10,447 21,168 49.4% 201 340 59.1%
Oklahoma 3,527 11,035 32.0% 3,586 7,166 50.0% 81 172 47.1%
Oregon 3,948 11,482 34.4% 3,004 5,841 51.4% 78 79 98.7%
Pennsylvania 18,349 47,160 38.9% 10,900 19,909 54.7% 245 353 69.4%
Puerto Rico 475 3,868 12.3% 2,434 5,581 43.6% 5 27 18.5%
Rhode Island 798 3,424 23.3% 793 1,564 50.7% 36 49 73.5%
South Carolina 3,909 12,280 31.8% 3,221 7,382 43.6% 41 84 48.8%
South Dakota 550 2,067 26.6% 559 1,747 32.0% 21 23 91.3%
Tennessee 6,174 18,443 33.5% 5,600 11,346 49.4% 146 182 80.2%
Texas 24,051 75,129 32.0% 25,304 44,245 57.2% 320 520 61.5%
Utah 2,903 7,817 37.1% 2,474 4,648 53.2% 66 78 84.6%
Vermont 936 3,522 26.6% 461 840 54.9% 2 11 18.2%
Virgin Islands 0 0 NM 0 0 NM 0 0 NM
Virginia 8,655 24,497 35.3% 6,475 12,836 50.4% 177 305 58.0%
Washington 4,695 19,552 24.0% 5,270 10,508 50.2% 24 38 63.2%
West Virginia 1,783 5,799 30.7% 1,326 2,961 44.8% 50 83 60.2%
Wisconsin 4,737 18,016 26.3% 3,305 10,384 31.8% 177 206 85.9%
Wyoming 514 1,603 32.1% 251 1,020 24.6% 16 25 64.0%
United States 322,326 978,227 33.0% 272,367 543,037 50.2% 5,364 7,662 70.0%
Source: Pooling data provided by Somos, Inc. 1 Includes only those thousands-blocks in rate centers with pooling.
NM - Not meaningful.
VoIP
Table 8Pooled Thousands-blocks as of December 31, 2018
State / JurisdictionWireline ( ILECs and CLECs) Mobile Wireless
U.S. Federal Communications Commission 22 Numbering Resource Utilization in the United States
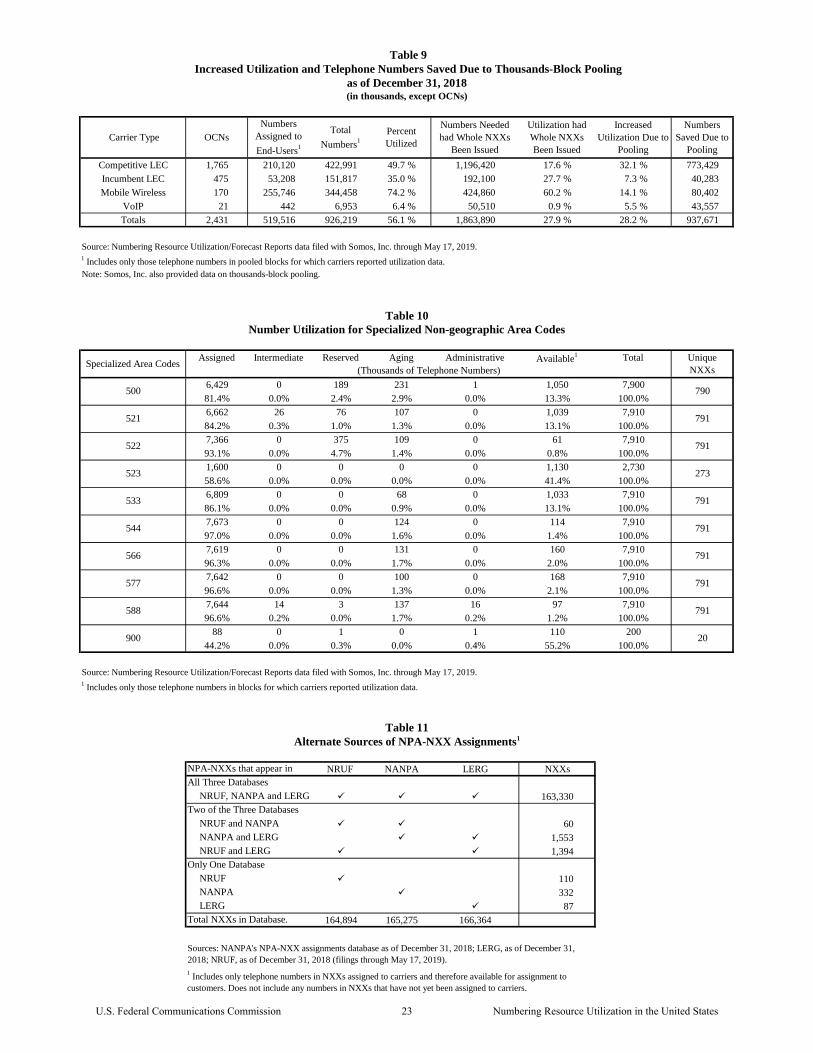
Competitive LEC 1,765 210,120 422,991 49.7 % 1,196,420 17.6 % 32.1 % 773,429
Incumbent LEC 475 53,208 151,817 35.0 % 192,100 27.7 % 7.3 % 40,283
Mobile Wireless 170 255,746 344,458 74.2 % 424,860 60.2 % 14.1 % 80,402
VoIP 21 442 6,953 6.4 % 50,510 0.9 % 5.5 % 43,557
Totals 2,431 519,516 926,219 56.1 % 1,863,890 27.9 % 28.2 % 937,671
Assigned Intermediate Reserved Aging Administrative Available1 Total
6,429 0 189 231 1 1,050 7,900
81.4% 0.0% 2.4% 2.9% 0.0% 13.3% 100.0%
6,662 26 76 107 0 1,039 7,910
84.2% 0.3% 1.0% 1.3% 0.0% 13.1% 100.0%
7,366 0 375 109 0 61 7,910
93.1% 0.0% 4.7% 1.4% 0.0% 0.8% 100.0%
1,600 0 0 0 0 1,130 2,730
58.6% 0.0% 0.0% 0.0% 0.0% 41.4% 100.0%
6,809 0 0 68 0 1,033 7,910
86.1% 0.0% 0.0% 0.9% 0.0% 13.1% 100.0%
7,673 0 0 124 0 114 7,910
97.0% 0.0% 0.0% 1.6% 0.0% 1.4% 100.0%
7,619 0 0 131 0 160 7,910
96.3% 0.0% 0.0% 1.7% 0.0% 2.0% 100.0%
7,642 0 0 100 0 168 7,910
96.6% 0.0% 0.0% 1.3% 0.0% 2.1% 100.0%
7,644 14 3 137 16 97 7,910
96.6% 0.2% 0.0% 1.7% 0.2% 1.2% 100.0%
88 0 1 0 1 110 200
44.2% 0.0% 0.3% 0.0% 0.4% 55.2% 100.0%
NRUF NANPA LERG NXXs
163,330
60
1,553
1,394
110
332
87
164,894 165,275 166,364
588 791
521 791
544 791
566 791
577 791
522 791
523 273
533 791
Sources: NANPA's NPA-NXX assignments database as of December 31, 2018; LERG, as of December 31,
2018; NRUF, as of December 31, 2018 (filings through May 17, 2019).
Only One Database
NRUF
NANPA
LERG
Total NXXs in Database.
Total
Numbers1
Two of the Three Databases
NRUF and NANPA
NANPA and LERG
NRUF and LERG
900
Table 10
Number Utilization for Specialized Non-geographic Area Codes
Numbers
Saved Due to
Pooling
Increased
Utilization Due to
Pooling
Utilization had
Whole NXXs
Been Issued
Carrier Type
1 Includes only those telephone numbers in pooled blocks for which carriers reported utilization data.
Source: Numbering Resource Utilization/Forecast Reports data filed with Somos, Inc. through May 17, 2019.
Note: Somos, Inc. also provided data on thousands-block pooling.
Percent
Utilized
Numbers Needed
had Whole NXXs
Been Issued
OCNs
Numbers
Assigned to
End-Users1
1 Includes only telephone numbers in NXXs assigned to carriers and therefore available for assignment to
customers. Does not include any numbers in NXXs that have not yet been assigned to carriers.
Table 9
Increased Utilization and Telephone Numbers Saved Due to Thousands-Block Pooling as of December 31, 2018(in thousands, except OCNs)
Specialized Area Codes(Thousands of Telephone Numbers)
Unique
NXXs
NPA-NXXs that appear in
All Three Databases
NRUF, NANPA and LERG
790
20
Table 11
Alternate Sources of NPA-NXX Assignments1
1 Includes only those telephone numbers in blocks for which carriers reported utilization data.
Source: Numbering Resource Utilization/Forecast Reports data filed with Somos, Inc. through May 17, 2019.
500
U.S. Federal Communications Commission 23 Numbering Resource Utilization in the United States
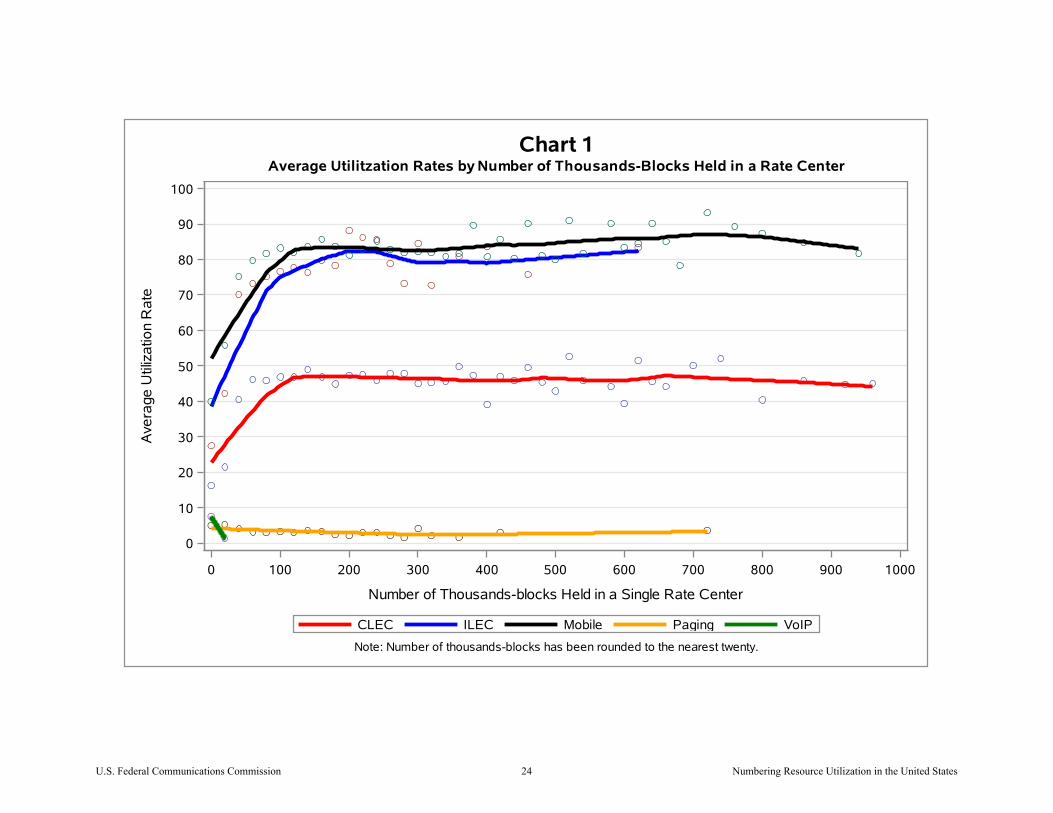
0
10
20
30
40
50
60
70
80
90
100
Ave
rage
Util
iza
tion
Ra
te
0 100 200 300 400 500 600 700 800 900 1000
Number of Thousands-blocks Held in a Single Rate Center
VoIPPagingMobileILECCLEC
Chart 1Average Utilitzation Rates by Number of Thousands-Blocks Held in a Rate Center
Note: Number of thousands-blocks has been rounded to the nearest twenty.
U.S. Federal Communications Commission 24 Numbering Resource Utilization in the United States
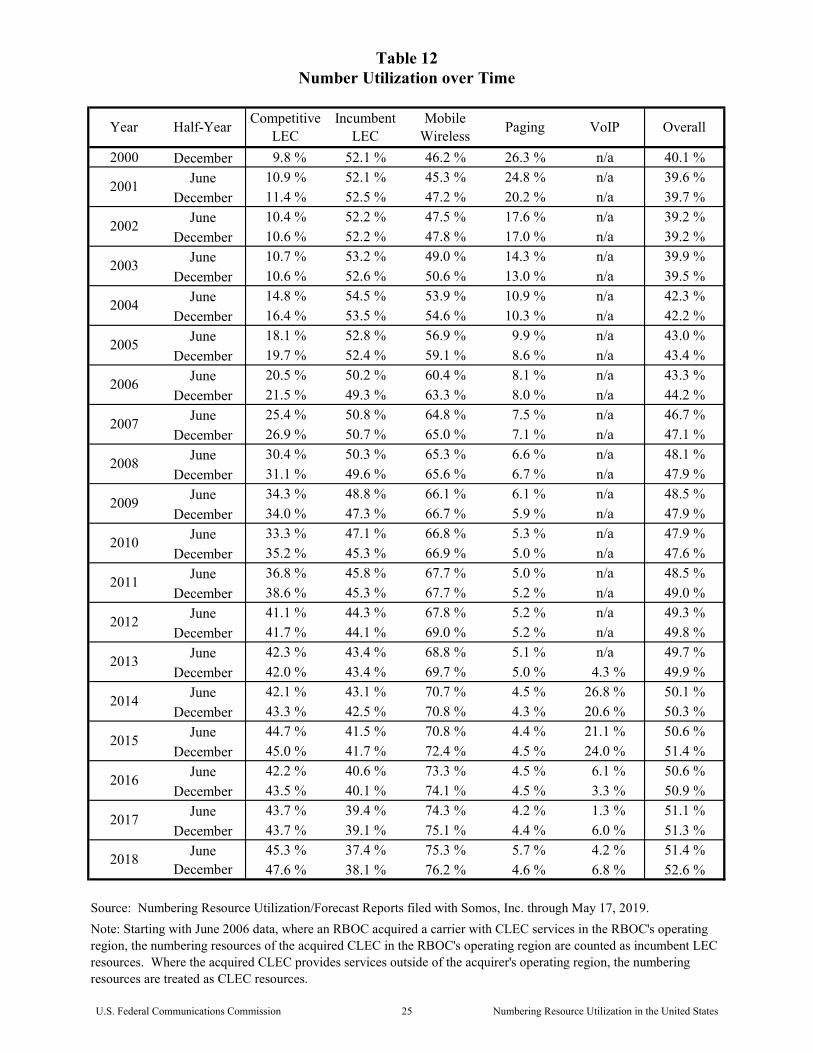
2000 December 9.8 % 52.1 % 46.2 % 26.3 % n/a 40.1 %
June 10.9 % 52.1 % 45.3 % 24.8 % n/a 39.6 %
December 11.4 % 52.5 % 47.2 % 20.2 % n/a 39.7 %
June 10.4 % 52.2 % 47.5 % 17.6 % n/a 39.2 %
December 10.6 % 52.2 % 47.8 % 17.0 % n/a 39.2 %
June 10.7 % 53.2 % 49.0 % 14.3 % n/a 39.9 %
December 10.6 % 52.6 % 50.6 % 13.0 % n/a 39.5 %
June 14.8 % 54.5 % 53.9 % 10.9 % n/a 42.3 %
December 16.4 % 53.5 % 54.6 % 10.3 % n/a 42.2 %
June 18.1 % 52.8 % 56.9 % 9.9 % n/a 43.0 %
December 19.7 % 52.4 % 59.1 % 8.6 % n/a 43.4 %
June 20.5 % 50.2 % 60.4 % 8.1 % n/a 43.3 %
December 21.5 % 49.3 % 63.3 % 8.0 % n/a 44.2 %
June 25.4 % 50.8 % 64.8 % 7.5 % n/a 46.7 %
December 26.9 % 50.7 % 65.0 % 7.1 % n/a 47.1 %
June 30.4 % 50.3 % 65.3 % 6.6 % n/a 48.1 %
December 31.1 % 49.6 % 65.6 % 6.7 % n/a 47.9 %
June 34.3 % 48.8 % 66.1 % 6.1 % n/a 48.5 %
December 34.0 % 47.3 % 66.7 % 5.9 % n/a 47.9 %
June 33.3 % 47.1 % 66.8 % 5.3 % n/a 47.9 %
December 35.2 % 45.3 % 66.9 % 5.0 % n/a 47.6 %
June 36.8 % 45.8 % 67.7 % 5.0 % n/a 48.5 %
December 38.6 % 45.3 % 67.7 % 5.2 % n/a 49.0 %
June 41.1 % 44.3 % 67.8 % 5.2 % n/a 49.3 %
December 41.7 % 44.1 % 69.0 % 5.2 % n/a 49.8 %
June 42.3 % 43.4 % 68.8 % 5.1 % n/a 49.7 %
December 42.0 % 43.4 % 69.7 % 5.0 % 4.3 % 49.9 %
June 42.1 % 43.1 % 70.7 % 4.5 % 26.8 % 50.1 %
December 43.3 % 42.5 % 70.8 % 4.3 % 20.6 % 50.3 %
June 44.7 % 41.5 % 70.8 % 4.4 % 21.1 % 50.6 %
December 45.0 % 41.7 % 72.4 % 4.5 % 24.0 % 51.4 %
June 42.2 % 40.6 % 73.3 % 4.5 % 6.1 % 50.6 %
December 43.5 % 40.1 % 74.1 % 4.5 % 3.3 % 50.9 %
June 43.7 % 39.4 % 74.3 % 4.2 % 1.3 % 51.1 %
December 43.7 % 39.1 % 75.1 % 4.4 % 6.0 % 51.3 %
June 45.3 % 37.4 % 75.3 % 5.7 % 4.2 % 51.4 %December 47.6 % 38.1 % 76.2 % 4.6 % 6.8 % 52.6 %
2015
2016
2018
2010
2011
2012
2013
2014
2017
2005
2006
2007
2008
2009
Note: Starting with June 2006 data, where an RBOC acquired a carrier with CLEC services in the RBOC's operating region, the numbering resources of the acquired CLEC in the RBOC's operating region are counted as incumbent LEC resources. Where the acquired CLEC provides services outside of the acquirer's operating region, the numbering resources are treated as CLEC resources.
Source: Numbering Resource Utilization/Forecast Reports filed with Somos, Inc. through May 17, 2019.
Table 12Number Utilization over Time
Year Half-YearCompetitive
LECIncumbent
LECMobile
WirelessPaging VoIP Overall
2001
2002
2003
2004
U.S. Federal Communications Commission 25 Numbering Resource Utilization in the United States
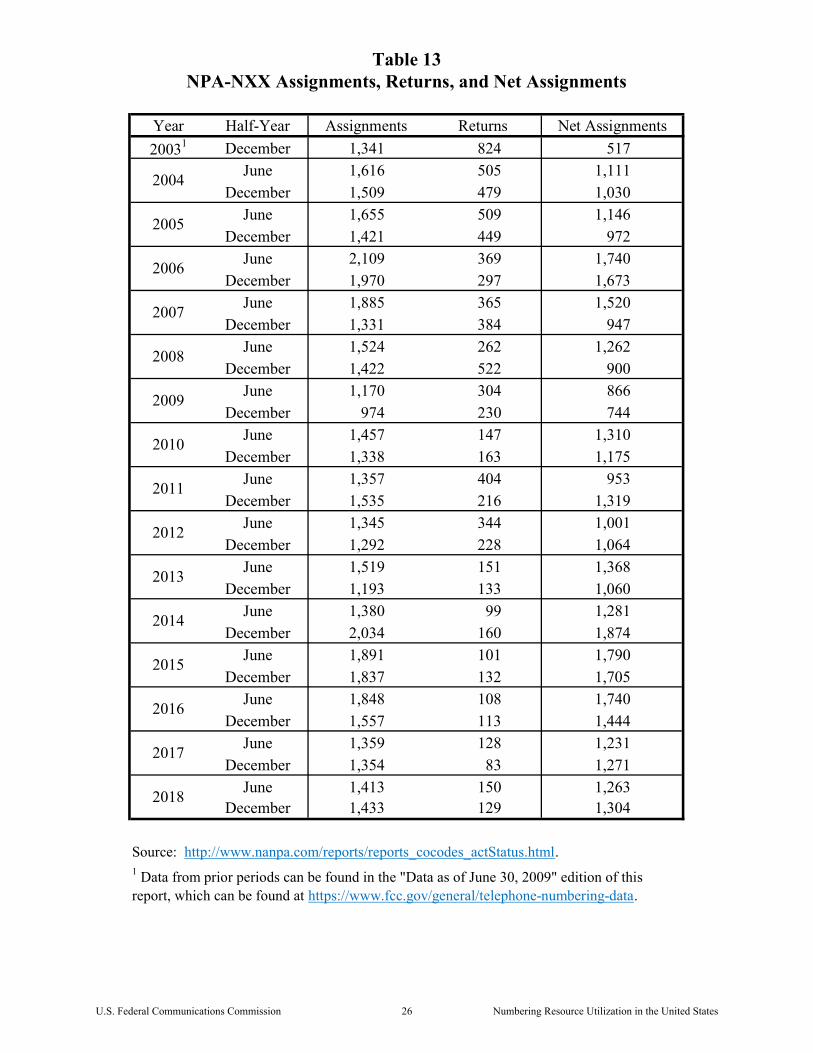
Year Half-Year Assignments Returns Net Assignments
20031 December 1,341 824 517June 1,616 505 1,111
December 1,509 479 1,030June 1,655 509 1,146
December 1,421 449 972June 2,109 369 1,740
December 1,970 297 1,673June 1,885 365 1,520
December 1,331 384 947June 1,524 262 1,262
December 1,422 522 900June 1,170 304 866
December 974 230 744June 1,457 147 1,310
December 1,338 163 1,175June 1,357 404 953
December 1,535 216 1,319June 1,345 344 1,001
December 1,292 228 1,064June 1,519 151 1,368
December 1,193 133 1,060June 1,380 99 1,281
December 2,034 160 1,874June 1,891 101 1,790
December 1,837 132 1,705June 1,848 108 1,740
December 1,557 113 1,444June 1,359 128 1,231
December 1,354 83 1,271June 1,413 150 1,263
December 1,433 129 1,304
1 Data from prior periods can be found in the "Data as of June 30, 2009" edition of this report, which can be found at https://www.fcc.gov/general/telephone-numbering-data.
Table 13NPA-NXX Assignments, Returns, and Net Assignments
2004
2005
2006
2012
2013
2014
2007
2008
2009
2010
2011
2015
2017
2018
Source: http://www.nanpa.com/reports/reports_cocodes_actStatus.html.
2016
U.S. Federal Communications Commission 26 Numbering Resource Utilization in the United States
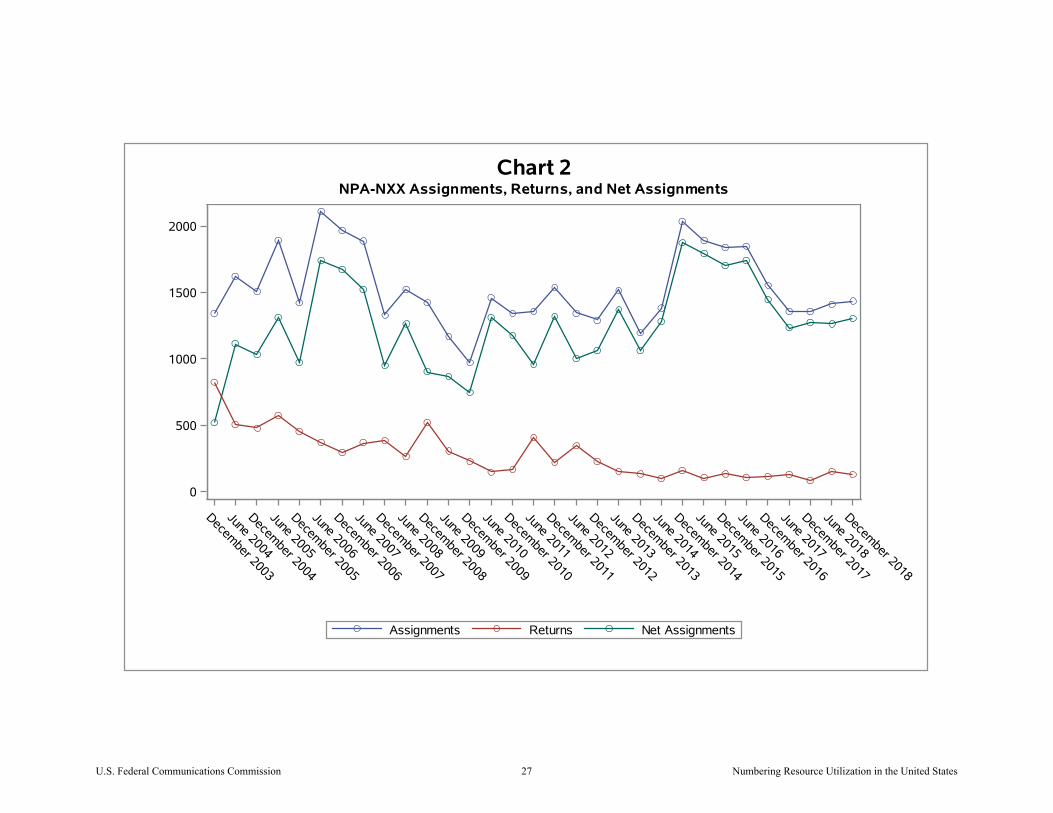
December 2003
June 2004
December 2004
June 2005
December 2005
June 2006
December 2006
June 2007
December 2007
June 2008
December 2008
June 2009
December 2009
June 2010
December 2010
June 2011
December 2011
June 2012
December 2012
June 2013
December 2013
June 2014
December 2014
June 2015
December 2015
June 2016
December 2016
June 2017
December 2017
June 2018
December 2018
0
500
1000
1500
2000
Net AssignmentsReturnsAssignments
Chart 2NPA-NXX Assignments, Returns, and Net Assignments
U.S. Federal Communications Commission 27 Numbering Resource Utilization in the United States
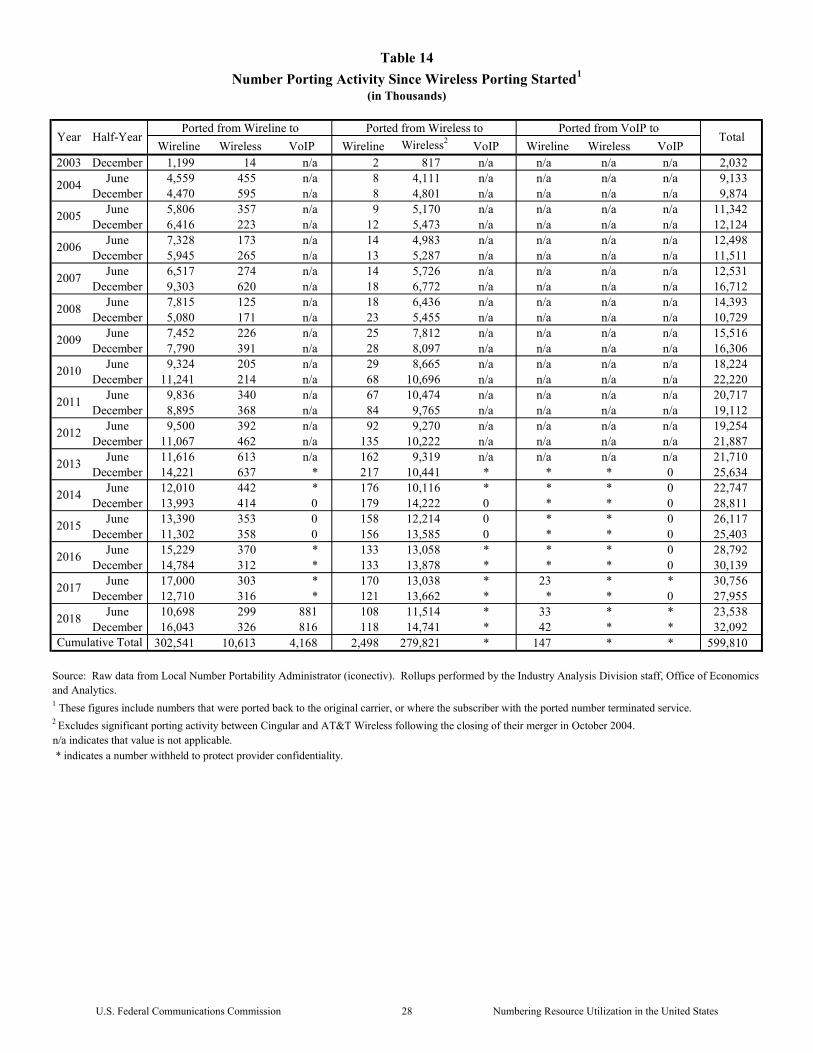
Wireline Wireless VoIP Wireline Wireless2VoIP Wireline Wireless VoIP
2003 December 1,199 14 n/a 2 817 n/a n/a n/a n/a 2,032June 4,559 455 n/a 8 4,111 n/a n/a n/a n/a 9,133
December 4,470 595 n/a 8 4,801 n/a n/a n/a n/a 9,874June 5,806 357 n/a 9 5,170 n/a n/a n/a n/a 11,342
December 6,416 223 n/a 12 5,473 n/a n/a n/a n/a 12,124June 7,328 173 n/a 14 4,983 n/a n/a n/a n/a 12,498
December 5,945 265 n/a 13 5,287 n/a n/a n/a n/a 11,511June 6,517 274 n/a 14 5,726 n/a n/a n/a n/a 12,531
December 9,303 620 n/a 18 6,772 n/a n/a n/a n/a 16,712June 7,815 125 n/a 18 6,436 n/a n/a n/a n/a 14,393
December 5,080 171 n/a 23 5,455 n/a n/a n/a n/a 10,729June 7,452 226 n/a 25 7,812 n/a n/a n/a n/a 15,516
December 7,790 391 n/a 28 8,097 n/a n/a n/a n/a 16,306June 9,324 205 n/a 29 8,665 n/a n/a n/a n/a 18,224
December 11,241 214 n/a 68 10,696 n/a n/a n/a n/a 22,220June 9,836 340 n/a 67 10,474 n/a n/a n/a n/a 20,717
December 8,895 368 n/a 84 9,765 n/a n/a n/a n/a 19,112June 9,500 392 n/a 92 9,270 n/a n/a n/a n/a 19,254
December 11,067 462 n/a 135 10,222 n/a n/a n/a n/a 21,887June 11,616 613 n/a 162 9,319 n/a n/a n/a n/a 21,710
December 14,221 637 * 217 10,441 * * * 0 25,634June 12,010 442 * 176 10,116 * * * 0 22,747
December 13,993 414 0 179 14,222 0 * * 0 28,811June 13,390 353 0 158 12,214 0 * * 0 26,117
December 11,302 358 0 156 13,585 0 * * 0 25,403June 15,229 370 * 133 13,058 * * * 0 28,792
December 14,784 312 * 133 13,878 * * * 0 30,139June 17,000 303 * 170 13,038 * 23 * * 30,756
December 12,710 316 * 121 13,662 * * * 0 27,955June 10,698 299 881 108 11,514 * 33 * * 23,538
December 16,043 326 816 118 14,741 * 42 * * 32,092302,541 10,613 4,168 2,498 279,821 * 147 * * 599,810
* indicates a number withheld to protect provider confidentiality.
Table 14
Number Porting Activity Since Wireless Porting Started1
(in Thousands)
Source: Raw data from Local Number Portability Administrator (iconectiv). Rollups performed by the Industry Analysis Division staff, Office of Economics and Analytics.
TotalYear Half-Year
2013
2014
2015
2016
2017
n/a indicates that value is not applicable.
Ported from Wireline to Ported from Wireless to Ported from VoIP to
2 Excludes significant porting activity between Cingular and AT&T Wireless following the closing of their merger in October 2004.
Cumulative Total
1 These figures include numbers that were ported back to the original carrier, or where the subscriber with the ported number terminated service.
2004
2005
2006
2007
2008
2009
2010
2011
2012
2018
U.S. Federal Communications Commission 28 Numbering Resource Utilization in the United States
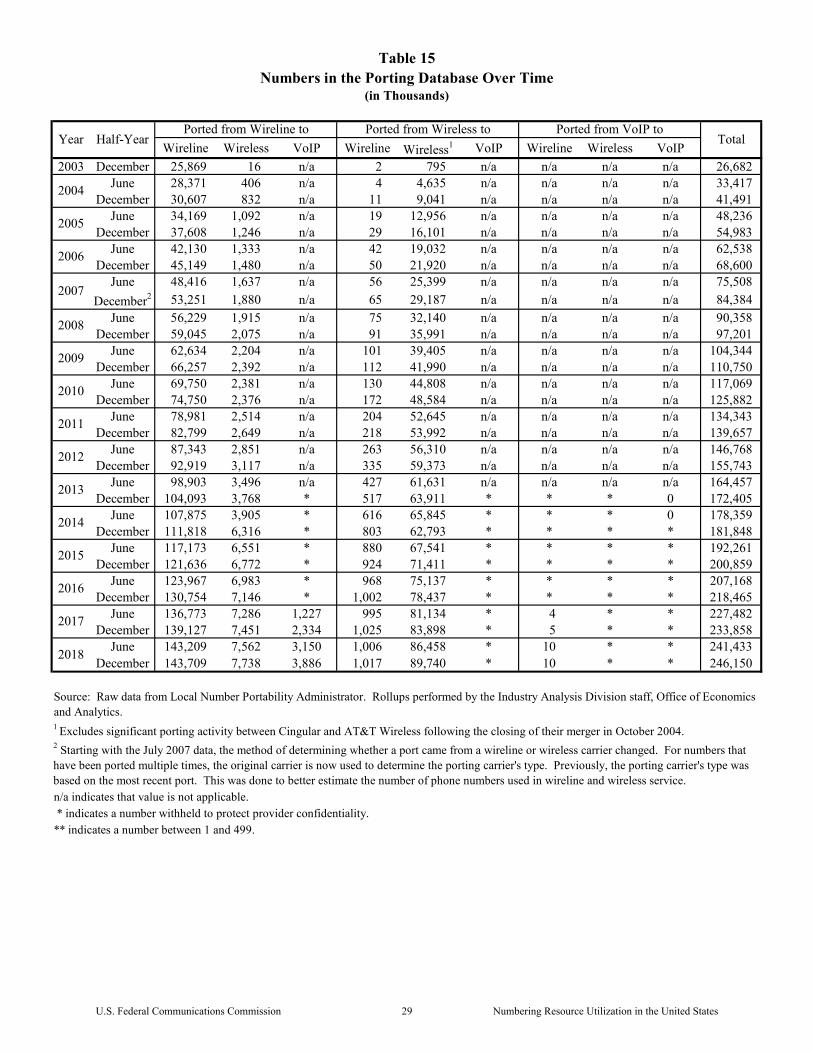
Wireline Wireless VoIP Wireline Wireless1 VoIP Wireline Wireless VoIP
2003 December 25,869 16 n/a 2 795 n/a n/a n/a n/a 26,682June 28,371 406 n/a 4 4,635 n/a n/a n/a n/a 33,417
December 30,607 832 n/a 11 9,041 n/a n/a n/a n/a 41,491June 34,169 1,092 n/a 19 12,956 n/a n/a n/a n/a 48,236
December 37,608 1,246 n/a 29 16,101 n/a n/a n/a n/a 54,983June 42,130 1,333 n/a 42 19,032 n/a n/a n/a n/a 62,538
December 45,149 1,480 n/a 50 21,920 n/a n/a n/a n/a 68,600June 48,416 1,637 n/a 56 25,399 n/a n/a n/a n/a 75,508
December2 53,251 1,880 n/a 65 29,187 n/a n/a n/a n/a 84,384June 56,229 1,915 n/a 75 32,140 n/a n/a n/a n/a 90,358
December 59,045 2,075 n/a 91 35,991 n/a n/a n/a n/a 97,201June 62,634 2,204 n/a 101 39,405 n/a n/a n/a n/a 104,344
December 66,257 2,392 n/a 112 41,990 n/a n/a n/a n/a 110,750June 69,750 2,381 n/a 130 44,808 n/a n/a n/a n/a 117,069
December 74,750 2,376 n/a 172 48,584 n/a n/a n/a n/a 125,882June 78,981 2,514 n/a 204 52,645 n/a n/a n/a n/a 134,343
December 82,799 2,649 n/a 218 53,992 n/a n/a n/a n/a 139,657June 87,343 2,851 n/a 263 56,310 n/a n/a n/a n/a 146,768
December 92,919 3,117 n/a 335 59,373 n/a n/a n/a n/a 155,743June 98,903 3,496 n/a 427 61,631 n/a n/a n/a n/a 164,457
December 104,093 3,768 * 517 63,911 * * * 0 172,405June 107,875 3,905 * 616 65,845 * * * 0 178,359
December 111,818 6,316 * 803 62,793 * * * * 181,848June 117,173 6,551 * 880 67,541 * * * * 192,261
December 121,636 6,772 * 924 71,411 * * * * 200,859June 123,967 6,983 * 968 75,137 * * * * 207,168
December 130,754 7,146 * 1,002 78,437 * * * * 218,465June 136,773 7,286 1,227 995 81,134 * 4 * * 227,482
December 139,127 7,451 2,334 1,025 83,898 * 5 * * 233,858June 143,209 7,562 3,150 1,006 86,458 * 10 * * 241,433
December 143,709 7,738 3,886 1,017 89,740 * 10 * * 246,150
Table 15Numbers in the Porting Database Over Time
(in Thousands)
TotalYear Half-YearPorted from Wireline to Ported from Wireless to Ported from VoIP to
2006
2005
2004
2017
2016
2014
2013
2012
2011
2010
2009
2008
2007
** indicates a number between 1 and 499.* indicates a number withheld to protect provider confidentiality.
Source: Raw data from Local Number Portability Administrator. Rollups performed by the Industry Analysis Division staff, Office of Economics and Analytics.
n/a indicates that value is not applicable.
2015
2 Starting with the July 2007 data, the method of determining whether a port came from a wireline or wireless carrier changed. For numbers that have been ported multiple times, the original carrier is now used to determine the porting carrier's type. Previously, the porting carrier's type was based on the most recent port. This was done to better estimate the number of phone numbers used in wireline and wireless service.
1 Excludes significant porting activity between Cingular and AT&T Wireless following the closing of their merger in October 2004.
2018
U.S. Federal Communications Commission 29 Numbering Resource Utilization in the United States

Wireline Wireless VoIP Wireline Wireless3VoIP Wireline Wireless VoIP
2003 December 719 5 n/a 3 158 n/a n/a n/a n/a 885June 718 93 n/a 4 718 n/a n/a n/a n/a 1,535
December 998 131 n/a 4 899 n/a n/a n/a n/a 2,031June 945 80 n/a 5 900 n/a n/a n/a n/a 1,931
December 1,107 84 n/a 4 1,077 n/a n/a n/a n/a 2,272June 1,182 62 n/a 5 1,013 n/a n/a n/a n/a 2,262
December 1,096 113 n/a 6 1,170 n/a n/a n/a n/a 2,385June 1,155 120 n/a 5 1,027 n/a n/a n/a n/a 2,307
December 1,380 235 n/a 8 1,286 n/a n/a n/a n/a 2,908June 1,538 75 n/a 10 1,162 n/a n/a n/a n/a 2,785
December 1,574 109 n/a 6 1,706 n/a n/a n/a n/a 3,395June 1,621 109 n/a 6 1,571 n/a n/a n/a n/a 3,308
December 1,830 168 n/a 8 1,812 n/a n/a n/a n/a 3,817June 2,044 120 n/a 8 1,475 n/a n/a n/a n/a 3,647
December 2,742 141 n/a 14 1,794 n/a n/a n/a n/a 4,691June 2,842 193 n/a 15 1,913 n/a n/a n/a n/a 4,963
December 3,186 213 n/a 23 1,925 n/a n/a n/a n/a 5,347June 3,625 211 n/a 32 1,671 n/a n/a n/a n/a 5,540
December 4,318 268 n/a 41 2,354 n/a n/a n/a n/a 6,982June 4,505 323 n/a 39 2,331 n/a n/a n/a n/a 7,198
December 5,461 328 * 53 2,741 * * * * 8,668June 5,691 325 * 63 3,086 * * * 0 9,166
December 6,721 386 0 76 4,548 0 * * 0 11,732June 8,572 342 0 73 3,916 0 * * 0 12,904
December 7,489 386 0 68 4,709 0 * * 0 12,653June 9,002 385 * 60 4,711 * ** * 0 14,158
December 11,194 428 * 48 5,661 * 1 * * 18,236June 13,060 463 * 90 6,071 * ** * * 19,880
December 10,822 546 * 75 7,545 * * * * 20,039June 10,176 562 870 71 7,951 * * * * 19,653
December 11,552 732 798 79 10,839 * 1 * * 24,014143,709 7,738 3,886 1,017 89,740 * 10 * * 246,150
Note: Area code splits can cause a number ported from one carrier to another to appear to be ported later than it occurred, as the database record must be updated to reflect the new area code. When this happens, the old porting record disappears from the database.
2018
** indicates a number between 1 and 499.* indicates a number withheld to protect provider confidentiality.n/a indicates that value is not applicable.
Cumulative Total
Source: Raw data from Local Number Portability Administrator as of December 31, 2018. Rollups performed by the Industry Analysis Division staff, Office of Economics and Analytics.
2017
2008
2009
2010
2011
2015
2016
2012
TotalYear
2013
2014
Table 16
Numbers in the Porting Database by Porting Date as of December 31, 2018(in Thousands)
Half-Year
2004
2005
Ported from Wireline to Ported from Wireless to Ported from VoIP to
2007
2006
U.S. Federal Communications Commission 30 Numbering Resource Utilization in the United States
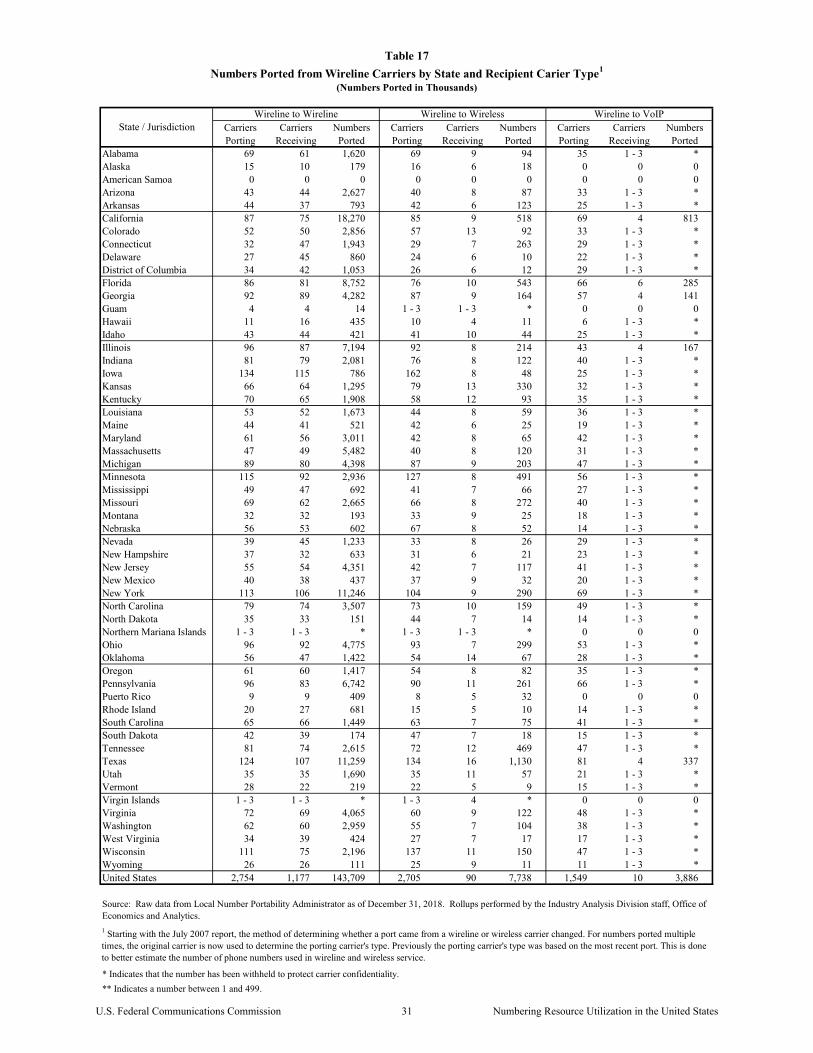
Carriers Carriers Numbers Carriers Carriers Numbers Carriers Carriers NumbersPorting Receiving Ported Porting Receiving Ported Porting Receiving Ported
Alabama 69 61 1,620 69 9 94 35 1 - 3 *Alaska 15 10 179 16 6 18 0 0 0American Samoa 0 0 0 0 0 0 0 0 0Arizona 43 44 2,627 40 8 87 33 1 - 3 *Arkansas 44 37 793 42 6 123 25 1 - 3 *California 87 75 18,270 85 9 518 69 4 813Colorado 52 50 2,856 57 13 92 33 1 - 3 *Connecticut 32 47 1,943 29 7 263 29 1 - 3 *Delaware 27 45 860 24 6 10 22 1 - 3 *District of Columbia 34 42 1,053 26 6 12 29 1 - 3 *Florida 86 81 8,752 76 10 543 66 6 285Georgia 92 89 4,282 87 9 164 57 4 141Guam 4 4 14 1 - 3 1 - 3 * 0 0 0Hawaii 11 16 435 10 4 11 6 1 - 3 *Idaho 43 44 421 41 10 44 25 1 - 3 *Illinois 96 87 7,194 92 8 214 43 4 167Indiana 81 79 2,081 76 8 122 40 1 - 3 *Iowa 134 115 786 162 8 48 25 1 - 3 *Kansas 66 64 1,295 79 13 330 32 1 - 3 *Kentucky 70 65 1,908 58 12 93 35 1 - 3 *Louisiana 53 52 1,673 44 8 59 36 1 - 3 *Maine 44 41 521 42 6 25 19 1 - 3 *Maryland 61 56 3,011 42 8 65 42 1 - 3 *Massachusetts 47 49 5,482 40 8 120 31 1 - 3 *Michigan 89 80 4,398 87 9 203 47 1 - 3 *Minnesota 115 92 2,936 127 8 491 56 1 - 3 *Mississippi 49 47 692 41 7 66 27 1 - 3 *Missouri 69 62 2,665 66 8 272 40 1 - 3 *Montana 32 32 193 33 9 25 18 1 - 3 *Nebraska 56 53 602 67 8 52 14 1 - 3 *Nevada 39 45 1,233 33 8 26 29 1 - 3 *New Hampshire 37 32 633 31 6 21 23 1 - 3 *New Jersey 55 54 4,351 42 7 117 41 1 - 3 *New Mexico 40 38 437 37 9 32 20 1 - 3 *New York 113 106 11,246 104 9 290 69 1 - 3 *North Carolina 79 74 3,507 73 10 159 49 1 - 3 *North Dakota 35 33 151 44 7 14 14 1 - 3 *Northern Mariana Islands 1 - 3 1 - 3 * 1 - 3 1 - 3 * 0 0 0Ohio 96 92 4,775 93 7 299 53 1 - 3 *Oklahoma 56 47 1,422 54 14 67 28 1 - 3 *Oregon 61 60 1,417 54 8 82 35 1 - 3 *Pennsylvania 96 83 6,742 90 11 261 66 1 - 3 *Puerto Rico 9 9 409 8 5 32 0 0 0Rhode Island 20 27 681 15 5 10 14 1 - 3 *South Carolina 65 66 1,449 63 7 75 41 1 - 3 *South Dakota 42 39 174 47 7 18 15 1 - 3 *Tennessee 81 74 2,615 72 12 469 47 1 - 3 *Texas 124 107 11,259 134 16 1,130 81 4 337Utah 35 35 1,690 35 11 57 21 1 - 3 *Vermont 28 22 219 22 5 9 15 1 - 3 *Virgin Islands 1 - 3 1 - 3 * 1 - 3 4 * 0 0 0Virginia 72 69 4,065 60 9 122 48 1 - 3 *Washington 62 60 2,959 55 7 104 38 1 - 3 *West Virginia 34 39 424 27 7 17 17 1 - 3 *Wisconsin 111 75 2,196 137 11 150 47 1 - 3 *Wyoming 26 26 111 25 9 11 11 1 - 3 *United States 2,754 1,177 143,709 2,705 90 7,738 1,549 10 3,886
Source: Raw data from Local Number Portability Administrator as of December 31, 2018. Rollups performed by the Industry Analysis Division staff, Office of Economics and Analytics.
* Indicates that the number has been withheld to protect carrier confidentiality.
** Indicates a number between 1 and 499.
Table 17
(Numbers Ported in Thousands)Numbers Ported from Wireline Carriers by State and Recipient Carier Type1
Wireline to Wireline Wireline to Wireless Wireline to VoIPState / Jurisdiction
1 Starting with the July 2007 report, the method of determining whether a port came from a wireline or wireless carrier changed. For numbers ported multiple times, the original carrier is now used to determine the porting carrier's type. Previously the porting carrier's type was based on the most recent port. This is done to better estimate the number of phone numbers used in wireline and wireless service.
U.S. Federal Communications Commission 31 Numbering Resource Utilization in the United States
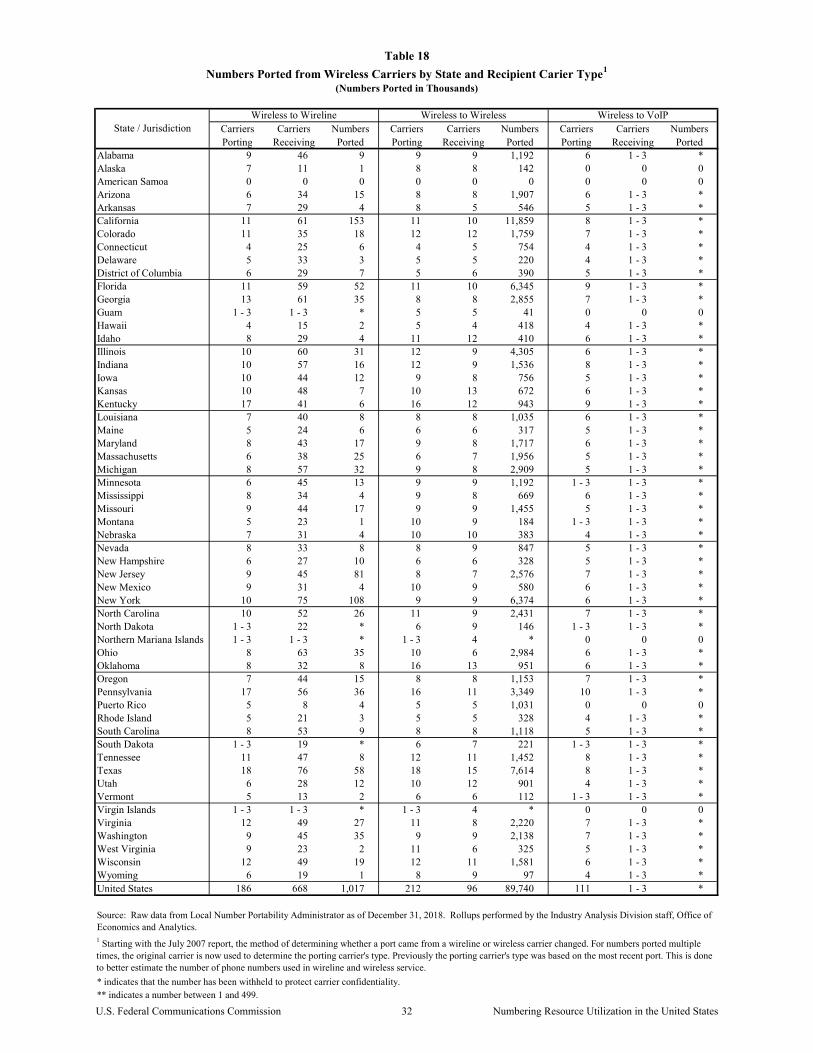
Carriers Carriers Numbers Carriers Carriers Numbers Carriers Carriers NumbersPorting Receiving Ported Porting Receiving Ported Porting Receiving Ported
Alabama 9 46 9 9 9 1,192 6 1 - 3 *Alaska 7 11 1 8 8 142 0 0 0American Samoa 0 0 0 0 0 0 0 0 0Arizona 6 34 15 8 8 1,907 6 1 - 3 *Arkansas 7 29 4 8 5 546 5 1 - 3 *California 11 61 153 11 10 11,859 8 1 - 3 *Colorado 11 35 18 12 12 1,759 7 1 - 3 *Connecticut 4 25 6 4 5 754 4 1 - 3 *Delaware 5 33 3 5 5 220 4 1 - 3 *District of Columbia 6 29 7 5 6 390 5 1 - 3 *Florida 11 59 52 11 10 6,345 9 1 - 3 *Georgia 13 61 35 8 8 2,855 7 1 - 3 *Guam 1 - 3 1 - 3 * 5 5 41 0 0 0Hawaii 4 15 2 5 4 418 4 1 - 3 *Idaho 8 29 4 11 12 410 6 1 - 3 *Illinois 10 60 31 12 9 4,305 6 1 - 3 *Indiana 10 57 16 12 9 1,536 8 1 - 3 *Iowa 10 44 12 9 8 756 5 1 - 3 *Kansas 10 48 7 10 13 672 6 1 - 3 *Kentucky 17 41 6 16 12 943 9 1 - 3 *Louisiana 7 40 8 8 8 1,035 6 1 - 3 *Maine 5 24 6 6 6 317 5 1 - 3 *Maryland 8 43 17 9 8 1,717 6 1 - 3 *Massachusetts 6 38 25 6 7 1,956 5 1 - 3 *Michigan 8 57 32 9 8 2,909 5 1 - 3 *Minnesota 6 45 13 9 9 1,192 1 - 3 1 - 3 *Mississippi 8 34 4 9 8 669 6 1 - 3 *Missouri 9 44 17 9 9 1,455 5 1 - 3 *Montana 5 23 1 10 9 184 1 - 3 1 - 3 *Nebraska 7 31 4 10 10 383 4 1 - 3 *Nevada 8 33 8 8 9 847 5 1 - 3 *New Hampshire 6 27 10 6 6 328 5 1 - 3 *New Jersey 9 45 81 8 7 2,576 7 1 - 3 *New Mexico 9 31 4 10 9 580 6 1 - 3 *New York 10 75 108 9 9 6,374 6 1 - 3 *North Carolina 10 52 26 11 9 2,431 7 1 - 3 *North Dakota 1 - 3 22 * 6 9 146 1 - 3 1 - 3 *Northern Mariana Islands 1 - 3 1 - 3 * 1 - 3 4 * 0 0 0Ohio 8 63 35 10 6 2,984 6 1 - 3 *Oklahoma 8 32 8 16 13 951 6 1 - 3 *Oregon 7 44 15 8 8 1,153 7 1 - 3 *Pennsylvania 17 56 36 16 11 3,349 10 1 - 3 *Puerto Rico 5 8 4 5 5 1,031 0 0 0Rhode Island 5 21 3 5 5 328 4 1 - 3 *South Carolina 8 53 9 8 8 1,118 5 1 - 3 *South Dakota 1 - 3 19 * 6 7 221 1 - 3 1 - 3 *Tennessee 11 47 8 12 11 1,452 8 1 - 3 *Texas 18 76 58 18 15 7,614 8 1 - 3 *Utah 6 28 12 10 12 901 4 1 - 3 *Vermont 5 13 2 6 6 112 1 - 3 1 - 3 *Virgin Islands 1 - 3 1 - 3 * 1 - 3 4 * 0 0 0Virginia 12 49 27 11 8 2,220 7 1 - 3 *Washington 9 45 35 9 9 2,138 7 1 - 3 *West Virginia 9 23 2 11 6 325 5 1 - 3 *Wisconsin 12 49 19 12 11 1,581 6 1 - 3 *Wyoming 6 19 1 8 9 97 4 1 - 3 *United States 186 668 1,017 212 96 89,740 111 1 - 3 *
* indicates that the number has been withheld to protect carrier confidentiality.** indicates a number between 1 and 499.
Source: Raw data from Local Number Portability Administrator as of December 31, 2018. Rollups performed by the Industry Analysis Division staff, Office of Economics and Analytics.
Table 18
Numbers Ported from Wireless Carriers by State and Recipient Carier Type1
(Numbers Ported in Thousands)
State / JurisdictionWireless to Wireline Wireless to Wireless Wireless to VoIP
1 Starting with the July 2007 report, the method of determining whether a port came from a wireline or wireless carrier changed. For numbers ported multiple times, the original carrier is now used to determine the porting carrier's type. Previously the porting carrier's type was based on the most recent port. This is done to better estimate the number of phone numbers used in wireline and wireless service.
U.S. Federal Communications Commission 32 Numbering Resource Utilization in the United States

Carriers Carriers Numbers Carriers Carriers Numbers Carriers Carriers NumbersPorting Receiving Ported Porting Receiving Ported Porting Receiving Ported
Alabama 1 - 3 10 * 1 - 3 4 * 0 0 0Alaska 0 0 0 0 0 0 0 0 0American Samoa 0 0 0 0 0 0 0 0 0Arizona 1 - 3 6 * 1 - 3 1 - 3 * 0 0 0Arkansas 1 - 3 7 * 1 - 3 1 - 3 * 0 0 0California 1 - 3 35 * 1 - 3 8 * 1 - 3 1 - 3 *Colorado 1 - 3 7 * 1 - 3 7 * 1 - 3 1 - 3 *Connecticut 1 - 3 11 * 1 - 3 4 * 0 0 0Delaware 1 - 3 6 * 1 - 3 1 - 3 * 0 0 0District of Columbia 1 - 3 6 * 1 - 3 1 - 3 * 0 0 0Florida 4 15 ** 1 - 3 4 * 1 - 3 1 - 3 *Georgia 1 - 3 16 * 1 - 3 6 * 1 - 3 1 - 3 *Guam 0 0 0 0 0 0 0 0 0Hawaii 0 0 0 0 0 0 0 0 0Idaho 1 - 3 1 - 3 * 1 - 3 1 - 3 * 0 0 0Illinois 1 - 3 18 * 1 - 3 7 * 1 - 3 1 - 3 *Indiana 1 - 3 12 * 1 - 3 4 * 1 - 3 1 - 3 *Iowa 1 - 3 4 * 1 - 3 1 - 3 * 0 0 0Kansas 1 - 3 6 * 1 - 3 8 * 0 0 0Kentucky 1 - 3 1 - 3 * 1 - 3 1 - 3 * 1 - 3 1 - 3 *Louisiana 1 - 3 1 - 3 * 1 - 3 6 * 0 0 0Maine 1 - 3 1 - 3 * 0 0 0 0 0 0Maryland 1 - 3 14 * 1 - 3 1 - 3 * 1 - 3 1 - 3 *Massachusetts 1 - 3 23 * 1 - 3 7 * 1 - 3 1 - 3 *Michigan 1 - 3 1 - 3 * 0 0 0 0 0 0Minnesota 1 - 3 5 * 1 - 3 1 - 3 * 0 0 0Mississippi 1 - 3 10 * 1 - 3 5 * 0 0 0Missouri 1 - 3 14 * 1 - 3 6 * 0 0 0Montana 1 - 3 1 - 3 * 1 - 3 1 - 3 * 0 0 0Nebraska 1 - 3 1 - 3 * 1 - 3 1 - 3 * 0 0 0Nevada 1 - 3 6 * 1 - 3 1 - 3 * 1 - 3 1 - 3 *New Hampshire 1 - 3 1 - 3 * 0 0 0 0 0 0New Jersey 1 - 3 19 * 1 - 3 6 * 1 - 3 1 - 3 *New Mexico 1 - 3 1 - 3 * 1 - 3 1 - 3 * 0 0 0New York 1 - 3 30 * 1 - 3 6 * 1 - 3 1 - 3 *North Carolina 1 - 3 8 * 1 - 3 5 * 1 - 3 1 - 3 *North Dakota 0 0 0 1 - 3 1 - 3 * 0 0 0Northern Mariana Islands 0 0 0 0 0 0 0 0 0Ohio 1 - 3 17 * 1 - 3 6 * 0 0 0Oklahoma 1 - 3 12 * 1 - 3 7 * 1 - 3 1 - 3 *Oregon 1 - 3 8 * 1 - 3 1 - 3 * 1 - 3 1 - 3 *Pennsylvania 1 - 3 27 * 1 - 3 6 * 1 - 3 1 - 3 *Puerto Rico 0 0 0 0 0 0 0 0 0Rhode Island 1 - 3 1 - 3 * 1 - 3 1 - 3 * 0 0 0South Carolina 1 - 3 9 * 1 - 3 1 - 3 * 0 0 0South Dakota 0 0 0 1 - 3 4 * 0 0 0Tennessee 1 - 3 8 * 1 - 3 6 * 1 - 3 1 - 3 *Texas 1 - 3 27 * 1 - 3 7 * 1 - 3 1 - 3 *Utah 1 - 3 5 * 1 - 3 1 - 3 * 0 0 0Vermont 0 0 0 1 - 3 1 - 3 * 0 0 0Virgin Islands 0 0 0 0 0 0 0 0 0Virginia 1 - 3 11 * 1 - 3 7 * 1 - 3 1 - 3 *Washington 1 - 3 6 * 1 - 3 1 - 3 * 1 - 3 1 - 3 *West Virginia 1 - 3 1 - 3 * 1 - 3 1 - 3 * 0 0 0Wisconsin 1 - 3 9 * 1 - 3 6 * 1 - 3 1 - 3 *Wyoming 1 - 3 1 - 3 * 1 - 3 4 * 0 0 0United States 6 128 10 1 - 3 16 * 1 - 3 1 - 3 *
* indicates that the number has been withheld to protect carrier confidentiality.** indicates a number between 1 and 499.
Source: Raw data from Local Number Portability Administrator as of December 31, 2018. Rollups performed by the Industry Analysis Division staff, Office of Economics and Analytics.
Table 19
Numbers Ported1 from VoIP Providers by State and Recipient Carier Type(Numbers Ported in Thousands)
State / JurisdictionVoIP to Wireline VoIP to Wireless VoIP to VoIP
1 Starting with the July 2007 report, the method of determining whether a port came from a wireline or wireless carrier changed. For numbers ported multiple times, the original carrier is now used to determine the porting carrier's type. Previously the porting carrier's type was based on the most recent port. This is done to better estimate the number of phone numbers used in wireline and wireless service.
U.S. Federal Communications Commission 33 Numbering Resource Utilization in the United States
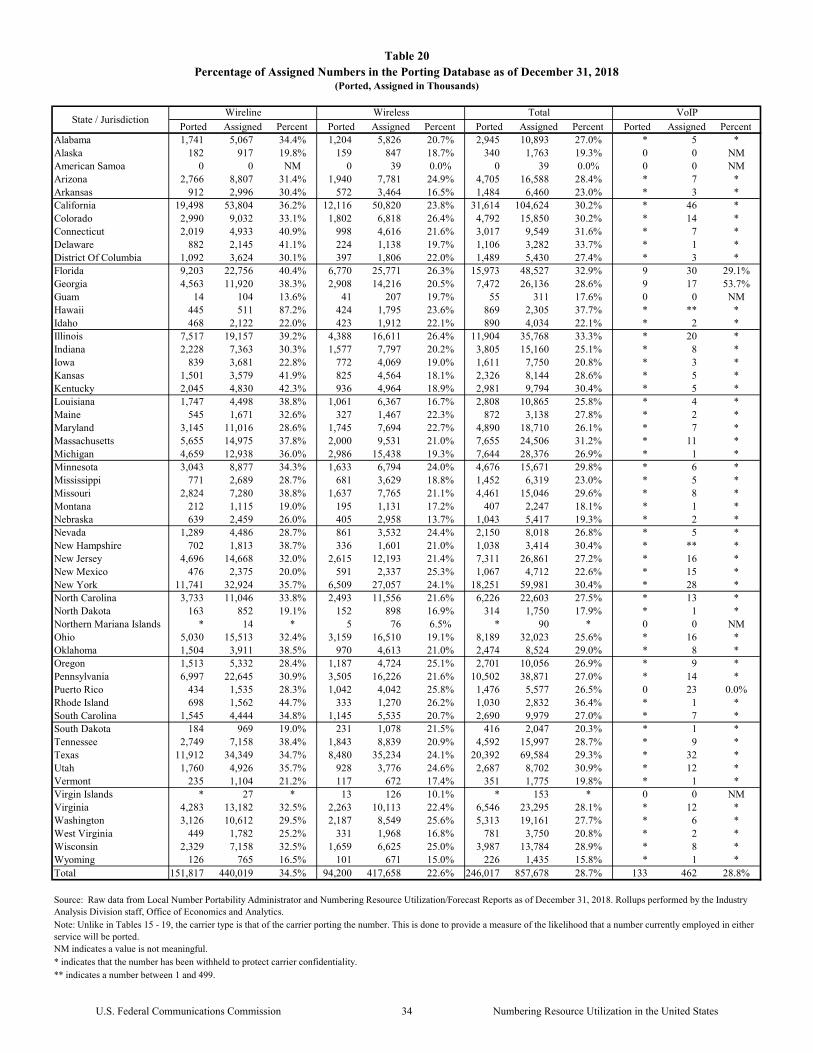
Ported Assigned Percent Ported Assigned Percent Ported Assigned Percent Ported Assigned PercentAlabama 1,741 5,067 34.4% 1,204 5,826 20.7% 2,945 10,893 27.0% * 5 *Alaska 182 917 19.8% 159 847 18.7% 340 1,763 19.3% 0 0 NMAmerican Samoa 0 0 NM 0 39 0.0% 0 39 0.0% 0 0 NMArizona 2,766 8,807 31.4% 1,940 7,781 24.9% 4,705 16,588 28.4% * 7 *Arkansas 912 2,996 30.4% 572 3,464 16.5% 1,484 6,460 23.0% * 3 *California 19,498 53,804 36.2% 12,116 50,820 23.8% 31,614 104,624 30.2% * 46 *Colorado 2,990 9,032 33.1% 1,802 6,818 26.4% 4,792 15,850 30.2% * 14 *Connecticut 2,019 4,933 40.9% 998 4,616 21.6% 3,017 9,549 31.6% * 7 *Delaware 882 2,145 41.1% 224 1,138 19.7% 1,106 3,282 33.7% * 1 *District Of Columbia 1,092 3,624 30.1% 397 1,806 22.0% 1,489 5,430 27.4% * 3 *Florida 9,203 22,756 40.4% 6,770 25,771 26.3% 15,973 48,527 32.9% 9 30 29.1%Georgia 4,563 11,920 38.3% 2,908 14,216 20.5% 7,472 26,136 28.6% 9 17 53.7%Guam 14 104 13.6% 41 207 19.7% 55 311 17.6% 0 0 NMHawaii 445 511 87.2% 424 1,795 23.6% 869 2,305 37.7% * ** *Idaho 468 2,122 22.0% 423 1,912 22.1% 890 4,034 22.1% * 2 *Illinois 7,517 19,157 39.2% 4,388 16,611 26.4% 11,904 35,768 33.3% * 20 *Indiana 2,228 7,363 30.3% 1,577 7,797 20.2% 3,805 15,160 25.1% * 8 *Iowa 839 3,681 22.8% 772 4,069 19.0% 1,611 7,750 20.8% * 3 *Kansas 1,501 3,579 41.9% 825 4,564 18.1% 2,326 8,144 28.6% * 5 *Kentucky 2,045 4,830 42.3% 936 4,964 18.9% 2,981 9,794 30.4% * 5 *Louisiana 1,747 4,498 38.8% 1,061 6,367 16.7% 2,808 10,865 25.8% * 4 *Maine 545 1,671 32.6% 327 1,467 22.3% 872 3,138 27.8% * 2 *Maryland 3,145 11,016 28.6% 1,745 7,694 22.7% 4,890 18,710 26.1% * 7 *Massachusetts 5,655 14,975 37.8% 2,000 9,531 21.0% 7,655 24,506 31.2% * 11 *Michigan 4,659 12,938 36.0% 2,986 15,438 19.3% 7,644 28,376 26.9% * 1 *Minnesota 3,043 8,877 34.3% 1,633 6,794 24.0% 4,676 15,671 29.8% * 6 *Mississippi 771 2,689 28.7% 681 3,629 18.8% 1,452 6,319 23.0% * 5 *Missouri 2,824 7,280 38.8% 1,637 7,765 21.1% 4,461 15,046 29.6% * 8 *Montana 212 1,115 19.0% 195 1,131 17.2% 407 2,247 18.1% * 1 *Nebraska 639 2,459 26.0% 405 2,958 13.7% 1,043 5,417 19.3% * 2 *Nevada 1,289 4,486 28.7% 861 3,532 24.4% 2,150 8,018 26.8% * 5 *New Hampshire 702 1,813 38.7% 336 1,601 21.0% 1,038 3,414 30.4% * ** *New Jersey 4,696 14,668 32.0% 2,615 12,193 21.4% 7,311 26,861 27.2% * 16 *New Mexico 476 2,375 20.0% 591 2,337 25.3% 1,067 4,712 22.6% * 15 *New York 11,741 32,924 35.7% 6,509 27,057 24.1% 18,251 59,981 30.4% * 28 *North Carolina 3,733 11,046 33.8% 2,493 11,556 21.6% 6,226 22,603 27.5% * 13 *North Dakota 163 852 19.1% 152 898 16.9% 314 1,750 17.9% * 1 *Northern Mariana Islands * 14 * 5 76 6.5% * 90 * 0 0 NMOhio 5,030 15,513 32.4% 3,159 16,510 19.1% 8,189 32,023 25.6% * 16 *Oklahoma 1,504 3,911 38.5% 970 4,613 21.0% 2,474 8,524 29.0% * 8 *Oregon 1,513 5,332 28.4% 1,187 4,724 25.1% 2,701 10,056 26.9% * 9 *Pennsylvania 6,997 22,645 30.9% 3,505 16,226 21.6% 10,502 38,871 27.0% * 14 *Puerto Rico 434 1,535 28.3% 1,042 4,042 25.8% 1,476 5,577 26.5% 0 23 0.0%Rhode Island 698 1,562 44.7% 333 1,270 26.2% 1,030 2,832 36.4% * 1 *South Carolina 1,545 4,444 34.8% 1,145 5,535 20.7% 2,690 9,979 27.0% * 7 *South Dakota 184 969 19.0% 231 1,078 21.5% 416 2,047 20.3% * 1 *Tennessee 2,749 7,158 38.4% 1,843 8,839 20.9% 4,592 15,997 28.7% * 9 *Texas 11,912 34,349 34.7% 8,480 35,234 24.1% 20,392 69,584 29.3% * 32 *Utah 1,760 4,926 35.7% 928 3,776 24.6% 2,687 8,702 30.9% * 12 *Vermont 235 1,104 21.2% 117 672 17.4% 351 1,775 19.8% * 1 *Virgin Islands * 27 * 13 126 10.1% * 153 * 0 0 NMVirginia 4,283 13,182 32.5% 2,263 10,113 22.4% 6,546 23,295 28.1% * 12 *Washington 3,126 10,612 29.5% 2,187 8,549 25.6% 5,313 19,161 27.7% * 6 *West Virginia 449 1,782 25.2% 331 1,968 16.8% 781 3,750 20.8% * 2 *Wisconsin 2,329 7,158 32.5% 1,659 6,625 25.0% 3,987 13,784 28.9% * 8 *Wyoming 126 765 16.5% 101 671 15.0% 226 1,435 15.8% * 1 *Total 151,817 440,019 34.5% 94,200 417,658 22.6% 246,017 857,678 28.7% 133 462 28.8%
* indicates that the number has been withheld to protect carrier confidentiality.** indicates a number between 1 and 499.
(Ported, Assigned in Thousands)
Source: Raw data from Local Number Portability Administrator and Numbering Resource Utilization/Forecast Reports as of December 31, 2018. Rollups performed by the Industry Analysis Division staff, Office of Economics and Analytics.
State / Jurisdiction
NM indicates a value is not meaningful.
Note: Unlike in Tables 15 - 19, the carrier type is that of the carrier porting the number. This is done to provide a measure of the likelihood that a number currently employed in either service will be ported.
Table 20Percentage of Assigned Numbers in the Porting Database as of December 31, 2018
Wireline Wireless Total VoIP
U.S. Federal Communications Commission 34 Numbering Resource Utilization in the United States
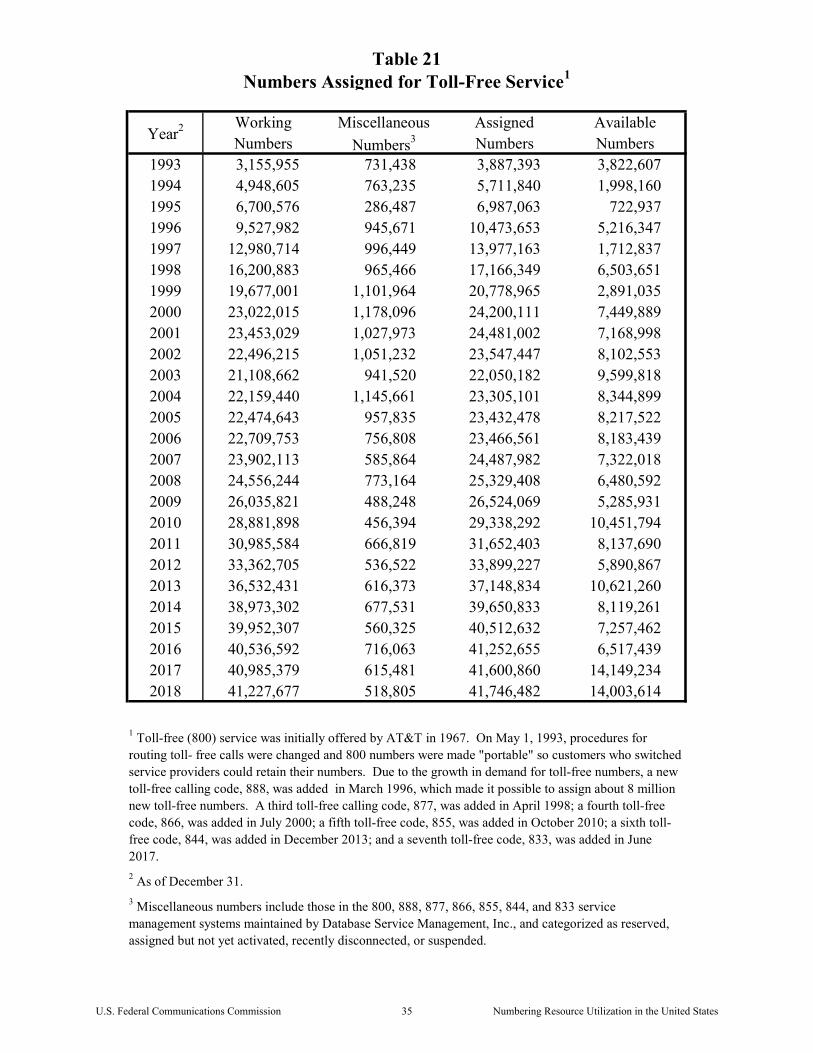
Working Miscellaneous Assigned AvailableNumbers Numbers3 Numbers Numbers
1993 3,155,955 731,438 3,887,393 3,822,6071994 4,948,605 763,235 5,711,840 1,998,1601995 6,700,576 286,487 6,987,063 722,9371996 9,527,982 945,671 10,473,653 5,216,3471997 12,980,714 996,449 13,977,163 1,712,8371998 16,200,883 965,466 17,166,349 6,503,6511999 19,677,001 1,101,964 20,778,965 2,891,0352000 23,022,015 1,178,096 24,200,111 7,449,8892001 23,453,029 1,027,973 24,481,002 7,168,9982002 22,496,215 1,051,232 23,547,447 8,102,5532003 21,108,662 941,520 22,050,182 9,599,8182004 22,159,440 1,145,661 23,305,101 8,344,8992005 22,474,643 957,835 23,432,478 8,217,5222006 22,709,753 756,808 23,466,561 8,183,4392007 23,902,113 585,864 24,487,982 7,322,0182008 24,556,244 773,164 25,329,408 6,480,5922009 26,035,821 488,248 26,524,069 5,285,9312010 28,881,898 456,394 29,338,292 10,451,7942011 30,985,584 666,819 31,652,403 8,137,6902012 33,362,705 536,522 33,899,227 5,890,8672013 36,532,431 616,373 37,148,834 10,621,2602014 38,973,302 677,531 39,650,833 8,119,2612015 39,952,307 560,325 40,512,632 7,257,4622016 40,536,592 716,063 41,252,655 6,517,4392017 40,985,379 615,481 41,600,860 14,149,2342018 41,227,677 518,805 41,746,482 14,003,614
3 Miscellaneous numbers include those in the 800, 888, 877, 866, 855, 844, and 833 service management systems maintained by Database Service Management, Inc., and categorized as reserved, assigned but not yet activated, recently disconnected, or suspended.
Table 21Numbers Assigned for Toll-Free Service1
Year2
2 As of December 31.
1 Toll-free (800) service was initially offered by AT&T in 1967. On May 1, 1993, procedures for routing toll- free calls were changed and 800 numbers were made "portable" so customers who switched service providers could retain their numbers. Due to the growth in demand for toll-free numbers, a new toll-free calling code, 888, was added in March 1996, which made it possible to assign about 8 million new toll-free numbers. A third toll-free calling code, 877, was added in April 1998; a fourth toll-free code, 866, was added in July 2000; a fifth toll-free code, 855, was added in October 2010; a sixth toll-free code, 844, was added in December 2013; and a seventh toll-free code, 833, was added in June 2017.
U.S. Federal Communications Commission 35 Numbering Resource Utilization in the United States
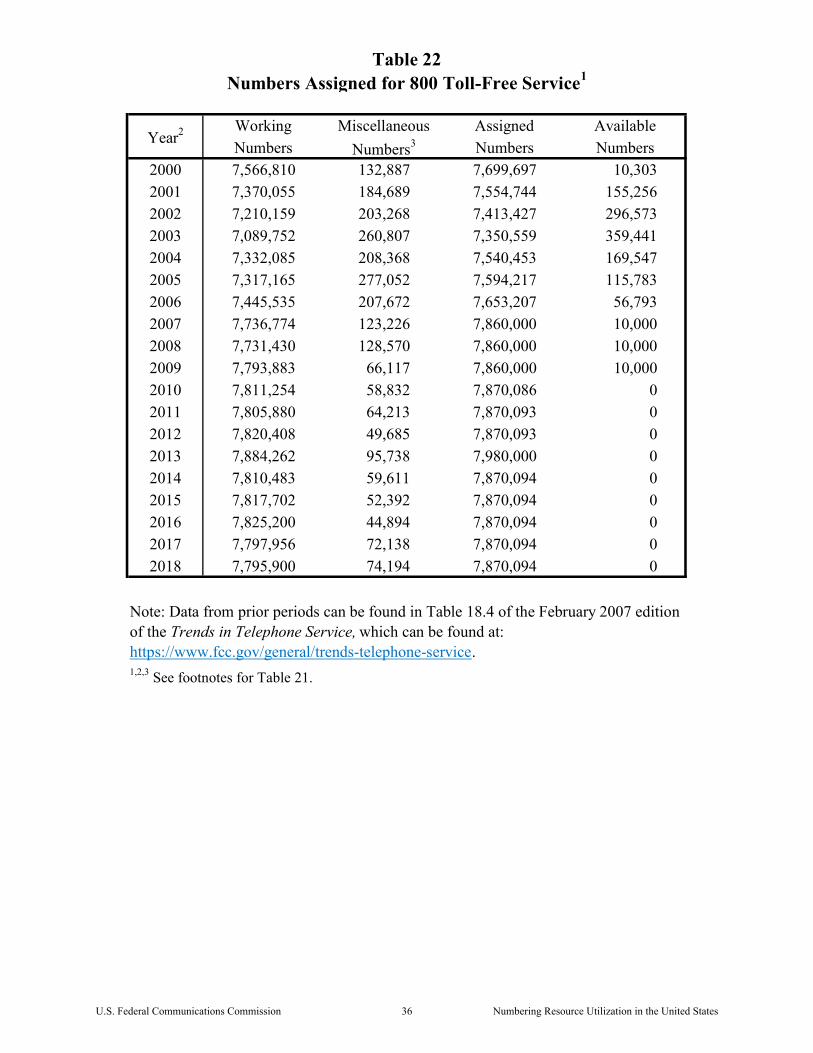
Working Miscellaneous Assigned AvailableNumbers Numbers3 Numbers Numbers
2000 7,566,810 132,887 7,699,697 10,3032001 7,370,055 184,689 7,554,744 155,2562002 7,210,159 203,268 7,413,427 296,5732003 7,089,752 260,807 7,350,559 359,4412004 7,332,085 208,368 7,540,453 169,5472005 7,317,165 277,052 7,594,217 115,7832006 7,445,535 207,672 7,653,207 56,7932007 7,736,774 123,226 7,860,000 10,0002008 7,731,430 128,570 7,860,000 10,0002009 7,793,883 66,117 7,860,000 10,0002010 7,811,254 58,832 7,870,086 02011 7,805,880 64,213 7,870,093 02012 7,820,408 49,685 7,870,093 02013 7,884,262 95,738 7,980,000 02014 7,810,483 59,611 7,870,094 02015 7,817,702 52,392 7,870,094 02016 7,825,200 44,894 7,870,094 02017 7,797,956 72,138 7,870,094 02018 7,795,900 74,194 7,870,094 0
1,2,3 See footnotes for Table 21.
Table 22Numbers Assigned for 800 Toll-Free Service1
Year2
Note: Data from prior periods can be found in Table 18.4 of the February 2007 edition of the Trends in Telephone Service, which can be found at: https://www.fcc.gov/general/trends-telephone-service.
U.S. Federal Communications Commission 36 Numbering Resource Utilization in the United States
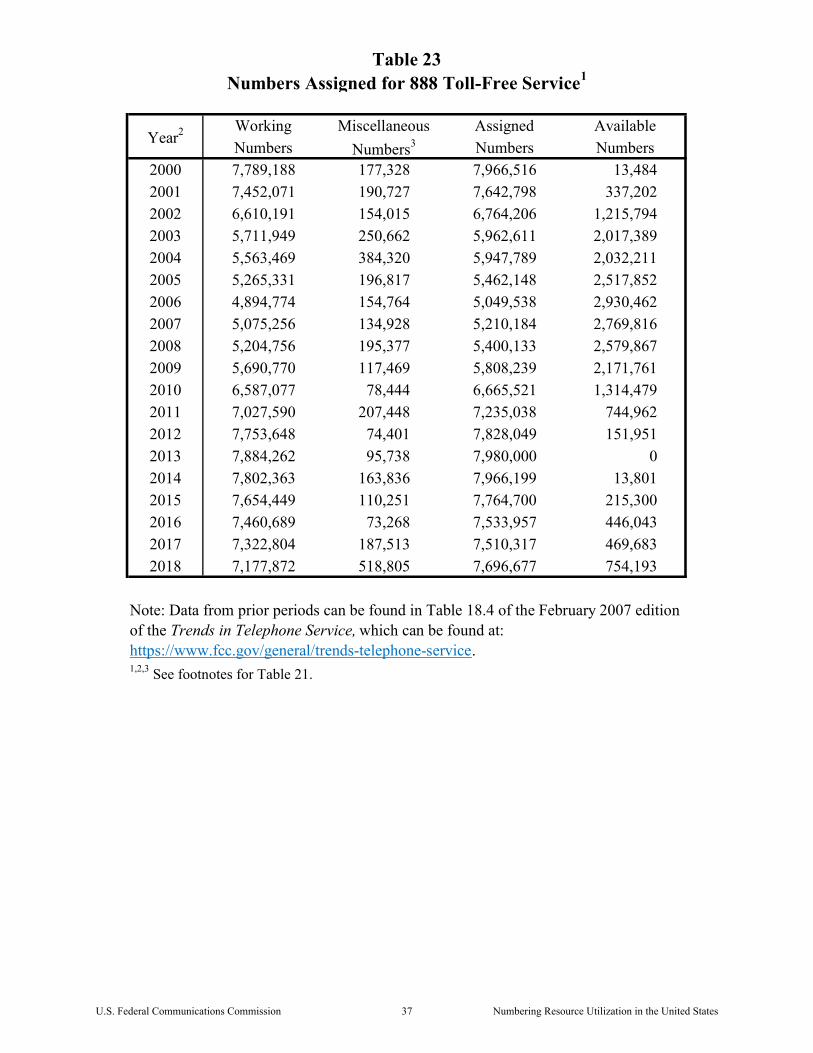
Working Miscellaneous Assigned AvailableNumbers Numbers3 Numbers Numbers
2000 7,789,188 177,328 7,966,516 13,4842001 7,452,071 190,727 7,642,798 337,2022002 6,610,191 154,015 6,764,206 1,215,7942003 5,711,949 250,662 5,962,611 2,017,3892004 5,563,469 384,320 5,947,789 2,032,2112005 5,265,331 196,817 5,462,148 2,517,8522006 4,894,774 154,764 5,049,538 2,930,4622007 5,075,256 134,928 5,210,184 2,769,8162008 5,204,756 195,377 5,400,133 2,579,8672009 5,690,770 117,469 5,808,239 2,171,7612010 6,587,077 78,444 6,665,521 1,314,4792011 7,027,590 207,448 7,235,038 744,9622012 7,753,648 74,401 7,828,049 151,9512013 7,884,262 95,738 7,980,000 02014 7,802,363 163,836 7,966,199 13,8012015 7,654,449 110,251 7,764,700 215,3002016 7,460,689 73,268 7,533,957 446,0432017 7,322,804 187,513 7,510,317 469,6832018 7,177,872 518,805 7,696,677 754,193
1,2,3 See footnotes for Table 21.
Table 23Numbers Assigned for 888 Toll-Free Service1
Year2
Note: Data from prior periods can be found in Table 18.4 of the February 2007 edition of the Trends in Telephone Service, which can be found at: https://www.fcc.gov/general/trends-telephone-service.
U.S. Federal Communications Commission 37 Numbering Resource Utilization in the United States
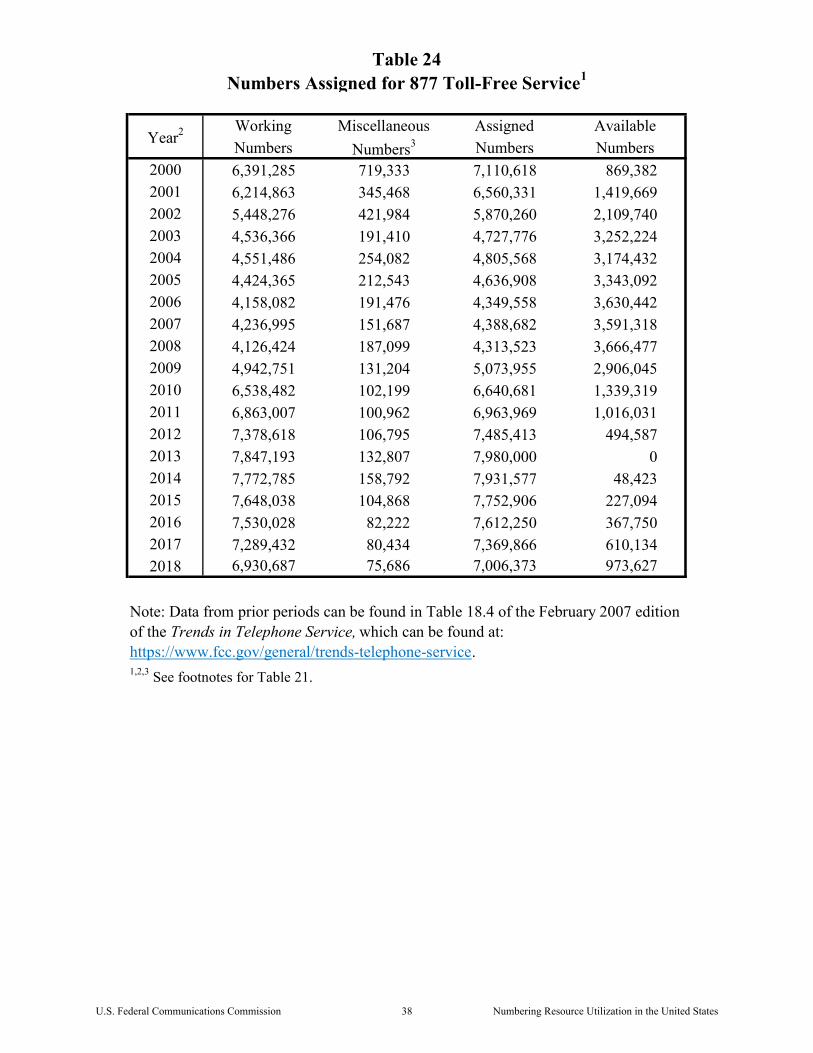
Working Miscellaneous Assigned AvailableNumbers Numbers3 Numbers Numbers
2000 6,391,285 719,333 7,110,618 869,3822001 6,214,863 345,468 6,560,331 1,419,6692002 5,448,276 421,984 5,870,260 2,109,7402003 4,536,366 191,410 4,727,776 3,252,2242004 4,551,486 254,082 4,805,568 3,174,4322005 4,424,365 212,543 4,636,908 3,343,0922006 4,158,082 191,476 4,349,558 3,630,4422007 4,236,995 151,687 4,388,682 3,591,3182008 4,126,424 187,099 4,313,523 3,666,4772009 4,942,751 131,204 5,073,955 2,906,0452010 6,538,482 102,199 6,640,681 1,339,3192011 6,863,007 100,962 6,963,969 1,016,0312012 7,378,618 106,795 7,485,413 494,5872013 7,847,193 132,807 7,980,000 02014 7,772,785 158,792 7,931,577 48,4232015 7,648,038 104,868 7,752,906 227,0942016 7,530,028 82,222 7,612,250 367,7502017 7,289,432 80,434 7,369,866 610,1342018 6,930,687 75,686 7,006,373 973,627
1,2,3 See footnotes for Table 21.
Numbers Assigned for 877 Toll-Free Service1Table 24
Year2
Note: Data from prior periods can be found in Table 18.4 of the February 2007 edition of the Trends in Telephone Service, which can be found at: https://www.fcc.gov/general/trends-telephone-service.
U.S. Federal Communications Commission 38 Numbering Resource Utilization in the United States
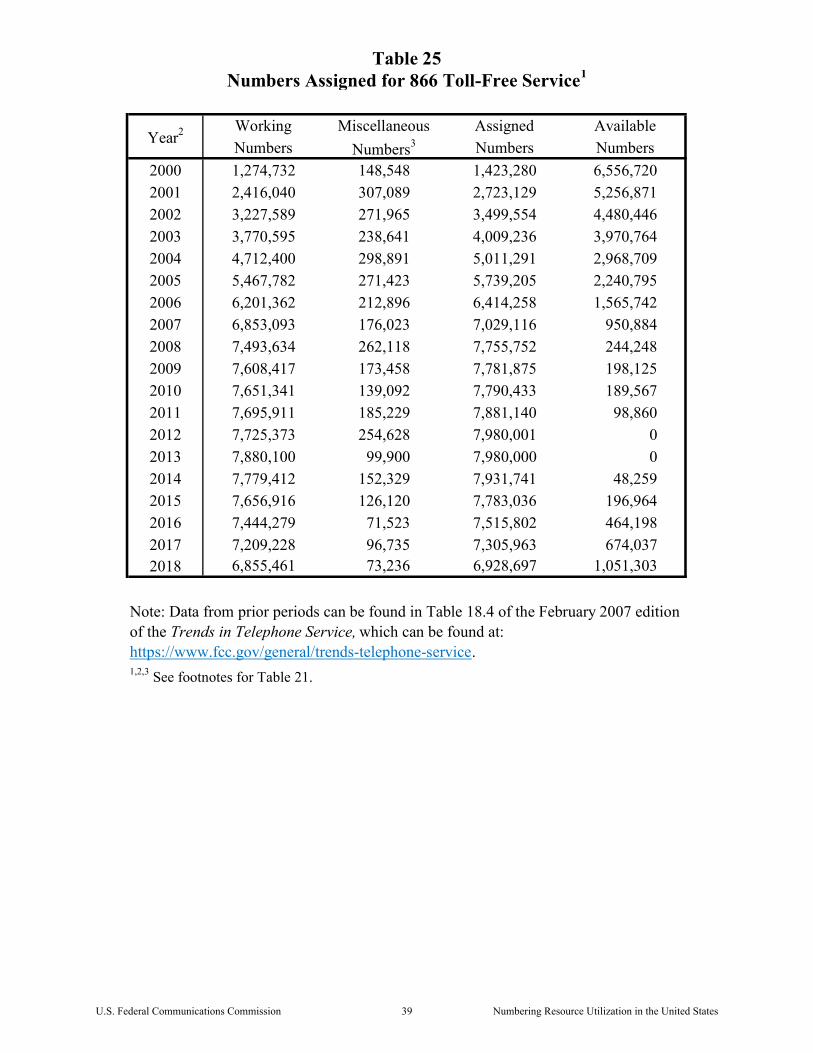
Working Miscellaneous Assigned AvailableNumbers Numbers3 Numbers Numbers
2000 1,274,732 148,548 1,423,280 6,556,7202001 2,416,040 307,089 2,723,129 5,256,8712002 3,227,589 271,965 3,499,554 4,480,4462003 3,770,595 238,641 4,009,236 3,970,7642004 4,712,400 298,891 5,011,291 2,968,7092005 5,467,782 271,423 5,739,205 2,240,7952006 6,201,362 212,896 6,414,258 1,565,7422007 6,853,093 176,023 7,029,116 950,8842008 7,493,634 262,118 7,755,752 244,2482009 7,608,417 173,458 7,781,875 198,1252010 7,651,341 139,092 7,790,433 189,5672011 7,695,911 185,229 7,881,140 98,8602012 7,725,373 254,628 7,980,001 02013 7,880,100 99,900 7,980,000 02014 7,779,412 152,329 7,931,741 48,2592015 7,656,916 126,120 7,783,036 196,9642016 7,444,279 71,523 7,515,802 464,1982017 7,209,228 96,735 7,305,963 674,0372018 6,855,461 73,236 6,928,697 1,051,303
1,2,3 See footnotes for Table 21.
Table 25Numbers Assigned for 866 Toll-Free Service1
Year2
Note: Data from prior periods can be found in Table 18.4 of the February 2007 edition of the Trends in Telephone Service, which can be found at: https://www.fcc.gov/general/trends-telephone-service.
U.S. Federal Communications Commission 39 Numbering Resource Utilization in the United States
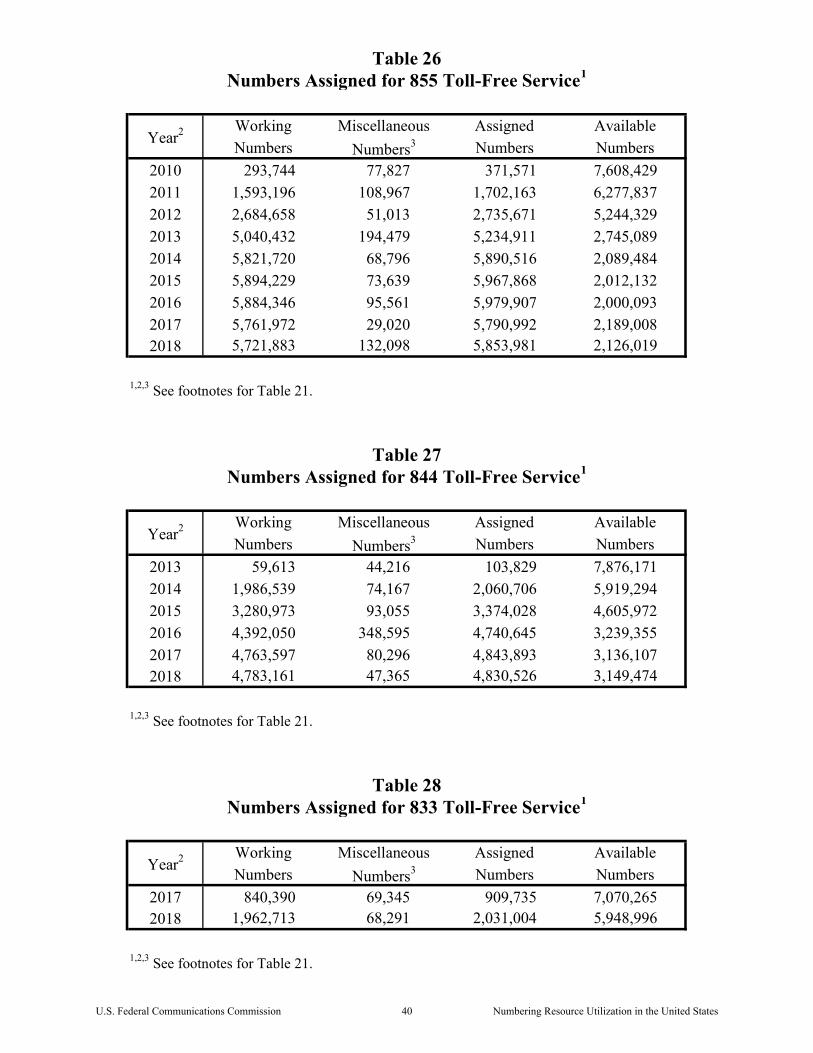
Working Miscellaneous Assigned AvailableNumbers Numbers3 Numbers Numbers
2010 293,744 77,827 371,571 7,608,4292011 1,593,196 108,967 1,702,163 6,277,8372012 2,684,658 51,013 2,735,671 5,244,3292013 5,040,432 194,479 5,234,911 2,745,0892014 5,821,720 68,796 5,890,516 2,089,4842015 5,894,229 73,639 5,967,868 2,012,1322016 5,884,346 95,561 5,979,907 2,000,0932017 5,761,972 29,020 5,790,992 2,189,0082018 5,721,883 132,098 5,853,981 2,126,019
Working Miscellaneous Assigned AvailableNumbers Numbers3 Numbers Numbers
2013 59,613 44,216 103,829 7,876,1712014 1,986,539 74,167 2,060,706 5,919,2942015 3,280,973 93,055 3,374,028 4,605,9722016 4,392,050 348,595 4,740,645 3,239,3552017 4,763,597 80,296 4,843,893 3,136,1072018 4,783,161 47,365 4,830,526 3,149,474
Working Miscellaneous Assigned AvailableNumbers Numbers3 Numbers Numbers
2017 840,390 69,345 909,735 7,070,2652018 1,962,713 68,291 2,031,004 5,948,996
Table 26Numbers Assigned for 855 Toll-Free Service1
Year2
1,2,3 See footnotes for Table 21.
1,2,3 See footnotes for Table 21.
Table 27Numbers Assigned for 844 Toll-Free Service1
Year2
Year2
Table 28Numbers Assigned for 833 Toll-Free Service1
1,2,3 See footnotes for Table 21.
U.S. Federal Communications Commission 40 Numbering Resource Utilization in the United States
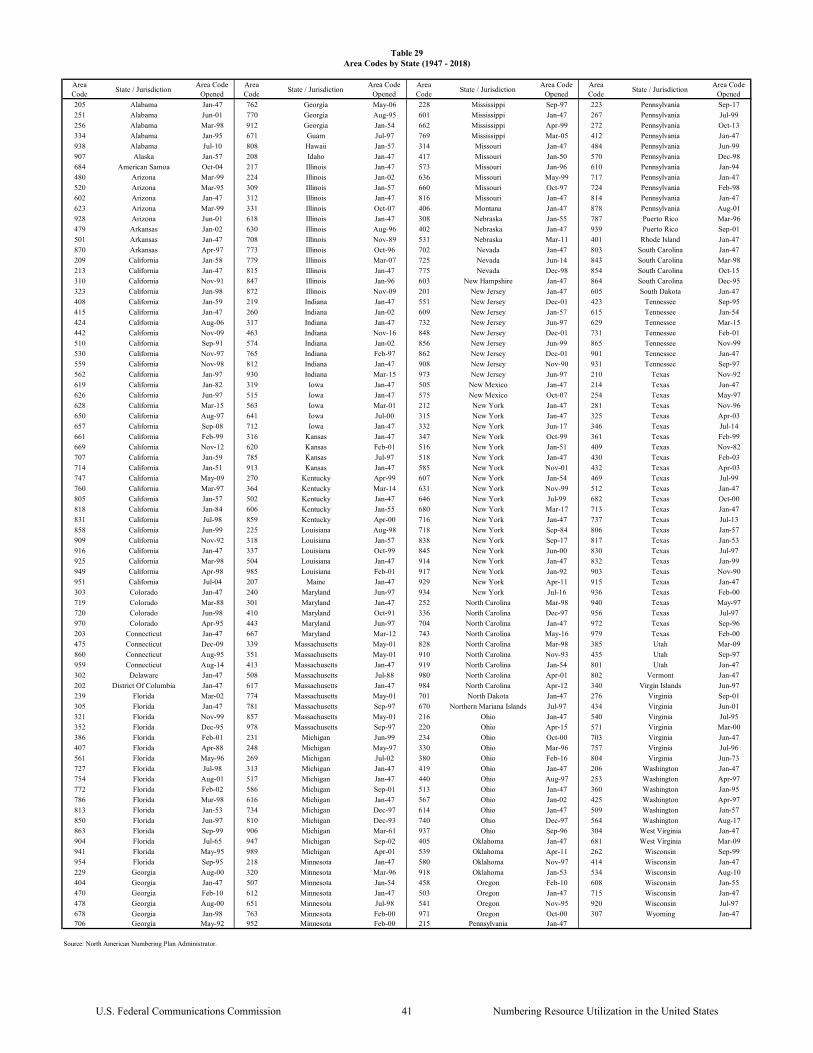
Area Code
State / JurisdictionArea Code
OpenedArea Code
State / JurisdictionArea Code
OpenedArea Code
State / JurisdictionArea Code
OpenedArea Code
State / JurisdictionArea Code
Opened
205 Alabama Jan-47 762 Georgia May-06 228 Mississippi Sep-97 223 Pennsylvania Sep-17
251 Alabama Jun-01 770 Georgia Aug-95 601 Mississippi Jan-47 267 Pennsylvania Jul-99
256 Alabama Mar-98 912 Georgia Jan-54 662 Mississippi Apr-99 272 Pennsylvania Oct-13
334 Alabama Jan-95 671 Guam Jul-97 769 Mississippi Mar-05 412 Pennsylvania Jan-47
938 Alabama Jul-10 808 Hawaii Jan-57 314 Missouri Jan-47 484 Pennsylvania Jun-99
907 Alaska Jan-57 208 Idaho Jan-47 417 Missouri Jan-50 570 Pennsylvania Dec-98
684 American Samoa Oct-04 217 Illinois Jan-47 573 Missouri Jan-96 610 Pennsylvania Jan-94
480 Arizona Mar-99 224 Illinois Jan-02 636 Missouri May-99 717 Pennsylvania Jan-47
520 Arizona Mar-95 309 Illinois Jan-57 660 Missouri Oct-97 724 Pennsylvania Feb-98
602 Arizona Jan-47 312 Illinois Jan-47 816 Missouri Jan-47 814 Pennsylvania Jan-47
623 Arizona Mar-99 331 Illinois Oct-07 406 Montana Jan-47 878 Pennsylvania Aug-01
928 Arizona Jun-01 618 Illinois Jan-47 308 Nebraska Jan-55 787 Puerto Rico Mar-96
479 Arkansas Jan-02 630 Illinois Aug-96 402 Nebraska Jan-47 939 Puerto Rico Sep-01
501 Arkansas Jan-47 708 Illinois Nov-89 531 Nebraska Mar-11 401 Rhode Island Jan-47
870 Arkansas Apr-97 773 Illinois Oct-96 702 Nevada Jan-47 803 South Carolina Jan-47
209 California Jan-58 779 Illinois Mar-07 725 Nevada Jun-14 843 South Carolina Mar-98
213 California Jan-47 815 Illinois Jan-47 775 Nevada Dec-98 854 South Carolina Oct-15
310 California Nov-91 847 Illinois Jan-96 603 New Hampshire Jan-47 864 South Carolina Dec-95
323 California Jun-98 872 Illinois Nov-09 201 New Jersey Jan-47 605 South Dakota Jan-47
408 California Jan-59 219 Indiana Jan-47 551 New Jersey Dec-01 423 Tennessee Sep-95
415 California Jan-47 260 Indiana Jan-02 609 New Jersey Jan-57 615 Tennessee Jan-54
424 California Aug-06 317 Indiana Jan-47 732 New Jersey Jun-97 629 Tennessee Mar-15
442 California Nov-09 463 Indiana Nov-16 848 New Jersey Dec-01 731 Tennessee Feb-01
510 California Sep-91 574 Indiana Jan-02 856 New Jersey Jun-99 865 Tennessee Nov-99
530 California Nov-97 765 Indiana Feb-97 862 New Jersey Dec-01 901 Tennessee Jan-47
559 California Nov-98 812 Indiana Jan-47 908 New Jersey Nov-90 931 Tennessee Sep-97
562 California Jan-97 930 Indiana Mar-15 973 New Jersey Jun-97 210 Texas Nov-92
619 California Jan-82 319 Iowa Jan-47 505 New Mexico Jan-47 214 Texas Jan-47
626 California Jun-97 515 Iowa Jan-47 575 New Mexico Oct-07 254 Texas May-97
628 California Mar-15 563 Iowa Mar-01 212 New York Jan-47 281 Texas Nov-96
650 California Aug-97 641 Iowa Jul-00 315 New York Jan-47 325 Texas Apr-03
657 California Sep-08 712 Iowa Jan-47 332 New York Jun-17 346 Texas Jul-14
661 California Feb-99 316 Kansas Jan-47 347 New York Oct-99 361 Texas Feb-99
669 California Nov-12 620 Kansas Feb-01 516 New York Jan-51 409 Texas Nov-82
707 California Jan-59 785 Kansas Jul-97 518 New York Jan-47 430 Texas Feb-03
714 California Jan-51 913 Kansas Jan-47 585 New York Nov-01 432 Texas Apr-03
747 California May-09 270 Kentucky Apr-99 607 New York Jan-54 469 Texas Jul-99
760 California Mar-97 364 Kentucky Mar-14 631 New York Nov-99 512 Texas Jan-47
805 California Jan-57 502 Kentucky Jan-47 646 New York Jul-99 682 Texas Oct-00
818 California Jan-84 606 Kentucky Jan-55 680 New York Mar-17 713 Texas Jan-47
831 California Jul-98 859 Kentucky Apr-00 716 New York Jan-47 737 Texas Jul-13
858 California Jun-99 225 Louisiana Aug-98 718 New York Sep-84 806 Texas Jan-57
909 California Nov-92 318 Louisiana Jan-57 838 New York Sep-17 817 Texas Jan-53
916 California Jan-47 337 Louisiana Oct-99 845 New York Jun-00 830 Texas Jul-97
925 California Mar-98 504 Louisiana Jan-47 914 New York Jan-47 832 Texas Jan-99
949 California Apr-98 985 Louisiana Feb-01 917 New York Jan-92 903 Texas Nov-90
951 California Jul-04 207 Maine Jan-47 929 New York Apr-11 915 Texas Jan-47
303 Colorado Jan-47 240 Maryland Jun-97 934 New York Jul-16 936 Texas Feb-00
719 Colorado Mar-88 301 Maryland Jan-47 252 North Carolina Mar-98 940 Texas May-97
720 Colorado Jun-98 410 Maryland Oct-91 336 North Carolina Dec-97 956 Texas Jul-97
970 Colorado Apr-95 443 Maryland Jun-97 704 North Carolina Jan-47 972 Texas Sep-96
203 Connecticut Jan-47 667 Maryland Mar-12 743 North Carolina May-16 979 Texas Feb-00
475 Connecticut Dec-09 339 Massachusetts May-01 828 North Carolina Mar-98 385 Utah Mar-09
860 Connecticut Aug-95 351 Massachusetts May-01 910 North Carolina Nov-93 435 Utah Sep-97
959 Connecticut Aug-14 413 Massachusetts Jan-47 919 North Carolina Jan-54 801 Utah Jan-47
302 Delaware Jan-47 508 Massachusetts Jul-88 980 North Carolina Apr-01 802 Vermont Jan-47
202 District Of Columbia Jan-47 617 Massachusetts Jan-47 984 North Carolina Apr-12 340 Virgin Islands Jun-97
239 Florida Mar-02 774 Massachusetts May-01 701 North Dakota Jan-47 276 Virginia Sep-01
305 Florida Jan-47 781 Massachusetts Sep-97 670 Northern Mariana Islands Jul-97 434 Virginia Jun-01
321 Florida Nov-99 857 Massachusetts May-01 216 Ohio Jan-47 540 Virginia Jul-95
352 Florida Dec-95 978 Massachusetts Sep-97 220 Ohio Apr-15 571 Virginia Mar-00
386 Florida Feb-01 231 Michigan Jun-99 234 Ohio Oct-00 703 Virginia Jan-47
407 Florida Apr-88 248 Michigan May-97 330 Ohio Mar-96 757 Virginia Jul-96
561 Florida May-96 269 Michigan Jul-02 380 Ohio Feb-16 804 Virginia Jun-73
727 Florida Jul-98 313 Michigan Jan-47 419 Ohio Jan-47 206 Washington Jan-47
754 Florida Aug-01 517 Michigan Jan-47 440 Ohio Aug-97 253 Washington Apr-97
772 Florida Feb-02 586 Michigan Sep-01 513 Ohio Jan-47 360 Washington Jan-95
786 Florida Mar-98 616 Michigan Jan-47 567 Ohio Jan-02 425 Washington Apr-97
813 Florida Jan-53 734 Michigan Dec-97 614 Ohio Jan-47 509 Washington Jan-57
850 Florida Jun-97 810 Michigan Dec-93 740 Ohio Dec-97 564 Washington Aug-17
863 Florida Sep-99 906 Michigan Mar-61 937 Ohio Sep-96 304 West Virginia Jan-47
904 Florida Jul-65 947 Michigan Sep-02 405 Oklahoma Jan-47 681 West Virginia Mar-09
941 Florida May-95 989 Michigan Apr-01 539 Oklahoma Apr-11 262 Wisconsin Sep-99
954 Florida Sep-95 218 Minnesota Jan-47 580 Oklahoma Nov-97 414 Wisconsin Jan-47
229 Georgia Aug-00 320 Minnesota Mar-96 918 Oklahoma Jan-53 534 Wisconsin Aug-10
404 Georgia Jan-47 507 Minnesota Jan-54 458 Oregon Feb-10 608 Wisconsin Jan-55
470 Georgia Feb-10 612 Minnesota Jan-47 503 Oregon Jan-47 715 Wisconsin Jan-47
478 Georgia Aug-00 651 Minnesota Jul-98 541 Oregon Nov-95 920 Wisconsin Jul-97
678 Georgia Jan-98 763 Minnesota Feb-00 971 Oregon Oct-00 307 Wyoming Jan-47706 Georgia May-92 952 Minnesota Feb-00 215 Pennsylvania Jan-47
Table 29Area Codes by State (1947 - 2018)
Source: North American Numbering Plan Administrator.
U.S. Federal Communications Commission 41 Numbering Resource Utilization in the United States
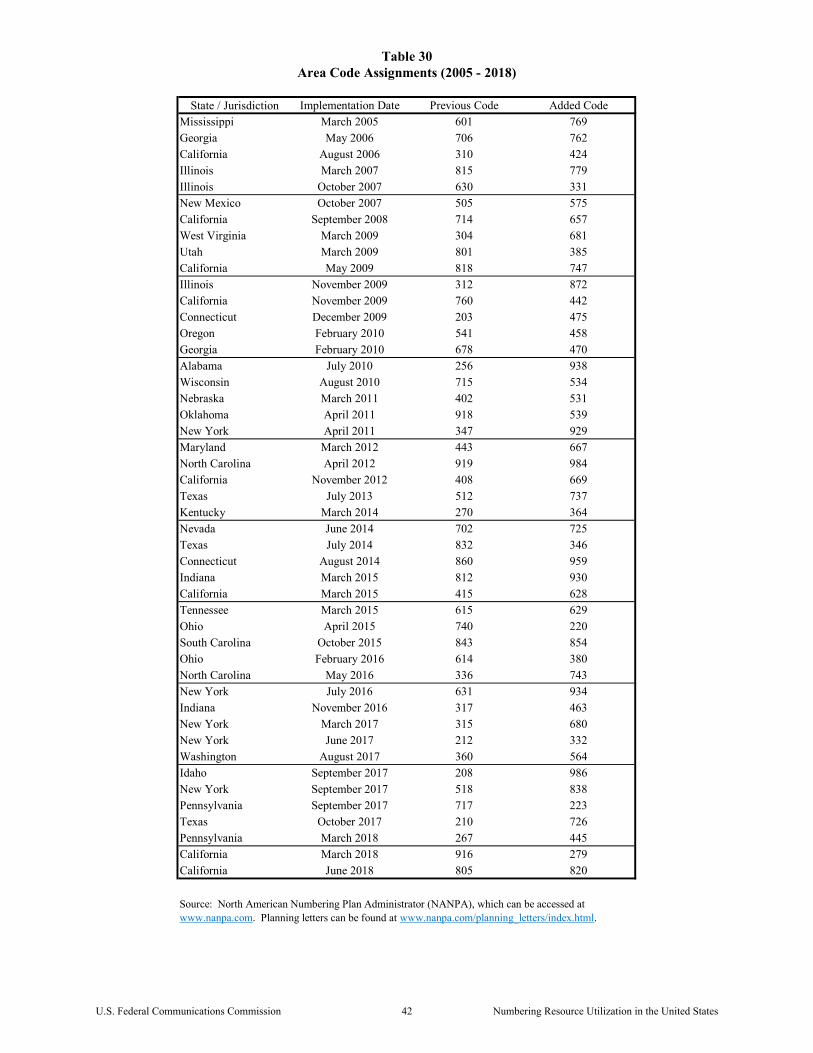
State / Jurisdiction Implementation Date Previous Code Added CodeMississippi March 2005 601 769Georgia May 2006 706 762California August 2006 310 424Illinois March 2007 815 779Illinois October 2007 630 331New Mexico October 2007 505 575California September 2008 714 657West Virginia March 2009 304 681Utah March 2009 801 385California May 2009 818 747Illinois November 2009 312 872California November 2009 760 442Connecticut December 2009 203 475Oregon February 2010 541 458Georgia February 2010 678 470Alabama July 2010 256 938Wisconsin August 2010 715 534Nebraska March 2011 402 531Oklahoma April 2011 918 539New York April 2011 347 929Maryland March 2012 443 667North Carolina April 2012 919 984California November 2012 408 669Texas July 2013 512 737Kentucky March 2014 270 364Nevada June 2014 702 725Texas July 2014 832 346Connecticut August 2014 860 959Indiana March 2015 812 930California March 2015 415 628Tennessee March 2015 615 629Ohio April 2015 740 220South Carolina October 2015 843 854Ohio February 2016 614 380North Carolina May 2016 336 743New York July 2016 631 934Indiana November 2016 317 463New York March 2017 315 680New York June 2017 212 332Washington August 2017 360 564Idaho September 2017 208 986New York September 2017 518 838Pennsylvania September 2017 717 223Texas October 2017 210 726Pennsylvania March 2018 267 445California March 2018 916 279California June 2018 805 820
Table 30Area Code Assignments (2005 - 2018)
Source: North American Numbering Plan Administrator (NANPA), which can be accessed at www.nanpa.com. Planning letters can be found at www.nanpa.com/planning_letters/index.html.
U.S. Federal Communications Commission 42 Numbering Resource Utilization in the United States
Customer Response
Publication: Numbering Resource Utilization in the United States: Status as of December 31, 2018
You can help us provide the best possible information to the public by completing this form and returning it to the Industry Analysis Division of the FCC's Office of Economics and Analytics.
1. Please check the category that best describes you:____ press____ current telecommunications carrier____ potential telecommunications carrier____ business customer evaluating vendors/service options____ consultant, law firm, lobbyist____ academic/student____ residential customer____ FCC employee____ other federal government employee____ state or local government employee____ other (please specify)
2. Please rate the report: Excellent Good Satisfactory Poor No Opinion Data accuracy (_) (_) (_) (_) (_) Data presentation (_) (_) (_) (_) (_) Timeliness of data (_) (_) (_) (_) (_) Completeness of data (_) (_) (_) (_) (_) Text clarity (_) (_) (_) (_) (_) Completeness of text (_) (_) (_) (_) (_)
3. Please rate the report overall: Excellent Good Satisfactory Poor No Opinion (_) (_) (_) (_) (_)
4. How can this report be improved?
______________________________________________________________________________
______________________________________________________________________________
5. May we contact you to discuss possible improvements?
Name: ________________________________________________________________________
Telephone #: __________________________________________________________________
To discuss the information in this report, contact: 202-418-0940 or for users of TTY equipment, call 202-418-0484
Fax this response to:
202-418-0520
Scan and email this response to:
Mail this response to FCC/OEA/IAD 45 L Street NE
Washington, DC 20554
U.S. Federal Communications Commission 43 Numbering Resource Utilization in the United States