Embed Size (px)
Citation preview
Misdemeanor F5 F4 F3 F2 F1 Unclassified Felony Charge Not Listed
2011 2012 2013 20142011 2012 2013 20142011 2012 2013 20142011 2012 2013 20142011 2012 2013 20142011 2012 2013 20142011 2012 2013 20142011 2012 2013 2014
0K
1K
2K
3K
4K
115 49
3,966
3,537
2,1862,044
2,132 2,1932,165
1,8271,8061,706
229 193294 351
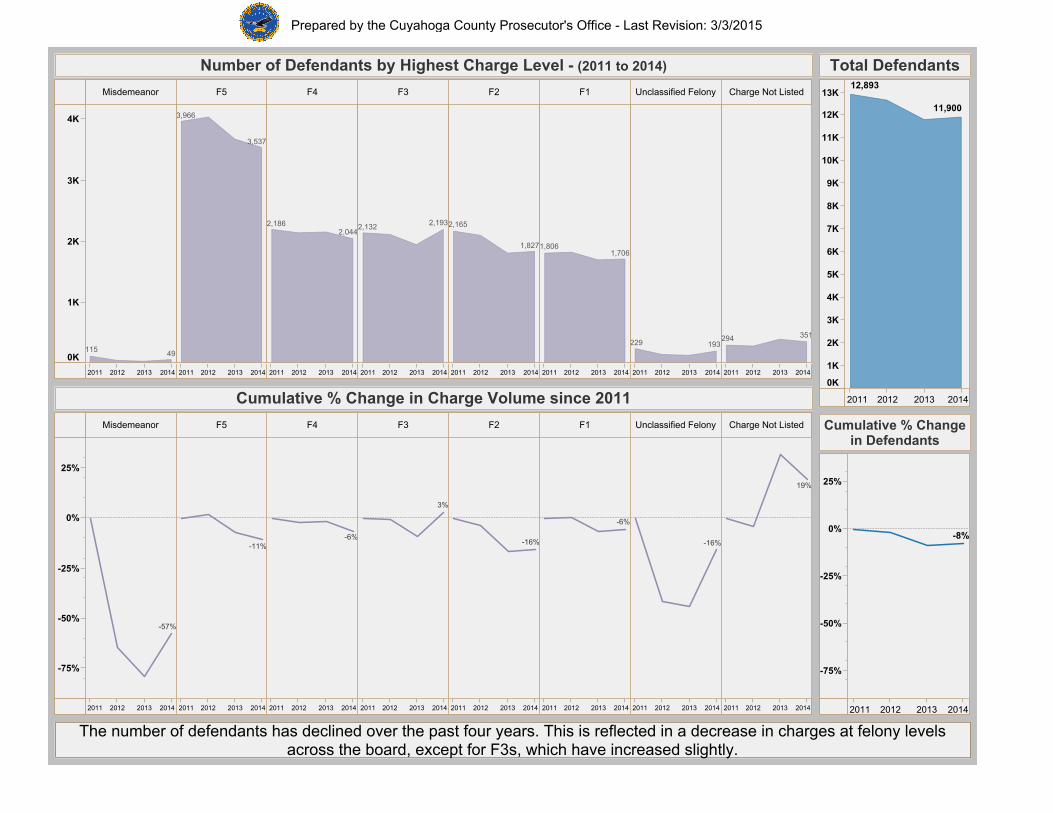
Number of Defendants by Highest Charge Level - (2011 to 2014)
2011 2012 2013 2014
0K
1K
2K
3K
4K
5K
6K
7K
8K
9K
10K
11K
12K
13K12,893
11,900
Total Defendants
Misdemeanor F5 F4 F3 F2 F1 Unclassified Felony Charge Not Listed
2011 2012 2013 20142011 2012 2013 20142011 2012 2013 20142011 2012 2013 20142011 2012 2013 20142011 2012 2013 20142011 2012 2013 20142011 2012 2013 2014
-75%
-50%
-25%
0%
25%
-57%
-11%-6%
3%
-16%
-6%
-16%
19%
Cumulative % Change in Charge Volume since 2011
2011 2012 2013 2014
-75%
-50%
-25%
0%
25%
-8%
Cumulative % Changein Defendants
The number of defendants has declined over the past four years. This is reflected in a decrease in charges at felony levelsacross the board, except for F3s, which have increased slightly.
Prepared by the Cuyahoga County Prosecutor's Office - Last Revision: 3/3/2015
2011 2012 2013 2014
Misdemeanor
F5
F4
F3
F2
F1
Unclassified Felony
Charge Not Listed
Grand Total -8%
19%
-16%
-6%
-16%
3%
-6%
-11%
-57%
-9%
32%
-44%
-7%
-17%
-9%
-2%
-7%
-79%
-2%
-4%
-41%
0%
-4%
-1%
-2%
2%
-64%
0%
0%
0%
0%
0%
0%
0%
0%
0%
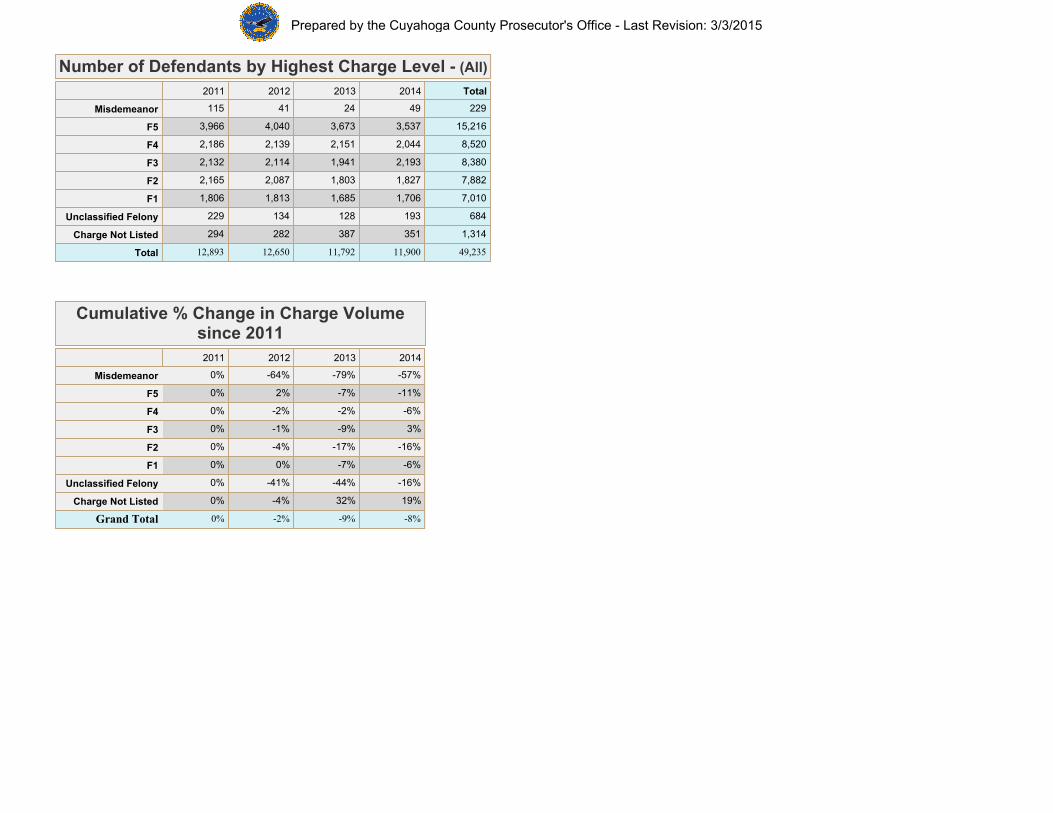
Cumulative % Change in Charge Volumesince 2011
2011 2012 2013 2014 Total
Misdemeanor
F5
F4
F3
F2
F1
Unclassified Felony
Charge Not Listed
Total 49,235
1,314
684
7,010
7,882
8,380
8,520
15,216
229
11,900
351
193
1,706
1,827
2,193
2,044
3,537
49
11,792
387
128
1,685
1,803
1,941
2,151
3,673
24
12,650
282
134
1,813
2,087
2,114
2,139
4,040
41
12,893
294
229
1,806
2,165
2,132
2,186
3,966
115
Number of Defendants by Highest Charge Level - (All)
Prepared by the Cuyahoga County Prosecutor's Office - Last Revision: 3/3/2015
Highest Defendant Charge
Misdemeanor F5 F4 F3 F2 F1 UnclassifiedFelony Charge Not Listed
20112012201320142011201220132014201120122013201420112012201320142011201220132014201120122013201420112012201320142011201220132014
AfricanAmerican
Caucasian
Hispanic
Other/NotListed
0750
1500
2250
0750
1500
2250
0750
1500
2250
0750
1500
2250
6321
2,456
1,881 1,393
1,272
1,500 1,487 1,459
1,118
1,349
1,198183 126 172 218
4823
1,375
1,390
705
623 566
555 622 567
397304
3926
9088
4260
10535
4428
4639
5235
613
104
8
1375
16153
10538
10545
9025
1434
3128
37
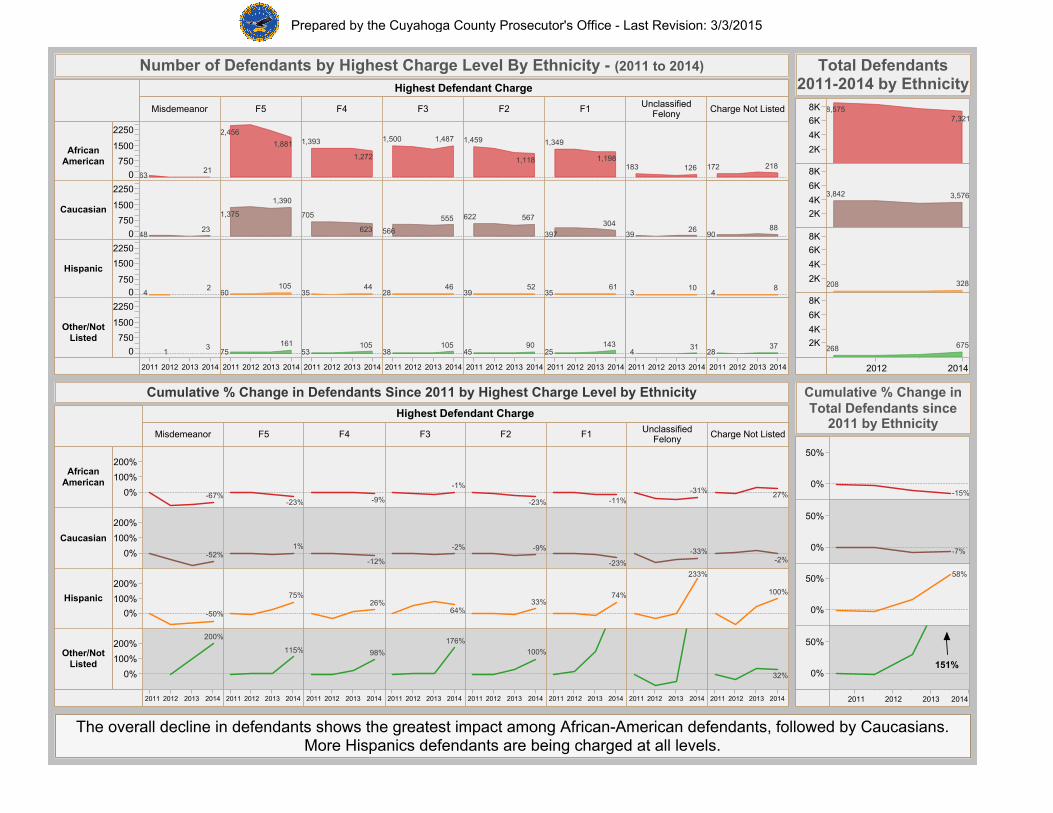
Number of Defendants by Highest Charge Level By Ethnicity - (2011 to 2014)
2012 2014
2K
4K
6K8K
2K4K
6K
8K
2K
4K
6K8K
2K4K
6K
8K
8,5757,321
3,842 3,576
208 328
268 675
Total Defendants2011-2014 by Ethnicity
Highest Defendant Charge
Misdemeanor F5 F4 F3 F2 F1 UnclassifiedFelony Charge Not Listed
20112012 2013 2014 20112012 2013 2014 20112012 2013 2014 20112012 2013 2014 20112012 2013 2014 20112012 2013 2014 20112012 2013 2014 20112012 2013 2014
AfricanAmerican
Caucasian
Hispanic
Other/NotListed
0%
100%
200%
0%
100%
200%
0%
100%
200%
0%
100%
200%
-67%-23% -9%
-1%
-23% -11%-31% 27%
-52%1%
-12%
-2% -9%
-23%
-33%-2%
-50%
75%26%
64%33%
74%
233%
100%
200%
115% 98%
176%100%
32%
Cumulative % Change in Defendants Since 2011 by Highest Charge Level by Ethnicity
2011 2012 2013 2014
0%
50%
0%
50%
0%
50%
0%
50%
-15%
-7%
58%
151%
Cumulative % Change inTotal Defendants since2011 by Ethnicity
The overall decline in defendants shows the greatest impact among African-American defendants, followed by Caucasians.More Hispanics defendants are being charged at all levels.
Prepared by the Cuyahoga County Prosecutor's Office - Last Revision: 3/3/2015
Misdemeanor
2011 2012 2013 2014
F5
2011 2012 2013 2014
F4
2011 2012 2013 2014
F3
2011 2012 2013 2014
African American African AmericanCaucasian CaucasianHispanic Hispanic
Other/Not Listed AsianNative American
Not SetOtherTotal
-67%-79%-83%0% -23%-10%2%0% -9%0%-1%0% -1%-11%-3%0%
-52%-77%-42%0% 1%-4%2%0% -12%-7%-3%0% -2%-10%1%0%
-50%-100%-75%0% 75%27%-3%0% 26%17%-31%0% 64%79%57%0%
0%
280%
100%
-15%
15%
300%
-15%
0%
300%
0%
0%
0%
-17%
267%
-100%
-29%
-3%
73%
0%
14%
0%
7%
-100%
-14%
0%
0%
0%
0%
-7%
843%
-75%
-15%
43%
25%
0%
43%
-75%
0%
0%
0%
-57%-79%-64%0% -11%-7%2%0% -7%-2%-2%0% 2%-9%-1%0%
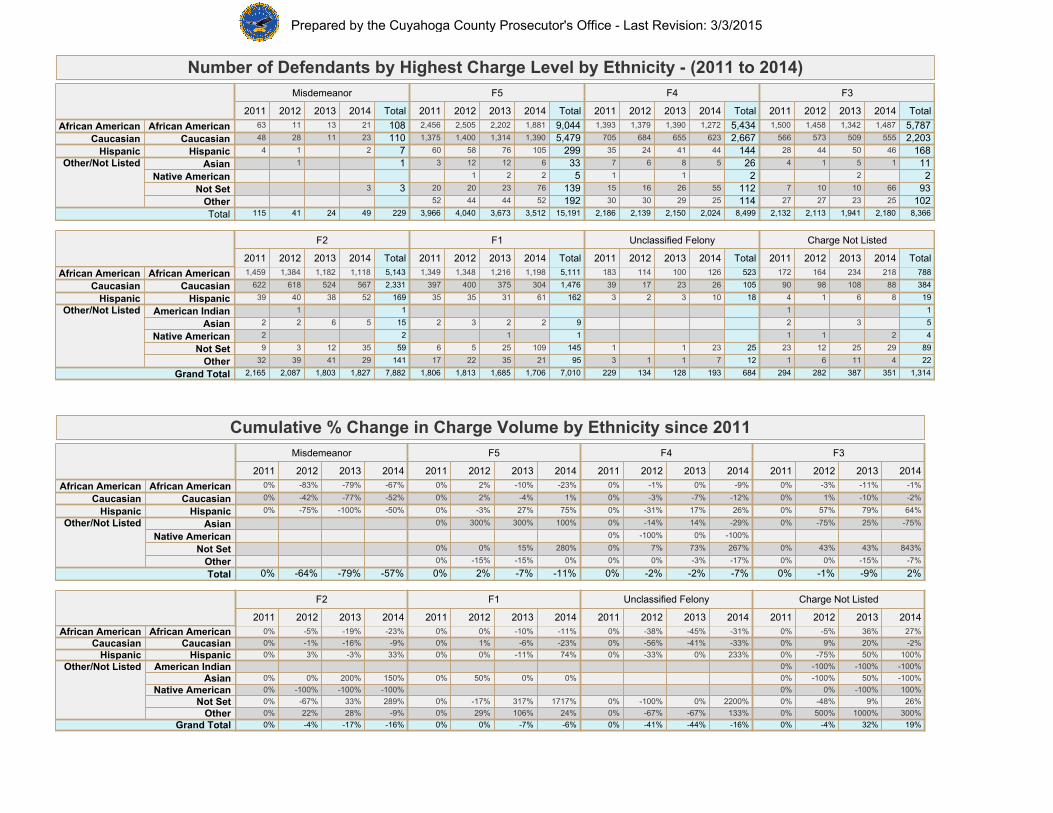
Cumulative % Change in Charge Volume by Ethnicity since 2011
F2
2011 2012 2013 2014
F1
2011 2012 2013 2014
Unclassified Felony
2011 2012 2013 2014
Charge Not Listed
2011 2012 2013 2014African American African American
Caucasian CaucasianHispanic Hispanic
Other/Not Listed American IndianAsian
Native AmericanNot SetOther
Grand Total
-23%-19%-5%0% -11%-10%0%0% -31%-45%-38%0% 27%36%-5%0%-9%-16%-1%0% -23%-6%1%0% -33%-41%-56%0% -2%20%9%0%33%-3%3%0% 74%-11%0%0% 233%0%-33%0% 100%50%-75%0%
-9%289%-100%150%
28%33%-100%200%
22%-67%-100%0%
0%0%0%0%
24%1717%
0%
106%317%
0%
29%-17%
50%
0%0%
0%
133%2200%
-67%0%
-67%-100%
0%0%
300%26%100%-100%-100%
1000%9%
-100%50%-100%
500%-48%0%
-100%-100%
0%0%0%0%0%
-16%-17%-4%0% -6%-7%0%0% -16%-44%-41%0% 19%32%-4%0%
F2
2011 2012 2013 2014 Total
F1
2011 2012 2013 2014 Total
Unclassified Felony
2011 2012 2013 2014 Total
Charge Not Listed
2011 2012 2013 2014 Total
African American African AmericanCaucasian CaucasianHispanic Hispanic
Other/Not Listed American IndianAsian
Native AmericanNot SetOther
Grand Total
5,1431,1181,1821,3841,459 5,1111,1981,2161,3481,349 523126100114183 788218234164172
2,331567524618622 1,476304375400397 10526231739 384881089890
16952384039 16261313535 1810323 198614
141
59
2
15
1
29
35
5
41
12
6
39
3
2
1
32
9
2
2
95
145
1
9
21
109
2
35
25
1
2
22
5
3
17
6
2
12
25
7
23
1
1
13
1
22
89
4
5
1
4
29
2
11
25
3
6
12
1
1
23
1
2
1
7,8821,8271,8032,0872,165 7,0101,7061,6851,8131,806 684193128134229 1,314351387282294
Misdemeanor
2011 2012 2013 2014 Total
F5
2011 2012 2013 2014 Total
F4
2011 2012 2013 2014 Total
F3
2011 2012 2013 2014 Total
African American African AmericanCaucasian CaucasianHispanic Hispanic
Other/Not Listed AsianNative American
Not SetOtherTotal
10821131163 9,0441,8812,2022,5052,456 5,4341,2721,3901,3791,393 5,7871,4871,3421,4581,500
11023112848 5,4791,3901,3141,4001,375 2,667623655684705 2,203555509573566
7214 299105765860 14444412435 16846504428
3
1
3
1
192139533
52
76
2
6
44
23
2
12
44
20
1
12
52
20
3
114112226
25
55
5
29
26
1
8
30
16
6
30
15
1
7
10293211
25
66
1
23
10
2
5
27
10
1
27
7
4
229492441115 15,1913,5123,6734,0403,966 8,4992,0242,1502,1392,186 8,3662,1801,9412,1132,132
Number of Defendants by Highest Charge Level by Ethnicity - (2011 to 2014)
Prepared by the Cuyahoga County Prosecutor's Office - Last Revision: 3/3/2015
Highest Defendant Charge
Misdemeanor F5 F4 F3 F2 F1 UnclassifiedFelony Charge Not Listed
20112012201320142011201220132014201120122013201420112012201320142011201220132014201120122013201420112012201320142011201220132014
Female
Male
0
500
1000
1500
2000
2500
3000
0
500
1000
1500
2000
2500
3000
3614
835
795
409
371 307
360 412
348145 158 50
12 6876
7935
3,129
2,738
1,776
1,672
1,824 1,831 1,7511,474
1,6611,523
179 169223 274
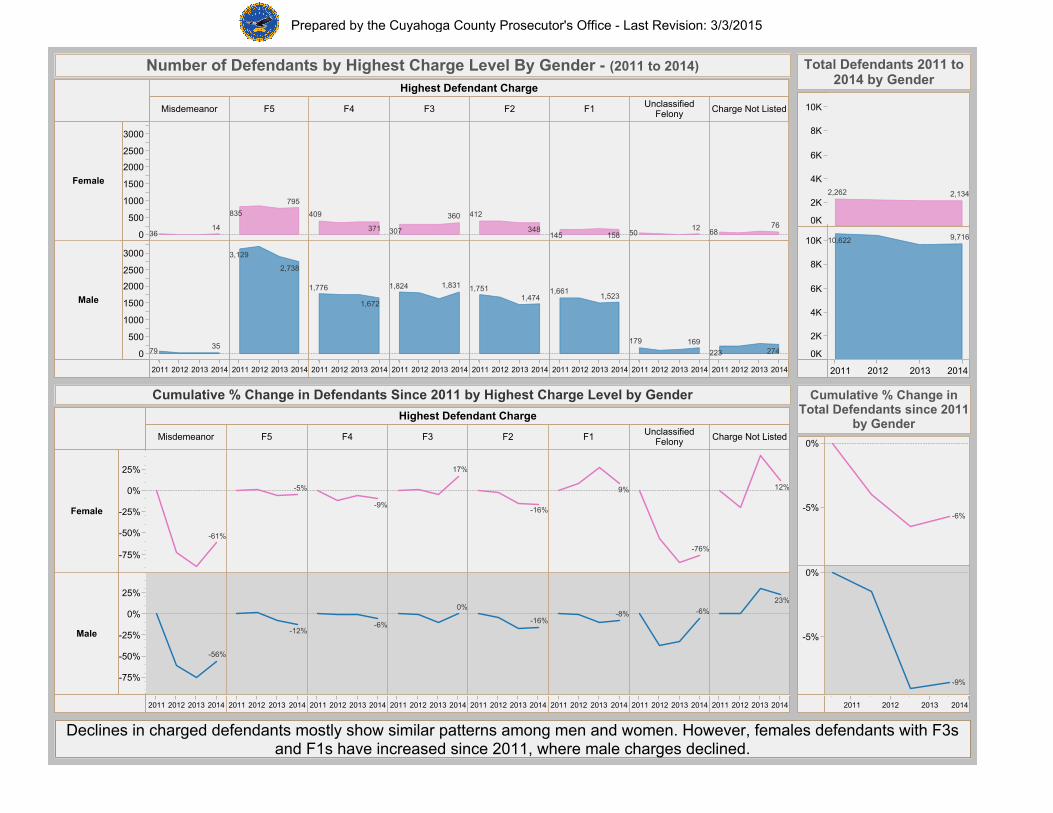
Number of Defendants by Highest Charge Level By Gender - (2011 to 2014)
2011 2012 2013 2014
0K
2K
4K
6K
8K
10K
0K
2K
4K
6K
8K
10K
2,262 2,134
10,622 9,716
Total Defendants 2011 to2014 by Gender
2011 2012 2013 2014
-5%
0%
-5%
0%
-6%
-9%
Cumulative % Change in Total Defendants since 2011
by GenderHighest Defendant Charge
Misdemeanor F5 F4 F3 F2 F1 UnclassifiedFelony Charge Not Listed
20112012201320142011201220132014201120122013201420112012201320142011201220132014201120122013201420112012201320142011201220132014
Female
Male
-75%
-50%
-25%
0%
25%
-75%
-50%
-25%
0%
25%
-61%
-5%
-9%
17%
-16%
9%
-76%
12%
-56%
-12%-6%
0%
-16%-8% -6%
23%
Cumulative % Change in Defendants Since 2011 by Highest Charge Level by Gender
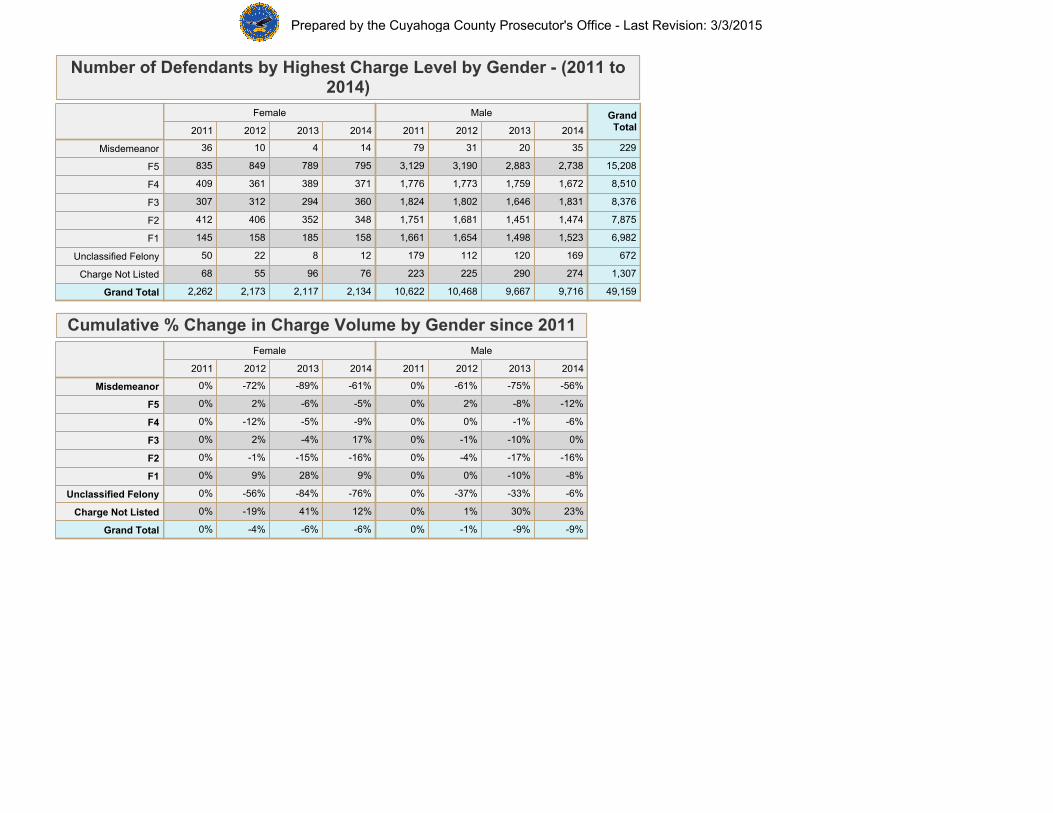
Declines in charged defendants mostly show similar patterns among men and women. However, females defendants with F3sand F1s have increased since 2011, where male charges declined.
Prepared by the Cuyahoga County Prosecutor's Office - Last Revision: 3/3/2015
Female
2011 2012 2013 2014
Male
2011 2012 2013 2014
GrandTotal
Misdemeanor
F5
F4
F3
F2
F1
Unclassified Felony
Charge Not Listed
Grand Total 2,134
76
12
158
348
360
371
795
14
2,117
96
8
185
352
294
389
789
4
2,173
55
22
158
406
312
361
849
10
2,262
68
50
145
412
307
409
835
36
9,716
274
169
1,523
1,474
1,831
1,672
2,738
35
9,667
290
120
1,498
1,451
1,646
1,759
2,883
20
10,468
225
112
1,654
1,681
1,802
1,773
3,190
31
10,622
223
179
1,661
1,751
1,824
1,776
3,129
79
49,159
1,307
672
6,982
7,875
8,376
8,510
15,208
229
Number of Defendants by Highest Charge Level by Gender - (2011 to2014)
Female
2011 2012 2013 2014
Male
2011 2012 2013 2014
Misdemeanor
F5
F4
F3
F2
F1
Unclassified Felony
Charge Not Listed
Grand Total -6%
12%
-76%
9%
-16%
17%
-9%
-5%
-61%
-6%
41%
-84%
28%
-15%
-4%
-5%
-6%
-89%
-4%
-19%
-56%
9%
-1%
2%
-12%
2%
-72%
0%
0%
0%
0%
0%
0%
0%
0%
0%
-9%
23%
-6%
-8%
-16%
0%
-6%
-12%
-56%
-9%
30%
-33%
-10%
-17%
-10%
-1%
-8%
-75%
-1%
1%
-37%
0%
-4%
-1%
0%
2%
-61%
0%
0%
0%
0%
0%
0%
0%
0%
0%
Cumulative % Change in Charge Volume by Gender since 2011
Prepared by the Cuyahoga County Prosecutor's Office - Last Revision: 3/3/2015
Highest Defendant Charge
Misdemeanor F5 F4 F3 F2 F1 Unclassified FelonyCharge Not Listed
2011 2012 2013 2014 2011 2012 2013 2014 2011 2012 2013 2014 2011 2012 2013 2014 2011 2012 2013 2014 2011 2012 2013 2014 2011 2012 2013 2014 2011 2012 2013 2014
Cleveland
Suburbs
0250500750100012501500175020002250
0250500750100012501500175020002250
4435
2,145
1,735
1,186
949
1,2161,077 1,280
1,154 1,243
1,085
164 140206 253
71 14
1,819 1,798
999
1,094
915
1,114883
668563
596
6541
85 97
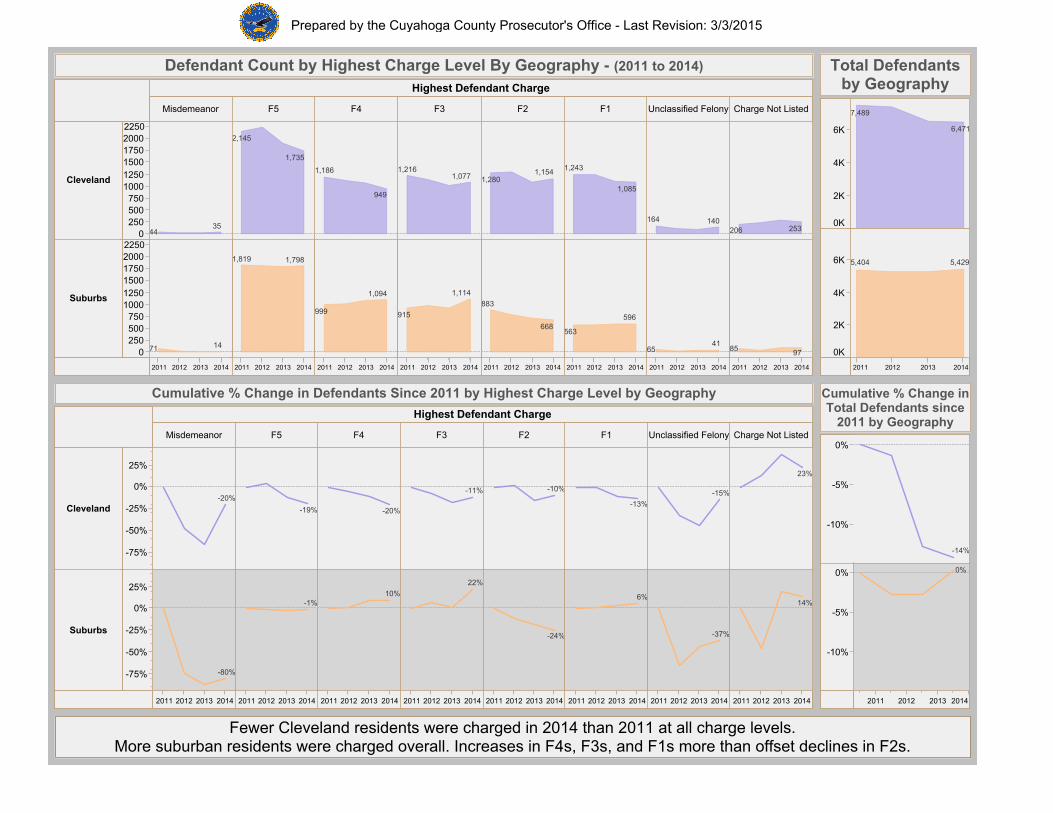
Defendant Count by Highest Charge Level By Geography - (2011 to 2014)
2011 2012 2013 2014
0K
2K
4K
6K
0K
2K
4K
6K
7,489
6,471
5,404 5,429
Total Defendantsby Geography
Highest Defendant Charge
Misdemeanor F5 F4 F3 F2 F1 Unclassified FelonyCharge Not Listed
20112012201320142011201220132014201120122013201420112012201320142011201220132014201120122013201420112012201320142011201220132014
Cleveland
Suburbs
-75%
-50%
-25%
0%
25%
-75%
-50%
-25%
0%
25%
-20%
-19% -20%
-11% -10%
-13%-15%
23%
-80%
-1%10%
22%
-24%
6%
-37%
14%
Cumulative % Change in Defendants Since 2011 by Highest Charge Level by Geography
2011 2012 20132014
-10%
-5%
0%
-10%
-5%
0%
-14%
0%
Cumulative % Change inTotal Defendants since2011 by Geography
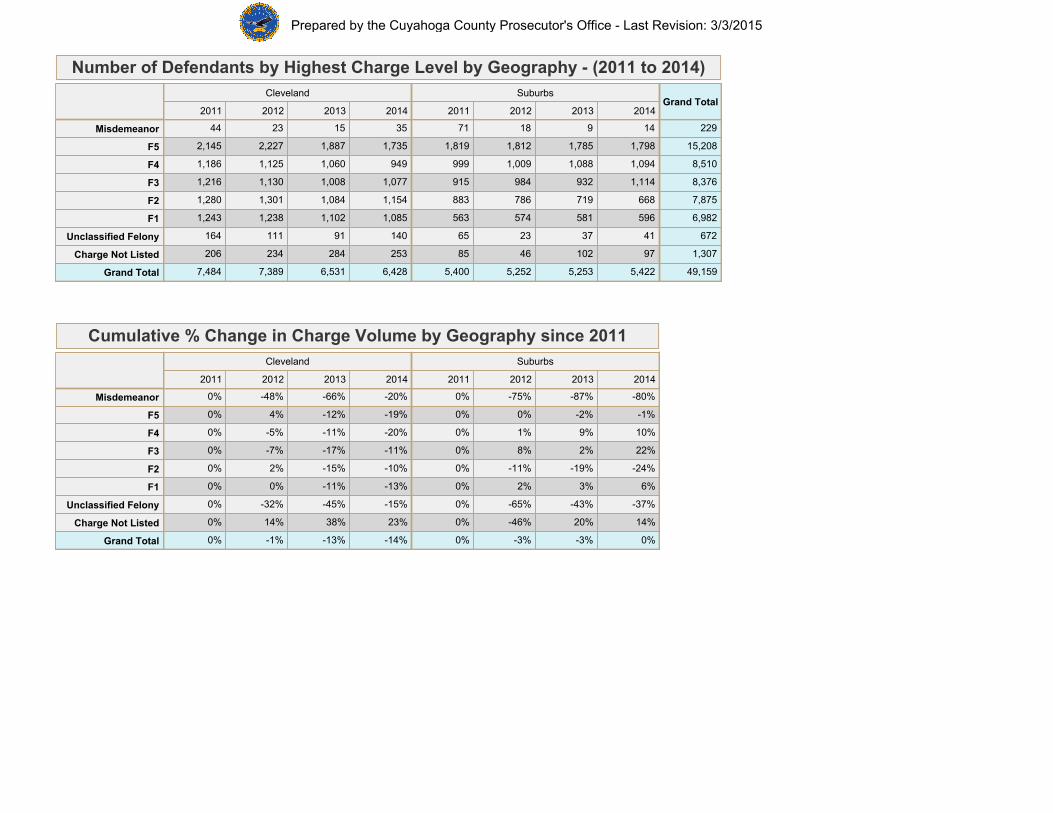
Fewer Cleveland residents were charged in 2014 than 2011 at all charge levels. More suburban residents were charged overall. Increases in F4s, F3s, and F1s more than offset declines in F2s.
Prepared by the Cuyahoga County Prosecutor's Office - Last Revision: 3/3/2015
Cleveland
2011 2012 2013 2014
Suburbs
2011 2012 2013 2014Grand Total
Misdemeanor
F5
F4
F3
F2
F1
Unclassified Felony
Charge Not Listed
Grand Total 6,428
253
140
1,085
1,154
1,077
949
1,735
35
6,531
284
91
1,102
1,084
1,008
1,060
1,887
15
7,389
234
111
1,238
1,301
1,130
1,125
2,227
23
7,484
206
164
1,243
1,280
1,216
1,186
2,145
44
5,422
97
41
596
668
1,114
1,094
1,798
14
5,253
102
37
581
719
932
1,088
1,785
9
5,252
46
23
574
786
984
1,009
1,812
18
5,400
85
65
563
883
915
999
1,819
71
49,159
1,307
672
6,982
7,875
8,376
8,510
15,208
229
Number of Defendants by Highest Charge Level by Geography - (2011 to 2014)
Cleveland
2011 2012 2013 2014
Suburbs
2011 2012 2013 2014
Misdemeanor
F5
F4
F3
F2
F1
Unclassified Felony
Charge Not Listed
Grand Total -14%
23%
-15%
-13%
-10%
-11%
-20%
-19%
-20%
-13%
38%
-45%
-11%
-15%
-17%
-11%
-12%
-66%
-1%
14%
-32%
0%
2%
-7%
-5%
4%
-48%
0%
0%
0%
0%
0%
0%
0%
0%
0%
0%
14%
-37%
6%
-24%
22%
10%
-1%
-80%
-3%
20%
-43%
3%
-19%
2%
9%
-2%
-87%
-3%
-46%
-65%
2%
-11%
8%
1%
0%
-75%
0%
0%
0%
0%
0%
0%
0%
0%
0%
Cumulative % Change in Charge Volume by Geography since 2011
Prepared by the Cuyahoga County Prosecutor's Office - Last Revision: 3/3/2015