Embed Size (px)
Citation preview
LAND ECONOMY WORKING PAPER SERIES___________________________________________________________________
Number 18. Measuring the Sustainability of the UK Food Chain
Corresponding Author:
Andrew BarnesLand Economy Research GroupResearch DivisionSAC EdinburghEH9 3JG
Tel: 0131-535-4042E-Mail: [email protected]
2
Measuring the Sustainability of the UK Food Chain
Barnes, A.P.1 and McVittie, A., Land Economy Research Group, SAC, West Mains
Road, Edinburgh, EH9 3JG
Abstract: Recent policy interest has been directed at the sustainability of food
industries, in particular the post-farm gate food chain. This comprises of
manufacturing, wholesaling, retailing and catering. In order to measure sustainability
Byerlee and Murgai (2001) have argued that productivity measures, alongside key
indicators of resource quality trends, should be used to indicate sustainable growth.
This paper adopts this approach by presenting Fisher indexes of both Total Factor
Productivity (TFP) index and for prominent externalities emerging from the food
chain over the period 1998 to 2002.
TFP shows an average annual growth rate of –0.52% per annum. Input growth, in
particular intermediate purchases, has outstripped output growth over the entirety of
this period. In addition, major externalities of environmental and social costs have
increased over this period. Consequently, both sets of indicators give a somewhat
bleak assessment of the sustainability of the UK food chain.
1 Corresponding author. E-Mail: [email protected]
Keywords: Total Factor Productivity; Externalities; Sustainable Growth
3
Measuring the Sustainability of the UK Food Chain
1.0 Introduction
The UK food chain has raised a number of concerns from consumers and policy
makers. Environmental damage from the production and distribution of food products
has led to a very real degradation in the quality of life in both rural and urban areas.
In essence, awareness has been growing regarding the levels of nitrate within water
supplies, the effects of ammonia on the quality of air and the overall effects on human
health of chemical application to food products. For the consumer generally, the issue
of food miles and congestion seems to be of major importance (AEA Technology,
2005).
Sustainable growth is a key policy concern for this industry. The Sustainable Food
and Farming Strategy (SFFS), which was published by Defra in 2002, aimed to bring
a ‘reconnection’ of the food chain with customers, the world economy and the
environment. It’s central pillars were economic, social and environmental growth.
This development would be measured by improvements in indicators of sustainable
development. Food chain productivity is one of the 11 headline indicators within the
SFFS. In addition, Defra’s proposed Food Industry Sustainability Strategy (FISS),
which is directed at the four sectors of food manufacturing, wholesaling, retailing and
catering, aims to encourage the adoption of best practice to help achieve sustainable
development.
Lynam and Herdt (1989) have argued that Total Factor Productivity (TFP), the ratio
of most inputs to outputs, is an appropriate means of measuring sustainable
development, because a non-negative trend in TFP growth implies that outputs are
growing at least as fast as inputs. Within the whole schema of sustainability it could
be argued that positive TFP growth allows economic and social benefits as well as an
indication of greater efficiency of resource use, which ultimately improves
environmental quality. However, this may be a somewhat charitable view of the
ability of a TFP index to pick up the full consequences of sustainable growth within a
single measure. Sustainable growth comprises a set of complex interactions typified
through the physical, natural and social sciences. As a result the relationships
4
between these aspects of sustainability cannot be adequately modelled through a
solely market-based measurement instrument. Byerlee and Murgai (2001) argue that
productivity is a starting point for measuring sustainability, but has to be interpreted
in relation to resource quality trends. These trends, identified as changes to the
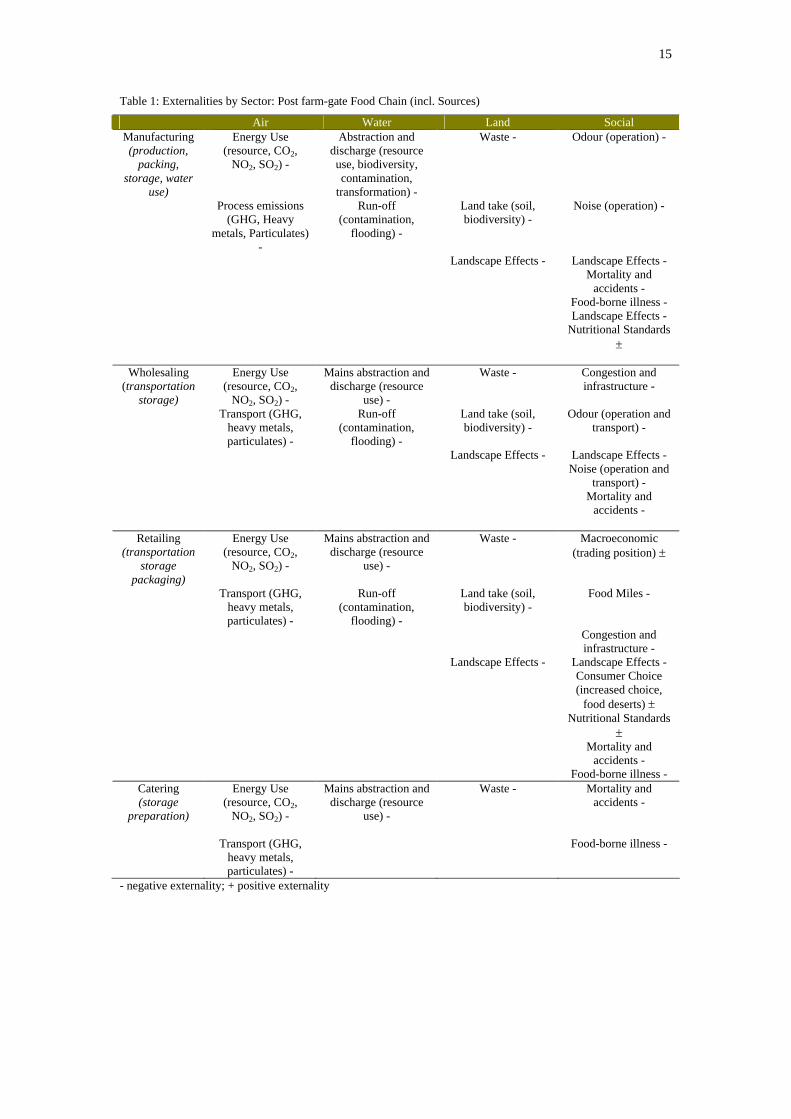
amount of externalities produced by the food industries, could be outlined in Table 1
below.
Table 1: Externalities by Sector: Post farm-gate Food Chain (incl. Sources)
Consequently, this paper focuses on this approach to present both a TFP index for
these food industries, alongside indexes of environmental and social impacts, to give a
clearer picture of sustainability. The next section presents the methodology adopted
for constructing the indexes and data collection issues.
2.0. Methodology
This section outlines the methodology adopted for measuring Total Factor
Productivity within the food industries. Ultimately, discussion of TFP construction
focuses on a number of important factors which need to be addressed, these are i)
choice of indexing procedure, ii) collection of appropriate data, and iii) treatment of
capital and labour inputs. These are discussed in detail below.
Choice of Indexing Procedure
As a TFP index is a measure of growth the choice of index is important, as it will
affect growth rates if the wrong procedure is chosen. Ultimately, an indexing
procedure mimics the underlying production, cost or profit function formed by a
firm’s behaviour. A number of indexing procedures exist which aim to mimic the
function of how inputs are converted to outputs. When the underlying production
function is non-linear, more complex indexing techniques can be applied, namely the
Fisher index and the Tornqvist-Theil index. The Fisher index is appropriate for a
quadratic functional form and is the geometric mean of the Laspeyres and Paasche
quantity indexes The Tornqvist-Theil index is appropriate for a translog function and
relies on a system of both factor shares and on smoothing a previous year’s prices and
quantities, rather than relying on a base period. Both have proved the most popular
within productivity analysis, principally because they are flexible functional forms
5
and make no prior assumptions over the relationship between inputs and outputs. For
this research the Fisher index was chosen, primarily for two main reasons. Firstly,
from an axiomatic point of view, the Fisher index passes a number of statistical tests
and therefore offers something that is more robust statistically than the Tornqvist-
Theil index (Diewert, 1976). Secondly, whilst the Tornqvist-Theil has been used in
several productivity studies the Fisher index is the most popular amongst policy-
makers and central statistical agencies and, it could be argued, is broader in scope
than solely economic orientations offered by the Tornqvist-Theil. For this study,
which constructs indexes of environmental and social indicators, the Fisher index
seems to offer a better approach. Formally, the Fisher output index can be stated as:-
y =
0101
0 y
yW
y
yW it
M
it
itM
i
(1)
Essentially, Laspeyres and Paasche indexes are constructed as the sum of weights, i =
1…M, multiplied by each ‘i-ith’ output quantity change in period t compared to the
base period. A similar formulation is adopted for inputs. In addition, chaining was
adopted to avoid ‘substitution bias’. This is because fixing measurements of growth
against a particular year will increasingly bias the index away from actual labour and
capital substitution as the index moves away from the base year. Chaining obviates
this problem by comparing a year’s performance against the previous year.
The food supply chain consists of a number of integrated sectors. Thus, most outputs
from one sector will become inputs to the next sector downstream. Consequently,
some account needs to be made of the contribution of productivity gains in one sector
which would also benefit the sectors downstream. Accordingly, not only would total
food sector productivity aggregate the four separate indexes produced, but would also
‘integrate’ the growth in productivity of each sector. Most studies adopt ‘Domar’
weights which aims to incorporate these integrative effects. Oulton (2004) specified
that the aggregate TFP index should be the weighted average in TFP growth rates
where the weights are each sector’s shares in final output. This is the form of Domar
aggregation adopted here.
6
Data Sources
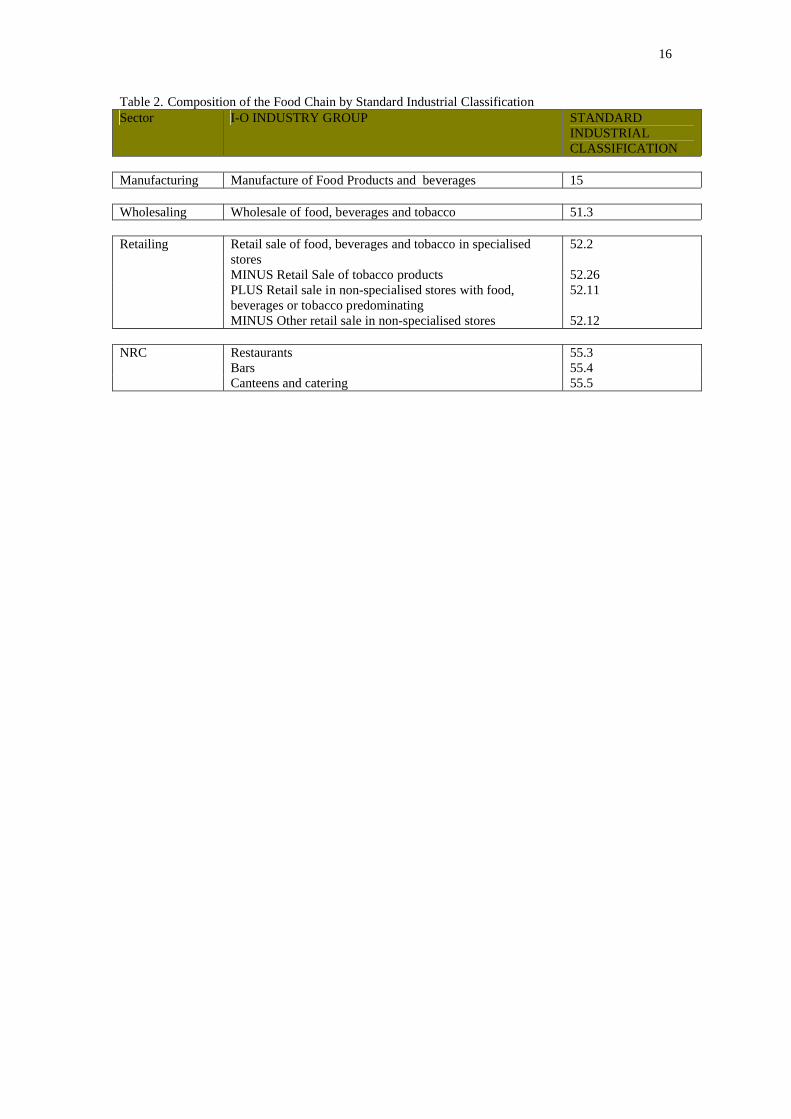
Table 2 shows the definition of the post-farm gate food chain by UK standard
industrial classification.
Table 2. Composition of the Food Chain by Standard Industrial Classification
The main data source for inputs and outputs was the Annual Business Inquiry (ABI),
which provides data from 1998 onwards of Standard Industrial Classifications2. The
ABI collects data on 13 variables, including turnover, gross value added, and major
inputs such as labour employed and cost, capital expenditure and purchases of
materials. Data are collected through the ONS to provide a representative sample of
UK businesses and offers a robust data set. Applications of ABI data include
production of annual employment estimates, calculation of gross value added for the
measurement of GDP, productivity estimates, input-output tables and other national
accounts applications. However, given the survey nature of data collection there are
both non-response errors and sampling errors. These are discussed in some depth
within the quality control section of the ABI website3.
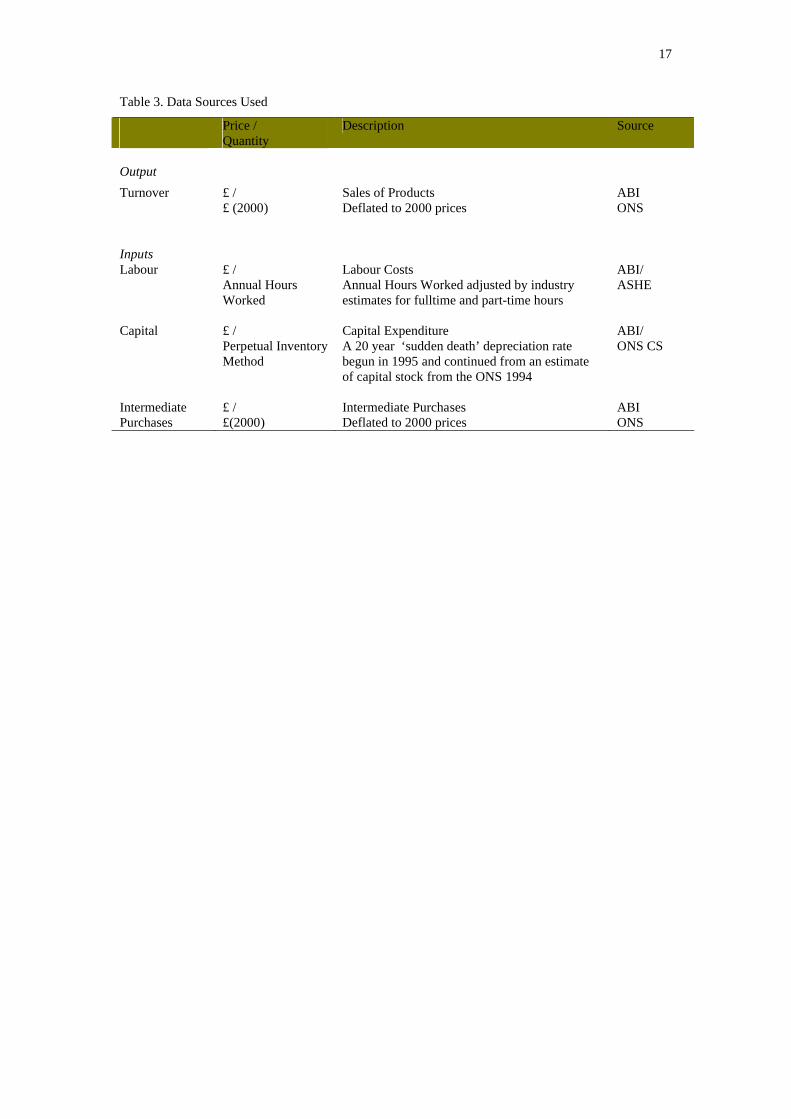
This was complemented by the ONS Capital Stock Series (CS) and the Annual Survey
of Hours and Earnings (ASHE), also collected by the ONS, to measure total hours
worked for full-time and part-time workers for each industry sector. Deflation
occurred from specific ONS time series. It therefore provides a data set at sufficient
detail to examine the four sectors downstream from farming.
Table 3. Data Sources Used
Treatment of Outputs
An OECD (2001) review of productivity measurement found that, whilst labour
productivity is the most frequently calculated index of performance, this is followed
by TFP measures using both value-added or total turnover. The advantage of using
2 http://www.statistics.gov.uk/abi/3 http://www.statistics.gov.uk/abi/quality_measures.asp
7
total turnover is that it includes most factors of production, such as labour, capital,
materials and energy, which can be examined as separate factors of production,
something the value added approach does not offer. Within the aggregate series total
turnover is used as the single output measure. These exist within the Annual Business
Inquiry for each sector over the time period of study.
Treatment of Inputs
Three inputs were used for the TFP analysis, specifically capital, labour and
intermediate purchases. These are discussed in more detail below.
a) Physical Capital Stock
A firm will have a stock of capital at any one time which will be composed of assets
of differing ages. However, this is not a direct input into the production process, it is
the ‘flow of physical capital services’ which should be included into the TFP
measure. This is not directly observable but is usually considered as directly
proportional to the stock of physical capital. Consequently, to understand how capital
affects production, a series for capital stock needs to be constructed which takes into
account the loss in relative efficiency from older stock compared to fresher stock.
This can be done using the ‘perpetual inventory model’ (PIM) which allows for this
service charge to be computed each year. A PIM can be constructed from:-
st
s
sst IK
0
(2)
where Kt is the sum of capital stock for a particular asset in period t, which is
composed of a number of assets of s vintages (where s=0,…,S); I is the investment in
that particular asset in periods t-s and is the relative efficiency of an s-vintage asset
to a new asset. Essentially this model sums an asset’s efficiency at a particular point
in time, taking into account past investments which will be increasingly less efficient
than new investments in that asset and which, at a particular point in time, will be
removed from the capital stock series. Consequently, in order to use the PIM several
pieces of information need to be obtained, namely:
8
an initial estimate of capital stock needs to be made. As the industry has been in
existence for a number of years before the series begins, assets have been invested
into and exist at the beginning of the study period. This will be added to annually
by net capital expenditures (given in the ABI). Fortunately, the ONS have
calculated capital stock series for a number of industries from 1948 onwards.
some assumption needs to be made of the service life of the asset to dictate the
depreciation rates used within the capital stock series and, also, to reflect the
relative shares of efficiency within the age profile of the stock. Unfortunately,
within the ABI series, no split between the type of asset exists. Consequently, this
study adopts all assets as one series and takes a rather arbitrary service life for all
assets at 20 years.
an age structure of the stock. Sudden death (sometimes know as ‘lightbulb
efficiency’) may be the most realistic schedule to adopt for the food industries as
it assumes that both machinery and buildings are maintained to an optimum until
they are disposed of. This must be true for a number of sectors within the food
chain as plant and machinery, such as refrigeration devices and transportation
have to be kept to their optimal efficiency otherwise this would result in food
spoilage. The only sector where this may not apply is the food manufacturing
sector. However, for the sake of consistency sudden death depreciation has been
adopted for all sectors.
b) Labour Inputs
In order to gather data on hours per sector the Annual Survey of Hours and Earnings
(ASHE) exists, which charts back to 1998. The advantage of using the ASHE is that
it gives median rates for total hours worked by industry (SIC) code and hence
obviates the problem of using economy wide rates. Furthermore, it gives an estimate
of weekly hours worked both full-time and part-time. A drawback is that median
rates are a weekly average and therefore assumptions need to be made on the number
of weeks worked per year to provide an annual series. As industry specific estimates
9
could not be gathered, the legal minimal number of weeks allowed for paid leave has
been used, which at present is four weeks including public holidays.
c) Purchased Inputs
In the food supply chain purchased inputs compose the bulk of total inputs within the
production process. These include purchases of raw materials and, along the supply
chain, processed products in addition to energy and packaging requirements. The
series directly reflects prices and quantities used as an input and little needs to be done
before it is applied to the TFP series. Appropriate sector specific deflators were
adopted to provide the quantity series.
d) Externalities to the Food Chain
Undesirable outputs were gathered from several data sources. The Office of National
Statistics publishes a range of environmental impacts and resource use data by
industry in the Environmental Accounts (ONS, 2004). A number of other data sources
have also been used specifically for transport externalities (AEA Technology, 2005);
food borne illnesses (UK public health agencies) and accidents and mortality (Health
and Safety Executive). However, caveats and omissions should be noted. Much of the
data on energy use and emissions is collected at a lower resolution than the food
chain. Whilst data for food and drink manufacturing is sector specific, data for
wholesaling, retail and catering does not distinguish between food and non-food chain
businesses. Furthermore, there are important gaps in the data, specifically on waste
generation and water consumption.
In order to produce indexes of growth a constant and current price series needs to be
constructed and some deflation needs to occur. Appropriate price deflators were
adopted for the four sectors from the ONS and then aggregated. For externalities,
deflation is not required as quantities exist for each external effect.
3.0 Results
Figure 1 shows the TFP index for the four food industries from 1998 onwards,
alongside both output and input series.
10
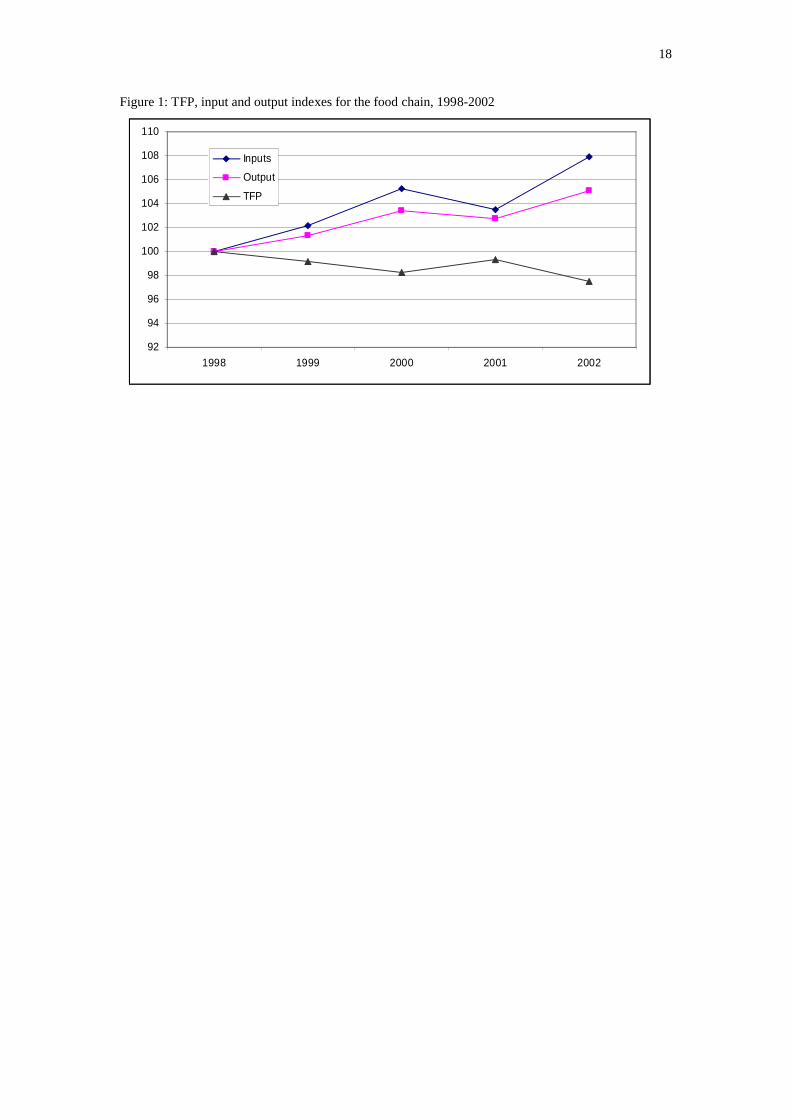
Figure 1: TFP, input and output indexes for the food chain, 1998-2002
Figure 1 shows that input growth exceeded growth in output throughout this period.
This seems to reflect the depressive effects of retailing and wholesaling, which both
experienced strong input growth. Annual average (compound) growth rates of the
productivity index over this period were -0.52% for the food chain, which reflects the
negative TFP rates recorded in three sectors; wholesale, retail and non-residential
catering. Food manufacturing was the only sector to garner positive growth rates.
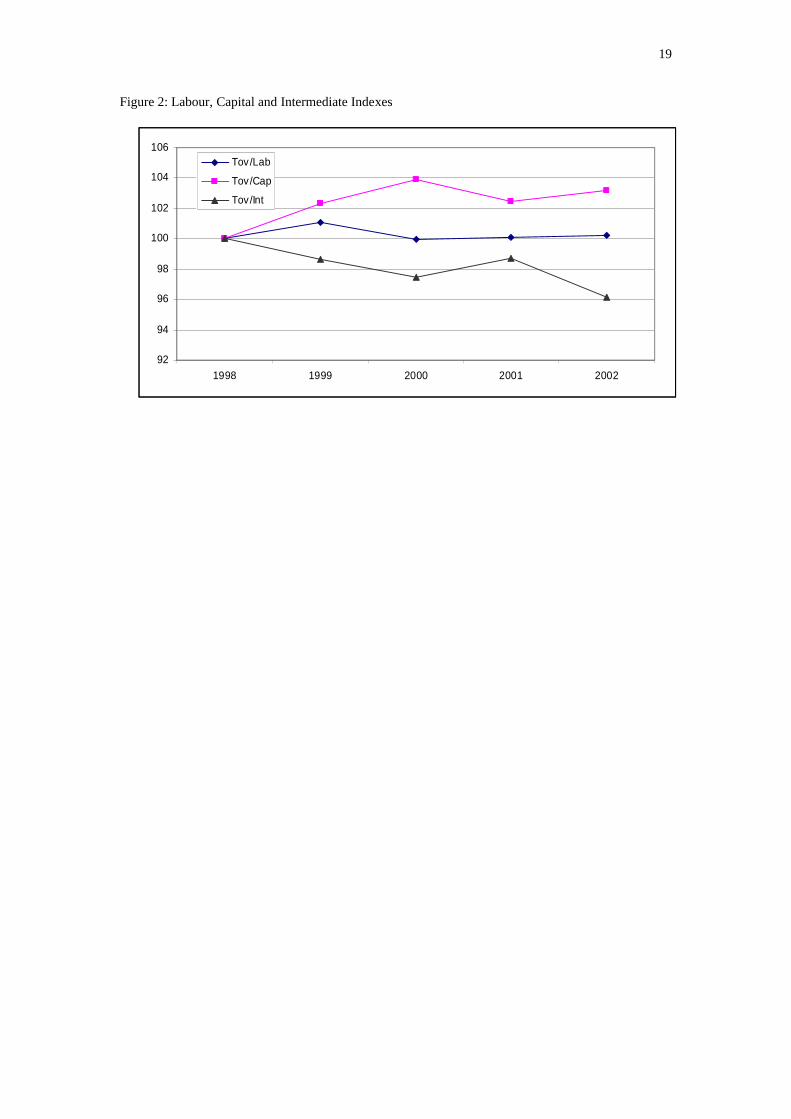
When examining partial productivity rates it is clear that intermediate productivity is
the major cause of downward rates of TFP growth. Figure 2 illustrates them over the
period.
Figure 2: Labour, Capital and Intermediate Indexes
Labour productivity shows strong growth over the period of 0.4% per annum. The
highest growth rate has been in capital stock which shows an average increase of
1.16% per annum. However, this is negated by strong falls in the intermediate
productivity series of –0.90%. This has led to higher growth rates in inputs compared
to output growth.
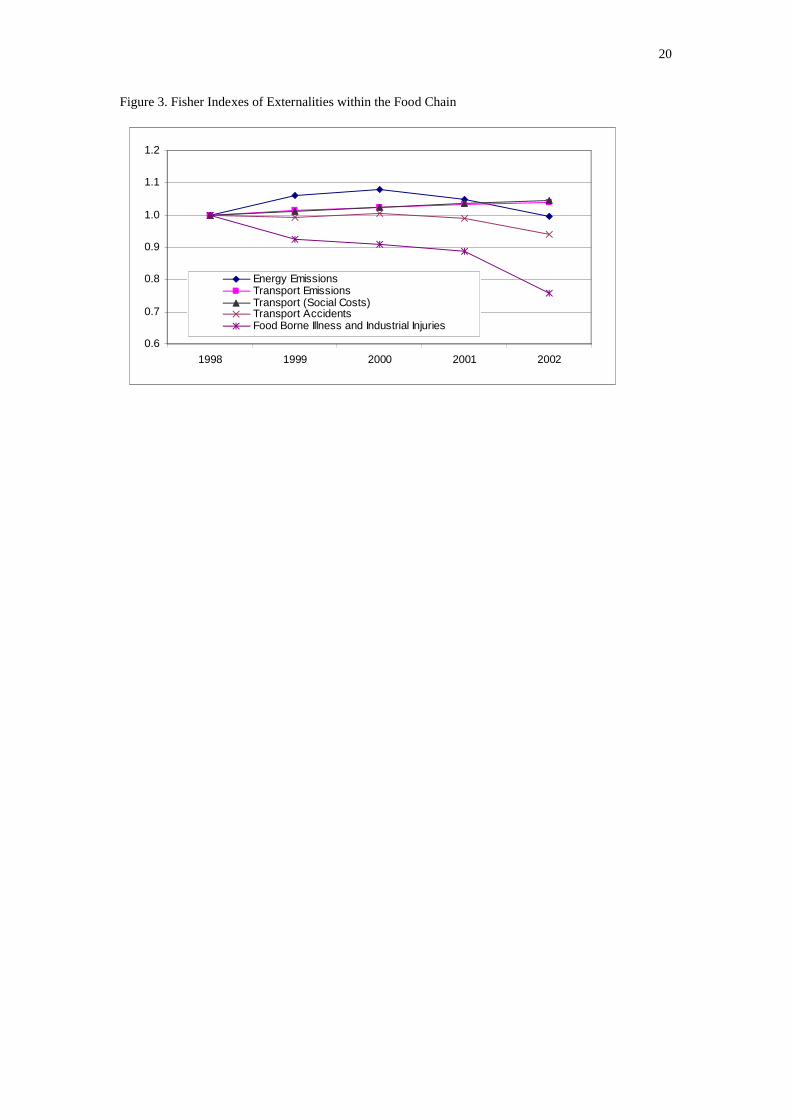
Indexes of Externalities
To complement the TFP index presented above a number of fisher indexes are
presented to illustrate the changes in externalities over the same period. Essentially
five indexes have been constructed, namely i) Energy emissions, ii) Transport
Emissions, iii) Transport (social costs), iv) Transport accidents within the Food Chain,
and v) Food-borne illness and industrial injuries (Social Costs). These are described
in greater detail below.
Figure 3. Fisher Indexes of Externalities within the Food Chain
11
Energy emissions consist of greenhouse gas emissions, acid rain precursor emissions,
PM10 and volatile organic compound (VOC) emissions. This index shows a rise over
this period, reaching a peak in 2000, which then arcs downward to 1998 levels. The
shadow prices for these emissions, and for transport below, are derived from damage
estimates reported in AEA Technology (2005).
Transport Emissions show a rise over this same period, the major rise occurs from
PM10 emissions, of the remainder volatile organic compounds remained relatively
stable. (NOx and SOx) CO2 emissions garner the greatest revenue share of this group
with just under 50% of all costs, this is followed by PM10, with a 33% share of costs.
The remainder, NOx, SOx and VOC garner the remaining 17%.
Noise congestion and infrastructure constitute the social costs of transport. This index
seems to have risen over the period, however impacts due to both LGV and HGV use
has declined over the period, which indicates some reduction in the negative effect of
the supply chains. This constitutes an average social cost of £2 billion per annum.
However, food chain related car usage has substantially increased, predominantly this
consists of visits to and from the supermarkets with distances travelled increasing
from 12.6 billion to 14.3 billion kilometres over the period. This increase is primarily
due to an increase in the average distance of each trip as the number of trips has
decreased (AEA Technology, 2005).
The inclusion of the external impacts of car use may be questioned in an exercise
aimed at determining the sustainability of the food chain industries as these relate to
externalities generated by the household sector. However, the increased use of cars in
distance terms does represent a transfer of externality generation from the food
industry to households. The shadow prices for the social external costs are derived
from estimates provided in AEA Technology (2005).
Transport accidents show the trend in accident rates for vehicles operating within the
food chain. Accident rates for lorries LGV and HGV have reduced over the period
where accidents from car usage saw a slight increase over 2000 to 2001 and then
returned to 1998 levels. However, around 60% of the cost share of this index come
12
from car accidents. The externality costs of road transport accidents comprise casualty
related costs (lost output, medical and ambulance, and human costs) and accident
related costs (police costs, insurance and administration, and damage to property) and
are derived from Department for Transport estimates based on vehicle type and
accident severity (DfT, 2003).
Food-borne illness and industrial injuries constitute the social costs of the food chain.
Generally, the number of injuries related to the food chain have declined over the
period as have the cases of food poisoning. Both series have reduced by around 20
points. However, injuries are minimal making up only 16% of the external costs of
the food chain of this group. The remaining 84%, around £350 million, emerges from
cases of food poisoning. Estimates of the external costs for incidences of food-borne
illness include the costs of lost production, health service costs, and pain and
suffering, and were derived from FSA (2004). The external costs of industrial injuries
include health service costs and pain and suffering. Health service costs estimates
were not available, so only pain and suffering costs were included, these being
estimated from willingness to pay to avoid death and varying severities of injury as
published in FSA (2004).
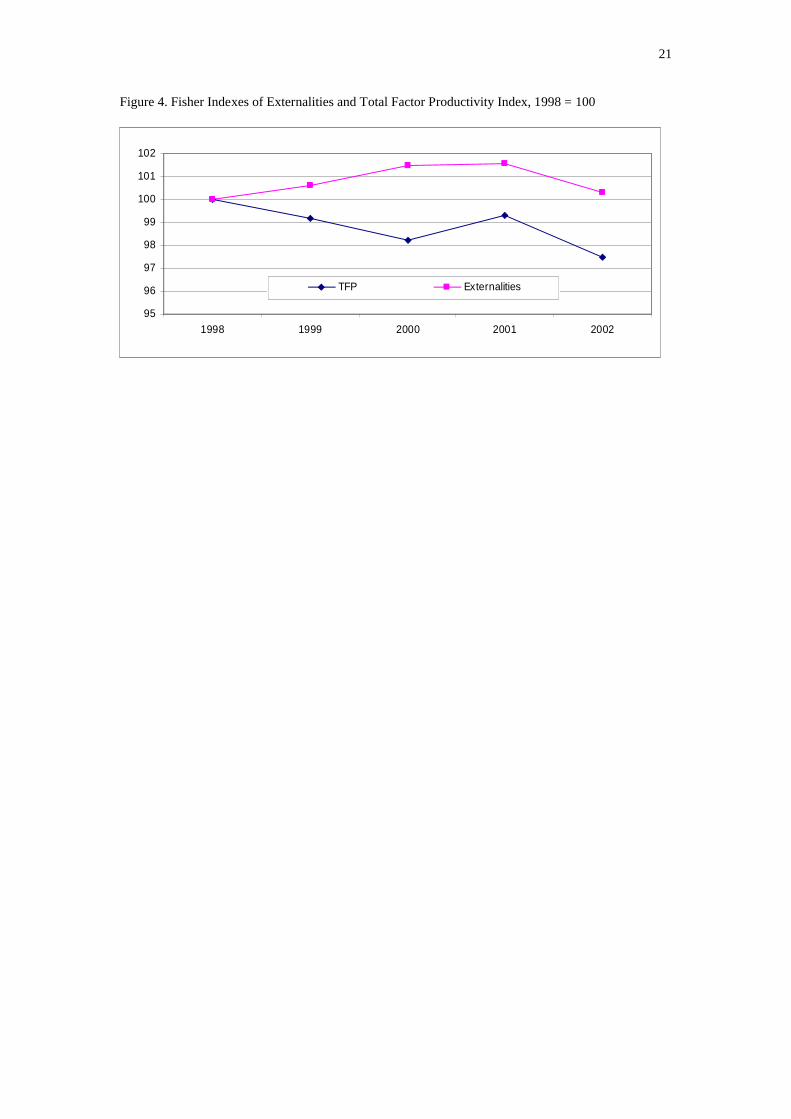
The final figure shows both the TFP index and an index for all externalities,
determined using the Fisher indexing methodology outlined above.
Figure 4. Fisher Indexes of Externalities and Total Factor Productivity Index,
1998 = 100
Essentially, the TFP index is downward, which reflects the higher growth in inputs
compared to outputs which indicates a negative trend sustainable growth for the food
chain over this period. In addition, the high growth in externalities throughout most
of this period, also shows a reduction in resource quality trends and thus negative
impacts on sustainable growth. Consequently, we can conclude that on both fronts
that the food chain post-farmgate is not producing a sustainable level of growth.
13
Conclusions
UK policy making aims to promote sustainable growth within its industries.
Productivity, which relates trends in input usage to output growth, is often used by
Government as it offers a particular perspective on an industry’s development.
Nevertheless, with an increased policy focus on measuring sustainable growth, TFP
seems inadequate when aiming to fully reflect quality changes in resource use due to
the complexity of relationships between economic, social and environmental
development. Accordingly, when coupled with indicators of resource related
externalities, a more detailed picture of sustainable growth emerges.
This study has found that TFP indexes are decreasing over the period of study, in
conjunction with a general increase in the index for externalities produced by the food
chain. Accordingly, for the bulk of this period, both indexes seem to have trended
away from sustainable growth. There are consequences for the long term
sustainability of the food chain. Firstly, a long term trend in TFP gives an indication
of an economy’s underlying productive capacity. It can therefore be used as a
measure of potential growth and possible inflationary pressure. Furthermore, the
differential between rates of input and output growth is composed of a number of
phenomena, such as economies of scale and cost efficiencies, important for business.
Consequently, Harberger (1998) identified that growing productivity is an indicator of
the potential real cost savings that can be achieved over time. These benefits are
consequently being lost to the food chain if TFP continues this trend.
The rise in externalities provide further evidence of movement away from sustainable
growth. The major cost to the food chain in terms of externalities are the social costs
of transport, i.e. the congestion, noise and infrastructure related to food transportation.
However, HGV and LGV use has declined over this period. The main negative
impact is with the use of cars, which has increased substantially from 1998 onward.
Predominantly, this is due to increased distances travelled to supermarkets for food
shopping (the number of shopping trips has decreased). However, moves have been
made by retailers to improve convenience in terms of internet shopping and smaller
city centre based retail units. In time these might have the effect of reducing
externalities by altering shopping patterns and thus reversing the trends observed here.
References
AEA Technology. 2005, The Validity of Food Miles as an Indicator of Sustainable Development. HMSO, London.
Byerlee, D. and Murgai, R. 2001, Sense and Sensibility Revisited. Agricultural Economics 26, 227-236.
DfT, 2003, Valuation of the Benefits of Prevention of Road Accidents and Casualties. Highways Economics Note No. 1: 2003, HMSO, London.
Diewert, W.E. 1976, Exact and Superlative Index Numbers. Journal of Econometrics 4, 115:116.
Food Standards Agency. (2004). Full regulatory impact assessment proposals to consolidate EU food hygiene legislation. HMSO, London .
Lynam, J.K., Herdt, R.W., 1989. Sense and sustainability: sustainability as an objective in international agricultural research. Agricultural Economics 3, 381–398.
Office of National Statistics. (Various Years). Estimates of Capital Stock. HMSO, London.
Office of National Statistics, 2004, Environmental Accounts: Autumn 2004. HMSO, London.
Office of National Statistics, Various Years, Annual Business Inquiry. HMSO, London.
Office of National Statistics, 2004, Transport Statistics Bulletin. Transport of Goods by Road in Great Britain: 2003. ONS, London.
Organisation for Economic Co-operation and Development, 2001a, Measuring Productivity: Measurement of Aggregate and Industry-Level Productivity Growth. Organisation for Economic Co-Operation and Development, Paris.
Oulton, N., 2004, Investment Specific Technological Change and Growth Accounting. Working Paper No. 213. HM Treasury, HMSO, London.
15
Table 1: Externalities by Sector: Post farm-gate Food Chain (incl. Sources)
Air Water Land SocialManufacturing(production,
packing, storage, water
use)
Energy Use (resource, CO2,
NO2, SO2) -
Abstraction and discharge (resource use, biodiversity, contamination,
transformation) -
Waste - Odour (operation) -
Process emissions (GHG, Heavy
metals, Particulates) -
Run-off (contamination,
flooding) -
Land take (soil, biodiversity) -
Noise (operation) -
Landscape Effects - Landscape Effects -Mortality and
accidents -Food-borne illness -Landscape Effects -
Nutritional Standards
Wholesaling (transportation
storage)
Energy Use (resource, CO2,
NO2, SO2) -
Mains abstraction and discharge (resource
use) -
Waste - Congestion and infrastructure -
Transport (GHG, heavy metals, particulates) -
Run-off (contamination,
flooding) -
Land take (soil, biodiversity) -
Odour (operation and transport) -
Landscape Effects - Landscape Effects -Noise (operation and
transport) -Mortality and
accidents -
Retailing(transportation
storage packaging)
Energy Use (resource, CO2,
NO2, SO2) -
Mains abstraction and discharge (resource
use) -
Waste - Macroeconomic (trading position)
Transport (GHG, heavy metals, particulates) -
Run-off (contamination,
flooding) -
Land take (soil, biodiversity) -
Food Miles -
Congestion and infrastructure -
Landscape Effects - Landscape Effects -Consumer Choice (increased choice,
food deserts) Nutritional Standards
Mortality and
accidents -Food-borne illness -
Catering(storage
preparation)
Energy Use (resource, CO2,
NO2, SO2) -
Mains abstraction and discharge (resource
use) -
Waste - Mortality and accidents -
Transport (GHG, heavy metals, particulates) -
Food-borne illness -
- negative externality; + positive externality
16
Table 2. Composition of the Food Chain by Standard Industrial ClassificationSector I-O INDUSTRY GROUP STANDARD
INDUSTRIAL CLASSIFICATION
Manufacturing Manufacture of Food Products and beverages 15
Wholesaling Wholesale of food, beverages and tobacco 51.3
Retailing Retail sale of food, beverages and tobacco in specialised stores
52.2
MINUS Retail Sale of tobacco products 52.26PLUS Retail sale in non-specialised stores with food, beverages or tobacco predominating
52.11
MINUS Other retail sale in non-specialised stores 52.12
NRC Restaurants 55.3Bars 55.4Canteens and catering 55.5
17
Table 3. Data Sources Used
Price /Quantity
Description Source
Output
Turnover £ /£ (2000)
Sales of ProductsDeflated to 2000 prices
ABIONS
InputsLabour £ /
Annual Hours Worked
Labour CostsAnnual Hours Worked adjusted by industry estimates for fulltime and part-time hours
ABI/ASHE
Capital £ /Perpetual Inventory Method
Capital ExpenditureA 20 year ‘sudden death’ depreciation rate begun in 1995 and continued from an estimate of capital stock from the ONS 1994
ABI/ONS CS
Intermediate Purchases
£ /£(2000)
Intermediate PurchasesDeflated to 2000 prices
ABIONS
18
Figure 1: TFP, input and output indexes for the food chain, 1998-2002
92
94
96
98
100
102
104
106
108
110
1998 1999 2000 2001 2002
Inputs
Output
TFP
19
Figure 2: Labour, Capital and Intermediate Indexes
92
94
96
98
100
102
104
106
1998 1999 2000 2001 2002
Tov/Lab
Tov/Cap
Tov/Int
20
Figure 3. Fisher Indexes of Externalities within the Food Chain
0.6
0.7
0.8
0.9
1.0
1.1
1.2
1998 1999 2000 2001 2002
Energy EmissionsTransport EmissionsTransport (Social Costs)Transport AccidentsFood Borne Illness and Industrial Injuries
21
Figure 4. Fisher Indexes of Externalities and Total Factor Productivity Index, 1998 = 100
95
96
97
98
99
100
101
102
1998 1999 2000 2001 2002
TFP Externalities