Embed Size (px)
Citation preview
SustainableEnergy & FuelsInterdisciplinary research for the development of sustainable energy technologies
rsc.li/sustainable-energy
ISSN 2398-4902
Volume 4Number 11November 2020Pages 5363–5870
PAPERIdoia Hita et al.Dynamics of carbon formation during the catalytic hydrodeoxygenation of raw bio-oil
SustainableEnergy & Fuels
PAPER
Ope
n A
cces
s A
rtic
le. P
ublis
hed
on 2
7 M
ay 2
020.
Dow
nloa
ded
on 2
021-
12-1
4 10
:17:
29 A
M.
Thi
s ar
ticle
is li
cens
ed u
nder
a C
reat
ive
Com
mon
s A
ttrib
utio
n 3.
0 U
npor
ted
Lic
ence
.
View Article OnlineView Journal | View Issue
Dynamics of carb
aKing Abdullah University of Science and Te
Multiscale Reactor Engineering, Thuwal 23
[email protected] of Chemical Engineering, Univ
PO Box 644-48080, Bilbao, SpaincCNR-ITAE, Istituto di Tecnologie Avanzate
Lucia sopra Contesse, 5-98126 Messina, Ita
† Electronic supplementary informationwater content in aqueous products, evoluyield, evolution with TOS of thphysico-chemical properties of used catalcoked catalysts. See DOI: 10.1039/d0se005
Cite this: Sustainable Energy Fuels,2020, 4, 5503
Received 27th March 2020Accepted 18th May 2020
DOI: 10.1039/d0se00501k
rsc.li/sustainable-energy
This journal is © The Royal Society o
on formation during the catalytichydrodeoxygenation of raw bio-oil†
Idoia Hita, *ab Tomas Cordero-Lanzac,b Giuseppe Bonura, c Francesco Frusteri,c
Javier Bilbaob and Pedro Castano ab
The formation, growth and transformation of the carbon residue (coke) deposited on the catalyst during the
raw bio-oil hydrodeoxygenation have been studied. These deposits have a great impact on the overall
process performance, and they have been formed in accelerated deactivation conditions (450 �C, 65 bar,
space time of 0.09 gcat h gbio-oil�1) using a continuous fixed bed reactor and a FeMoP/HZSM-5 catalyst.
Coke deposition causes partial deactivation of the catalyst, which reaches a pseudosteady state of
constant activity and also contant yields of interesting chemicals. The evolution of the coke in the
transient state has been studied through temperature-programmed oxidation, Raman spectroscopy and
elemental analysis. We have identified three different types of coke, whose composition evolves with
time on stream towards condensed and stable structures. The assessment of the evolution of the
reaction medium composition and the application of the principal component analysis (PCA)
methodology have evidenced that the dynamics of coke have three stages: (1) it is controlled by the
thermally-induced deposition of thermal lignin; (2) followed by the interconversion into intermediate
coke through aging reactions; and (3) it ends up in a pseudosteady state dominated by the formation of
catalytic coke species originating from both deoxygenated and carbonized intermediate coke as well as
the condensation of aromatics in the reaction medium.
Introduction
Biomass-derived pyrolysis oil, commonly referred to as bio-oil,is steadily becoming a valid alternative for the production ofrenewable fuels and platform chemicals, aiding in the transi-tion from a fossil oil-based economy to a more sustainable andcircular one.1,2 Bio-oil is composed of a signicant amount ofwater (15–30 wt%) and a plethora of oxygenated organiccomponents (50–65 wt%), among which one can nd acids,aldehydes, ketones, furans, phenolics, guaiacols, syringols andsugars.3,4 The very reactive nature of some of these renders bio-oil unstable upon storage, highly viscous and corrosive, show-casing the necessity of bio-oil pre-treatment for adjusting itscomposition for any further downstream transformation.5,6
chnology, KAUST Catalysis Center (KCC),
955-6900, Saudi Arabia. E-mail: idoia.
ersity of the Basque Country (UPV/EHU),
per l'Energia “Nicola Giordano”, Via S.
ly
(ESI) available: Bio-oil composition,tion with TOS of total carbon producte oxygenated lump composition,ysts, TG-TPO deconvolution proles of01k
f Chemistry 2020
Among the different alternatives for bio-oil stabilization andupgrading, hydroprocessing is conceived as the most efficientroute, providing highly stable products with a high H/C ratio.7,8
To date, traditional transition metal-based (Ni, Co, Mo, W)hydrotreatment catalysts have proven their efficiency in hydro-desulfurization (HDS) and hydrodenitrogenation (HDN) reac-tions of complex and heavy feedstock.9–11 On the other hand,noble metal-based hydrocracking (HC) catalysts have also beenaddressed when enhanced catalytic and cracking activity isrequired.12–15 Nonetheless, hydrodeoxygenation (HDO) becomesthe imperative hydroprocessing goal when dealing with heavilyoxygenated feedstock like bio-oil and, in this context, metalphosphides present interesting possibilities.16,17 The higherHDO activity of phosphided catalysts is related to the presenceof P–OH groups which act as Brønsted sites, providing activehydrogen.18 Unsupported FeMoP catalysts were reported byRensel et al.19,20 as highly selective materials towards aromaticcompounds, also with a high catalyst stability and recyclability.In a complementary study, they correlated the Lewis acidity ofFexMo2�xP catalyst with the lower activation energy required forthe C–O bond cleavage in phenol HDO.21 A high selectivitytowards benzene (up to 90%) from the HDO of phenol was alsoshowcased by Jain et al.22 with a FeMoP catalyst, in contrast toNiMoP and RuMoP catalysts at the same conditions.
Zeolites are particularly interesting as HDO catalystsupports, providing high hydrothermal stability in a reaction
Sustainable Energy Fuels, 2020, 4, 5503–5512 | 5503
Sustainable Energy & Fuels Paper
Ope
n A
cces
s A
rtic
le. P
ublis
hed
on 2
7 M
ay 2
020.
Dow
nloa
ded
on 2
021-
12-1
4 10
:17:
29 A
M.
Thi
s ar
ticle
is li
cens
ed u
nder
a C
reat
ive
Com
mon
s A
ttrib
utio
n 3.
0 U
npor
ted
Lic
ence
.View Article Online
medium with a high water content and also tunable properties,which is of crucial relevance for directing catalyst selectivitytowards preferred products and limiting the deactivation due tothe formation of solid carbonaceous deposits.23,24 In a previouswork dealing with raw bio-oil HDO, we demonstrated thata HZSM-5 zeolite support was preferred over HY and Hb zeolitesfor FeMoP catalysts due to a balance between (i) a moderatecatalyst acidity, (ii) a suitable proportion of weak and moder-ately acidic sites and (iii) a pore structure (MFI framework) thatallows the sweeping of coke precursors towards the reactionmedium, partially preventing catalyst deactivation.16
Any scalable approach in bio-oil HDO should consider themassive production of carbon residues (coke) and the resultingcatalyst deactivation.25,26 This step is primarily a consequence offast repolymerization of the unstable and highly reactiveoxygenates in bio-oil,27,28 and can lead to reactor and pipelineclogging, directly affecting process stability and feasibility.29
Hence, understanding catalyst deactivation mechanisms, witha special focus on the initial hours of reaction, is of paramountimportance regarding the viability of raw bio-oil HDO. However,this task remains highly challenging, considering thecomplexity of the reaction medium and the great amount ofreaction synergies taking place.30 In previous works on the HDOof raw bio-oil,16,31 we determined that the process goes throughan initial period of fast coke deposition at low times on stream(1–4 h), which causes a signicant activity decay, and aerwhich a subsequent pseudosteady catalytic activity state wasattained.
To date, the most detailed deactivation mechanism for theHDO of raw bio-oil has been described by Cordero-Lanzacet al.,30 by establishing two parallel deactivation pathwaysdominated by bio-oil oxygenates and aromatic hydrocarbonprecursors, respectively, at the pseudosteady state. They alsoshowcased the crucial relevance of achieving a stable pseudos-teady activity state in order to successfully implement a contin-uous raw bio-oil HDO process. On top of that, these preliminaryresults indicate that the dynamics of coke strongly inuence theoverall catalytic performance and reaction network. The cokeformed on the catalyst is not an inert. Much on the contrary, it isconstituted by a set of species with complex composition thatdynamically evolve over time and affect the reaction pathwaysand the surface of the catalyst.
This manuscript targets to analyze the evolution with timeon stream (TOS) of the nature of the coke deposited overa FeMoP/HZSM-5 catalyst during the HDO of a raw bio-oil. TheHDO runs have been conducted in a continuous xed bedreactor at 450 �C, 65 bar and a space time of 0.09 gcat h gbio-oil
�1.Then, we have correlated the evolution of the reaction mediumcomposition with that of coke, in order to nd the link betweenthe reaction and deactivation pathways. The properties of theformed coke have been analyzed by thermogravimetrictemperature-programmed oxidation (TG-TPO), elemental anal-ysis and Raman spectroscopy. The reaction medium has beenanalyzed by individual analysis of the liquid (aqueous andorganic) phases. A statistical correlation between the composi-tions of all the phases has been performed trough multivariatedata analysis using principal component analysis (PCA). Finally,
5504 | Sustainable Energy Fuels, 2020, 4, 5503–5512
we have proposed a simplied reaction mechanism whichexplains the dynamics of the reactions involved in the trans-formation of coke over TOS.
ExperimentalCatalyst synthesis and characterization
For the preparation of the FeMoP/HZSM-5 catalyst, FeNO3-$9H2O (Sigma Aldrich, 99%), (NH4)6Mo7O24$4H2O (Panreac,99%) and (NH4)2HPO4 (Baker Chemicals B.V., 98%) were addedsequentially in a stirred round bottom ask to an aqueous citricacid solution (0.4 M), in order to obtain a Fe : Mo : P molar ratioof 1 : 1 : 1. The citric acid was present in a concentration such asto ensure a molar ratio of 2 : 1 with respect to all metals. Acommercial ZSM-5 zeolite (Alfa Aesar; SiO2 : Al2O3, 30 : 1) wasused in its ammonium form. Aer the metal precursors weredissolved in citric acid, the zeolite sample was impregnated byincipient wetness (20 wt%), then dried overnight in an oven at200 �C and calcined in a muffle at 700 �C for 5 h. Comple-mentary XRD measurements conducted in a Philips X-Pertdiffractometer, operating at 40 kV, 30 mA and a scan step of0.05 s�1, with a Ni b-ltered Cu Ka radiation (l¼1.5406 A),showed that no signicant modication/destruction of theHZSM-5 zeolite framework occurred upon calcination at thistemperature (Fig. S1†). In addition, this high-temperaturecalcination also favors the formation of Lewis acidic sites,which prevent secondary undesired reactions, typicallyenhanced by stronger Brønsted acidic sites.32 The activation ofthe catalyst was carried out by programmed temperature treat-ment at the following conditions: heating at 100 �C for 1 hunder Ar atmosphere (30 STP cm3min�1), followed by reductionunder a H2 atmosphere (100 STP cm3min�1) up to 650 �C for 1 h(heating rate of 5 �C min�1). Aer reduction, the FeMoP/HZSM-5 catalyst was cooled to room temperature under a H2 atmo-sphere and then passivated using a 1% O2/He mixture (30 STPcm3 min�1) for 1 h.
Inductively coupled plasma mass spectrometry (ICP-MS) wasused to analyze the chemical composition of the sample ina Perkin-Elmer DRC-e apparatus. The textural properties of thefresh and used catalysts were determined through N2 adsorp-tion–desorption at �196 �C in a Micromeritics ASAP 2020apparatus. Prior to analysis samples were degassed at 150 �C for8 h. Specic surface area (SBET) was calculated using the Bru-nauer–Emmett–Teller equation while the micropore volume(Vmicropore) was calculated using the t-plot method. The meso-pore volume (Vmesopore) was estimated by difference between thetotal pore volume (at relative pressure of 0.995, Vpore) and theVmicropore. The total acidity of the fresh and used catalysts wasmeasured through temperature programmed desorption (TPD)of tert-butylamine (tBA) at 100 �C in a Setaram DSC-111 calo-rimeter. The sample was rstly pretreated at 550 �C undera continuous ow of He in order to remove impurities. Aersaturation of the sample with tBA, a temperature programmeddesorption (TPD) was launched at a 5 �C min�1 rate up to500 �C, while simultaneously the tBA cracking products wereregistered in a Balzers Quadstar 422 mass spectrometer (MS),with butene being the main cracking product (m/z ¼ 56). The
This journal is © The Royal Society of Chemistry 2020
Table 2 Composition of the raw bio-oil34
Paper Sustainable Energy & Fuels
Ope
n A
cces
s A
rtic
le. P
ublis
hed
on 2
7 M
ay 2
020.
Dow
nloa
ded
on 2
021-
12-1
4 10
:17:
29 A
M.
Thi
s ar
ticle
is li
cens
ed u
nder
a C
reat
ive
Com
mon
s A
ttrib
utio
n 3.
0 U
npor
ted
Lic
ence
.View Article Online
main physico-chemical properties of the fresh FeMoP/HZSM-5catalyst are summarized in Table 1.
Elemental composition (wt%)
C 52.2H 7.1O 40.7Water content (wt%) 49.0
Chemical composition (wt%)
Acids and esters 9.5Acetic acid 23.5Aldehydes 4.8Ketones 8.71-Hydroxy-2-propanone 7.0Phenols 13.0Alcohols 6.5Ethers 2.0Levoglucosan 24.0Non-identied 1.0
Bio-oil feedstock, HDO runs and product analysis
The raw bio-oil was obtained in a pilot plant (25 kg h�1) fromthe fast pyrolysis of black poplar sawdust,33 and used as receivedwith no further treatment. The raw bio-oil stock was stored ina refrigerated environment (6 �C). Its elemental and chemicalcomposition (both on a dry bio-oil basis) are provided inTable 2. Besides a water content of 49.0 wt%, bio-oil presentsa noteworthy concentration of levoglucosan (24.0 wt%) andacetic acid (23.5 wt%) in its composition, together witha signicant amount of phenolic compounds (13.0 wt%). EAanalysis revealed an oxygen content of 40.7 wt% in bio-oil.
The raw bio-oil HDO runs were carried out in a continuousdown-ow stainless steel xed bed reactor by PID Eng & Tech(catalyst bed height: 10 cm; i.d.: 1 cm), and schematized indetail elsewhere,9 at 450 �C, 65 bar, 0.09 gcat h gbio-oil
�1; 0.05cm3 min�1 bio-oil; 90 STP cm3 min�1 H2; and varying times onstream up to 8 h. The catalyst mixed with SiC was loaded in thereactor following the specications of Van Herk et al.35
including SiC layers 20 mm thick above and below the catalystbed, in order to minimize heat losses and gas bypassing. Priorto every reaction, the catalyst was pre-treated at 400 �C for 12 hunder a continuous gas owmix of 30 STP cm3min�1 H2 and 50STP cm3 min�1 N2. Aer exiting the reactor, liquid productswere sent to a Peltier cell (gas/liquid separator), then sampledand weighed every hour for mass balance calculation purposes.Liquid products consisted of an aqueous and an organic phasethat were separated by decantation and analyzed individually.The composition of the organic product phase was assessedthrough two-dimensional Gas Chromatography (GCxGC)coupled with Mass Spectrometry (MS) in an Agilent 7890Aapparatus connected on-line with an Agilent 5975C series MS.The GCxGC was provided with two columns of different polar-ities connected through a ow modulator, being the rstcolumn a non-polar DB-5MS (length ¼ 30 m; internal diameter¼ 0.25 mm), while the second one was a polar TRB-50 HT(length ¼ 5 m; internal diameter ¼ 0.25 mm). On the otherhand, the aqueous phase was analyzed by means of gaschromatography-mass spectrometry in a Shimadzu GC-MSQP2010 unit provided with a BPX5 column (length ¼ 50 m;internal diameter ¼ 0.22 mm). The water content in the
Table 1 Main chemical and structural properties of the fresh FeMoP/HZSM-5 catalyst
Property Value
Fe (wt%) 5.4Mo (wt%) 7.7P (wt%) 4.7SBET (m2 g�1) 312Vpore (cm
3 g�1) 0.218Vmicropore (cm
3 g�1) 0.113Vmesopore (cm
3 g�1) 0.105Total acidity (mmoltBA g�1) 0.47
This journal is © The Royal Society of Chemistry 2020
aqueous product phase was quantied by Karl-Fischer titrationusing a Metrohm830 KF Titrino plus apparatus.
The yields of liquid carbon product (C-prod) and water aredened by eqn (1) on a total bio-oil basis (including water):
Yi;wet basis ¼ Fi
Fbio-oil
100 (1)
where Fi and Fbio-oil are the hourly mass ows of each productfraction and bio-oil, respectively. The yield of gas + coke wascalculated by difference.
Liquid carbon products were classied in lumps of differentchemical nature, as follows: oxygenates (comprising: methanol,MeOH; acetone, AC and; acetic acid, AA); alkanes, AL; ketones,KT; phenol, PH; alkylphenolics, APH; 1 ring aromatics (A1); 2+ring aromatics (A2+) and; other oxygenates (acids and esters),OT. Their yields on a dry basis are dened by eqn (2) as:
Yj;dry basis ¼ Fj
Foxygenates
100 (2)
where Fj and Foxygenates refer to the hourly mass ows of eachhydrocarbon lump and the oxygenates in bio-oil (excludingwater), respectively.
Coke characterization
The deactivated catalyst samples were analyzed for coke quan-tication through temperature-programmed oxidation (TPO) ina TA Instruments TGA Q5000 IR thermobalance (TG-TPO),without any previous coke separation. Prior to analysis,samples were subjected to a stripping pre-treatment under a N2
atmosphere (100 cm3 min�1) at 450 �C in order to removeorganic adsorbed species. TPO analyses were conducted undera continuous air ow (100 cm3 min�1) applying a ramp up to700 �C at a 5 �C min�1 rate, which ensures total combustion ofthe formed coke. The TG-TPO results allow for the quantica-tion of the different coke fractions.
Sustainable Energy Fuels, 2020, 4, 5503–5512 | 5505

Sustainable Energy & Fuels Paper
Ope
n A
cces
s A
rtic
le. P
ublis
hed
on 2
7 M
ay 2
020.
Dow
nloa
ded
on 2
021-
12-1
4 10
:17:
29 A
M.
Thi
s ar
ticle
is li
cens
ed u
nder
a C
reat
ive
Com
mon
s A
ttrib
utio
n 3.
0 U
npor
ted
Lic
ence
.View Article Online
Elemental analysis of the used catalyst samples was per-formed in a EuroVector EA3000 Elemental Analyzer. The oxygencontent was determined by difference from the wt% contents ofC, H and N.
Raman spectroscopy analyses were carried out in a RenishawInVia confocal microscope, consisting of a spectrometer andtwo lasers coupled to a Leica optical microscope. An excitationwavelength of 514 nm was used, and the uorescence caused bythe material was subtracted.
Multivariate data analysis
A principal component analysis (PCA) routine developed inMatlab was applied for the multivariate analysis of the reactiondata. A dataset of 15 variables from 21 uncorrelated runs wascongurated and processed as previously detailed by Alviraet al.36 The Varimax rotation was applied in order to facilitateinterpretation of the results. The assessed variables comprisereaction parameters (time on stream, TOS; space time, W/F),coke composition (contents of the fractions of thermal lignin,TL; intermediate coke, IC; and catalytic coke, CC), and reactionmedium composition (on the basis of the lumps previouslydened: MeOH, AC, AA, AL, KT, PH, APH, A1, A2, and OT).
Fig. 1 Evolution with TOS of (a) product yields on a wet bio-oil basisand (b) the concentration of the different lumps in liquid carbonproducts.
Results and discussionEvolution of product yields and composition over TOS
The evolution with time on stream (TOS) of the yields of themain product fractions in a wet bio-oil basis (gas + coke, water,and carbon products in the organic (Cprod-org) and aqueous(Cprod-aq) phases) as dened by eqn (1) are displayed in Fig. 1a.At TOS > 2 h the main component at the reactor exit is water(>51.8 wt%), which originates from raw bio-oil itself and is alsoformed as end product of HDO mechanisms. The yield of totalcarbon products (Cprod-org + Cprod-aq) presents an increasingtrend over time, with a parallel decrease in the gas + coke lump.Interestingly, while carbon products originate solely from anaqueous carbon product phase at TOS ¼ 1–2 h (Cprod-aq ¼ 2.3–9.8 wt%), an incipient formation of an organic product phase(Cprod-org) is detected at TOS > 3 h. A higher increase in the totalcarbon product yield is then attained up to TOS ¼ 5 h, aerwhich constant values of 27.3 wt%, 54.3 wt% water and18.4 wt% gas + coke are obtained (average values at TOS ¼ 5–8h). The evolution over time on stream of the water content in theaqueous phase, displayed in Fig. S2,† shows a similar behavior.From an initial water content of 92.5 wt% at TOS¼ 1 h, a drop ofabout 9 wt% is measured once a constant water content of84.2 wt% is achieved. These results suggest that HDO reactionsdeactivate more preferentially over time, being particularlyaffected during the initial 4 h on stream, where the waterconcentration in the aqueous phase steadily decreases.Accordingly, the formation of the organic carbon product lumpis also promoted in a greater extent (Fig. 1a).16,31 In this case, thehigh water concentration of this raw bio-oil (49 wt%) is favoringthe stability not only of the catalyst but of the overall process. Itis known that, in the catalytic conversion of raw bio-oils,37
a higher water concentration in the reaction medium is
5506 | Sustainable Energy Fuels, 2020, 4, 5503–5512
benecial and performs a coke precursor stripping effect, hencemaintaining a higher remaining catalyst activity over time onstream, which ultimately will aid to the overall process stability.
These results are indicative of two different reaction stagestaking place during bio-oil HDO: (i) an initial transient stage atTOS ¼ 1–5 h where an important loss in catalyst activity due tocoke deposition occurs, and (ii) a pseudosteady activity stage,where product yields are constant and carbon products aremaximized.16,31 In agreement with other studies on the conver-sion of raw bio-oil with different catalysts, a fast catalyst deac-tivation primarily occurs during the transient state because ofthe condensation of the highly reactive alkyl(methoxy)phenols,forming the so-called thermal lignin (TL). This solid productfrom the thermal repolymerization of bio-oil oxygenates canlater on evolve towards a heavier and more condensed coke.30,38
Fig. 1b establishes the focus on the concentration of thedifferent lumps in C-products, which account for a total53.5 wt% in a dry bio-oil basis at the pseudosteady state (seeFig. S3†). During the initial 2 h on stream, the lump ofoxygenates is predominant (70.6–76.6 wt%), whereas a signi-cant concentration of aromatics, ketones, phenol and phenolicsis detected at TOS > 3 h. Eventually, values of 25.7 wt% totalaromatics, 13.3 wt% ketones, 11.8 wt% phenol and 12.6 wt%phenolics are attained at the pseudosteady activity state. Theappearance over time on stream of signicant amounts of
This journal is © The Royal Society of Chemistry 2020
Paper Sustainable Energy & Fuels
Ope
n A
cces
s A
rtic
le. P
ublis
hed
on 2
7 M
ay 2
020.
Dow
nloa
ded
on 2
021-
12-1
4 10
:17:
29 A
M.
Thi
s ar
ticle
is li
cens
ed u
nder
a C
reat
ive
Com
mon
s A
ttrib
utio
n 3.
0 U
npor
ted
Lic
ence
.View Article Online
unsaturated and oxygenated compounds reconrms the cata-lyst activity drop, mainly during the initial hours of reaction.
The concentration of the three compounds comprised in theoxygenated lump in Fig. S4† (methanol, acetic acid andacetone), with a majority of acetic acid through the wholereaction time (73–83 wt%) indicates that the HDO activity of theFeMoP/HZSM-5 catalyst is lower than that achieved with a noblemetal-based catalyst at the same experimental conditions.31
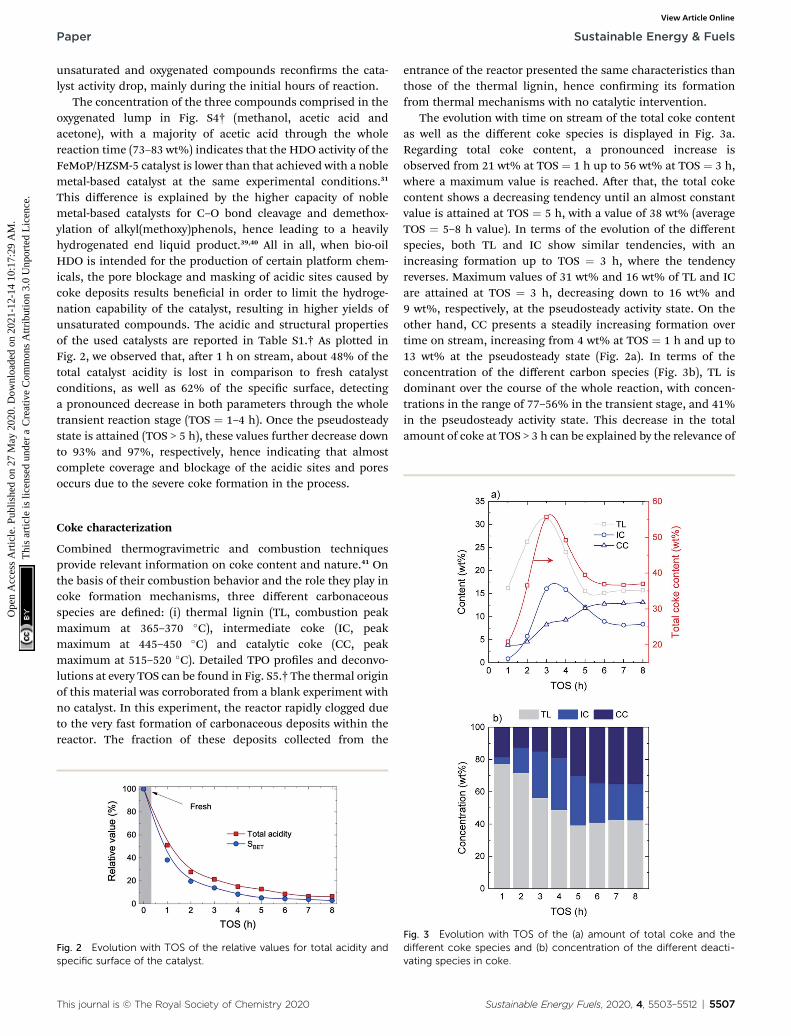
This difference is explained by the higher capacity of noblemetal-based catalysts for C–O bond cleavage and demethox-ylation of alkyl(methoxy)phenols, hence leading to a heavilyhydrogenated end liquid product.39,40 All in all, when bio-oilHDO is intended for the production of certain platform chem-icals, the pore blockage and masking of acidic sites caused bycoke deposits results benecial in order to limit the hydroge-nation capability of the catalyst, resulting in higher yields ofunsaturated compounds. The acidic and structural propertiesof the used catalysts are reported in Table S1.† As plotted inFig. 2, we observed that, aer 1 h on stream, about 48% of thetotal catalyst acidity is lost in comparison to fresh catalystconditions, as well as 62% of the specic surface, detectinga pronounced decrease in both parameters through the wholetransient reaction stage (TOS ¼ 1–4 h). Once the pseudosteadystate is attained (TOS > 5 h), these values further decrease downto 93% and 97%, respectively, hence indicating that almostcomplete coverage and blockage of the acidic sites and poresoccurs due to the severe coke formation in the process.
Coke characterization
Combined thermogravimetric and combustion techniquesprovide relevant information on coke content and nature.41 Onthe basis of their combustion behavior and the role they play incoke formation mechanisms, three different carbonaceousspecies are dened: (i) thermal lignin (TL, combustion peakmaximum at 365–370 �C), intermediate coke (IC, peakmaximum at 445–450 �C) and catalytic coke (CC, peakmaximum at 515–520 �C). Detailed TPO proles and deconvo-lutions at every TOS can be found in Fig. S5.† The thermal originof this material was corroborated from a blank experiment withno catalyst. In this experiment, the reactor rapidly clogged dueto the very fast formation of carbonaceous deposits within thereactor. The fraction of these deposits collected from the
Fig. 2 Evolution with TOS of the relative values for total acidity andspecific surface of the catalyst.
This journal is © The Royal Society of Chemistry 2020
entrance of the reactor presented the same characteristics thanthose of the thermal lignin, hence conrming its formationfrom thermal mechanisms with no catalytic intervention.
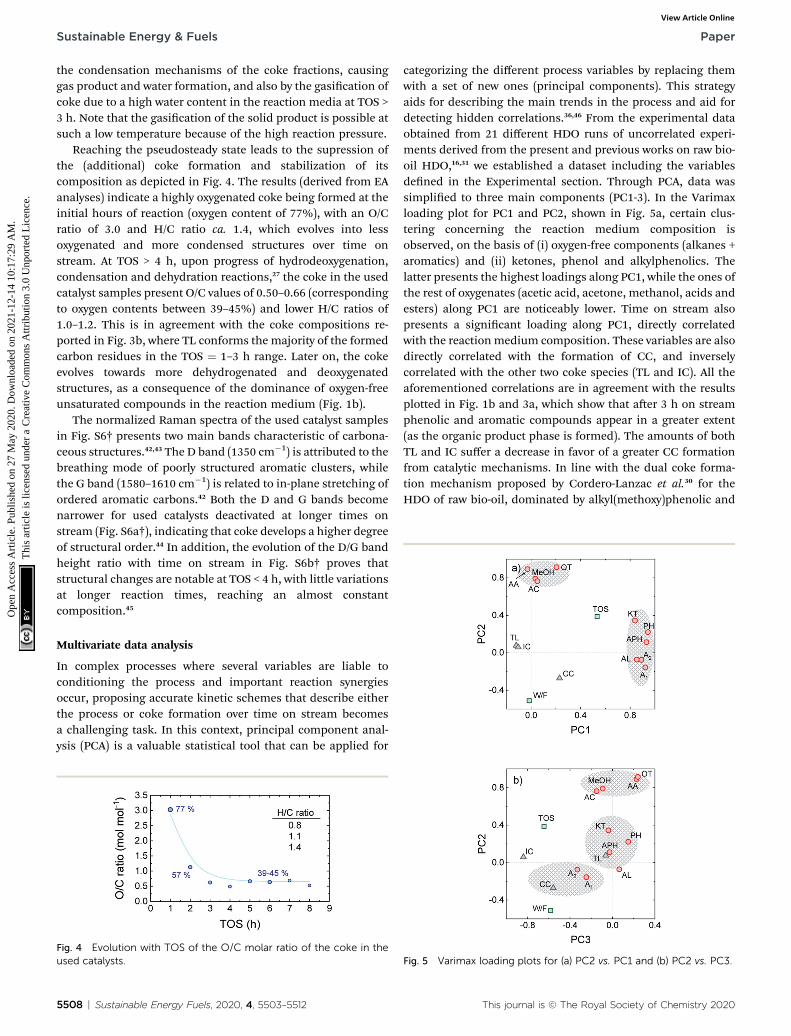
The evolution with time on stream of the total coke contentas well as the different coke species is displayed in Fig. 3a.Regarding total coke content, a pronounced increase isobserved from 21 wt% at TOS ¼ 1 h up to 56 wt% at TOS ¼ 3 h,where a maximum value is reached. Aer that, the total cokecontent shows a decreasing tendency until an almost constantvalue is attained at TOS ¼ 5 h, with a value of 38 wt% (averageTOS ¼ 5–8 h value). In terms of the evolution of the differentspecies, both TL and IC show similar tendencies, with anincreasing formation up to TOS ¼ 3 h, where the tendencyreverses. Maximum values of 31 wt% and 16 wt% of TL and ICare attained at TOS ¼ 3 h, decreasing down to 16 wt% and9 wt%, respectively, at the pseudosteady activity state. On theother hand, CC presents a steadily increasing formation overtime on stream, increasing from 4 wt% at TOS ¼ 1 h and up to13 wt% at the pseudosteady state (Fig. 2a). In terms of theconcentration of the different carbon species (Fig. 3b), TL isdominant over the course of the whole reaction, with concen-trations in the range of 77–56% in the transient stage, and 41%in the pseudosteady activity state. This decrease in the totalamount of coke at TOS > 3 h can be explained by the relevance of
Fig. 3 Evolution with TOS of the (a) amount of total coke and thedifferent coke species and (b) concentration of the different deacti-vating species in coke.
Sustainable Energy Fuels, 2020, 4, 5503–5512 | 5507
Sustainable Energy & Fuels Paper
Ope
n A
cces
s A
rtic
le. P
ublis
hed
on 2
7 M
ay 2
020.
Dow
nloa
ded
on 2
021-
12-1
4 10
:17:
29 A
M.
Thi
s ar
ticle
is li
cens
ed u
nder
a C
reat
ive
Com
mon
s A
ttrib
utio
n 3.
0 U
npor
ted
Lic
ence
.View Article Online
the condensation mechanisms of the coke fractions, causinggas product and water formation, and also by the gasication ofcoke due to a high water content in the reaction media at TOS >3 h. Note that the gasication of the solid product is possible atsuch a low temperature because of the high reaction pressure.
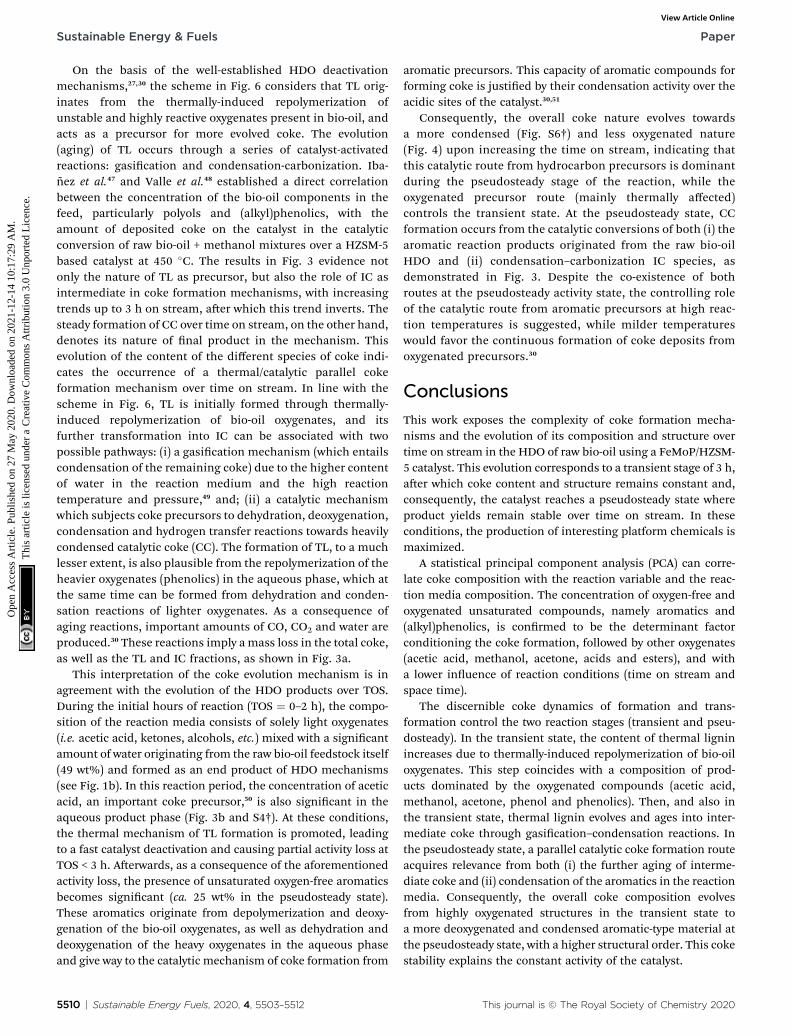
Reaching the pseudosteady state leads to the supression ofthe (additional) coke formation and stabilization of itscomposition as depicted in Fig. 4. The results (derived from EAanalyses) indicate a highly oxygenated coke being formed at theinitial hours of reaction (oxygen content of 77%), with an O/Cratio of 3.0 and H/C ratio ca. 1.4, which evolves into lessoxygenated and more condensed structures over time onstream. At TOS > 4 h, upon progress of hydrodeoxygenation,condensation and dehydration reactions,27 the coke in the usedcatalyst samples present O/C values of 0.50–0.66 (correspondingto oxygen contents between 39–45%) and lower H/C ratios of1.0–1.2. This is in agreement with the coke compositions re-ported in Fig. 3b, where TL conforms the majority of the formedcarbon residues in the TOS ¼ 1–3 h range. Later on, the cokeevolves towards more dehydrogenated and deoxygenatedstructures, as a consequence of the dominance of oxygen-freeunsaturated compounds in the reaction medium (Fig. 1b).
The normalized Raman spectra of the used catalyst samplesin Fig. S6† presents two main bands characteristic of carbona-ceous structures.42,43 The D band (1350 cm�1) is attributed to thebreathing mode of poorly structured aromatic clusters, whilethe G band (1580–1610 cm�1) is related to in-plane stretching ofordered aromatic carbons.42 Both the D and G bands becomenarrower for used catalysts deactivated at longer times onstream (Fig. S6a†), indicating that coke develops a higher degreeof structural order.44 In addition, the evolution of the D/G bandheight ratio with time on stream in Fig. S6b† proves thatstructural changes are notable at TOS < 4 h, with little variationsat longer reaction times, reaching an almost constantcomposition.45
Multivariate data analysis
In complex processes where several variables are liable toconditioning the process and important reaction synergiesoccur, proposing accurate kinetic schemes that describe eitherthe process or coke formation over time on stream becomesa challenging task. In this context, principal component anal-ysis (PCA) is a valuable statistical tool that can be applied for
Fig. 4 Evolution with TOS of the O/C molar ratio of the coke in theused catalysts.
5508 | Sustainable Energy Fuels, 2020, 4, 5503–5512
categorizing the different process variables by replacing themwith a set of new ones (principal components). This strategyaids for describing the main trends in the process and aid fordetecting hidden correlations.36,46 From the experimental dataobtained from 21 different HDO runs of uncorrelated experi-ments derived from the present and previous works on raw bio-oil HDO,16,31 we established a dataset including the variablesdened in the Experimental section. Through PCA, data wassimplied to three main components (PC1-3). In the Varimaxloading plot for PC1 and PC2, shown in Fig. 5a, certain clus-tering concerning the reaction medium composition isobserved, on the basis of (i) oxygen-free components (alkanes +aromatics) and (ii) ketones, phenol and alkylphenolics. Thelatter presents the highest loadings along PC1, while the ones ofthe rest of oxygenates (acetic acid, acetone, methanol, acids andesters) along PC1 are noticeably lower. Time on stream alsopresents a signicant loading along PC1, directly correlatedwith the reactionmedium composition. These variables are alsodirectly correlated with the formation of CC, and inverselycorrelated with the other two coke species (TL and IC). All theaforementioned correlations are in agreement with the resultsplotted in Fig. 1b and 3a, which show that aer 3 h on streamphenolic and aromatic compounds appear in a greater extent(as the organic product phase is formed). The amounts of bothTL and IC suffer a decrease in favor of a greater CC formationfrom catalytic mechanisms. In line with the dual coke forma-tion mechanism proposed by Cordero-Lanzac et al.30 for theHDO of raw bio-oil, dominated by alkyl(methoxy)phenolic and
Fig. 5 Varimax loading plots for (a) PC2 vs. PC1 and (b) PC2 vs. PC3.
This journal is © The Royal Society of Chemistry 2020
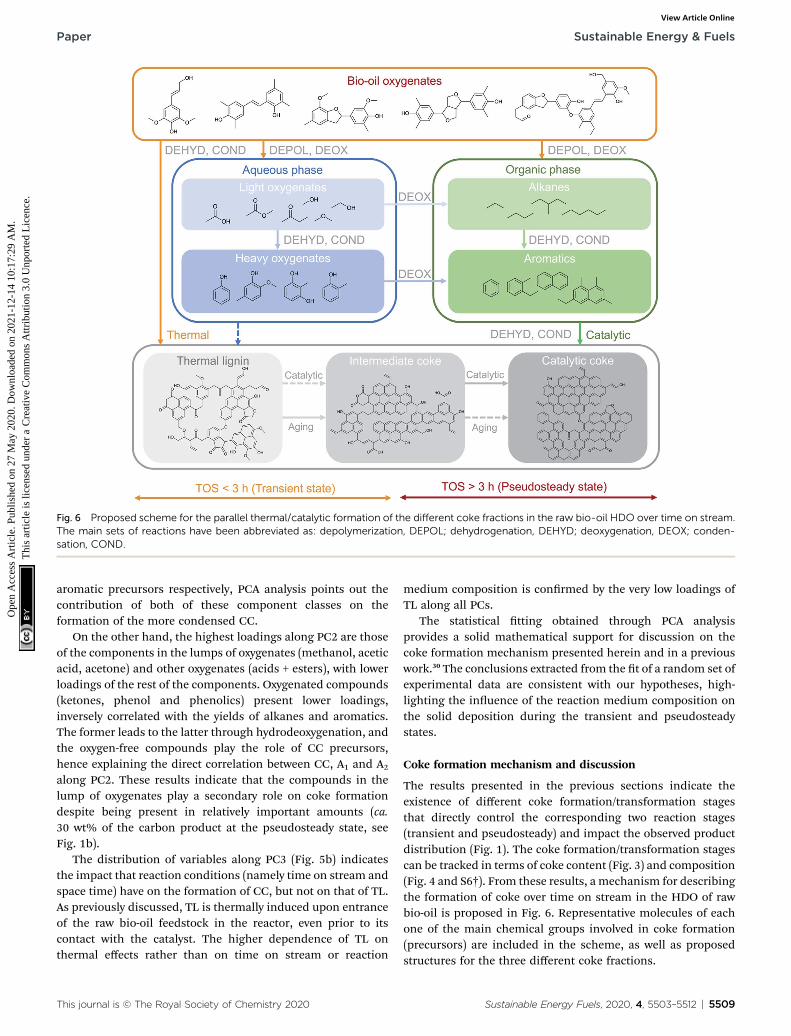
Fig. 6 Proposed scheme for the parallel thermal/catalytic formation of the different coke fractions in the raw bio-oil HDO over time on stream.The main sets of reactions have been abbreviated as: depolymerization, DEPOL; dehydrogenation, DEHYD; deoxygenation, DEOX; conden-sation, COND.
Paper Sustainable Energy & Fuels
Ope
n A
cces
s A
rtic
le. P
ublis
hed
on 2
7 M
ay 2
020.
Dow
nloa
ded
on 2
021-
12-1
4 10
:17:
29 A
M.
Thi
s ar
ticle
is li
cens
ed u
nder
a C
reat
ive
Com
mon
s A
ttrib
utio
n 3.
0 U
npor
ted
Lic
ence
.View Article Online
aromatic precursors respectively, PCA analysis points out thecontribution of both of these component classes on theformation of the more condensed CC.
On the other hand, the highest loadings along PC2 are thoseof the components in the lumps of oxygenates (methanol, aceticacid, acetone) and other oxygenates (acids + esters), with lowerloadings of the rest of the components. Oxygenated compounds(ketones, phenol and phenolics) present lower loadings,inversely correlated with the yields of alkanes and aromatics.The former leads to the latter through hydrodeoxygenation, andthe oxygen-free compounds play the role of CC precursors,hence explaining the direct correlation between CC, A1 and A2
along PC2. These results indicate that the compounds in thelump of oxygenates play a secondary role on coke formationdespite being present in relatively important amounts (ca.30 wt% of the carbon product at the pseudosteady state, seeFig. 1b).
The distribution of variables along PC3 (Fig. 5b) indicatesthe impact that reaction conditions (namely time on stream andspace time) have on the formation of CC, but not on that of TL.As previously discussed, TL is thermally induced upon entranceof the raw bio-oil feedstock in the reactor, even prior to itscontact with the catalyst. The higher dependence of TL onthermal effects rather than on time on stream or reaction
This journal is © The Royal Society of Chemistry 2020
medium composition is conrmed by the very low loadings ofTL along all PCs.
The statistical tting obtained through PCA analysisprovides a solid mathematical support for discussion on thecoke formation mechanism presented herein and in a previouswork.30 The conclusions extracted from the t of a random set ofexperimental data are consistent with our hypotheses, high-lighting the inuence of the reaction medium composition onthe solid deposition during the transient and pseudosteadystates.
Coke formation mechanism and discussion
The results presented in the previous sections indicate theexistence of different coke formation/transformation stagesthat directly control the corresponding two reaction stages(transient and pseudosteady) and impact the observed productdistribution (Fig. 1). The coke formation/transformation stagescan be tracked in terms of coke content (Fig. 3) and composition(Fig. 4 and S6†). From these results, a mechanism for describingthe formation of coke over time on stream in the HDO of rawbio-oil is proposed in Fig. 6. Representative molecules of eachone of the main chemical groups involved in coke formation(precursors) are included in the scheme, as well as proposedstructures for the three different coke fractions.
Sustainable Energy Fuels, 2020, 4, 5503–5512 | 5509
Sustainable Energy & Fuels Paper
Ope
n A
cces
s A
rtic
le. P
ublis
hed
on 2
7 M
ay 2
020.
Dow
nloa
ded
on 2
021-
12-1
4 10
:17:
29 A
M.
Thi
s ar
ticle
is li
cens
ed u
nder
a C
reat
ive
Com
mon
s A
ttrib
utio
n 3.
0 U
npor
ted
Lic
ence
.View Article Online
On the basis of the well-established HDO deactivationmechanisms,27,30 the scheme in Fig. 6 considers that TL orig-inates from the thermally-induced repolymerization ofunstable and highly reactive oxygenates present in bio-oil, andacts as a precursor for more evolved coke. The evolution(aging) of TL occurs through a series of catalyst-activatedreactions: gasication and condensation-carbonization. Iba-nez et al.47 and Valle et al.48 established a direct correlationbetween the concentration of the bio-oil components in thefeed, particularly polyols and (alkyl)phenolics, with theamount of deposited coke on the catalyst in the catalyticconversion of raw bio-oil + methanol mixtures over a HZSM-5based catalyst at 450 �C. The results in Fig. 3 evidence notonly the nature of TL as precursor, but also the role of IC asintermediate in coke formation mechanisms, with increasingtrends up to 3 h on stream, aer which this trend inverts. Thesteady formation of CC over time on stream, on the other hand,denotes its nature of nal product in the mechanism. Thisevolution of the content of the different species of coke indi-cates the occurrence of a thermal/catalytic parallel cokeformation mechanism over time on stream. In line with thescheme in Fig. 6, TL is initially formed through thermally-induced repolymerization of bio-oil oxygenates, and itsfurther transformation into IC can be associated with twopossible pathways: (i) a gasication mechanism (which entailscondensation of the remaining coke) due to the higher contentof water in the reaction medium and the high reactiontemperature and pressure,49 and; (ii) a catalytic mechanismwhich subjects coke precursors to dehydration, deoxygenation,condensation and hydrogen transfer reactions towards heavilycondensed catalytic coke (CC). The formation of TL, to a muchlesser extent, is also plausible from the repolymerization of theheavier oxygenates (phenolics) in the aqueous phase, which atthe same time can be formed from dehydration and conden-sation reactions of lighter oxygenates. As a consequence ofaging reactions, important amounts of CO, CO2 and water areproduced.30 These reactions imply a mass loss in the total coke,as well as the TL and IC fractions, as shown in Fig. 3a.
This interpretation of the coke evolution mechanism is inagreement with the evolution of the HDO products over TOS.During the initial hours of reaction (TOS ¼ 0–2 h), the compo-sition of the reaction media consists of solely light oxygenates(i.e. acetic acid, ketones, alcohols, etc.) mixed with a signicantamount of water originating from the raw bio-oil feedstock itself(49 wt%) and formed as an end product of HDO mechanisms(see Fig. 1b). In this reaction period, the concentration of aceticacid, an important coke precursor,50 is also signicant in theaqueous product phase (Fig. 3b and S4†). At these conditions,the thermal mechanism of TL formation is promoted, leadingto a fast catalyst deactivation and causing partial activity loss atTOS < 3 h. Aerwards, as a consequence of the aforementionedactivity loss, the presence of unsaturated oxygen-free aromaticsbecomes signicant (ca. 25 wt% in the pseudosteady state).These aromatics originate from depolymerization and deoxy-genation of the bio-oil oxygenates, as well as dehydration anddeoxygenation of the heavy oxygenates in the aqueous phaseand give way to the catalytic mechanism of coke formation from
5510 | Sustainable Energy Fuels, 2020, 4, 5503–5512
aromatic precursors. This capacity of aromatic compounds forforming coke is justied by their condensation activity over theacidic sites of the catalyst.30,51
Consequently, the overall coke nature evolves towardsa more condensed (Fig. S6†) and less oxygenated nature(Fig. 4) upon increasing the time on stream, indicating thatthis catalytic route from hydrocarbon precursors is dominantduring the pseudosteady stage of the reaction, while theoxygenated precursor route (mainly thermally affected)controls the transient state. At the pseudosteady state, CCformation occurs from the catalytic conversions of both (i) thearomatic reaction products originated from the raw bio-oilHDO and (ii) condensation–carbonization IC species, asdemonstrated in Fig. 3. Despite the co-existence of bothroutes at the pseudosteady activity state, the controlling roleof the catalytic route from aromatic precursors at high reac-tion temperatures is suggested, while milder temperatureswould favor the continuous formation of coke deposits fromoxygenated precursors.30
Conclusions
This work exposes the complexity of coke formation mecha-nisms and the evolution of its composition and structure overtime on stream in the HDO of raw bio-oil using a FeMoP/HZSM-5 catalyst. This evolution corresponds to a transient stage of 3 h,aer which coke content and structure remains constant and,consequently, the catalyst reaches a pseudosteady state whereproduct yields remain stable over time on stream. In theseconditions, the production of interesting platform chemicals ismaximized.
A statistical principal component analysis (PCA) can corre-late coke composition with the reaction variable and the reac-tion media composition. The concentration of oxygen-free andoxygenated unsaturated compounds, namely aromatics and(alkyl)phenolics, is conrmed to be the determinant factorconditioning the coke formation, followed by other oxygenates(acetic acid, methanol, acetone, acids and esters), and witha lower inuence of reaction conditions (time on stream andspace time).
The discernible coke dynamics of formation and trans-formation control the two reaction stages (transient and pseu-dosteady). In the transient state, the content of thermal ligninincreases due to thermally-induced repolymerization of bio-oiloxygenates. This step coincides with a composition of prod-ucts dominated by the oxygenated compounds (acetic acid,methanol, acetone, phenol and phenolics). Then, and also inthe transient state, thermal lignin evolves and ages into inter-mediate coke through gasication–condensation reactions. Inthe pseudosteady state, a parallel catalytic coke formation routeacquires relevance from both (i) the further aging of interme-diate coke and (ii) condensation of the aromatics in the reactionmedia. Consequently, the overall coke composition evolvesfrom highly oxygenated structures in the transient state toa more deoxygenated and condensed aromatic-type material atthe pseudosteady state, with a higher structural order. This cokestability explains the constant activity of the catalyst.
This journal is © The Royal Society of Chemistry 2020
Paper Sustainable Energy & Fuels
Ope
n A
cces
s A
rtic
le. P
ublis
hed
on 2
7 M
ay 2
020.
Dow
nloa
ded
on 2
021-
12-1
4 10
:17:
29 A
M.
Thi
s ar
ticle
is li
cens
ed u
nder
a C
reat
ive
Com
mon
s A
ttrib
utio
n 3.
0 U
npor
ted
Lic
ence
.View Article Online
Conflicts of interest
There are no conicts to declare.
Acknowledgements
This work has been carried out with the nancial support of theMinistry of Economy and Competitiveness of the SpanishGovernment, some co-founded with ERDF funds (CTQ2015-67425-R, CTQ2016-79646-P), the Basque Government (IT1218-19), and the European Commission (Horizon H2020-MSCARISE-2018, Contract No. 823745). Dr Idoia Hita is grateful forher postdoctoral grant awarded by the Department of Educa-tion, University and Research of the Basque Government(POS_2015_1_0035).
References
1 S. Pang, Biotechnol. Adv., 2019, 37, 589–597.2 Z. Yang, Y. Wu, Z. Zhang, H. Li, X. Li, R. I. Egorov,P. A. Strizhak and X. Gao, Renewable Sustainable EnergyRev., 2019, 103, 384–398.
3 E. Lazzari, T. Schena, M. C. A. Marcelo, C. T. Primaz,A. N. Silva, M. F. Ferrao, T. Bjerk and E. B. Caramao, Ind.Crops Prod., 2018, 111, 856–864.
4 Z. Si, X. Zhang, C. Wang, L. Ma and R. Dong, Catalysts, 2017,7, 169–191.
5 X. Yuan, X. Ding, L. Leng, H. Li, J. Shao, Y. Qian, H. Huang,X. Chen and G. Zeng, Energy, 2018, 154, 110–118.
6 J. Xing, T. Li, Y. Yu, C. Chen and J. Chang, Int. J. Adhes.Adhes., 2018, 87, 91–97.
7 A. N. Kay Lup, F. Abnisa, W. M. A. Wan Daud andM. K. Aroua, J. Ind. Eng. Chem., 2017, 56, 1–34.
8 M. Patel and A. Kumar, Renewable Sustainable Energy Rev.,2016, 58, 1293–1307.
9 I. Hita, A. Gutierrez, M. Olazar, J. Bilbao, J. M. Arandes andP. Castano, Fuel, 2015, 145, 158–169.
10 Y. Villasana, F. J. Mendez, M. Luis-Luis and J. L. Brito, Fuel,2019, 235, 577–588.
11 K. Guo, Y. Ding and Z. Yu, Appl. Catal., B, 2018, 239, 433–440.12 X.-J. Liu, F. Wang, L.-L. Zhai, Y.-P. Xu, L.-F. Xie and
P.-G. Duan, Fuel, 2019, 249, 418–426.13 A. R. Ardiyanti, A. Gutierrez, M. L. Honkela, A. O. I. Krause
and H. J. Heeres, App. Cat. A, 2011, 407, 56–66.14 I. Hita, T. Cordero-Lanzac, A. Gallardo, J. M. Arandes,
J. Rodrıguez-Mirasol, J. Bilbao, T. Cordero and P. Castano,Catal. Commun., 2016, 78, 48–51.
15 T. Cordero-Lanzac, I. Hita, F. J. Garcıa-Mateos, P. Castano,J. Rodrıguez-Mirasol, T. Cordero and J. Bilbao, Chem. Eng.J., 2020, 124679, DOI: 10.1016/j.cej.2020.124679.
16 I. Hita, T. Cordero-Lanzac, G. Bonura, C. Cannilla,J. M. Arandes, F. Frusteri and J. Bilbao, J. Ind. Eng. Chem.,2019, 80, 392–400.
17 R. K. Chowdari, S. Agarwal and H. J. Heeres, ACS SustainableChem. Eng., 2019, 7, 2044–2055.
18 K. Li, R. Wang and J. Chen, Energy and Fuels, 2011, 25, 854–863.
This journal is © The Royal Society of Chemistry 2020
19 D. J. Rensel, J. Kim, Y. Bonita and J. C. Hicks, Appl. Catal., A,2016, 524, 85–93.
20 D. J. Rensel, S. Rouvimov, M. E. Gin and J. C. Hicks, J. Catal.,2013, 305, 256–263.
21 D. J. Rensel, J. Kim, V. Jain, Y. Bonita, N. Rai and J. C. Hicks,Catal. Sci. Technol., 2017, 7, 1857–1867.
22 V. Jain, Y. Bonita, A. Brown, A. Taconi, J. C. Hicks and N. Rai,Catal. Sci. Technol., 2018, 8, 4083–4096.
23 A. Ibarra, I. Hita, M. J. Azkoiti, J. M. Arandes and J. Bilbao, J.Ind. Eng. Chem., 2019, 78, 372–382.
24 H. Shafaghat, P. S. Rezaei and W. M. A. W. Daud, J. Ind. Eng.Chem., 2016, 35, 268–276.
25 X. Lan, E. J. M. Hensen and T. Weber, Appl. Catal., A, 2018,550, 57–66.
26 E. Furimsky and F. E. Massoth, Catal. Today, 1999, 52, 381–495.
27 I. Hita, P. J. Deuss, G. Bonura, F. Frusteri and H. J. Heeres,Fuel Process. Technol., 2018, 179, 143–153.
28 F. G. Calvo-Flores and J. A. Dobado, ChemSusChem, 2010, 3,1227–1235.
29 B. Valle, N. Garcıa-Gomez, A. Arandia, A. Remiro, J. Bilbaoand A. G. Gayubo, Int. J. Hydrogen Energy, 2019, 44, 12593–12603.
30 T. Cordero-Lanzac, R. Palos, I. Hita, J. M. Arandes,J. Rodrıguez-Mirasol, T. Cordero, J. Bilbao and P. Castano,Appl. Catal., B, 2018, 239, 513–524.
31 I. Hita, T. Cordero-Lanzac, F. J. Garcıa-Mateos, M. J. Azkoiti,J. Rodrıguez-Mirasol, T. Cordero and J. Bilbao, Appl. Catal.,B, 2019, 118112, DOI: 10.1016/j.apcatb.2019.118112.
32 N. Kosinov, F. J. A. G. Coumans, G. Li, E. Uslamin, B. Mezari,A. S. G. Wijpkema, E. A. Pidko and E. J. M. Hensen, J. Catal.,2017, 346, 125–133.
33 A. R. Fernandez-Akarregi, J. Makibar, G. Lopez, M. Amutioand M. Olazar, Fuel Process. Technol., 2013, 112, 48–56.
34 T. Cordero-Lanzac, R. Palos, J. M. Arandes, P. Castano,J. Rodrıguez-Mirasol, T. Cordero and J. Bilbao, Appl. Catal.,B, 2017, 203, 389–399.
35 D. van Herk, P. Castano, M. Quaglia, M. T. Kreutzer,M. Makkee and J. A. Moulijn, Appl. Catal., A, 2009, 365,110–121.
36 J. I. Alvira, I. Hita, E. Rodrıguez, J. M. Arandes andP. Castano, Processes, 2018, 6, 243–258.
37 A. Ibarra, I. Hita, J. M. Arandes and J. Bilbao, Energy Fuels,2019, 33, 7458–7465.
38 I. Hita, H. J. Heeres and P. J. Deuss, Bioresour. Technol., 2018,267, 93–101.
39 B. Lin, R. Li, R. Shu, C. Wang, Z. Yuan, Y. Liu and Y. Chen, J.Energy Inst., 2020, 93, 847–856.
40 A. S. Ouedraogo and P. R. Bhoi, J. Cleaner Prod., 2020, 253,119957.
41 A. Ochoa, B. Valle, D. E. Resasco, J. Bilbao, A. G. Gayubo andP. Castano, ChemCatChem, 2018, 10, 2311–2321.
42 A. Ochoa, B. Aramburu, M. Ibanez, B. Valle, J. Bilbao,A. G. Gayubo and P. Castano, ChemSusChem, 2014, 7,2597–2608.
43 A. C. Ferrari and J. Robertson, Phys. Rev. B: Condens. MatterMater. Phys., 2000, 61, 14095–14107.
Sustainable Energy Fuels, 2020, 4, 5503–5512 | 5511
Sustainable Energy & Fuels Paper
Ope
n A
cces
s A
rtic
le. P
ublis
hed
on 2
7 M
ay 2
020.
Dow
nloa
ded
on 2
021-
12-1
4 10
:17:
29 A
M.
Thi
s ar
ticle
is li
cens
ed u
nder
a C
reat
ive
Com
mon
s A
ttrib
utio
n 3.
0 U
npor
ted
Lic
ence
.View Article Online
44 K. Chen, H. Zhang, U.-K. Ibrahim, W. Xue, H. Liu andA. Guo, Fuel, 2019, 246, 60–68.
45 I. Hita, E. Rodrıguez, M. Olazar, J. Bilbao, J. M. Arandes andP. Castano, Energy Fuels, 2015, 29, 5458–5466.
46 T. Rato, M. Reis, E. Schmitt, M. Hubert and B. De Ketelaere,AIChE J., 2016, 62, 1478–1493.
47 M. Ibanez, B. Valle, J. Bilbao, A. G. Gayubo and P. Castano,Catal. Today, 2012, 195, 106–113.
5512 | Sustainable Energy Fuels, 2020, 4, 5503–5512
48 B. Valle, P. Castano, M. Olazar, J. Bilbao and A. G. Gayubo, J.Catal., 2012, 285, 304–314.
49 P. Magnoux, H. S. Cerqueira and M. Guisnet, Appl. Catal., A,2002, 235, 93–99.
50 A. G. Gayubo, A. T. Aguayo, A. Atutxa, R. Aguado, M. Olazarand J. Bilbao, Ind. Eng. Chem. Res., 2004, 43, 2619–2626.
51 A. Ibarra, A. Veloso, J. Bilbao, J. M. Arandes and P. Castano,Appl. Catal., B, 2016, 182, 336–346.
This journal is © The Royal Society of Chemistry 2020