Embed Size (px)
Citation preview

Number 00-6
INFLATION,MONETARY TRANSPARENCY,
AND G3 EXCHANGE RATEVOLATILITY
Kenneth N. Kuttner and Adam S. Posen
- July 2000 -
Prepared for the 22nd SUERF Colloquium, Commission III, April 28, 2000, Vienna, Austria. The views
expressed here, and any errors, are solely the responsibility of the authors, and do not implicate the
Federal Reserve Bank of New York, the Federal Reserve System, or the Institute for International
Economics. Comments and other correspondence to: [email protected] or [email protected].
Copyright ©2000 by the Institute for International Economics. All rights reserved.
No part of this working paper may be reproduced or utilized in any form or by any means, electronic or
mechanical, including photocopying, recording, or by information storage or retrieval system, without
permission from the Institute.

1 This result began to be established with the seminal paper of Meese and Rogoff (1983); later workextending and confirming this result includes Baxter and Stockman (1989), Flood and Rose (1995), andFlood and Rose (1999). Note that this characterization applies to short-term volatility between the G3currencies—evidence exists that medium- to long-term trends in these exchange rates, and even the short-runvolatility of exchange rates for high-inflation countries, do correspond to a significant degree tomacroeconomic fundamentals.
2 “Misalignments” might be characterized as resulting from exchange rate movements not warrantedby changes in the underlying macroeconomic fundamentals. The analysis in this paper does not emphasizethis distinction, however, but focuses on exchange rate volatility broadly defined.
3 Volcker (1998) and Williamson (1998) are two recent well-argued examples.
4 Of course, a policy intervention could also be targeted at the micro-level, in terms of regulatingexchange market behavior, but few of these proposals tend to go in that direction. Moreover, the numberof viable proposals for governments to effectively and beneficially regulate exchange rate trading appearsfor the moment to be limited.
1
INFLATION, MONETARY TRANSPARENCY,
AND G3 EXCHANGE RATE VOLATILITY
Kenneth N. Kuttner and Adam S. Posen
Short-term volatility in G3 bilateral exchange rates has been a fact of life since the beginning of the
post-Bretton Woods float. It has been established, surprisingly, that this volatility is not only
disproportionately large relative to the variation in relative macroeconomic fundamentals of
Germany, Japan, and the United States, but is in fact largely unrelated to them.1 The apparent
disconnect between fundamentals and dollar-yen and dollar-euro exchange rate fluctuations has led
to perennial complaints about persistent exchange rate “misalignments,” and their real effects on the
G3 (and other) economies, giving rise in turn to recurring proposals for government policies to limit
this volatility.2,3 The idea that volatility reflects nothing more than the (perhaps rational, certainly
profit-seeking) behavior of foreign exchange traders seems to give justification for a policy response.
Yet, the disjunction between macroeconomic expectations and the volatility seems to indicate as well
that some deviation from domestic monetary policy goals would be necessary to intervene against
exchange rate swings.4
In fact, as demonstrated to most observers’ satisfaction in the instance of the ERM crises of
1992–1993, in a world of free movement of capital and domestic monetary policy autonomy (for the

5 See Krugman (1998) or Clarida (1999) for a review of the “impossible trinity” assessment.
6 There is no reason for an exchange rate commitment to come under attack when the move requiredto support the peg is in the same direction as intended monetary policy, e.g., when inflation is rising and thecurrency is under stress, an interest rate rise is credible. It is when the economy is slowing and the currencyis going to the weak edge of the zone (e.g., UK or Sweden in fall 1992) that the peg comes under attack, andthe attack itself generally worsens the conflict between goals.
7 See King (1997), Laubach and Posen (1997), Bernanke, et al (1999), and Kuttner and Posen (1999)for a combination of theoretical, historical, and econometric arguments to this effect.
8 Clarida and Gali (1994) and Eichenbaum and Evans (1995), among others, also assess variousshocks’ contributions to exchange rate fluctuations. Their focus, however, is on the contribution ofunsystematic monetary policy shocks, while ours is on inflation shocks, and the effects of policy’s systematic
2
G3 at least), exchange rate commitments cannot be maintained without sacrifice of one or the other.5
In other words, if there are no capital controls, when an exchange rate commitment comes under
attack, monetary policy must move in the opposite direction from that usually mandated by domestic
inflation and output concerns in order to support the peg.6 This is because of a limited number of
degrees of freedom for economic policymakers. Contrary to the expectations of Friedman (1953)
and Johnson (1969) prior to the advent of floating rates, it appears that domestically responsible
monetary policy may be destabilizing for exchange rates.
Yet, the movement toward greater transparency in monetary policymaking in recent years
may partially reconcile Friedman’s and Johnson’s instincts that a more disciplined monetary policy
should diminish exchange rate volatility with the apparent reality that macroeconomic fundamentals
do not drive exchange rates in the short run. If transparency can be increased by central banks, either
through institutional developments or through being more systematic in policymaking, without
altering the fundamental monetary policy capabilities or decisions, this may give central banks an
additional degree of freedom with which to work. Since it is at least arguable that transparency may
enhance the flexibility as well as the credibility of monetary policy by providing a better nominal
anchor for inflation expectations, it is worth exploring whether use of this additional policy option
(more a structure than an instrument) might have a meaningful effect on exchange rate volatility.7
Our paper assesses this possibility by posing two questions: first, to what extent do domestic
inflation and interest rate surprises—fluctuations unexplained by past history and the systematic
response of policy—contribute to short-run volatility in G3 exchange rates?8 These are precisely the

response to those shocks.
9 This model modifies Kuttner and Posen’s (1999) application of Svensson (1997) by replacing thelong-term interest rate and bond market with long-run PPP and an uncovered interest-rate parity (UIP)condition. See section 1 below.
3
type of shocks which should diminish in frequency and effect as monetary transparency increases,
if the hypothesized relationship between transparency and inflation expectations holds. Second, to
what extent do variations over time in American, German, and Japanese monetary transparency
actually match up with the timing of these shocks and the magnitude of their impact? Taken together,
the empirical estimates in answer to these questions should give some sense of whether increased
transparency in the G3 central banks would diminish exchange rate volatility.
The paper is structured as follows. In section 1, we set out a simple model of the implications
of different monetary regimes (discretionary, anti-inflationary conservative, and transparent “optimal
state contingent rule” [OSCR] following) for the response of inflation, interest rates, and exchange
rates to shocks.9 In section 2, we develop an operational measure of central bank transparency, and
apply it to the history of the Bank of Japan (BoJ), the Bundesbank, and the Federal Reserve in the
period 1975–1998, finding significant shifts in institutional transparency for the Federal Reserve and
for the BoJ in the late 1980s. In section 3, we estimate structural VAR (trivariate vector
autoregression) models of relative interest rates, inflation rates, and exchange rates for deutsche
mark-yen and deutsche mark-dollar, and conduct a number of analyses, including both comparing
impulse response functions before and after the shifts in transparency, and interpreting historical
decompositions for evidence of the exchange rate impact of smaller deviations from systematic
monetary policy. Section 4 concludes with an assessment of the importance of domestic inflation and
interest rate shocks to G3 exchange rate volatility, and the likelihood of increases in central bank
transparency to diminish those shocks.
A SIMPLE MODEL OF INFLATION, EXCHANGE RATES,
AND MONETARY POLICY
In understanding the macroeconomic sources of exchange rate volatility, useful starting points are
the familiar principles of purchasing power parity (PPP) and uncovered interest rate parity (UIP). The

4
latter is a difference equation linking the change in the exchange rate and the gap between foreign
and domestic interest rates:
where e is the log of the exchange rate (defined as the foreign currency units per domestic currency
unit), and I* and I are the foreign and domestic interest rates. The UIP condition can be solved
forward to yield:
which expresses the exchange rate at time t as the sum of current and expected future interest rate
differentials, plus the long-run equilibrium exchange rate, . Domestic interest rates in excess of the
foreign are associated with a high—but falling—exchange rate.
While interest rate differentials govern short-run exchange rate dynamics, the (log) ratio of
foreign to domestic price levels pin down the long-run exchange rate, , via PPP:
where p* and p are the logs of the foreign and domestic price levels. The condition can also be
expressed in terms of the sum of expected future inflation rates:
The PPP and UIP conditions by themselves obviously do not represent a complete macroeconomic
model. But even without closing the model, the two conditions suggest a tradeoff between short-run
and long-run exchange stabilization.
To see this, imagine an economy subject to supply shocks—events that presented the central
bank with a tradeoff between output and inflation stabilization. A vigorous policy reaction will
reduce the shocks’ impact on the price level, mitigating their long-run effect on the exchange rate.
But such a policy will create larger interest rate differentials, which, in the near term, will generate
exchange rate volatility. A more accommodative policy response, on the other hand, reduces short-
run interest-rate induced volatility, but at the expense of destabilizing the long-run value of the

5
exchange rate. Either way, inflation shocks generate exchange rate volatility; how much will depend,
of course, on the specifics of the macro model.
One way to close the model is to append the PPP and UIP relations to the model of Svensson
(1997), as extended by Kuttner and Posen (1999). This model is far too stylized to think about
directly estimating. It nonetheless illustrates the theoretical reasoning behind a role for central bank
transparency in minimizing the effects of inflation shocks on the exchange rate.
In Svensson’s model, the policymaker chooses inflation to minimize the discounted sum of
single-period loss functions of the form,
subject to an aggregate supply relation given by
where y is the output gap, B is inflation, and 8 is the relative weight on output versus inflation
stabilization. Persistence is introduced through the Dyt–1 term in the supply equation. Solving the
minimization problem yields policy rules giving inflation as a function of expected inflation, the
lagged output gap, and the supply shock, ,. An IS equation,
is then used to determine the corresponding path of interest rates.
Under discretion, the monetary authority accommodates supply shocks by allowing them to
affect inflation: . Not surprisingly, a higher weight on output stabilization
implies a more accommodative policy, which in this context means a larger value of b. Expected
inflation itself obeys ; if the central bank targets a nonzero output gap, inflation
will contain a constant inflation bias, a; output gap fluctuations also create a state contingent
inflation bias, cyt. The higher the weight on output stabilization, the larger are a and c.
Having derived the behavior of inflation, it is straightforward to use the IS equation, and the
interest rate parity and purchasing power parity relationships to solve for the response of the
exchange rate under discretion. The response of the nominal exchange rate at time t+j to an , equal
to –1 at time t (i.e., a unit adverse supply shock) is given by:

10 For the same set of parameters, b*, the OSCR-following central bank’s response to the shock, willbe less than the b under discretion, an effect referred to “stabilization bias.” See Svensson (1997).
6
The first term, which comes from the interest rate differential, tends to increase the exchange rate,
reflecting the increase in domestic interest rates used to combat inflation. The second term captures
the shock’s long-run effect on the price level. The net effect could go either way in a given period,
depending on the strength of the initial policy response versus the long-run price-level implications.
Over time, however, the interest rate effects die out, so in the long run, an adverse supply shock leads
to a depreciation.
This exchange rate response is characterized by the tradeoff between short-run and long-run
exchange rate stabilization alluded to earlier. As 8, the weight on output stabilization falls (the
central bank becomes more “conservative”), b and c (the central bank’s degree of accommodation)
shrink. This reduces the supply shocks’ effect on the long-run exchange rate, because the disinflation
is greater and faster, but increases the short-run volatility through increasing the interest rate
differential. In the limiting case of 8=0 (the “inflation nutter”), there is no long-run effect, but the
short-run effect is maximized.
If the central bank can commit to a constant rate of expected inflation, the inflation bias
problems associated with discretion disappear. King (1997) refers to this as the “optimal state-
contingent rule,” and argues that a properly-implemented inflation targeting policy can move the
monetary authority in this direction. The central bank is believed to anchor inflation expectations,
and so is not punished for its deviations.
In this case, the monetary authority creates inflation only in the period of the shock:
.10 The response of the nominal exchange rate to a unit adverse supply shock
would then be:
11 Arguments for the benefits of transparency, in terms of movement towards the OSCR and thereforeto a better outcome of the central bank’s time-inconsistency dilemma on average and in response to supplyshocks, are given in the preceding section and in Kuttner and Posen (1999). For broader discussions of themerits of transparency, in terms of democratic legitimacy, reduced market uncertainty, and improved centralbank behavior, see inter alia King (1997), Blinder (1998), and Bernanke, et al (1999).
7
The main difference between this exchange rate response and that under discretion is the lack of
terms involving the coefficient describing the degree of state-contingent inflation bias, c. The lack
of these terms means that the long-run effect of a supply shock on the price level and the PPP
exchange rate is smaller. Furthermore, the absence of an inflation premium in the nominal interest
rate implies smaller interest rate differentials, and attenuated short-run exchange rate volatility.
To summarize, when faced with supply shocks that entail a tradeoff between output and
inflation stabilization, central banks can differ in their response to those shocks, and in the markets’
response to them. Compared to the pure discretionary case, a “conservative” monetary policy can
stabilize inflation and the long-run nominal exchange rate, but at the expense of introducing greater
short-term volatility into the nominal (and real) exchange rate. In the limiting “inflation nutter” case
(of no weight on output stabilization goals), inflation shocks have no long-run effect on inflation or
even the nominal exchange rate, but maximum short-run effect on the volatility of the exchange rate.
Following the OSCR through transparently anchoring inflation expectations, however, produces a
more stable exchange rate in both the short- and long-run relative to a discretionary policy.
A FUNCTIONAL MEASURE OF TRANSPARENCY
IN THE G3 CENTRAL BANKS
While the path to central bank conservatism is well known (and increasingly well trod), the means
to the OSCR is less widely recognized. As asserted in King (1997), a transparent monetary
policy—interpreted in practice as inflation targeting—grants the central bank the credibility and
flexibility characterizing the OSCR. Transparency has become a central bank watchword in recent
years, and it is not disingenuous to claim that most people know it when they see it practiced.11
Designing a more objectively reproducible measure of monetary transparency, however, requires a
bit more rigor in classification. Following the discussion in Posen (1999), it is possible to
characterize the elements of monetary transparency as they relate to parts of the central bank’s

12 As Friedman (1997) states, “Central bank purchases and sales of securities, the resulting changesin bank reserves, and fluctuations in the relevant short-term interest rate are all known data not long after thefact. But few central banks make clear - genuinely clear - just why they have chosen the actions they havetaken.” Similarly, Bomfim and Reinhart (2000) distinguish between announcements of monetary policydecisions in general and those which explain as well why the move was made.
8
optimal control problem for monetary policy. In this view, a central bank has a preference (weighting
losses over various macroeconomic goals), a model of the economy and of the effects of monetary
policy (through an intermediate target) on that economy, a forecast of what will occur to the
economy (with uncertain lags and shocks), and a record of what the monetary policy choice and the
realization of shocks were last period. For the public and the markets, this means there are four
potential areas of revelation for the central bank: its goal, its target, its forecast, and the outcome of
its policies.
In theory, if the public and markets are given three or even two of these, and we assume
markets have equivalent information to the central bank about the economy, and that the central bank
engages in optimizing behavior, the remainder can be derived. In practice, however, such backwards
induction is unlikely to be successfully undertaken, or fully trusted by those who undertake it. Thus,
there is room for the central bank to disclose (make transparent) its views on each aspect of the
control problem. For such transparency to work, the central bank has to not only announce these as
numbers, but provide sufficient explanation to grant understanding of the numbers’ significance.12
So this gives us four potential disclosures with which, by whether or not they are provided, to
evaluate central banks’ transparency:
• A public numerical long-run goal for monetary policy;
• An Inflation Report or similar document describing the bank’s model of the economy,
estimate of the likely effect of monetary policy changes, and updates thereof;
• The central bank’s forecast of the goal variable, including an explicit statement of the
instrument setting underlying that forecast (e.g., unchanged interest rates);
• An ex post evaluation of what monetary policy moves were made in the past, what shocks
were realized, and what outcome for the goal variable resulted.
These criteria make up what we will call institutional transparency. We do not create here an index
of transparency, allowing for degrees of openness on each criterion and a means of aggregating them,

13 We are currently at work on creating such an index for the major OECD central banks in recentdecades, and exploring its explanatory power for different countries’ proclivities to inflation scares (a laGoodfriend (1983)) and to overreact to monetary accommodation of shocks.
14 See Svensson’s (2000) discussion of the mandate and goal of the European Central Bank as anexample of just this kind of assessment.
15 Our working assumption is that transparency enhances flexibility, in the sense that a central bankwhich explains its deviations from its pattern is better able to get away with exercising discretion, andKuttner and Posen (1999) provides some evidence to this effect. Faust and Svensson (1998) address muchthe same issue and definition of transparency from a theoretical perspective—“Increased transparency(smaller unobserved noise) improves the precision of private sector inference about central bank goals, andmakes the bank’s reputation and the private sector’s inflation expectations more consistent”—and come tothe opposite conclusion. We intend to employ our (in progress) index of transparency to test this empirical ly.
9
like those indices for central bank independence.13 Clearly, though, there is room for making some
ordinal assessment on each criterion rather than just checking yes/no—a central bank can have a
clear mandate for price stability, without a numerical target, and still be more transparent than a
central bank with a mandate containing multiple competing goals;14 a central bank can put greater
or lesser emphasis on public explanation and consistency of presentation in its publications, rather
than being limited to either simply printing backward-looking numbers or giving a full Inflation
Report-type of document.
Of course, in reality, even a fully transparent central bank with an explicit long-run goal is
likely to have multiple policy goals in the short run. Responsible central banks will not follow a
simple policy rule as in the idealized optimal control literature, especially when large shocks occur
with some frequency. As argued in Kuttner and Posen (1999), the key issue for monetary
transparency in a world of unexpected economic shocks is the ability to anchor expectations when
policy deviates from its normal response to those shocks (e.g., where inflation is the long-run goal,
for there to be limited pass-through to inflation expectations when the central bank accommodates
an adverse supply shock).15 In practical terms, when a central bank does something contrary to
expectations, is that action acknowledged and explained to the public and to markets? We term the
degree of commitment to this type of explanation transparency in discretion. To operationalize this
measure, one can assess whether a central bank issues a public explanation when it deviates
significantly from a reaction function (for example, a “Taylor rule”) estimated on its past behavior,
and whether it acknowledges that there was a conscious deviation from systematic policy.

16 As we will argue below, this is relevant for the BoJ in the 1990s, which increased its institutionaltransparency with the passage of the new BoJ Law in 1998, but repeatedly deviated from systematic policywithout explanation in the face of shocks.
17 One paper which begins to tackle these issues is Briault, Haldane, and King (1997). In that paper,the authors create an index of central bank accountability, and establish a negative relationship between thatindex and goal independence for central banks. Their index combines measures of legal accountability andtransparency, only one of which is in common with our criteria (publication of an inflation report). We preferto focus solely on transparency as the direct means of accountability to the public and markets; see alsoKohn’s (1997) and Koenig’s (1997) discussions of that index.
10
It is likely that a central bank with high institutional transparency will have no choice but
eventually to offer a great deal of transparency in discretion as well—otherwise, its forecast
competence and/or its commitment to its goals would come into question. For central banks which
do not have in place the full apparatus of institutional transparency, however, it is conceivable that
they could still wish to maintain a reputation for systematically opposing certain outcomes (e.g.,
demand-driven increases in inflation), and so they might display transparency in discretion without
much institutional transparency. Moreover, the fact that central banks would find it difficult to
simultaneously be institutionally transparent and be opaque in discretion, i.e., repeatedly deviate
from systematic policy without explanation, does not imply that the resolution is immediate or in
what manner the tension is likely to be resolved.16 The relationship between accountability,
independence, and transparency merits further research.17 For purposes of this paper, we can and do
distinguish between these two aspects of transparency in our empirical investigations, with changes
in institutional transparency defining structural breaks in central bank behavior, and transparency in
discretion relating to the market response to specific incidents in a central bank’s timeline.
Applying these functional measurements of monetary transparency to the G3 central banks
gives interesting results, though it should be noted that comparisons of institutional transparency
“levels” across countries are a large degree judgmental on our ordinal scale (the sign of changes in
institutional transparency within a country over time are easier to ascertain). Getting more than a
broad sense of the degree of a central bank’s transparency in discretion, however, is not possible
without a baseline for that bank’s systematic response function; initial estimates of those are given
in our empirical work below.

18 Laubach and Posen (1997) goes through the Bundesbank’s institutional framework in detail.Neumann (1997) comes to many of the same conclusions in more summary form.
11
The Bundesbank was extremely stable in institutional transparency over the period
1975–1998.18 From the time of the first monetary target, the Bundesbank annually announced the
inflation goal (usually, but importantly not always, 2 percent) which underlay its quantity equation
derivation of the year’s monetary targets. Moreover, on several occasions when meeting the
monetary target would have come into conflict with meeting the inflation goal, the inflation goal was
pursued first and was publicly acknowledged to have been. On the two occasions when inflation was
deemed likely to diverge noticeably from the goal for an extended period—following the 1979 oil
shock, and after German monetary unification in 1990—the Bundesbank used its definition of “price
stability” to point to a public long-run target. In terms of reporting, the Bundesbank was consistent
in producing a Monthly Report which amassed a great deal of information beyond simply tracking
the monetary aggregates, along with explanatory articles about issues in the German economy. The
Report gave general indications of the likely direction of monetary policy, as fiscal, external, and
labor market developments unfolded, but did not ever give strict forecasts for inflation. The
Bundesbank did, however, publish its model of the economy in complete but highly technical form.
Finally on the matter of ex post evaluation, the Bundesbank was scrupulously transparent, using the
occasion of the annual setting of monetary growth targets to track not only how well it did in meeting
those intermediate targets, but also in meeting the inflation goal, and explaining deviations from the
targets in terms of specific shocks.
In terms of transparency in discretion, the Bundesbank’s record is also consistent. To
illustrate from the two major instances of potential inflationary pressures mentioned, in the episode
of the second oil shock, the Bundesbank made clear that it would be more gradual than usual in
disinflating, and even gave a path for the intended rate of deflation (moving its “Unavoidable Rate
of Inflation” up to 4 percent in 1980 and bringing it down slowly until declaring victory in 1986).
In the instance of monetary unification, the Bundesbank made clear that it was primarily concerned
with inflation pass-through, and had to essentially ignore initial money demand shocks, and (perhaps
as a result) found that neither was as large as expected.

19 This paragraph draws on Blinder (1998), Friedman (1997), Bomfim and Reinhart (2000), and theauthors’ own reading of Federal Reserve Chairman’s testimony before Congress.
12
In the case of the Federal Reserve, measurement of institutional transparency shows an
accelerating trend toward greater openness from 1975 through the present.19 The Federal Reserve
has never set a public numerical long-run goal for policy, but the recent trent has been towards
greater clarity in objective-setting. From explicit pledges of loyalty to the potentially contradictory
goals of its Humphrey-Hawkins mandate in 1978; an implied interest in counter-inflationary policies
signaled but not specified by monetary targeting through 1985, to an explicit statement by Chairman
Greenspan in Humphrey-Hawkins testimony in July 1988 (restated in February 1989) that the sole
long-run goal of monetary policy should be price stability; and the abandonment (“downgrading”)
of monetary aggregates in 1993 for the reason that they do not contribute to tracking inflation, the
Federal Reserve finally heeded calls by Chairman Greenspan starting in 1995 for a change in the
Federal Reserve’s mandate to one solely focused upon “price stability.” The point for institutional
transparency is not the increasing emphasis on inflation per se, but the increasing clarity and
consistency with which that emphasis was made, especially beginning in July 1988.
The Federal Reserve Board and the 12 Reserve Banks publish an abundance of materials,
including research papers, the “Beige Book” assessing regional economic developments, the “Green
Book” showing with a five-year lag the Board staff’s national forecast, and the Federal Reserve
Bulletin. Unlike an Inflation Report-type document, however, no publication exists to summarize
the macroeconomic outlook guiding policy. The Bulletin consists mainly of retrospective numbers
in great density; and the “Green Book” forecasts cannot be interpreted either as policy goals, or as
representing the consensus of the Federal Open Market Committee (FOMC) members—and in any
case, the five-year publication lag renders the forecasts irrelevant for the evaluation of current policy.
On this score, little has changed since the 1970s. Starting in February 1994, however, the FOMC
began announcing changes in the Federal funds target, instead of requiring market participants to
draw inferences from the Desk’s open market operations. These announcements are also
accompanied by a brief statement of the rationale for the move. While discount rate changes had
always been announced with press releases, they too began to be accompanied by explanatory
statements.

13
It is in terms of ex post evaluation of shocks and outcomes that the Federal Reserve remains
least transparent. While the Chairman does report twice yearly to Congress ahead of the Humphrey-
Hawkins hearings, and is in that sense formally accountable, policy’s contribution to macroeconomic
performance vis à vis that of exogenous shocks is not assessed. The lack of an explicit goal with
which to benchmark performance makes such an assessment all the more difficult. Similarly, the
Federal Reserve has often deviated from its “normal” response to macroeconomic developments
(specified, e.g., by a “Taylor rule” or similar reaction function) without articulating the rationale for
the deviation. In the aftermath of the October 1987 stock market crash, the Federal Reserve did make
clear immediately what it would do and why; but other financial problems (e.g., the “headwinds” of
1991–93) were addressed without a clear statement of what was being tracked. The use of monetary
targets from 1979–85 has been widely recognized (both at the time, and even more clearly since) as
a means of signaling a general commitment to disinflation, but the failure to follow them strictly
(especially after the first three years or so) left the impression that considerable discretion remained.
The BoJ pursued a “money focused” monetary policy from 1975 to 1985 (see Cargill,
Hutchison and Ito (1997) and Ueda (1997) for details). This meant pursuing a generally stable
declining trend in broad money growth, with clear reference to this objective—although not to
specific annual monetary targets, just quarterly “forecasts” (starting in July 1978)—and explicit
mention that the stability of the financial system was the other main pursuit of policy. During the
period from the Plaza Accord in 1985 to the Louvre Accord in 1987, much the same approach was
taken, except explicit target zones for the yen-dollar rate substituted for money growth. (Prior to that,
it is difficult to discern a consistent major role for exchange rates in Japanese monetary policy,
though there certainly were occasional interventions.) After April 1987, and the G-7 agreements at
that time, monetary policy appears to have shifted between various goals, without a clearly-
articulated rationale for those shifts. For a time, the proximate and stated goals were domestic
demand growth linked with a decline in the value of the dollar, but these were replaced by a focus
on asset prices starting in June 1989, a shift which was confirmed by the incoming BoJ Governor

20See Bernanke and Gertler (1999) and Jinushi, Kuroki and Miyao (2000) for detailed assessmentsof the changes in, and unsystematic behavior of, BoJ monetary policy in the 1990s. Starting in January 1998,essentially beyond the end of our data set for this paper’s analyses, the BoJ did increase its institutionaltransparency in line with its impending independence. Despite a clarification of mandate—to price stabilityin the long-run, with concern for financial stability as required—and new efforts to release minutes and otherinformation, a lack of transparency in discretion has beset Japanese monetary policy since mid-1998. SeeMikitani and Posen, eds., (2000) for details.
14
Mieno in December 1989. After the bubble burst, the BoJ gradually switched to a limited reflationary
strategy, followed by direct efforts to keep the payment system afloat in 1996–1998.20
In terms of the second criterion for institutional transparency, the publication of a regularly
updated description of the Bank’s model of the economy and estimates of the effect of monetary
policy, the BoJ was similar to the Federal Reserve during the period examined. The BoJ did issue
monthly reports of data on Japanese economic conditions, but stopped short of making specific
forecasts. Changes in the monetary transmission mechanism were alluded to (e.g., that the collapse
of the banking system in the 1990s undermined the effects of expansionary policy), but not
quantified. There is no regular mechanism for reporting forecasts of macroeconomic variables such
as inflation, and the goals and even their relative priority remain unspecified. Ex post evaluations
were unstructured, and unlike the Federal Reserve, there was no commitment to report to the Diet
on its performance. This had some logic so long as the Ministry of Finance (MoF) officially
controlled policy, but MoF representatives were not held publicly accountable on a regular basis for
monetary performance either.
As indicated by the discussion of the shifting goals of Japanese monetary policy in the 1990s,
transparency in discretion was somewhat lacking. Bernanke and Gertler (1999) and Jinushi, Kuroki,
and Miyao (2000) both document several periods in which the BoJ diverged from the rather steady
pattern of systematic policy established from 1975–87. While the Bank’s activities in 1997 and 1998
to buy commercial paper, keep the discount rate low, and the like, were well and explicitly explained
as responses to the financial crisis (as was the government’s failure to respond until October 1998),
other instances were less clear. In particular, the slow pace of easing policy from 1992–95, and to
a lesser degree the slow rise in interest rates in 1990–91, were only clear in direction: the pace,
intermediate target or path to the goal, and the assessment of the effects of shocks were left

15
unspecified. This would lead one to expect increasing volatility in Japanese interest rate responses
in the 1990s, which would in turn create additional exchange rate volatility.
QUANTIFYING THE MACROECONOMIC SOURCES
OF EXCHANGE RATE VOLATILITY
It is worth beginning with an interesting stylized fact. The yen-dollar exchange rate has consistently
shown significantly greater volatility than either of the other bilateral G3 exchange rates [see, e.g.,
Clarida (1999)]. On any standard explanations of exchange rate volatility, this is an anomaly.
Macroeconomic differences between Japan and the United States, even if they were more unstable
than those between Germany and the United States or Germany and Japan (which is by no means
clear for the entire period), should not be the source of greater short-run volatility, given the
literature’s demonstrated unimportance of fundamentals. Both the United States and Japan had rising
inflation in the 1970s, and declining inflation in the 1990s, relative to Germany’s stable inflation
rate, so the convergence on low inflation does not explain the pattern either. The market
microstructures in terms of forex traders’ incentives, information, liquidity, regulation, technology,
and so on, which are usually considered the primary underlying cause of exchange rate volatility, are
identical across the G3 bilateral rates; the same firms, if not precisely the same traders, are dealing
in all three currencies simultaneously.
By taking monetary transparency into account, however, there seems to be a way of making
sense of this pattern: as argued in the previous section, the Bundesbank consistently exhibited greater
institutional transparency than either the BoJ or the Federal Reserve since 1975. This would be
consistent with there being smaller reactions of inflation expectations and interest rates to inflation
surprises originating in the deutsche mark-zone. When one considers the additional fact that all three
central banks pursued Tayloresque reaction functions over the 1975–1998 period (see Clarida, Galí
and Gertler (2000) and table 2 below), and that this relative ranking of bilateral average volatility
even holds including German unification, the ERM crisis, and their aftermath, it is more striking that

21 Laubach and Posen (1997) discuss the ability of the Bundesbank to anchor expectations evenduring reunification and the German monetary unification which followed.
16
the one apparent difference in monetary practice—the expectation anchoring effects of
transparency—is consistent with this pattern.21
This gives us two reasons for focusing our empirical investigations on the deutsche mark-yen
and deutsche mark-dollar exchange rates (and not the yen-dollar): First, since the Bundesbank’s
institutional transparency is essentially invariant over the 1975–1998 time period, but both the
Federal Reserve’s and the BoJ’s transparency shift markedly, this lets us track the effect of changes
in transparency. Second, since it is the deutsche mark cross-rates which were the subject of less
direct political pressure over the period, studying the deutsche mark rates makes it more difficult to
ascribe the influence of changes in transparency to an additional (unmeasured in this paper) source
of shocks.
Figure 1 displays two measures of exchange rate volatility since 1976 for the deutsche mark-
bilateral rates. The solid line in each panel is the standard deviation (in percent) of monthly exchange
rate changes, computed over a moving 24-month window. (The exchange rates are from the first
business day of each month.) The dashed line is similar, but rather than weighting each observation
equally within a fixed window, they decline geometrically and the sample expands: the weight on
observation t–I is 0.9i, normalized so that the sum of the weights equals unity.
Both measures tell identical stories. The volatility of the deutsche mark-dollar exchange rate
has gradually declined by about one-quarter, from its peak of over 4 percent (standard deviation of
monthly changes) to around 3 percent by 1994, where it has remained ever since. This is consistent
with the measurement of increasing institutional transparency from Burns to Volcker to Greenspan,
culminating in the additions to the Federal Reserve’s institutional transparency in 1994. While the
dollar has become more stable in recent years, the yen seems to have become quite a bit more
volatile. From its peak near 5 percent in the late 1970s, the volatility of the deutsche mark-yen
exchange rate declined to a nadir of around 2 percent in 1989. It subsequently increased to 3 percent,
and surged to over 5 percent in 1998 as the yen appreciated sharply. This is also consistent with the
measurement of decreasing transparency by the BoJ since 1987, after the Louvre Accord, and the
increasing uncertainty about the priorities of the BoJ in responding to the challenges of the 1990s.

22 Which means that the emphasis here is on the systematic component of monetary policy, ratherthan on monetary policy “shocks” as in Eichenbaum and Evans (1995) or Faust and Rogers (2000).
17
Beyond the overall pattern, it is essential to ask to what extent do these changes in exchange
rate volatility have roots in domestic inflation and interest rate surprises. These are the shocks whose
prevalence and effects should relate to transparency, if transparency matters. If these shocks are
important sources of volatility, the next question is whether the changes in the frequency and effect
of these surprises sensibly track the trends in central bank transparency in detail, as they do in broad
brush. Those are the questions we try to address in our econometric investigations of macroeconomic
shocks and monetary policy as sources of exchange rate volatility.
Our main focus is on the effect of inflation shocks: how the exchange rate responds when
inflation comes in higher than expected, taking systematic monetary policy response into account
(and assuming that the markets and public do the same).22 As discussed in section 1 above, for a
more transparent central bank, the central bank’s and the market’s responses to an inflation shock
should look more like the OSCR model, with lower inflation persistence, smaller inflation and
exchange rate effects from a given inflation shock, and a smaller accompanying rise of interest rates.
A second question is the extent to which fluctuations in relative interest rates unrelated to inflation
differentials can account for exchange rate movements. The size of the interest rate response is a
noisy measure of markets’ trust in the central bank’s long-run commitment to its goal [see Kuttner
and Posen (1999)]. To answer both of these questions, it is useful to distinguish between inflation’s
long-run effect on the nominal exchange rate (via PPP), and its short-run effect from the interest rate
differentials produced by the policy response to inflation.
The framework used for the analysis is a VAR involving the bilateral exchange rate (deutsche
mark versus dollar or yen), the inflation differential (US or Japanese CPI inflation relative to West
German), and the interest rate differential (the Federal Reserve funds or Gensaki rates relative to the
German repo rate). The exchange rate is entered as a log difference, and cointegration between the
exchange rate and relative price levels is not imposed; consequently, the real exchange rate not
assumed to be stationary. To examine possible changes in the degree of monetary transparency and
the hypothesized resulting changes in inflation dynamics, the model is estimated separately over two
roughly equal periods, with the breakpoints in April 1987 for Japan and in July 1988 for the United

23 It is possible to argue for breaks in transparency for the BoJ in June 1989 (when interest ratesbegan to rise to prick the bubble), and for the Federal Reserve in February 1989 (when Greenspan reiteratedhis definition of the price-stability goal in congressional hearings, and this was picked up by the major press),rather than these dates. As one would expect, this makes little difference to the results, especially for theUnited States, and the break points used in our investigations are statistically significant as they are.
24 Estimation ends in 1998:12 to avoid any possible break associated with Germany’s adoption ofthe euro in 1999.
18
States, as suggested by the institutional transparency changes discussed above.23 For both pairs of
countries, nine lags of monthly data from 1976 through 1998 are used in the estimation.24
Identifying the model and extracting well-defined inflation and interest rate “shocks” requires
three assumptions. One corresponds to a version of the PPP condition: inflation shocks are assumed
to have no long-run effect on the real exchange rate, i.e., that inflation shocks have the same effect
on the price level differential and on the nominal exchange rate in the long run. The second
restriction is that shocks to the interest rate differential also have no long-run effect on the real
exchange rate. The third identifying assumption is simply that shocks to the interest rate differential
have no contemporaneous (within the month) effect on the inflation differential.
Having specified the statistical model, there are two ways to draw out its implications for the
behavior of the exchange rate. One is to invert the autoregression and compute the impulse response
functions from the moving average representation in the usual way. This can be used to look for
changes in the response of monetary policy and exchange rates to inflation shocks before and after
break points in institutional transparency. By matching up the patterns of these shifts in impulse
response functions with the predictions of our model in section 1, this is the first of our
investigations.
This procedure, however, does not take advantage of the fact that the VAR can also be used
to generate a forecast of future inflation and interest rate differentials which, according to purchasing
power and uncovered interest rate parity, determine the exchange rate. The second procedure, then,
is essentially to plug those forecasts into the solved-forward UIP relationship to determine the
response of the exchange rate, constrained to satisfy the interest rate parity condition (and the

25 The restrictions implied by UIP are testable, although we do not perform those tests here. InClarida and Galí (1994), the restrictions are rejected.
19
homogeneity implied by PPP).25 As a complement to these historical decompositions, we also
estimate policy reaction functions to look for shifts in central bank preferences, and identify
deviations from the central bank’s systematic response to macroeconomic conditions. We report the
results from both methods for each country, first for the United States, then for Japan, below.
United States
Figure 2 displays the basic data on the deutsche mark-dollar bilateral rate, and the other
components of the VAR. Looking at the bottom panel, the trend in the two countries’ relative price
levels matches up well with the general downward trend in the value of the dollar since 1972,
indicating that our long-run restrictions are plausible. Figure 3 shows the estimated response of US
inflation, interest rates, and exchange rates to an inflation shock of 1 percent. As suggested by the
discussion above, a plausible breakpoint for the analysis is July 1988, when Alan Greenspan’s
testimony signaled a heightened clarity of focus on price stability. The top left panel of figure 3
shows that before 1988, the effects of shocks to the US/German inflation differential died out very
gradually. These effects, cumulated over a period of years, had large implications for relative price
levels. As shown in the next panel down, the interest rate differential did not, however, rise as much
as inflation, resulting in a fall in the real rate in the United States, relative to Germany, after an
inflation shock in the United States relative to Germany.
This apparently accommodative monetary policy response in the United States prior to July
1988, similar to that of the discretionary case in our model, is reflected in the behavior of the
exchange rate, shown in the bottom left panel of figure 3. The dotted line shows the nominal
exchange rate movement corresponding to the inflation shock’s long-run effect on relative prices,
which in this case is roughly 0.4 percent lower. The dashed line shows the path of the exchange rate
constrained to satisfy UIP; after falling sharply in the in the month of the shock, it declines gradually
towards the level implied by PPP. The unconstrained response, given by the dashed line, falls by a
comparable amount on impact, but it subsequently overshoots by about 0.3 percent before
converging (by assumption) to its PPP level.
26 This is just the standard historical decomposition of the nominal exchange rate in terms of pastinflation shocks; see Doan (1992), 14-116.
27 This series is related to a multivariate Beveridge-Nelson decomposition.
20
Things look very different after July 1988. As shown in the top right-hand panel, US inflation
shocks now die out immediately, and have virtually no implications for future inflation. The response
of the interest rate differential is mild, showing only a very small increase in the real rate. And, as
expected given the small response of relative price levels and interest rates, inflation shocks’ effect
on the exchange rate is minimal (and there is much less overshooting as well). This pattern of less
pass-through of inflation shocks and lower persistence is consistent in terms of our model with a
move by the Federal Reserve towards the OSCR through increasing transparency.
The top panel of figure 4 shows how inflation shocks have contributed historically to
fluctuations in the nominal deutsche mark-dollar exchange rate. The July 1988 breakpoint is
indicated by a vertical line. In the pre-1988 period, inflation shocks’ contribution is large: in the
unconstrained series shown as the dashed line, a large share of the 1976–80 depreciation and the
1980–85 appreciation are attributable to inflation disturbances.26 (As always, much of the 1980–85
appreciation is not explained, however.) The dotted line shows the path of the exchange rate implied
by inflation shocks’ effect on expected future inflation and interest rate differentials, constrained to
satisfy the UIP condition.27 This shows the same qualitative pattern as the unconstrained series, albeit
with a smaller magnitude. After 1988, neither method attributes any significant exchange rate
variation to inflation shocks. This pattern is confirmed by the variance decompositions displayed in
the top panel of table 1. In the early part of the sample, interest rate shocks account for as much as
20 percent of the nominal exchange rate variance; after 1988, they contribute a trivial 3 percent of
the variance. (“Own” shocks to the exchange rate account for nearly all of the exchange rate
variation.)
The bottom panel of figure 4 traces out the effects of fluctuations in the interest rate
differential unrelated to inflation or exchange rate movements. These may represent either the
normal policy response to macroeconomic factors not present in the VAR, or unsystematic
deviations of policy from “normal” behavior. The unconstrained decomposition, again shown as a
dashed line, attributes very little of the variation in the exchange rate to interest rate differentials, and

28 The results in Clarida, et al’s own investigations suggest that the inflation coefficient wouldprobably be smaller in the 1976–79 portion of the sample, however.
21
this is confirmed by the variance decompositions in the top panel of table 1. The decomposition
based on UIP, on the other hand, associates a certain amount of the dollar’s weakness to
(predictably) lower interest rates in the United States vis à vis Germany in the early 1990s.
To understand whether differences in these responses can be traced to the behavior of
monetary policy, it is useful to examine monetary policy reaction functions, like those studied by
Clarida, Galí and Gertler (2000). The top panel of table 2 presents forward- and backward-looking
versions of a reaction function for the United States, allowing for a change in the coefficients on
inflation and output after July 1988. What is striking in these results is the lack of any significant
difference in terms of the relative weight on output and inflation goals between the two periods. The
inflation coefficient (which is significant only in the forward-looking specification) is nearly
unchanged, and the coefficient on real output (detrended log industrial production) increases
slightly.28 Notice, however, that the standard error drops markedly, perhaps indicating more
systematic policy in the second period. In any case, there is no evidence to suggest that the more
subdued response of inflation and the nominal exchange rate to inflation shocks was obtained by an
increase in conservatism. A decline in inflation persistence (an increase in the anchoring of inflation
expectations) without a change in monetary policy goals is likely attributable to an increase in
transparency - this is the potential additional degree of freedom for policymakers hypothesized about
in our introduction.
Japan
As with the United States, figure 5 displays the basic data used in the VAR. Unlike in the
case of the dollar, the yen’s appreciation against the deutsche mark since 1980 appears largely
unrelated to changes in the two countries’ relative price levels. Figure 6 shows the response of
inflation, interest rates, and the exchange rate to shocks to the Japanese–German inflation
differential. The upper left-hand panel shows that prior to April 1987, shocks to the inflation
differential displayed a fair amount of persistence (albeit not as much as the persistence of shocks
to the United States–German differential). Nominal interest rates responded relatively gradually

22
(center-left panel), leading to a near-term decline in the real rate, followed by an increase after about
six months. The unconstrained response of the nominal exchange rate (bottom-left panel) overshoots
its PPP level somewhat, before appreciating; the path constrained by UIP shows an immediate
decline followed by a further depreciation towards the PPP level.
As in the United States, there is much less persistence in the Japanese inflation differential
after the breakpoint in the late-1980s; in fact, there is some tendency in the latter period for shocks
to reverse themselves (top-right panel). In line with our model in section 1, this could be the result
of either increased conservatism or transparency (movement towards the OSCR). Despite the more
muted behavior of inflation, the response of nominal rates is broadly similar across the two periods:
somewhat smaller in magnitude in the latter period, but more prolonged (center-right panel). The
result is a more pronounced increase in the real rate post-April 1987, consistent with the movement
towards conservatism in our model. The exchange rate path (lower-right panel) is just what one
would expect in light of the more aggressive response to inflation: in the unconstrained estimate, the
nominal exchange rate actually appreciates initially in the face of an inflation shock, before
declining to the level implied by PPP. The path constrained by UIP does not show an appreciation,
but the increase in interest rates staves off the depreciation for a period of several months. This is
the sort of volatility tradeoff of short-term exchange rate volatility versus long-term inflation
volatility predicted for an increase in conservatism by our model.
Turning to the historical decompositions, the top panel of figure 7 displays the contribution
of inflation shocks to nominal deutsche mark-yen exchange rate fluctuations. Only in the mid- to
late-1970s do inflation shocks contribute tangibly to the yen’s fluctuations, accounting for some of
the yen’s gradual downward trend prior to 1980. Except for this episode, Japanese and German
inflation rates remained close to one another, so it is no surprise that shocks to the inflation
differential should have played a small role. Nonetheless, as shown in the bottom panel of table 1,
overall inflation shocks did account for as much as 18 percent of the nominal exchange rate variance
in the pre-April 1987 portion of the sample.
There is somewhat more variation in the interest rate differential, and shocks to it account
for a surprising amount of the movements in the deutsche mark-yen exchange rate post-1987. In the
unconstrained estimate, rising rates in the late 1980s are associated with a rising yen, and falling

29 The share peaks at 14 percent at the 24-month horizon. Shocks to the interest rate differentialactually contribute slightly more to the nominal exchange rate variance pre-1987 at the shorter 1–6 monthhorizon, presumably due to the high-frequency volatility of short-term interest rates.
30 Jinushi, Kuroki, and Miyao (2000) find a similarly timed break in the BoJ’s response function in1987, and a similar move towards more strict pursuit of inflation goals.
23
rates in the early 1990s with the yen’s subsequent decline. As shown in table 1, shocks to the interest
rate differential account for 10 percent of the nominal exchange rate variance at a 12-month
horizon.29 In this latter portion of the sample, the exchange rate appears to be unusually sensitive to
interest rate shocks: A 1 percent shock to the differential generates a peak response of over 6.5
percent, far in excess of the 1.3 percent or so that would be consistent with uncovered interest rate
parity, given the shock’s impact on future interest rate differentials. This sizable magnitude might
be attributable to the decline in discretionary transparency, as BoJ monetary policy became less
systematic in the face of the challenges of the 1990s; given the limited room for maneuver of the
Japanese near-zero instrument interest rate, every monetary policy move was scrutinized for its
uncertain implications for exchange rate levels.
Finally, to better understand the factors affecting Japanese interest rates, we examine an
estimated reaction function for the BoJ, displayed in the bottom panel of table 2. The results confirm
a distinct shift in the conduct of monetary policy in the late 1980s. Prior to 1987, the BoJ’s emphasis
seems to have been on real activity: The coefficient on detrended output is large and significant,
while even in the forward-looking specification, the coefficient on inflation is small, and has the
wrong sign. After 1987, the inflation coefficient is large (implying a two- or three-to-one response
of the interest rate), and the coefficient on IP is insignificant30. Both coefficients’ changes are
statistically significant at the 5 percent level. In short, counter-inflationary conservatism markedly
increased in Japanese monetary policy in the 1990s, and this added to short-run exchange rate
volatility.

31 The new BoJ Act of 1998, and the BoJ’s preparations for operational independence, did increaseinstitutional dependency on two of our four criteria, but this takes place at the very end of our sample period(and arguably was accompanied by a decrease in transparency in discretion).
24
WOULD INCREASED TRANSPARENCY MEANINGFULLY
DIMINISH G3 EXCHANGE VOLATILITY?
The premise of this paper’s investigations was that differences in transparency of monetary policy
within the G3 could explain part of the variation over time in short-run exchange rate volatility. As
set out in the model of section 1, a central bank which increases its transparency of monetary policy
making can be thought of as moving from discretion towards the OSCR, thereby better anchoring
inflation expectations, and decreasing its need to be aggressive in response to inflation surprises.
Working from a standard model of central bank goals under time-inconsistency, following Svensson
(1997) and Kuttner and Posen (1999), but adding a short-run UIP condition, and long-run PPP, it
becomes clear that movements from discretion towards the OSCR will diminish exchange rate
volatility, while increases in conservatism (i.e., the relative weight on inflation goals) without
compensating increases in transparency will increase that short-run volatility.
Using a measure of institutional transparency for central banks developed in section 2, it was
established that the Bundesbank was consistently, and noticeably though not fully, transparent for
the duration of its post-Bretton Woods lifetime (1975–1998). The Federal Reserve significantly
increased transparency with a clarification of its goals in 1988, and showed a trend towards greater
openness from that date forward, including the explicit abandonment of monetary targets in 1993
and the addition of explanations to interest rate announcements in 1994. The BoJ moved in the
opposite direction, cycling between multiple goals starting in 1987, with diminishing clarity over
time.31 These trends, and the stability of the Bundesbank’s framework, allowed us to examine the
behavior of deutsche mark-yen and deutsche mark-dollar nominal exchange rates for evidence of
transparencies impact in line with the predictions of the model.
Both in the broad and the specific, our investigations support the belief that monetary
transparency matters for exchange rate volatility. Broadly speaking, this characterization of the G3
central banks’ transparency provides a means of explaining the previously anomalous pattern that
yen-dollar exchange rate volatility was consistently higher than either of the deutsche mark bilateral

32 Future work using monte-carlo methods will give us standard error bands on the impulse responsefunctions, allowing us to assess whether these changes are statistically significant.
25
rates in the G3, despite one unified market for all three currencies. More specifically linking to the
predictions of our model, the deutsche mark-dollar exchange rate showed diminishing volatility over
time in line with the increase in the Federal Reserve’s transparency. Most tellingly, US inflation
persistence declined significantly after 1988, despite stability before and after 1988 in the relative
weights on inflation and output goals in an estimated Federal Reserve response function. This is
consistent with a view of the Federal Reserve as a central bank moving from discretion towards the
OSCR through increasing transparency. Marked changes in the impulse response functions of
inflation, interest rates, and exchange rates after 1988 in the United States also fit the picture of what
should happen for a central bank moving towards the OSCR without an increase in conservatism.32
In the case of Japan, there is ample evidence of an increase in counter-inflationary
conservatism—while inflation persistence declines after 1987, the weight on inflation goals in an
estimated Taylor rule significantly increased, and the impulse response functions for interest rates,
et al, look like those of a central bank moving towards being an “inflation nutter” [in the sense of
King (1997)]. Also, the volatility of the deutsche mark-yen exchange rate steadily rises from 1987
onwards, consistent with a more aggressive pursuit of price stability at the expense of short-run
exchange rate volatility. The role of inflation shocks in explaining movements in the variation of
exchange rates falls for both the BoJ and the Federal Reserve after their respective late-1980s
breakpoint, but only in Japan is this accompanied by an increase in the explanatory power of interest
rate shocks (their explanatory power declines for the deutsche mark-dollar post 1988), again
consistent with the interpretation of the Federal Reserve moving towards the OSCR while the BoJ
moved toward greater conservatism.
So, in practice as well as in prospect, increasing monetary transparency does offer an
additional degree of freedom with which the G3 central banks can address short-run exchange rate
volatility. As exemplified by the shift in the Federal Reserve transparency after 1988, without an
increase in conservatism—and the Federal Reserve and the markets’ response to inflation surprises
after that—it is not necessary to change a central bank’s macroeconomic priorities in order to better
anchor expectations, and thereby diminish exchange rate volatility. In fact, for reasonable parameter

26
values, transparency enhancement is more likely to be win-win than increasing conservatism,
decreasing both inflation persistence and forex volatility. As illustrated by the experience of the BoJ
after 1987, increasing conservatism is more likely to trade a drop in inflation persistence for an
increase in exchange rate volatility. Transparency is independent of the “impossible trinity” tradeoff
usually cited as a reason for the inability or unwillingness of major central banks to respond to
volatility, as well as of the “fundamentals” which do not determine exchange rates (except to the
extent that increased transparency improves inflation performance).
The magnitude of the impact of increased monetary transparency on G3 exchange rate
volatility, however, remains open to question. There is no quantitative, cardinal, metric for
transparency, and so no way of knowing how much stability is bought for a given increase. In the
case of the United States, while there is certainly room for additional clarity, given the marked
increases in the Federal Reserve’s institutional transparency in 1988 and 1993–94, it is not evident
how much the additional efforts will “buy” in terms of exchange rate stability. If the entire decline
in deutsche mark-dollar volatility after 1988 were to be attributed to the Federal Reserve’s increase
in transparency—a binding but not outrageous upper-bound—over 1 percent of the initial 4 percent
monthly standard deviation of would have been taken away by the efforts. A similar attribution for
the rise in deutsche mark-yen volatility gives an upper bound of over 2 percent, but given the
Japanese economic crisis, it is much less credible that the only major shift in policy or forex
environment was the shift in BoJ transparency and preferences. Taking only half that amount as the
effect of transparency, however, puts us back at the same estimate as that for the deutsche mark-
dollar. The average amount by which the yen-dollar volatility exceeds either of the deutsche mark
bilateral rates—which could be interpreted largely as the Bundesbank’s relative transparency bonus,
since there are no significant differences from the other two central banks in central bank
independence or in monetary response functions for much of the period, let alone in structure of the
foreign exchange markets—is also of a similar order of magnitude.
If these ballpark but consistent estimates of the benefits of transparency were correct, that
would still leave more than two-thirds of the present monthly volatility, which would still swamp
(and be unrelated to) the movement in underlying macroeconomic fundamentals. The problem of G3
exchange rate volatility would not go away, nor should it so long as financial markets’

27
microstructure is the source of it (see Rogoff 1999). Yet, assuming that part of the dislike for
exchange rate volatility is generated by its extreme magnitudes, removing 20–30% of it would be
significant for emerging markets and international businesses—especially since the means for so
doing, increasing monetary transparency, increases political legitimacy without economic cost, and
adds potentially significant economic benefits (such as diminished inflation persistence and pass-
through).
Meanwhile, were all three of the G3 central banks to maximize their institutional
transparency, say by moving to explicit inflation targeting frameworks in today’s believed best
practice for openness, there is likely to be even greater demand for transparency in discretion. The
major central banks’ explanations of deviations from systematic policy would no longer be compared
against just their own published goals, forecasts and explanations, but also those of their peers.
While this framework thankfully would not constitute a fixed rule, such an institutionalization of
transparency would seem to bode well for more disciplined, better understood, monetary policy. This
disciplining of discretion might in turn imply still further decreases in exchange rate volatility
beyond those to be expected from each of the G3 central banks becoming more transparent on their
own.
28
REFERENCES
Baxter, Marianne and Alan Stockman. 1989. Business Cycles and the Exchange-Rate System,
Journal of Monetary Economics.
Bernanke, Ben. 2000. Japanese Monetary Policy: A Case of Self-Induced Paralysis? In
Mikitani and Posen, eds.
Bernanke, Ben, et al. 1999. Inflation Targeting: Lessons from the International Experience.
Princeton University Press.
Bernanke, Ben and Mark Gertler. 1999. Monetary Policy and Asset Price Bubbles mimeo,
FRBKC Jackson Hole Conference, August.
Blinder, Alan. 1998. Central Banking in Theory and Practice, Cambridge: MIT Press.
Bomfim, Antulio and Vincent Reinhart. 2000. Making News: Financial Market Effects of
Federal Reserve Disclosure Practices mimeo, Federal Reserve Board.
Briault, Clive, Andrew Haldane, and Mervyn King. 1997. Independence and Accountability,
in Kuroda ed.
Cargill, Thomas, Takatoshi Ito, and Michael Hutchison. 1997. The Political Economy of
Japanese Monetary Policy, Cambridge: MIT Press.
Clarida, Richard. 1999. G3 Exchange Rate Relationships: A Recap of the Record and A Review
of Proposals for Change. NBER Working Paper 7434, December.
Clarida, Richard, and Jordi Galí. 1994. Sources of real exchange-rate fluctuations: How
important are nominal shocks? Carnegie-Rochester Conference Volume on Public Policy
41, 1–56.
Clarida, Richard, Jordi Galí and Mark Gertler. 2000. Monetary Policy Rules and Macroeconomic
Stability: Evidence and Some Theory, Quarterly Journal of Economics 115 (1), February,
147–180.
Doan, Thomas. Rats User’s Manual version 4, Evanston: Estima.
Eichenbaum, Martin and Charles Evans, Some Empirical Evidence on the Effects of Shocks to
monetary Policy on Exchange Rates, Quarterly Journal of Economics 110, 975–1010.

29
Faust, Jon and John Rogers, Monetary Policy’s Role in Exchange Rate Behavior mimeo, Board
of Governors of the Federal Reserve System.
Flood, Robert, and Andrew Rose. 1995. Fixing Exchange Rates: A Virtual Quest for
Fundamentals, Journal of Monetary Economics.
Flood, Robert and Andrew Rose. 1999. Understanding Exchange Rate Volatility Without the
Contrivance of Macroeconomics, Economic Journal, November.
Frankel, Jeffrey and Andrew Rose. 1995. Empirical Research on Nominal Exchange Rates,
Handbook of International Economics 3. Amsterdam: Elsevier.
Friedman, Benjamin. 1997. The Rise and Fall of Monetary Targets for US Monetary Policy,
in Kuroda, ed.
Jinushi, Toshiki, Yoshihiro Kuroki, and Ryuzo Miyao. 2000. Monetary Policy in Japan Since
the Late 1980s: Delayed Policy Actions and Some Explanations. In Mikitani and Posen,
eds.
King, Mervyn. 1997. Changes in UK Monetary Policy: Rules and Discretion in Practice, Journal
of Monetary Economics 39, 81–87.
Krugman, Paul. 1998. The Eternal Triangle mimeo, MIT
Kuroda, Iwao, ed. 1997. Towards More Effective Monetary Policy. New York: St. Martin’s
Press
Kuttner, Kenneth N. and Adam S. Posen. Does Talk Matter After All? Inflation Targeting and
Central Bank Behavior. Federal Reserve Bank of New York Staff Report 88.
Laubach, Thomas and Adam Posen. 1997. Disciplined Discretion: Monetary Targeting in
Germany and Switzerland, Princeton Essays in International Finance, December.
Meese, R and Kenneth Rogoff. 1983. Empirical Exchange Rate Models of the Seventies: Do
They Fit Out of Sample? Journal of International Economics, February.
Mikitani, Ryoichi and Adam Posen, eds. 2000. The Japanese Financial Crisis and Its Parallels
With US Experience, Washington: Institute for International Economics (forthcoming
July).
Neumann, Manfred J. M. 1997. Monetary Targeting in Germany. In Kuroda, ed.

30
Obstfeld, Maurice and Kenneth Rogoff. 1995. The Mirage of Fixed Exchange Rates, Journal
of Economic Perspectives, Fall 1995.
Posen, Adam. 1999. No Monetary Masquerades for the ECB. In The European Central Bank:
How Accountable? How Decentralized?, ed. Ellen Meade. American Institute for
Contemporary German Studies.
Rogoff, Kenneth. 1999. Monetary Models of Dollar/Yen/Euro Nominal Exchange Rates: Dead
or Undead? Economic Journal, November.
Svensson, Lars. 1997. Optimal Inflation Contracts, ‘Conservative’ Central Banks, and Linear
Inflation Contracts, American Economic Review 87, 98–114.
Ueda, Kazuo. 1997. Japanese Monetary Policy, Rules or Discretion? A Reconsideration. In
Kuroda, ed.
Volcker, Paul. 1995. The Quest for Exchange Rate Stability mimeo, Institute for
International Economics.
Williamson, John. 1998.Crawling Bands or Monitoring Bands, International Finance,
September.
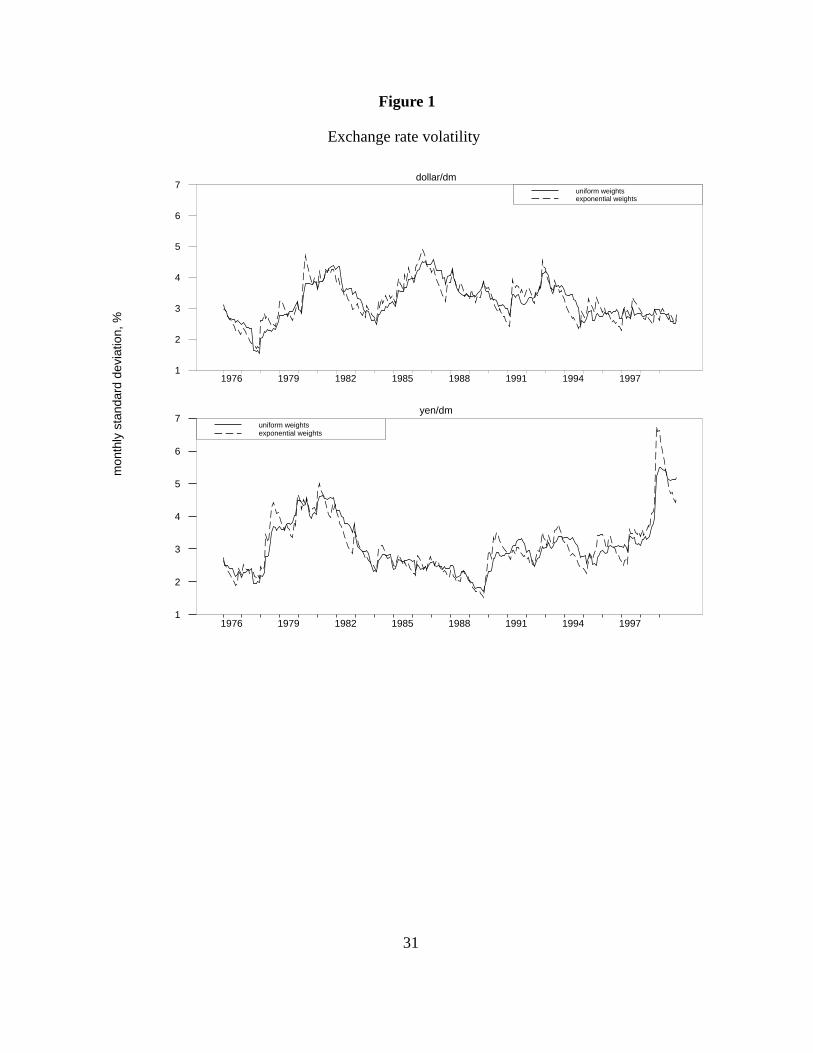
Figure 1
Exchange rate volatilitym
onth
ly s
tand
ard
devi
atio
n, %
dollar/dm
1976 1979 1982 1985 1988 1991 1994 19971
2
3
4
5
6
7uniform weightsexponential weights
yen/dm
1976 1979 1982 1985 1988 1991 1994 19971
2
3
4
5
6
7uniform weightsexponential weights
31

Figure 2
US and German data
Inflation12-month change in CPI
1972 1976 1980 1984 1988 1992 1996-4
0
4
8
12
16 U.S.GermanyU.S. - Germany
Interest ratesFed funds, call money rates
1972 1976 1980 1984 1988 1992 1996-10
-5
0
5
10
15
20 U.S.GermanyU.S. - Germany
Log nominal exchange rateand cumulative inflation differential
1972 1976 1980 1984 1988 1992 19960.25
0.50
0.75
1.00
1.25 DM/$German - U.S. inflation
32

Figure 3
Responseof interest rateand exchange rate to a 1 percent inflation shock, the United States
inflation
interest rate
exch rate
pre-1988 post-1988pe
rcen
t
0 10 20 30 40 50-0.2
0.0
0.2
0.4responsesmoothed
0 10 20 30 40 50-0.2
0.0
0.2
0.4response
smoothed
perc
ent
0 10 20 30 40 50-0.2
-0.1
0.0
0.1
0.2nominal ratereal rate
0 10 20 30 40 50-0.2
-0.1
0.0
0.1
0.2nominal ratereal rate
months
perc
ent
0 10 20 30 40 50-1.0
-0.5
0.0
0.5unconstrained
implied by UIP
PPP equilibrium
months
0 10 20 30 40 50-1.0
-0.5
0.0
0.5unconstrained
implied by UIP
PPP equilibrium
33

Figure 4
Contribution of inflation and interest rateshocks to nominal exchange ratefluctuations, the United Statespe
rcen
t dev
iatio
n fr
om tr
end
contribution of inflation shocks
1976 1978 1980 1982 1984 1986 1988 1990 1992 1994 1996 1998-30
-20
-10
0
10
20
30
40
50actual
implied by UIPunconstrained
July 1988
contribution of interest rate shocks
1976 1978 1980 1982 1984 1986 1988 1990 1992 1994 1996 1998-30
-20
-10
0
10
20
30
40
50actual
implied by UIP
unconstrained
July 1988
35

Figure 5
Japanese and German data
Inflation12-month change in CPI
1972 1976 1980 1984 1988 1992 1996-5
0
5
10
15
20
25 JapanGermanyJapan - Germany
Interest ratesGensaki, call money rates
1972 1976 1980 1984 1988 1992 1996-10
-5
0
5
10
15
JapanGermanyJapan - Germany
Log nominal exchange rateand cumulative inflation differential
1972 1976 1980 1984 1988 1992 1996-5.00
-4.75
-4.50
-4.25
-4.00 DM/YenGerman - Japanese inflation
35

Figure 6
Responseof interest rate and exchange rate to a1 percent inflation shock, Japan
inflation
interest rate
exch rate
pre-1987 post-1987p
erce
nt
0 10 20 30 40 50-0.16
0.00
0.16
0.32responsesmoothed
0 10 20 30 40 50-0.16
0.00
0.16
0.32response
smoothed
per
cen
t
0 10 20 30 40 50-0.10
-0.05
0.00
0.05
0.10nominal ratereal rate
0 10 20 30 40 50-0.10
-0.05
0.00
0.05
0.10nominal rate
real rate
months
per
cen
t
0 10 20 30 40 50-0.50
-0.25
0.00
0.25
0.50unconstrained
implied by UIPPPP equilibrium
months0 10 20 30 40 50
-0.50
-0.25
0.00
0.25
0.50unconstrained
implied by UIP
PPP equilibrium
36
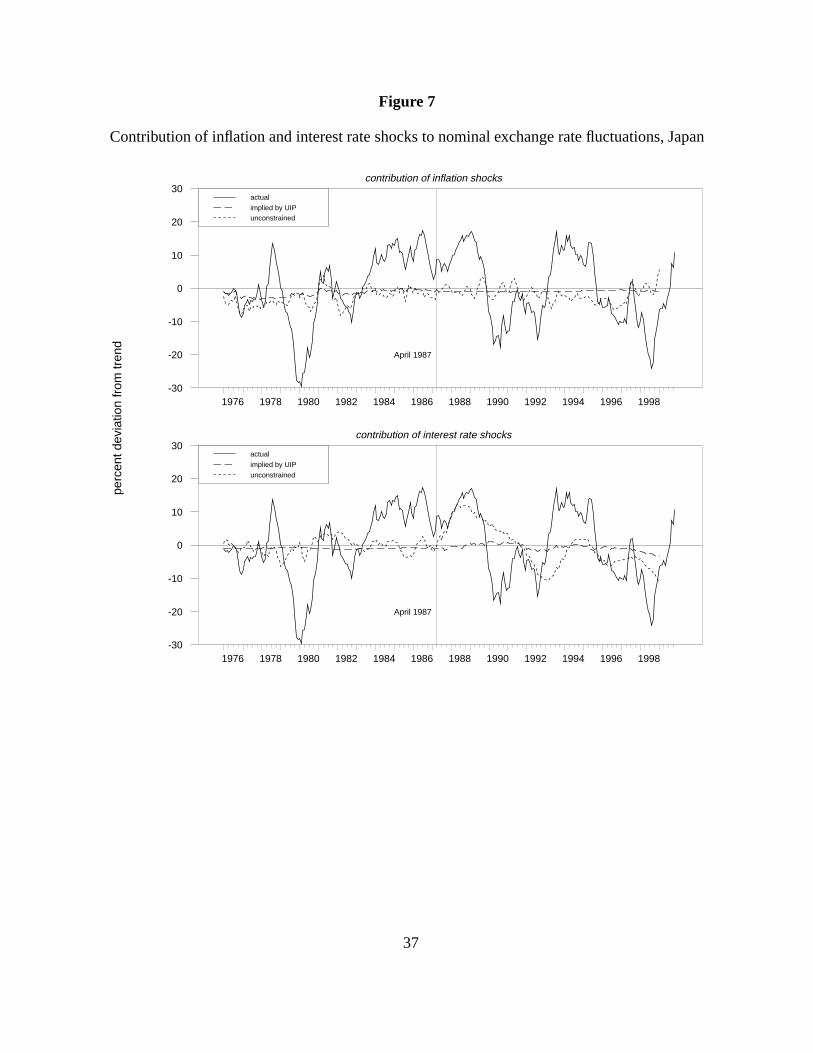
Figure 7
Contribution of inflation and interest rate shocks to nominal exchange rate fluctuations, Japanpe
rcen
t dev
iatio
n fr
om tr
end
contribution of inflation shocks
1976 1978 1980 1982 1984 1986 1988 1990 1992 1994 1996 1998-30
-20
-10
0
10
20
30actual
implied by UIPunconstrained
April 1987
contribution of interest rate shocks
1976 1978 1980 1982 1984 1986 1988 1990 1992 1994 1996 1998-30
-20
-10
0
10
20
30actual
implied by UIP
unconstrained
April 1987
37

38
Table 1
Decomposition of Nominal Exchange Rate Variance
United States
Percent of nominal exchange rate variance attributed to
Pre-1988 Post-1988
Horizon, Inflation Interest Own Inflation Interest Ownmonths shocks rate shocks shocks shocks rate shocks shocks
1 14 6 79 2 0 98
6 20 1 79 3 3 96
12 17 1 82 2 2 96
120 8 0 92 1 2 97
Japan
Percent of nominal exchange rate variance attributed to
Pre-1987 Post-1987
Horizon, Inflation Interest Own Inflation Interest Ownmonths shocks rate shocks shocks shocks rate shocks shocks
1 18 16 66 0 4 96
6 14 12 74 5 4 91
12 9 6 85 3 10 88
120 4 3 93 0 2 98
Notes: variance decompositions are calculated from the trivariate vector autoregression described in thetext, unconstrained by the UIP condition.

39
Table 2
Estimated Monetary Policy Reaction Functions
United States
Pre-1988 Post-1988 Change Standard error
Specification r Inflation IP Inflation IP Inflation IP Pre-88 Post-88t–1
Backward 0.94 0.03 3.95 0.07 2.34 0.04 –1.61 0.94 0.18
(0.02) (0.03) (1.56) (0.07) (1.57) (0.06) (2.35)
Forward 0.95 0.08 0.45 0.08 2.29 0.01 1.84 0.96 0.18
(0.02) (0.02) (1.55) (0.05) (0.95) (0.12) (1.06)
Japan
Pre-1987 Post-1987 Change Standard error
Specification r Inflation IP Inflation IP Inflation IP Pre-87 Post-87t–1
Backward 0.96 –0.03 5.84 0.08 0.35 0.11 –5.49 0.50 0.17
(0.01) (0.01) (1.08) (0.04) (0.86) (0.04) (1.36)
Forward 0.93 –0.02 5.50 0.20 –1.35 0.22 –6.85 0.47 0.19
(0.03) (0.01) (2.83) (0.10) (1.02) (0.10) (3.40)
Notes: Numbers in parentheses are standard errors corrected for 11th-order serial correlation. The break date for the U.S. is July 1988, and forJapan it is April 1987. Data are monthly. The dependent variable for Japan is the 3-month Gensaki rate, for Germany it is the overnight callmoney rate. IP is detrended log industrial production; for Japan, the trend is allowed to change in January 1990. The inflation regressor in the“backward” specification is the lagged twelve-month inflation rate; in the “forward” specification, which is estimated via 2SLS, the regressor isthe inflation rate over the coming twelve months. The instruments for the 2SLS regression consist of lagged inflation, IP, and the interest rate,and the same variables interacted with the post-breakpoint dummy.

WORKING PAPERS
No. 94-1. Jeffrey A. Frankel with Shang-Jin Wei and Ernesto Stein, “APEC andRegional Trading Arrangements in the Pacific”
No. 94-2. Edward M. Graham, “Towards an Asia Pacific Investment Code”No. 94-3. Paul Wonnacott, “Merchandise Trade in the APEC Region: Is There Scope for
Liberalization on an MFN Basis?”No. 94-4. Paul Wonnacott, “The Automotive Industry in Southeast Asia: Can Protection
Be Made Less Costly?”No. 94-5. Marcus Noland, “Implications of Asian Economic Growth”No. 95-1. C. Fred Bergsten, “APEC: The Bogor Declaration and the Path Ahead”No. 95-2. Jeffrey J. Schott, “From Bogor to Miami . . . and Beyond: Regionalism in the
Asia Pacific and the Western Hemisphere”No. 95-3. Marcus Noland, “Has Asian Export Performance Been Unique?”No. 95-4. Gautam Jaggi, “Association of Southeast Asian Nations (ASEAN) and ASEAN Free Trade Area (AFTA): Chronology and Statistics”No. 95-5. Marcus Noland, “The North Korean Economy”No. 95-6. Marcus Noland, “China and the International Economic System”No. 96-1. C. Fred Bergsten, “APEC after Osaka: Toward Free Trade by 2010/2020”No. 96-2. Marcus Noland, “Public Policy, Private Preferences, and the Japanese
Trade Pattern”No. 96-3. Marcus Noland, “German Lessons for Korea: The Economics of Unification”No. 96-4. Marcus Noland, “Research and Development Activities and Trade
Specialization in Japan”No. 96-5. Gautam Jaggi, Mary Rundle, Daniel Rosen, and Yuichi Takahashi, “China’s
Economic Reforms: Chronology and Statistics”No. 96-6. Marcus Noland, “US-China Economic Relations”No. 96-7. Raymond Atje and Gary Hufbauer, “The Market Structure Benefits of Trade
and Investment Liberalization”No. 96-8. Marcus Noland, “The Future of US-Korea Economic Relations”No. 96-9. Edward M. Graham, “Competition Policies in the Dynamic Industrializing
Economies: The Case of China, Korea, and Chinese Taipei”No. 96-10. Marcus Noland, Sherman Robinson, and Monica Scatasta, “Modeling
Economic Reform in North Korea”No. 96-11. Marcus Noland, “Trade, Investment, and Economic Conflict between the US
and Asia”No. 96-12. C. Fred Bergsten, “APEC in 1996 and Beyond: The Subic Summit”No. 96-13. Marcus Noland, “Some Unpleasant Arithmetic Concerning Unification”No. 96-14. Marcus Noland, “Restructuring Korea’s Financial Sector for Greater
Competitiveness”No. 96-15. C. Fred Bergsten, “Competitive Liberalization and Global Free Trade: A
Vision for the 21st Century”No. 97-1. Marcus Noland, “Chasing Phantoms: The Political Economy of USTR”No. 97-2. Jacqueline McFadyen, “U.S.-Japan Civil Aviation: Prospects for Progress”No. 97-3. C. Fred Bergsten, “Open Regionalism”No. 97-4. Adam S. Posen, “Lessons from the Bundesbank on the Occasion of Its 40th
(and Second to Last?) Birthday”No. 97-5. Marcus Noland, Sherman Robinson, and Li-Gang Liu, “The Economics of
Korean Unification”No. 98-1. Marcus Noland, Sherman Robinson, and Li-Gang Liu, “The Costs and
Benefits of Korean Unification”No. 98-2. Li-Gang Liu, Marcus Noland, Sherman Robinson, and Zhi Wang, “Asian
Competitive Devaluations”No. 98-3. C. Fred Bergsten, “Fifty Years of the GATT/WTO: Lessons from the Past for
Strategies for the Future”No. 98-4. Jacqueline McFadyen, “NAFTA Supplemental Agreements: Four Year
Review”
No. 98-5. Hiroko Ishii and Erika Wada, “Local Government Spending: Solving theMystery of Japanese Fiscal Packages”
No. 98-6. Marcus Noland, Sherman Robinson, and Zhi Wang, “The Global EconomicEffects of the Japanese Crisis”
No. 99-1. Marcus Noland, Sherman Robinson, and Tao Wang, “Rigorous Speculation:The Collapse and Revival of the North Korean Economy”
No. 99-2. Marcus Noland, Sherman Robinson, and Tao Wang, “Famine in North Korea:Causes and Cures”
No. 99-3. Marcus Noland, “Competition Policy and FDI: A Solution in Search of aProblem?”
No. 99-4. Marcus Noland, Sherman Robinson, and Zhi Wang, “The Continuing AsianFinancial Crisis: Global Adjustment and Trade”
No. 99-5. Adam S. Posen, “Why EMU Is Irrelevant for the German Economy”No. 99-6. C. Fred Bergsten, “The Global Trading System and the Developing
Countries in 2000”No. 99-7. Marcus Noland, Sherman Robinson, and Tao Wang, “Modeling Korean
Unification”No. 99-8. Marcus Miller and Lei Zhang, “Sovereign Liquidity Crisis: The Strategic Case
for a Payments Standstill”No. 99-9. C. Fred Bergsten, Olivier Davanne, and Pierre Jacquet, “The Case for Joint
Management of Exchange Rate Flexibility”No. 99-10. Kenneth N. Kuttner and Adam S. Posen, “Does Talk Matter After All?
Inflation Targeting and Central Bank Behavior”No. 99-11. Gary Clyde Hufbauer and Erika Wada, “Hazards and Precautions: Tales of
International Finance”No. 99-12. Gary Clyde Hufbauer and Tony Warren, “The Globalization of Services: What
Has Happened? What Are the Implications?”No. 00-1. Keith Maskus, “Regulatory Standards in the WTO: Comparing Intellectual
Property Rights with Competition Policy, Environmental Protection,and Core Labor Standards”
No. 00-2. Richard M. Goodman and John M. Frost, “International Economic Agreementsand the Constitution”
No. 00-3. Catherine L. Mann, “Electronic Commerce in Developing Countries: Issuesfor Domestic Policy and WTO Negotiations”
No. 00-4. C. Fred Bergsten, “The New Asian Challenge”No. 00-5. Marcus Noland, “How the Sick Man Avoided Pneumonia: The Philippines in
the Asian Financial Crisis”No. 00-6. Kenneth N. Kuttner and Adam S. Posen, “Inflation, Monetary Transparency,
and G3 Exchange Rate Volatility”No. 00-7. Catherine L. Mann, “Transatlantic Issues in Electronic Commerce”No. 00-8. Morris Goldstein, “ Strengthening the International Financial Architecture:
Where Do We Stand?”
Working Papers are only available directly from the Institute (not from our international distributor orbookstores). Most appear in full form on our Web site at http://www.iie.com/catalog/wp/apecwp.htm.If you require a paper that is not available on the Web site, please contact us.
Working Papers Institute for International EconomicsTel: (202) 328-9000 11 Dupont Circle, NW, Suite 620Fax: (202) 328-5432 Washington, DC 20036-1207http://www.iie.com