Embed Size (px)
Citation preview
Nuffield International Contemporary Scholars Conference New Zealand - March 2011
Brazilian Agriculture DevelopmentIn a Global Perspective
Milton SuzukiBayer CropScience
Development and Field Trial - Latin America
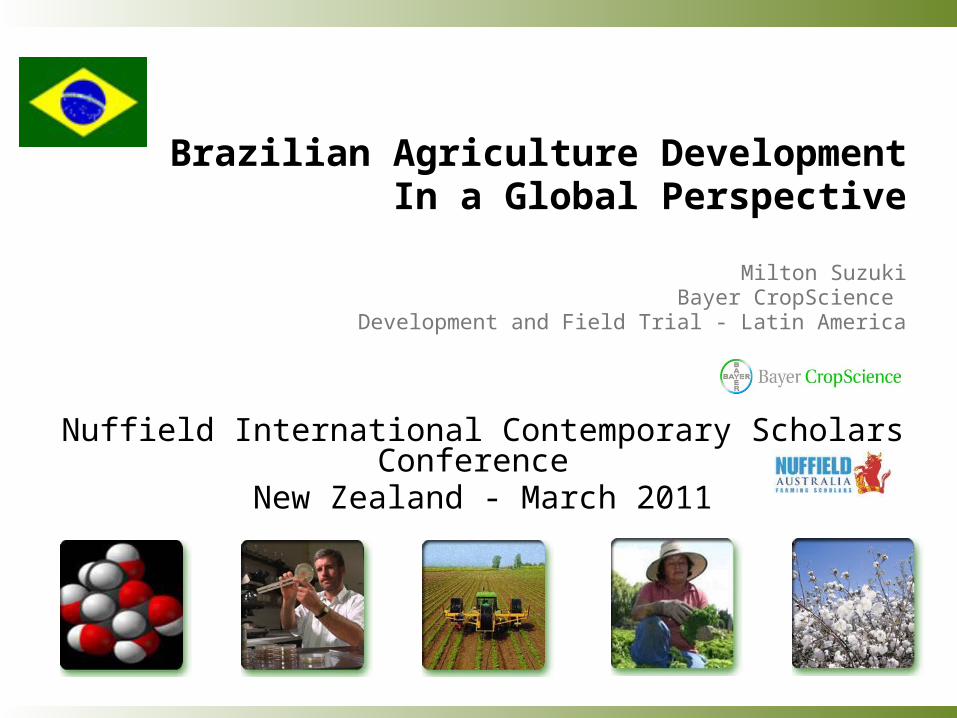
Latin America Agriculture Potential1.
2.
3.
4.
Brazilian Agriculture Overview
Opportunities
Challenges
Content
Latin America: Agricultural Potential
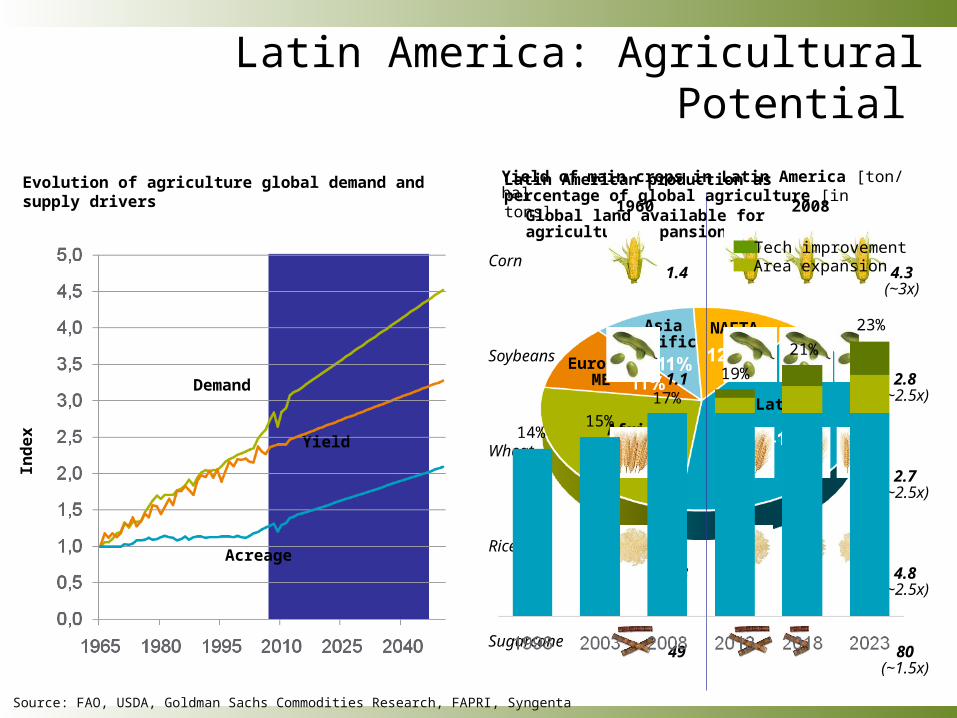
Evolution of agriculture global demand and supply drivers
Global land available for agriculture expansion
LatAm
Europe/ ME
Asia PacificNAFTA
Africa
Ind
ex
Demand
Yield of main crops in Latin America [ton/ ha]
Corn
Soybeans
1960
1.4
1.1
Wheat
1.1
Rice
1.8
Sugarcane49
2008
4.3(~3x)
2.8(~2.5x)
2.7(~2.5x)
4.8(~2.5x)
80(~1.5x)
Yield
Acreage
Source: FAO, USDA, Goldman Sachs Commodities Research, FAPRI, Syngenta
Latin American production as percentage of global agriculture [in tons]
14%15%
17%
19%
21%
23%
Tech improvementArea expansion
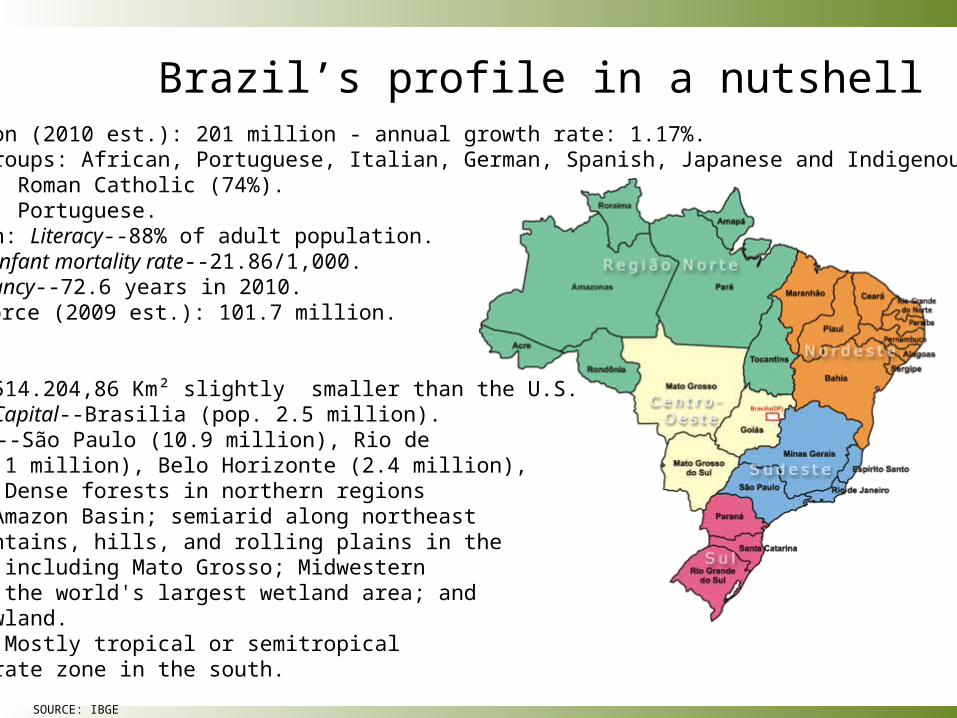
People Population (2010 est.): 201 million - annual growth rate: 1.17%. Ethnic groups: African, Portuguese, Italian, German, Spanish, Japanese and Indigenous peoples, Religion: Roman Catholic (74%). Language: Portuguese. Education: Literacy--88% of adult population. Health: Infant mortality rate--21.86/1,000. Life expectancy--72.6 years in 2010.
Work force (2009 est.): 101.7 million.
Geography Area: 8.514.204,86 Km² slightly smaller than the U.S. Cities: Capital--Brasilia (pop. 2.5 million). Other cities--São Paulo (10.9 million), Rio de Janeiro (6.1 million), Belo Horizonte (2.4 million), Terrain: Dense forests in northern regions including Amazon Basin; semiarid along northeast coast; mountains, hills, and rolling plains in the southwest, including Mato Grosso; Midwestern savannahs; the world's largest wetland area; and coastal lowland. Climate: Mostly tropical or semitropical with temperate zone in the south.
Brazil’s profile in a nutshell
SOURCE: IBGE
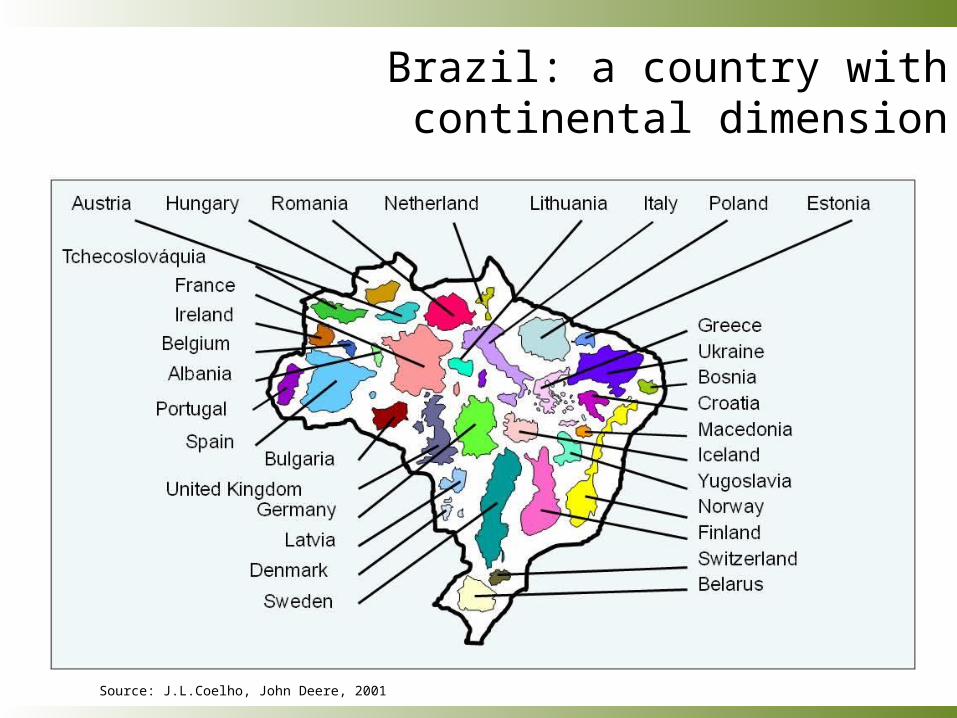
Brazil: a country with continental dimension
Source: J.L.Coelho, John Deere, 2001
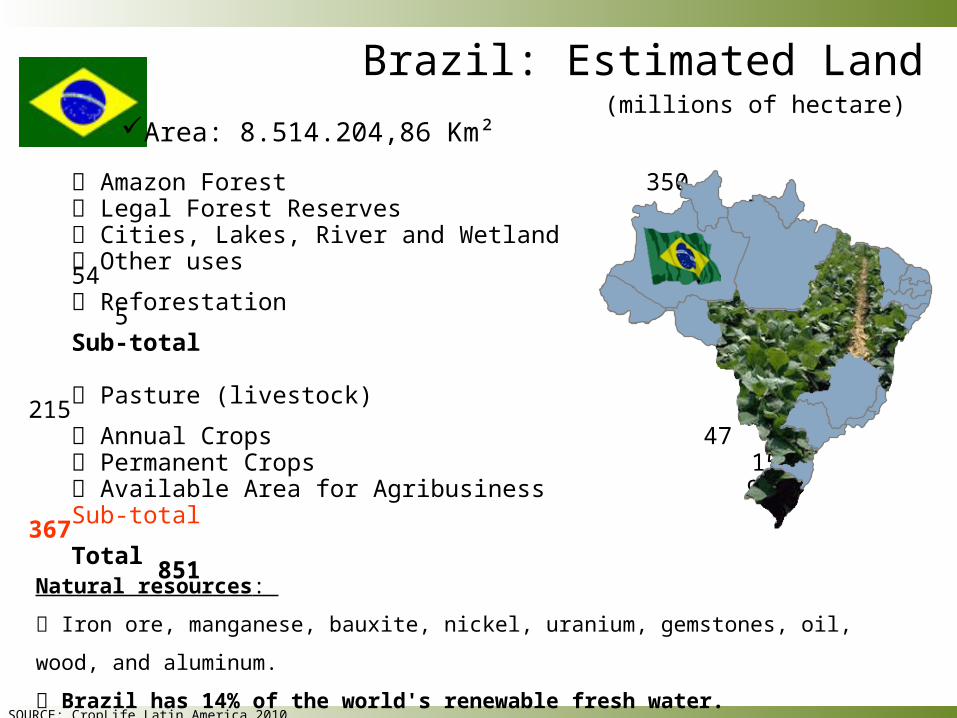
Amazon Forest 350 Legal Forest Reserves 55 Cities, Lakes, River and Wetland 20 Other uses 54 Reforestation 5 Sub-total 484
Pasture (livestock) 215 Annual Crops 47 Permanent Crops 15 Available Area for Agribusiness 90 Sub-total 367 Total 851
Brazil: Estimated Land(millions of hectare)
SOURCE: CropLife Latin America 2010
Area: 8.514.204,86 Km²
Natural resources:
Iron ore, manganese, bauxite, nickel, uranium, gemstones, oil, wood, and aluminum.
Brazil has 14% of the world's renewable fresh water.
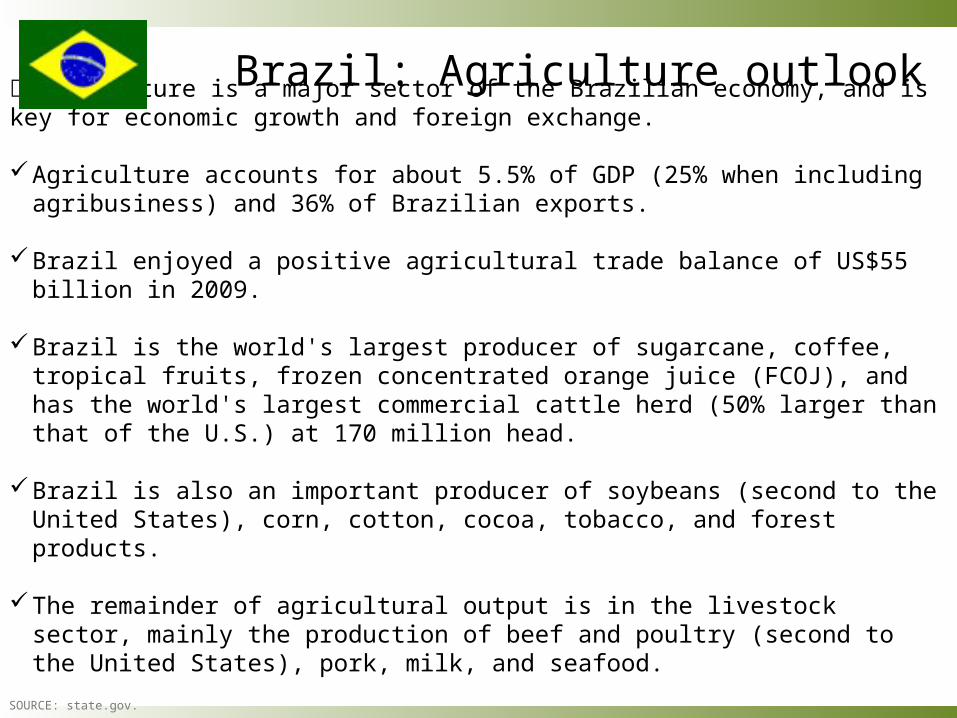
Agriculture is a major sector of the Brazilian economy, and is key for economic growth and foreign exchange.
Agriculture accounts for about 5.5% of GDP (25% when including agribusiness) and 36% of Brazilian exports.
Brazil enjoyed a positive agricultural trade balance of US$55 billion in 2009.
Brazil is the world's largest producer of sugarcane, coffee, tropical fruits, frozen concentrated orange juice (FCOJ), and has the world's largest commercial cattle herd (50% larger than that of the U.S.) at 170 million head.
Brazil is also an important producer of soybeans (second to the United States), corn, cotton, cocoa, tobacco, and forest products.
The remainder of agricultural output is in the livestock sector, mainly the production of beef and poultry (second to the United States), pork, milk, and seafood.
Brazil: Agriculture outlook
SOURCE: state.gov.
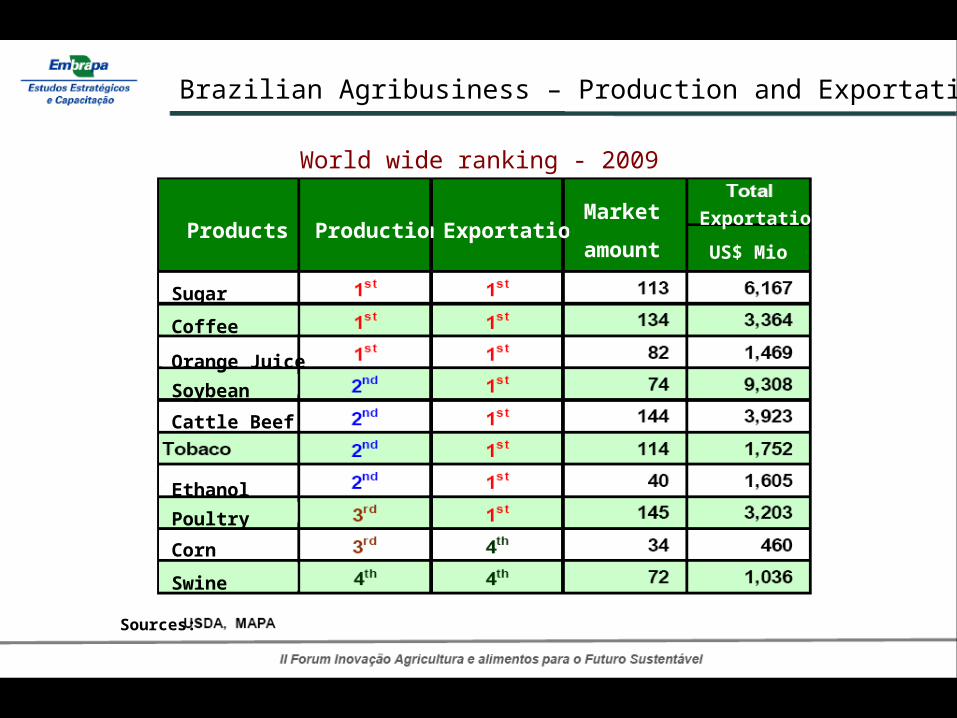
Brazilian Agribusiness – Production and Exportation
Products
Sources:
Production ExportationMarket
amount
Exportation
US$ Mio
World wide ranking - 2009
Sugar
Coffee
Soybean
Poultry
Swine
Orange Juice
Cattle Beef
Ethanol
Corn
Brazil: The Opportunity, Still a Challenge
?
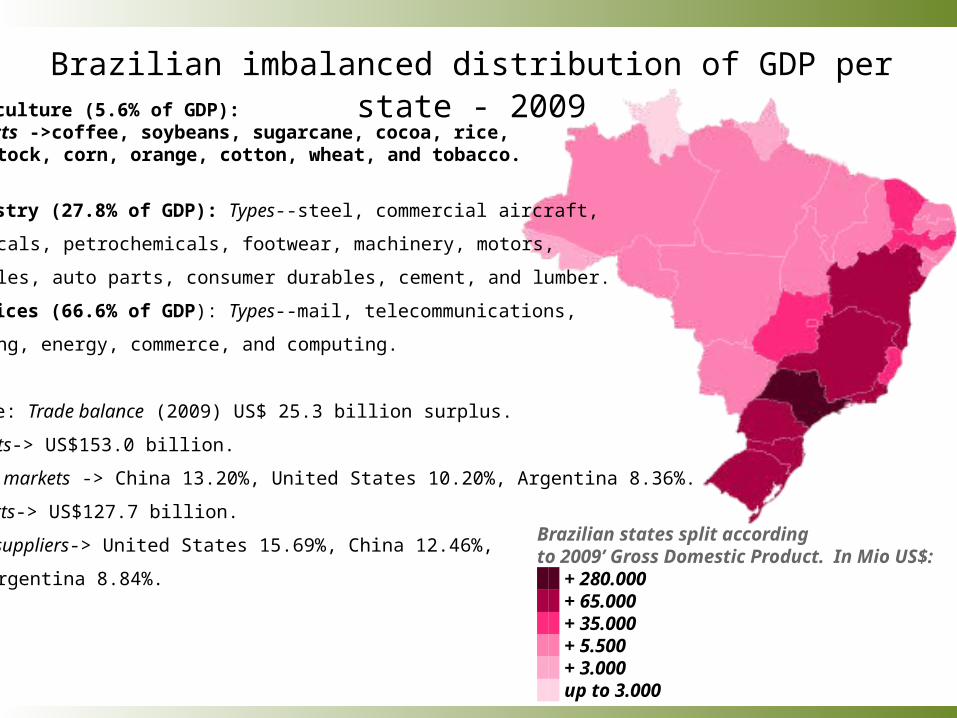
Brazilian states split according to 2009’ Gross Domestic Product. In Mio US$: ██ + 280.000██ + 65.000██ + 35.000██ + 5.500██ + 3.000██ up to 3.000
Brazilian imbalanced distribution of GDP per state - 2009Agriculture (5.6% of GDP): Products ->coffee, soybeans, sugarcane, cocoa, rice, livestock, corn, orange, cotton, wheat, and tobacco.
Industry (27.8% of GDP): Types--steel, commercial aircraft,
chemicals, petrochemicals, footwear, machinery, motors,
vehicles, auto parts, consumer durables, cement, and lumber.
Services (66.6% of GDP): Types--mail, telecommunications,
banking, energy, commerce, and computing.
Trade: Trade balance (2009) US$ 25.3 billion surplus.
Exports-> US$153.0 billion.
Major markets -> China 13.20%, United States 10.20%, Argentina 8.36%.
Imports-> US$127.7 billion.
Major suppliers-> United States 15.69%, China 12.46%,
and Argentina 8.84%.
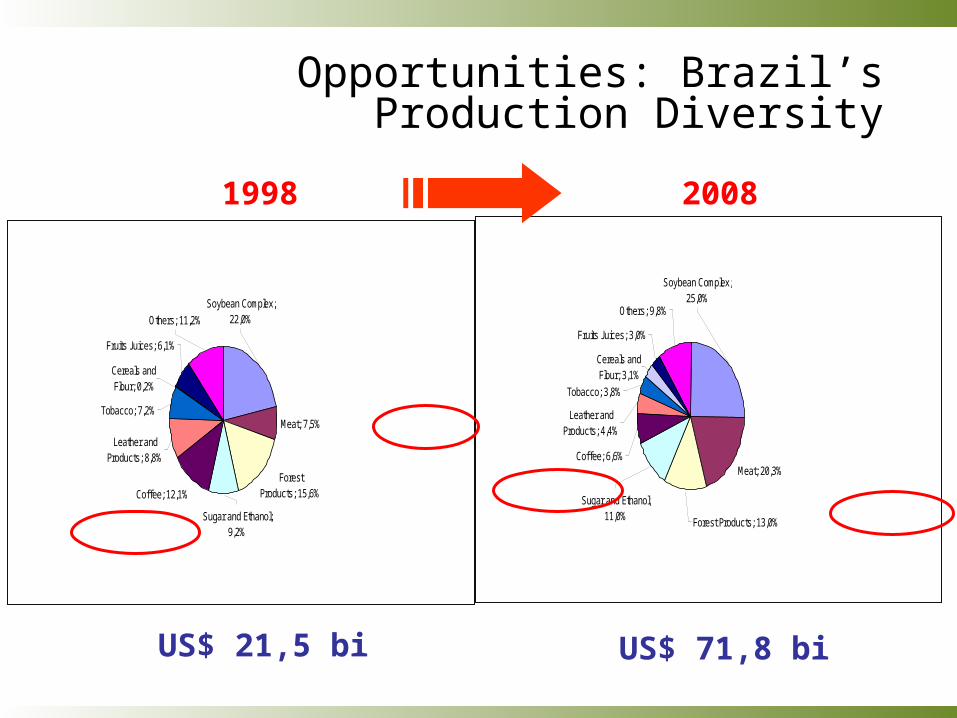
Opportunities: Brazil’s Production Diversity
1998 2008
US$ 21,5 bi US$ 71,8 bi
Meat; 7,5%
Coffee; 12,1%
Sugar and Ethanol; 9,2%
Forest Products; 15,6%
Tobacco; 7,2%
Others; 11,2%
Fruits Juices; 6,1%
Cereals and Flour; 0,2%
Leather and Products; 8,8%
Soybean Complex; 22,0%
Meat; 20,3%
Fruits Juices; 3,0%
Others; 9,8%
Cereals and Flour; 3,1%
Tobacco; 3,8%
Leather andProducts; 4,4%
Coffee; 6,6%
Sugar and Ethanol; 11,0% Forest Products; 13,0%
Soybean Complex; 25,0%
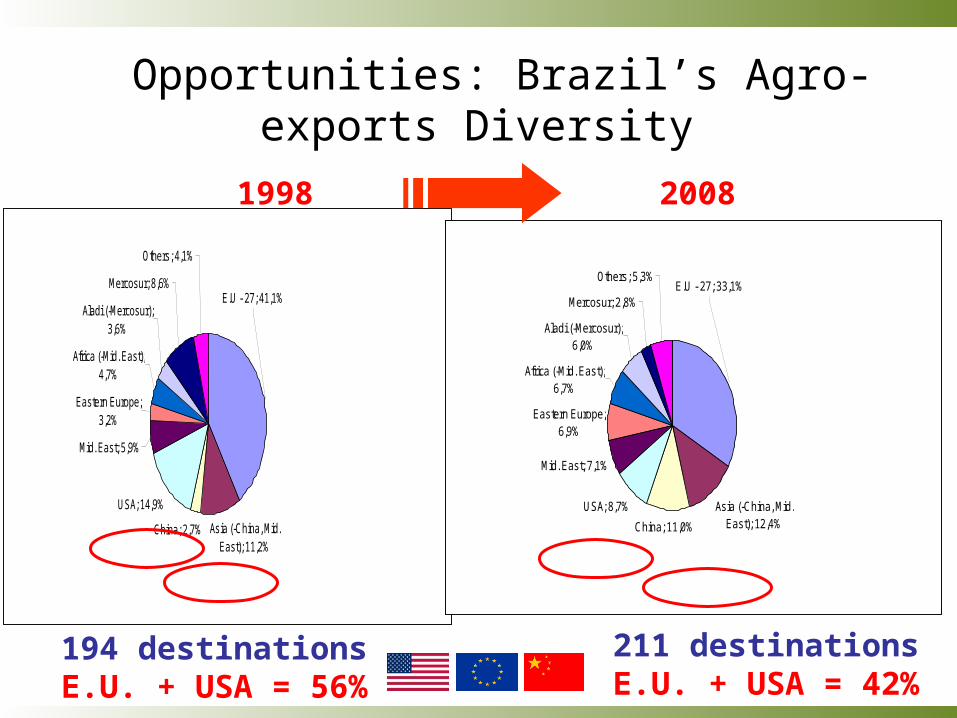
Opportunities: Brazil’s Agro-exports Diversity
Asia (-China, Mid. East); 11,2%
China; 2,7%
USA; 14,9%
Mid. East; 5,9%
Eastern Europe; 3,2%
Africa (-Mid. East); 4,7%
Aladi (-Mercosur); 3,6%
Mercosur; 8,6%
Others; 4,1%
E.U - 27; 41,1%
Asia (-China, Mid. East); 12,4%China; 11,0%
USA; 8,7%
Mid. East; 7,1%
Eastern Europe; 6,9%
Africa (-Mid. East); 6,7%
Aladi (-Mercosur); 6,0%
Mercosur; 2,8%
Others; 5,3%E.U - 27; 33,1%
1998 2008
194 destinationsE.U. + USA = 56%
211 destinationsE.U. + USA = 42%
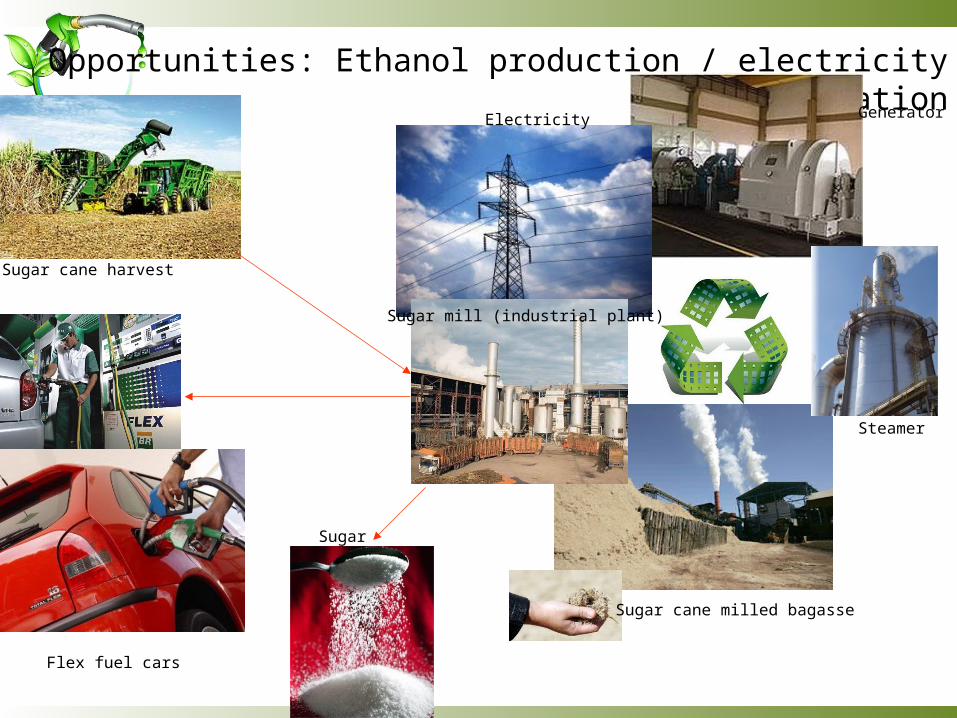
Opportunities: Ethanol production / electricity co-generation
Flex fuel cars
Sugar cane milled bagasse
Steamer
GeneratorElectricity
Sugar
Sugar cane harvest
Sugar mill (industrial plant)
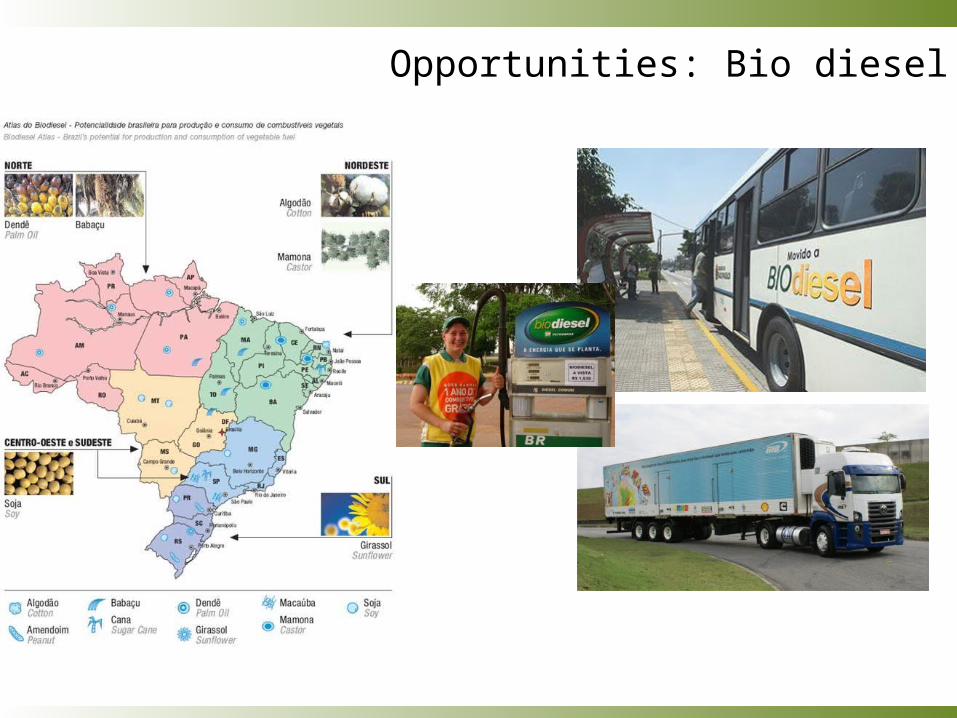
Opportunities: Bio diesel
SOURCE: CropLife Latin America 2010
Issues and bottle necks
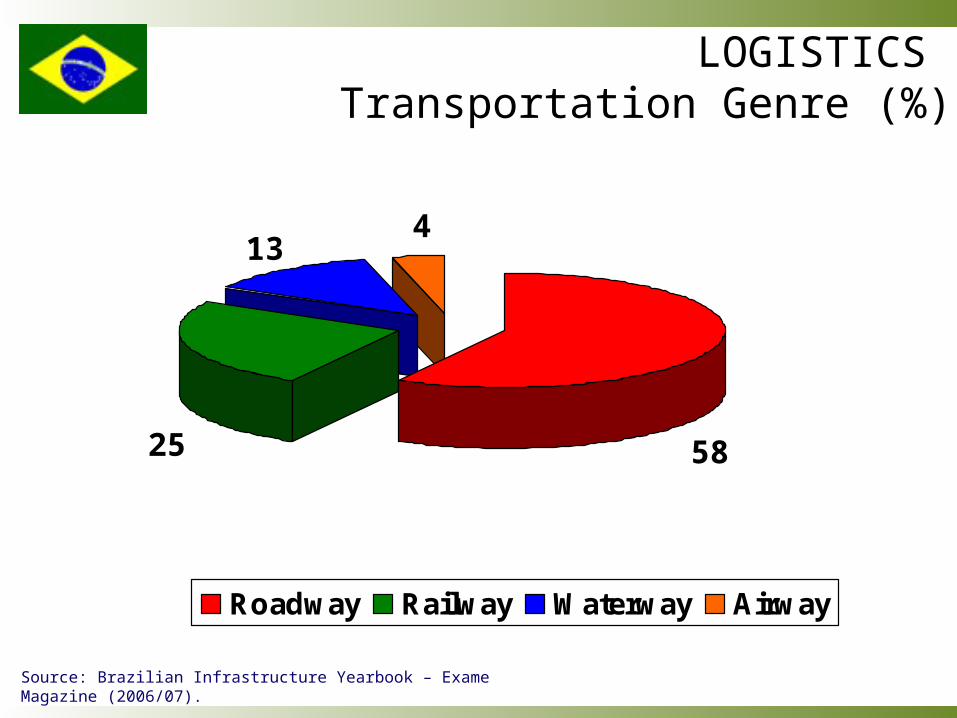
Source: Brazilian Infrastructure Yearbook – Exame Magazine (2006/07).
LOGISTICS Transportation Genre (%)
Roadway Railway Waterway Airway
58
4
25
13
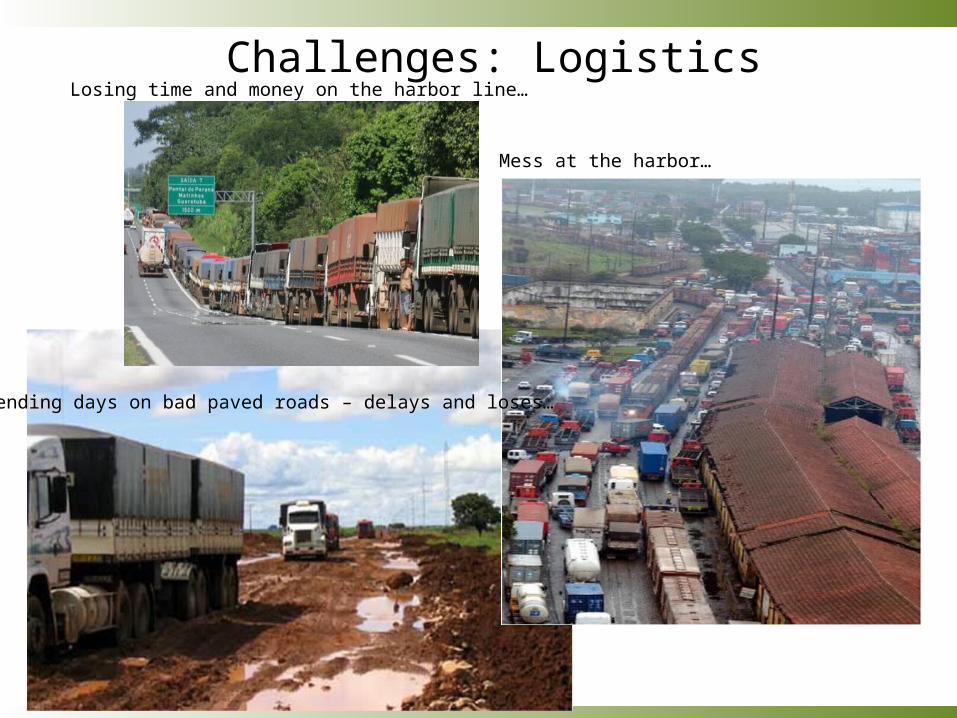
Challenges: Logistics Losing time and money on the harbor line…
Mess at the harbor…
Spending days on bad paved roads – delays and loses…
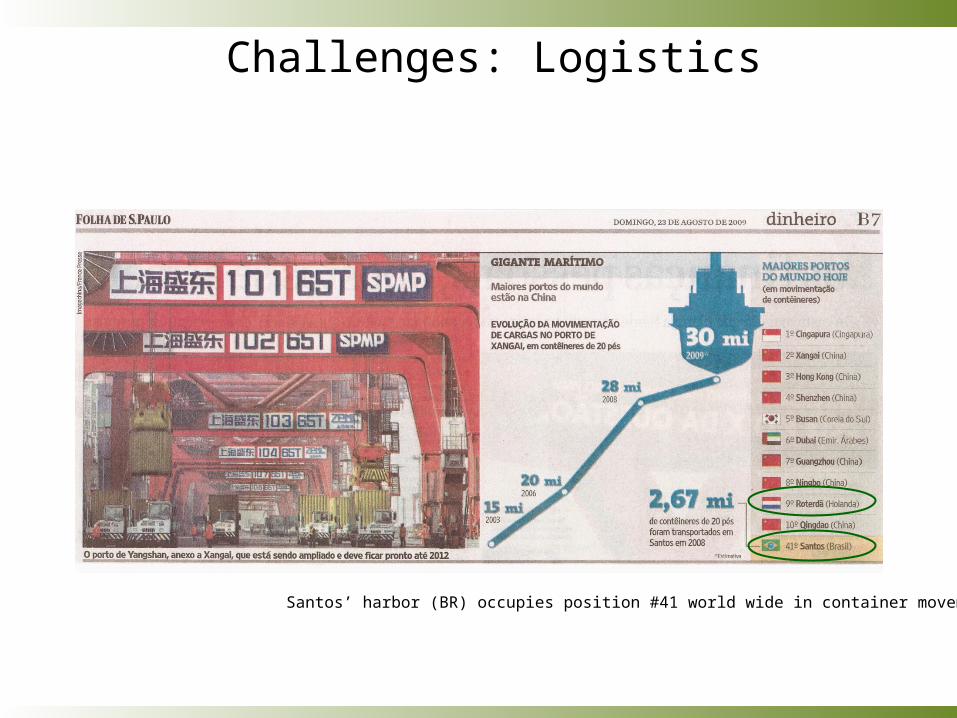
Challenges: Logistics
Santos’ harbor (BR) occupies position #41 world wide in container movement
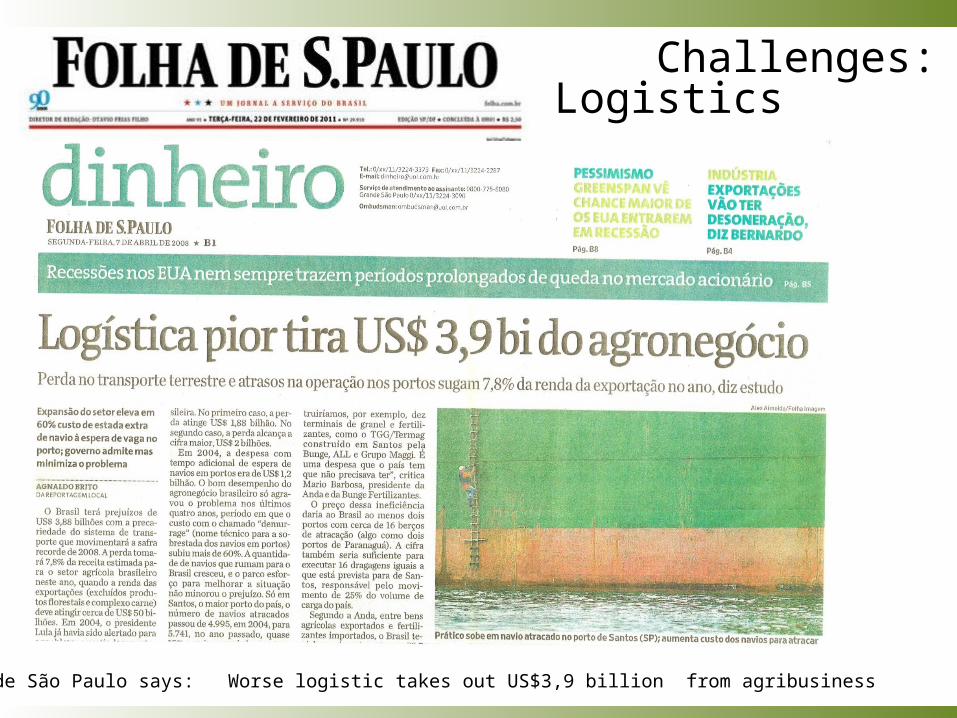
Challenges: Logistics
Folha de São Paulo says: Worse logistic takes out US$3,9 billion from agribusiness
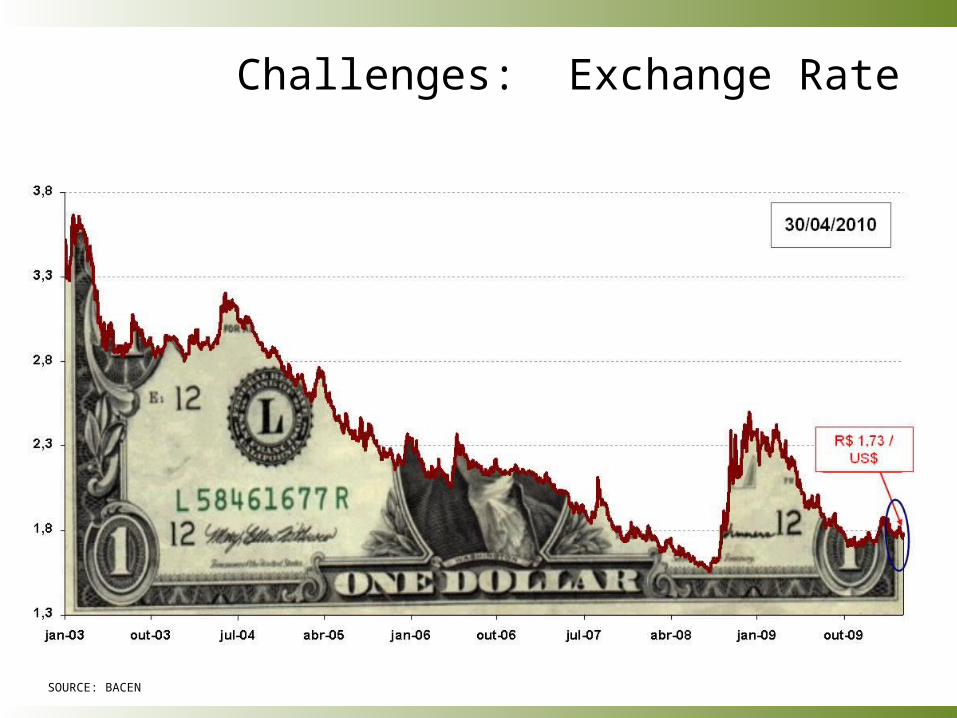
Challenges: Exchange Rate
SOURCE: BACEN
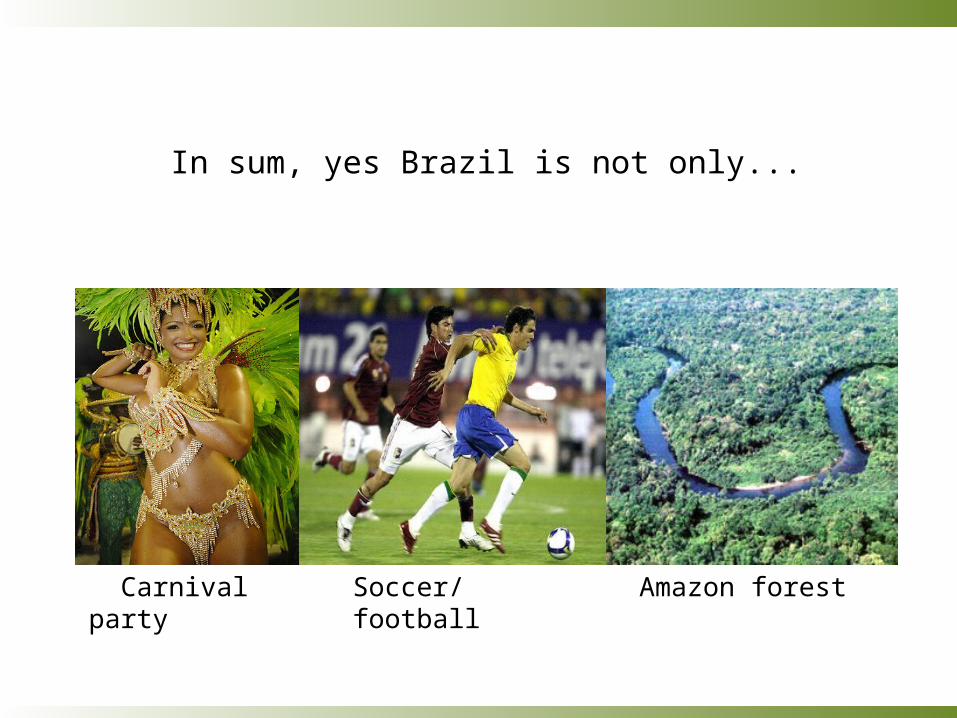
In sum, yes Brazil is not only...
Carnival party Soccer/football Amazon forest
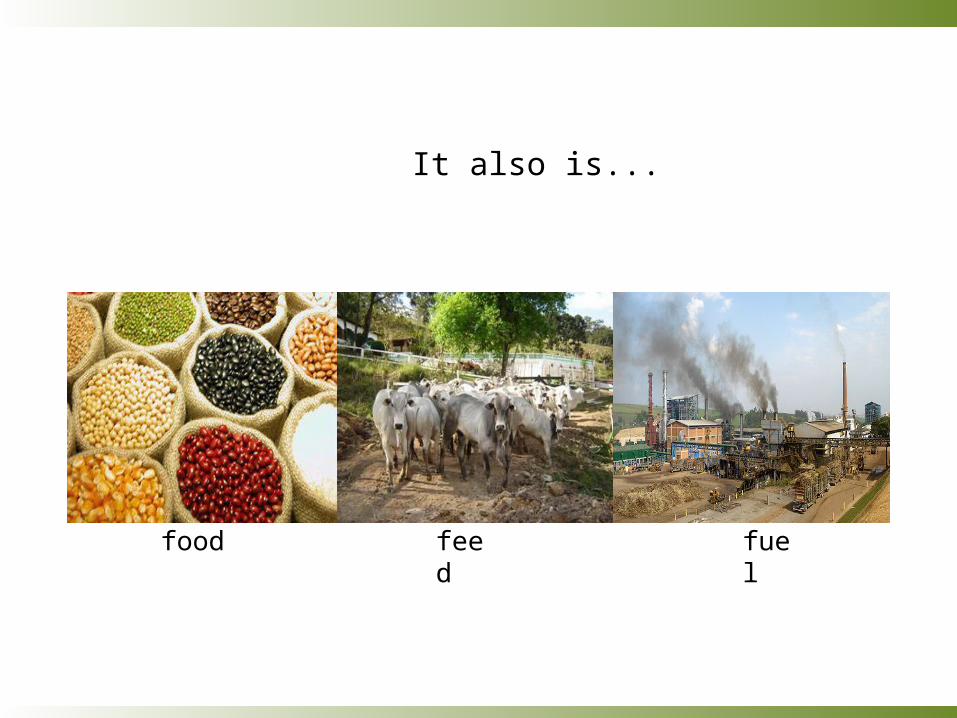
It also is...
food feed fuel
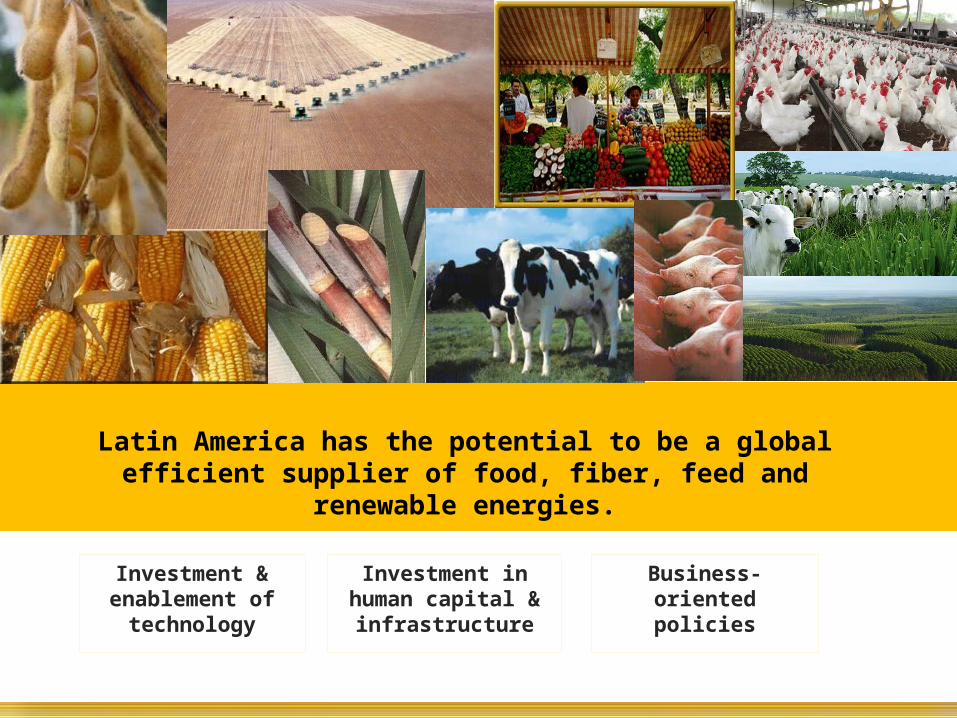
Latin America has the potential to be a global efficient supplier of food, fiber, feed and renewable energies.
Investment & enablement of
technology
Investment in human capital & infrastructure
Business-oriented policies