Embed Size (px)
Citation preview

Nucleation kinetics of the potassium chloride-water system with predictions of crystal-size
distributions in crystallizers of complex configuration
Item Type text; Thesis-Reproduction (electronic)
Authors Metchis, Steven Geoffrey, 1951-
Publisher The University of Arizona.
Rights Copyright © is held by the author. Digital access to this materialis made possible by the University Libraries, University of Arizona.Further transmission, reproduction or presentation (such aspublic display or performance) of protected items is prohibitedexcept with permission of the author.
Download date 05/06/2018 00:59:47
Link to Item http://hdl.handle.net/10150/554730
NUCLEATION KINETICS OF THE POTASSIUM CHLORIDE-WATER SYSTEM
WITH PREDICTIONS OF CRYSTAL-SIZE DISTRIBUTIONS
IN CRYSTALLIZERS OF COMPLEX CONFIGURATION
bySt even Geoffrey Metchis
A Thesis Submitted to the Faculty of the
DEPARTMENT. OF CHEMICAL ENGINEERING
In Partial Fulfillment of the Requirements For the Degree of
MASTER OF SCIENCE
In the Graduate College
THE UNIVERSITY OF ARIZONA
1 9 7 4

STATEMENT BY AUTHOR
This thesis has been submitted in partial fulfillment of requirements for an advanced degree at The Univ e r sity of Arizona and is deposited in the University Library to be m a d e .available to borrowers under rules of the L i brary o
Brief quotations from this thesis are allowable without special permission, provided that accurate acknowledgment of source is made. Requests for permission for e x tended quotation from or reproduction of this manuscript in whole or in part may be granted by the head of the major department or the Dean of the Graduate College when in his judgment the proposed use of the material is in the interests of scholarship. In all other i n s t a n c e s h o w e v e r , permission must be obtained from the author.
APPROVAL BY THESIS DIRECTOR
This thesis has been approved on the date shown below:
A.^D. Randolph Professor of
Chemical Engineering
DATE

For my parents and Roslyn
ill

ACKNOWLEDGMENT
The author wishes to express his gratitude to D r «
Alan Do Randolph for his guidance during this research pro
ject* The Department of Chemical Engineering is also ac
knowledged for providing facilities for the project* The
author is indebted to the. National Science. Foundation for
financial support of the project through Grant No. GK-16407 »
Special recognition goes to Roslyn Field whose u n
selfish efforts made the long hours in the laboratory more
bearable.
Finally, the author wishes to thank his parents
whose encouragement and understanding helped him to accom
plish this work *
iv
T A B L E .OF CONTENTS
Page
LIST OF ILLUSTRATIONS „ . . . . . . . . . . . . . „ . vi
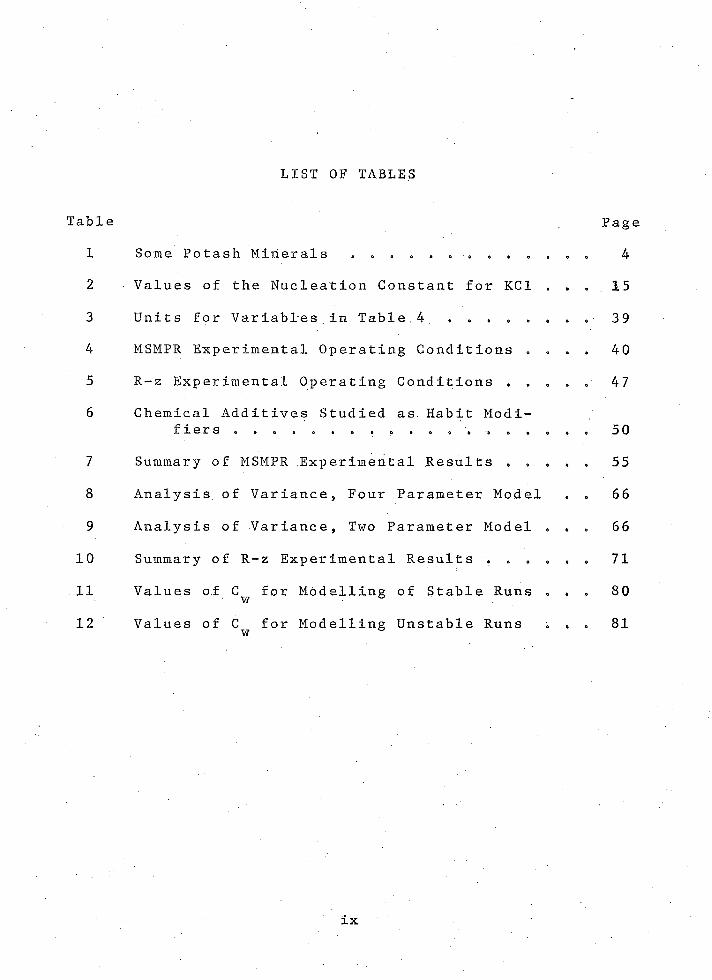
LIST OF TABLES ix
ABSTRACT „ . . . . . . . . . . . . . . . . . . . x
INTRODUCTION . . . . . . . . . . . . . . . . . . . . . 1Industrial Crystallization of Potash 8Previous Studies . . . . . . . 12
Crystal Growth and Nucleation Kinetics . . . . 13Computer Simulation of Crystal-Size D i s
tributions . , . . . » . . . . . ... . . . . 16
.THEORY . . . . . . . . . . . . . . . . . . . . . . . . 20
EQUIPMENT AND EXPERIMENTAL PROCEDURE . . . . . . . . . 28MSMPR Equipment and Procedure . . . . . . . . . . 28
MSMPR Equipment . . . . . . . . . . . . . . . 28MSMPR Procedure . ... . . . . . . . . . . . . 33
Classifying Crystallizer Equipment and P r o cedure . . . . . . . . . . . . . . . . . . . . 39Classifying Crystallizer Equipment . . . . . . 39Classifying Crystallizer Procedure . . . . . . 43
RESULTS . . . . . . . . . . . . . . . . . . . . . . . . 48Nucleation Kinetics . . . . . . . . . . . . . . . 48Stability Analysis . . . . . . . . . . . . . . . . 70Computer Simulation . . . . . . . . . . . . . . . 77
CONCLUSIONS AND RECOMMENDATIONS . . . . . . . . . . . 93
APPENDIX A: POPULATION DENSITY PLOTS . . . . . . . . 96
NOMENCLATURE . . . . . . . . . . . . . . . . . . . . . 106
REFERENCES . . . . . . . . . . . . . . . . . . . . . . 108
v
LIST OF ILLUSTRATIONS
Figure Page
1 World potash production 3
2 Crystal purity in presence of impurities . . . 9
3 Mutual solubility of KC1 and NaCl in water • . 10
4 Kalium Chemical solution mining process . , » 11
5 MSMPR crystallizer 31
. 6 MSMPR experimental equipment 34
7 Schematic of MSMPR equipment 35
8 Schematic of R-z equipment 44
9 Crystallizer-fines trap assembly 45
10 Crystals grown from saturated KC1 solution, Average size = 254 microns . . , 51
11 Crystals grown from saturated KC1 solu-: tion in presence of P b C l ^ » Average
size « 254 microns • . ■ • • • • O . . o « . 51
12 Crystals grown from saturated KC1 s olution in presence of NaCl and M g S O 4 »Average crystal size = 254 microns 0 » „ , 53
13 Variation in solids concentration withtime for run 061474 „ » , , 0. . . . . . 0 56
14 Population density vs crystal size, run021374 V , 0 0 0 0 0 0 , 0 0 0 0 , 0 0 0 0 58
15 Population density vs crystal size, run031274 , , 0 . 0 o o o , o o o o o o o o o o 59
16 Population density vs crystal size, run06 14 7 4 0 0 , 0 0 0 0 0 0 0 0 0 0 0 0 0 0 0 6 0
vi

vii
LIST OF ILLUSTRATIONS--Continued
Figure Page
17 Population density vs crystal size, run022674 . . . . . . . . . . . . . . . . 61
18 Nucleation rate as a. function of growthrate o • » • , « 0 » o • . . • . . . ... . . 63
19 Nucleation rate as a function of growthrate and solids concentration . „ » «, » . 67
2 0 r Comparison of theoretical and experimentalsolids concentration » e........... ......... .. 69
21 Effect of fines removal on CSD 0. Q’;: • 72
22 Effect of removal port on CSD . <> e 6 „ 73
23 Variation of solids concentration withtime. Results' of experimental cr y s tallization runs 3/10/74 and 3/28/74 . . . 75
24 Variation of solids concentration withtime. Results of experimental crystallization runs 4/22/74 and 4/30/74 . . . 76
25 Time-averaged3/10/74
population d ens ity p l o t , run
26 Time-averaged 3/28/74 ,
population density. p l o t , run. 83
27 Time-averaged 4/22/74 ,
population density p l o t , run
28 Time-averaged 4/30/74 ,
population density p l o t , run
29 Variation of solids concentration withtime. Results of computer simulationof runs 3/10/74 and 3/28/74 . . . . ' . »„ . 8 8
30 Variation of solids concentration withtime. Results of computer simulationof runs 4/22/74 and 4/30/74 . . . 89
viii
Figure
31
LIST OF ILLUSTRATIONS— Continued
Page
Variation of solids concentration withtime. Comparison of experimental and simulated r e s u l t s .for run 3/10/74 . , o.. 90
32 Variation of solids concentration withtime. Comparison of experimental and simulated results for run 4/22/74 . „ . . 91
LIST OF TABLES
Table Page
1 Some Potash Minerals . . . . . . . . . . . . . 4
2 Values of the Nucleation Constant for KC1 . . . . 15
3 Units for V a r i a b l e s ,in Table 4 . . . . . . . . 3 9
4 MSMPR Experimental Operating Conditions . . . . 40
5 R-z Experimental Operating Conditions . . . . . 47
6 Chemical Additives Studied as. Habit M o d i fiers . . . . . . . . . . . . . . . . . . . . 50
7 Summary of MSMPR Experimental Results . . . . . 55
8 Analysis of Variance, Four Parameter Model . . 6 6
9 Analysis of Variance, Two Parameter Model . . . 6 6
10 Summary of R-z Experimental Results . . . . . . 71
11 Values of C^ for Modelling of Stable Runs . . . 80
12 Values of C^ for Modelling Unstable Runs i . . 81
ix

ABSTRACT
An experimental study was conducted to determine
growth and nucleation kinetics for the crystallization of
potassium chloride from a realistic potash b r i n e . Four in
dependent variables were studied: residence time, agita
tion, crystallization temper a t u r e , and feed saturation
t e mperature• Bench scale mixed suspension.mixed product
removal crystallization techniques were used. It was found
that a simple power law model involving the growth rate and
suspension density was successful in correlating the n ucle
ation rate.
The nucleation kinetic model so determined was used
in the computer simulation of an operating crystallizer of
complex configuration. The purpose was to demonstrate that
this type of simulation can be a valuable design tool. The
steady-state crystal-size distributions for several experi
ments from this crystallizer were successfully modelled
using as input to the computer program the experimental
operating conditions. The dynamic behavior of the distri
butions were also successfully modelled. In each case the
x

stability of the distribution was accurately predicted.
In the case of an unstable distribution, the period and
magnitude of the oscillation were accurately r e p r o d u c e d ,

INTRODUCTION
Potassium is the third most important fertilizer
ingredient in terms of the actual tonnage used in the world
for plant nutrient purposes. The large abundance of potas
sium containing minerals located throughout the world in
sures that the use of potassium fertilizers will increase
in the coming y e a r s . Potassium does not appear naturally
in its elemental form but is found as various salt com
pounds. The word "potash" is used to indicate any of these
potassium salts. In the fertilizer industry potash refers
specifically to the oxide, Ka 0. The classification of
fertilizers by their K a 0 content has become a standard in
i n d u s t r y , but is an unfortunate one since this oxide does
not appear n a t u r a l l y . Nonetheless it allows for a simple
and direct comparison of fertilizers. The word "potash" is
derived from a historical manufacturing technique in which
ashes were leached and the resulting solution allowed to
evaporate in iron pots.
Potash has been known and used for over three
c e n t u r i e s . The Gauls and Germanic groups used potash as
1
■ 2a condiment instead of salt. Potash first became a com
mercial product in the middle of the nineteenth century
when it was found in a well brine in Germany in 1843.
Scientists soon established that it was a good plant food.
By 18 61 commercial production was well u n d e r w a y . Today b e
tween 9 0 and 95% of the potash produced in the world is
used for fertilizer purposes.
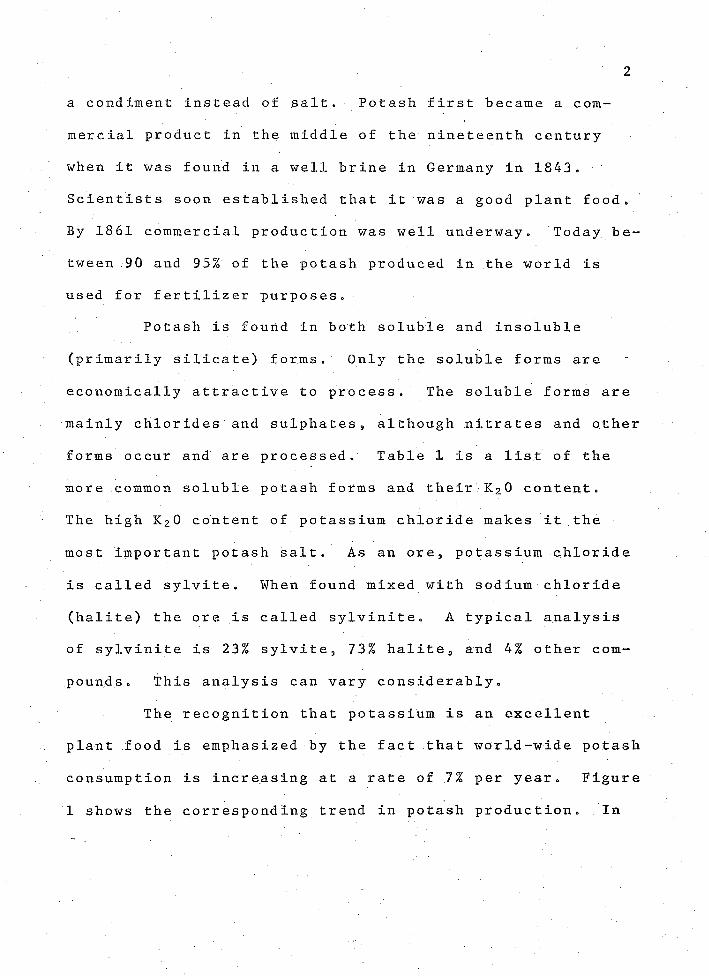
Potash is found in both soluble and insoluble
(primarily silicate) forms. Only the soluble forms are
economically attractive to process. The soluble forms are
mainly chlorides and sulphates 9 although nitrates and other
forms occur and are processed. Table 1 is a list of the
more common soluble potash forms and their K a 0 c o n t e n t .
The high Ka 0 content of potassium chloride makes it the
most important potash salt. As an ore, potassium chloride
is called sylvite. When found mixed with sodium chloride
(halite) the ore is called sylvinite. A typical analysis
of sylvinite is 23% s y l v i t e , 73% h a l i t e , and 4% other com
pounds. This analysis can vary considerably.
The recognition that potassium is an excellent
plant food is emphasized by the fact that world-wide potash
consumption is increasing at a rate of 7% per year. Figure
1 shows the corresponding trend in potash p r o d u c t i o n . In

1947 , production of potash was 3.3 million tons of K 2 0.
In 19 6 6 the output rose to 16.2 million tons of K 2 O, an
amazing five-fold increase in nineteen y e a r s .
It has been estimated that if the current trend is
continued, known reserves of potash are sufficient to last
for 1,750 years into the f u t u r e . This figure does not
take into account the discovery of any new ore reserves.
This insures that there will be a sufficient supply of this
very important plant nutrient in the years to c o m e .
ocv|XtotioHtio•H
•rHS
15
10
1950 1955 1960 1965
Figure 1. World potash production

4
Table 1. Some Potash Minerals
Mineral Compo s it ion %Ka 0
Chlorides
Sylvite KC1 63.1
Carnallite K C 1•M g C 1 2 *6 H 20 17.0
Kainite K C 1•M g S 0*•3 H 20 18.9
Hankite K C 1 • 9 N a 2 S0 4 •2N a 2 C 0 3 3.0
Sulphates
Polyhalite K 2SO 4 •M g S O 4 •2 C aS0 4 •2 H 20 15.5
Langbeinite K 2 S O 4 •2 MgS0 4 2 2.6
Leonite K 2 SO 4 •M g S O 4 •4 H 20 25.5
Schoenite K 2 SO 4 *MgS 0 4 •6 H 20 23.3
Krugite K 2SO 4 •MgSO 4 •4CaSO 4 •2H20 1 0 ?
Glasserite 3 K 2SO 4 . N a 2 SO 4 42.6
Syngenite K 2SO 4 •C a S O 4 •H 20 28.8
Apthitalite (K,N a ) 3 (NaSO 4 ) 3 4 2.5
Kalinite K 2SO 4 •A 1 2 (SO 4 ) 3 •24H20 9 .9Alunite : K 2 •A 1 e ( O H ) 1 2 . (SO 4 ) 4 11.4
Nitrates
Niter KNO 3 4 6.5

5
In the developmental years of potash production
crystallization techniques were first used for the pro
cessing of ores. Crystallization has the advantage of
yielding a product purity in excess of ninety-nine per
cent. It is also a costly p r o c e s s . Manufacturers soon
found that by using a flotation process potash could be
produced much more c h e a p l y . Product purity was lower,
about 9 6 %, but acceptable for marketing. For these
reasons flotation replaced crystallization as the method
for processing potash o r e s . With the development of solu
tion mining techniques crystallization is again becoming
an important method for processing p o t a s h . If the mineral
is solution mined the potash is already in solution when
processing begins and crystallization is the natural
choice. Crystallization studies of potash have not been
extensive and serious gaps exist in the knowledge of KC1
kinetics. It is the purpose of this work to fill some of
these gaps.
From studies of other systems, it has been found
that such factors as t e m p e r a t u r e , stirring rate, super-
saturation, and residence time in the crystallizer can
affect crystal growth rate and also the rate at which new
crystals are f o r m e d . It has also been found that these
factors may affect different systems in completely

opposite m a n n e r s • While similar correlations can be made
between nucleation.rate and the four factors' listed above,
there appear in these correlations constants which can
only be evaluated empirically for a given system. As yet
no means has been found for prediction of these constants
by theoretical considerations.
Certain modifications to the simple mixed-
suspension mixed-product removal (MSMPR) crystallizer can
be made in order to improve commercial productivity.
These include equipment for removal of small crystals at
a rapid rate, increased removal of large crystals , and
removal of clear liquor from the c r y s t a l l i z e r . These
techniques tend to increase production by limiting the
number of small crystals, removing only product size
crystals, and increasing the suspension density in the
crystallizer. Unfortunately these same techniques tend
to destabilize the system, causing cycling of the crystal-
size distribution (CSD) as evidenced by changes in the
solids concentration.
The objectives of this study were twofold. The
first objective was to evaluate the correlation constants
in a nucleation kinetics model for a potash salt. This
model has been found to be effective in describing other
systems. Potassium chloride was chosen for study since
it is the most important soluble potash form. The kinetic

study was to be accomplished using bench scale MSMPR tech
niques developed by Randolph and Larson (1971). Secondly,
the kinetic model was to be used in a computer simulation
to match the results of experiments conducted with the same
potash salt but in a crystallizer of more complicated d e
sign than the MSMPR crystallizer. The computer program
used was the Mark 111 CSD Simulator developed by Nuttall
(1971)o The purpose was to find the limiting values for
the various removal rates and sizes before destabilization
of the CSD occurred. The system modelled was a classified
product crystallizer with fines removal designed and built '
by E . P. K . Ottens at The University of A r i z o n a , This type
of crystallizer is known as an R-z crystallizer because
small crystals are removed at a rate R times the MSMPR r e
moval rate and product crystals are removed at z times the
MSMPR rate. Ottens also conducted the R-z experiments and
his results are reported later in this w o r k . This study
is unique in that it is the first time these three areas of
research--MS^tPR k i n e t i c s , computer simulation, and sta- .
bility analysis--have been brought together to form a sin
gle, comprehensive study.

8
Industrial Crystallization of Potash
An important technique for refining potash ores is
crystallization. At one time this was the most important
method for potash refining, but was poorly understood, until
recently. As a result, in the past two decades flotation
has become the most important method. This trend could be
reversed with recent advances in the science of crystal
lization ,
Crystallization has the advantage of being able to
produce a purer and whiter product than flotation, since
iron and other impurities are excluded from the crystal
lattice. Figure 2 shows that a product purity in excess
of 9 9% can be obtained from a solution containing signifi
cant quantities of sodium c h l o r i d e , More control of pr o d
uct size is also possible through crystallization. The
disadvantages are the higher capital and maintenance costs
arising from the handling of hot corrosive brines, and
larger fuel and cooling r e q u i r e m e n t s ,
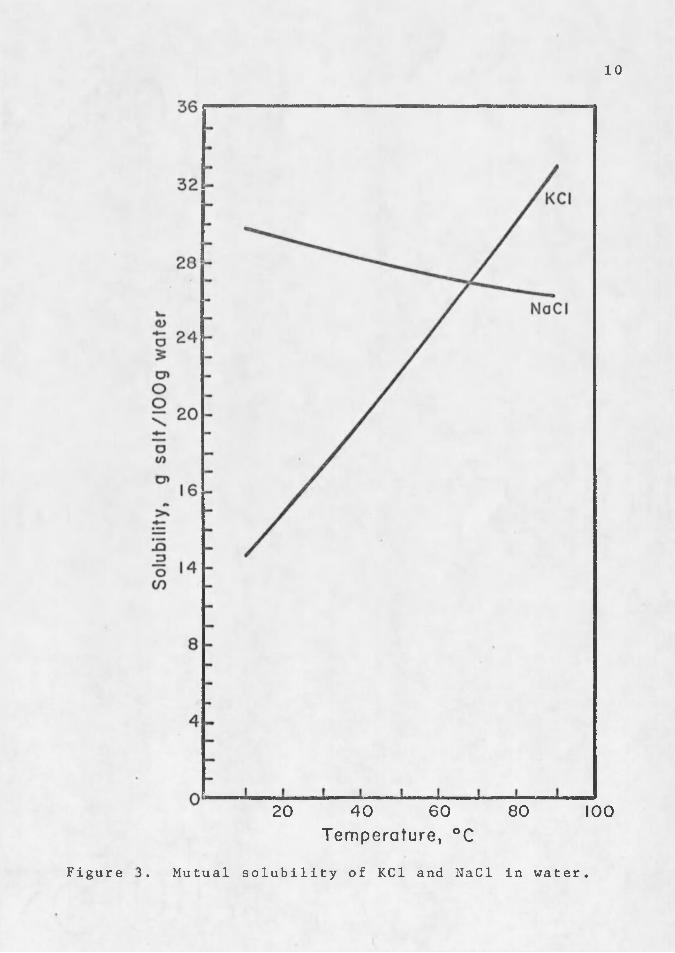
The basis for the separation of KC1 from NaCl by
c:r y syt a 1 l̂ i z a til on is the unique solubility characteristics
for the system, shown in Figure 3, The solubility of KC1
increases rapidly with increasing temperature. The solu
bility of NaCl increases only slightly with temperature
but in a common solution with K C 1 , the NaCl solubility

actually drops as temperature rises. Since the tempera
ture in the crystallizer is kept lower than the tempera
ture of the feed solution, the KC1 will precipitate out
of solution, but the NaCl will n o t .
100.0
mto 99.8■Uto>•»nCJti•H 99.6O
99.410 20 30
g N a C l /100 g H 20
Figure 2. Crystal purity in presence of impurities (Noyes, 1966).
If the ore has been mined by a conventional shaft
method, it is crushed and brought into contact with hot
brine at 95° - 106 ° C which has been saturated with NaCl but
which is unsaturated with K C 1 . The KC1 is then leached
from the ore by the brine, leaving behind the NaCl in the
ore. The brine is then clarified in a settling tank and
cooled in vacuum c r y s t a l l i z e r s . As the brine cools, the
Figure
10
20 40 60 80Tem pera tu re , °C
100
3. Mutual solubility of KC1 and NaCl in water.
Figure
Quadruple-Effect Evaporators
s =0======s=0===s 0 :CondenserSteam
FeedThickener
(NaCl) Slurry CentrifugeLiquid From Pond
rtH- Crystallizers PIRecycle to Evaporators Salt SolutionCentrifuge t o P o n d
Comp a c tor H yd roclone ‘ _ \ / F l u e Gas
inesScreens RotaryDrier
FlakeBreaker
Dried KC1
To Storage andLoad out
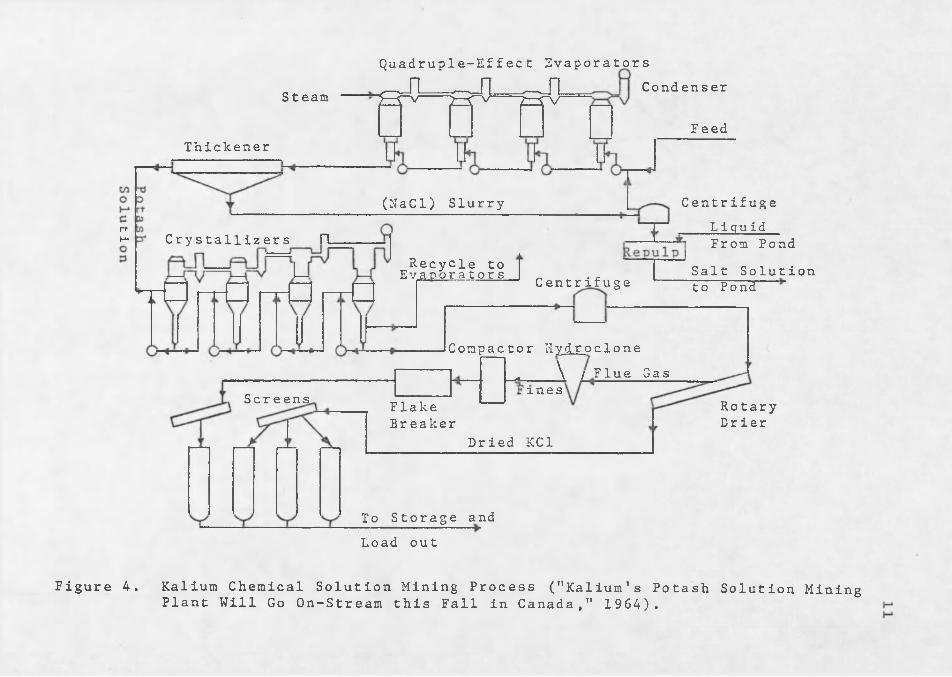
4. Kalium Chemical Solution Mining Process ("Kalium’s Potash Solution Mining Plant Will Go On-Strearn this Fall in Canada," 19 64).

.12KC1 crystallizes 'but the NaCl does not- The product KC1
is washed and dried and the spent brine is recycled to the
leaching operation.
The Kalium Chemical solution mining plant in
Regina, Saskatchewan is unique and should be the forerunner
of other similar plants. A schematic of this operation is
shown in Figure 4. The brine from the mining operation
goes to a bank of quadruple effect evaporators to remove
enough water to bring the brine close to s a t u r a t i o n „ The
solution then goes to a thickener 90 feet in diameter to
settle out any solid NaCl and other, insoluble impurities »
The overflow from the thickener goes to a series of four
Swenson draft tube baffle c r y s t a l l i z e r s , each of which is
responsible for producing a specific size particle. The
crystallizers are fitted with equipment for rapid removal
of the small c r y s t a l s , called f i n e s , and for classification
of the product stream. The product is c e n t r i f u g e d , d r i e d ,
and screened to form different grades of fertilizer. The
Kalium plant is capable of producing 600,000. tons of potash
p er y ear .
Trevious Studies
Little work has been done in the field of potasium
chloride crystallization. This is one of the reasons why
this study was performed. Some previous work is described
13
as follows. Also described is a computer program developed
for use as a design tool for crystallizers of any configur
ation and which was used in this s t u d y •
Crystal Growth and. Nucleation Kinetics
Lessieux and Svoronos (1966) performed experiments
in which they first obtained an aqueous solution saturated
with both potassium chloride and sodium chloride at a
known temperature, then supersaturated the solution to a
measured degree by lowering the tem p e r a t u r e . At this
point KC1 seed crystals of known mass and surface area ^
were introduced into the solution.. After a time the crys- . tals were removed and the growth rate was measured by a
technique developed by the researchers. Saturation tem-? -
peratures from 30* - 8 0° C were tested.
It was found that the growth rate varied linearly
with the degree of supersaturation for a given initial
crystal surface area. For the same degree of supersatura
tion , the growth rate increased with increasing saturation
t e m p erature. The increased growth rate did not arise from
any variation in the amount of potassium chloride which
came out of solution since this was essentially the same
for a given degree of supersaturation over the range of
temperatures studied* It was also determined that the
growth rate was a weak function of temperature.

14
Genck and Larson (197 2) carried out a series of ex
periments to determine the effect of temperature on growth
and nucleation rates of different systems* Their experi
ments were of the MSMPR type conducted in a well-mixed
cooling crystallizer with a capacity of 1 2 , 5 liters of . "
slurry * The hold-up or retention time in the crystallizer
ranged between 15 - 45 minutes* Conditions were controlled
to maintain a constant solids concentration between all
experiments* Three potassium salts were studied: potas
sium c h l o r i d e ? sulphate, and nitrate*
Genck and Larson were not able to measure supersat
uration and so could not verify some of the results of
Lessieux and Svoronos (1966), However they did form a c o r
relation between nucleation rate and the crystal growth
rate. For potassium chloride this correlation was:
B° = k G 1 ' n
In this correlation B° is the nucleation rate in number of
nuclei per minute and G is the crystal growth rate in m i l
limeters per minute. The kinetic rate c o e f f i c i e n t , 1, was
found to be 2*55* The nucleation constant k n was found to
be a weak function of temp e r a t u r e , The values for kn . d e
termined in these experiments are listed in Table 2*

15
For potassium chloride it was found that as tem
perature increased the nucleation rate increased corre
spondingly. Under conditions of constant solids
concentration the. growth rate actually decreased with
increasing temperature.
Table 2. Values of the Nuclea- tion Constant for KCl
T, °C kXI
1 2 . 0 K00oo\ 1 0 9
2 0 . 8 1 . 1 2 x 1 0 1 0
3 0.0 1.33 x 1 0 1 0
The experiments of Lessieux and Svoronos (19 6 6 )
were a poor analogy to the conditions actually occurring
in an industrial c r y s t a l l i z e r . As such* their numerical
results should be used cautiously in applications to more
realistic sit u a t i o n s . Their qualitative r e s u l t s 9 however s
do point the way to further r e s e a r c h . It was indicated
that temperature, super s a t u r a t i o n , and solids concentra
tion may affect the crystal growth rate. Further research
must provide quantitative r e s u l t s .
The work of Genck and Larson (1972) is more real
istic and the MSMPR technique is the method generally

16
accepted as the best means to determine.crystallization
k i n e t i c s » It was not the purpose of the study to make
a comprehensive analysis of potassium chloride, but to
show the different ways temperature may affect different
systems. They did show in passing the effect of tempera
ture on the nucleation and growth rates of KC1. Solids
concentration was not considered as a variable in these
e x p e r i m e n t s , and although agitation has been shown to
affect the rate of nucleation in other systems (Randolph
and C i s e , 197 2 ) , its effect of potassium chloride crys- "
tallization was not shown. One of the objectives of the
current study was to identify which factors influence K C 1
crystallization and then to quantify that influence in an
empirical model.
Computer Simulation of Crystal-Size Distributions
Nuttall (1971) presents an excellent history of
crystallizer simulation up to the date of his w o r k . This
history is not repeated h e r e . It was not the purpose of
the current study to develop a computer model for crystal-
size d i s t r i b u t i o n s , but to utilize N u t t a l l ? s model in new
areas of simulation. A brief discussion of N u t t a l l v s work
is appropriate o
Nuttall developed three computer m o d e l s , the Mark
I, II, and III simul a t o r s . The Mark I simulator is the
computer implementation of a g e n e r a l i z e d , steady-state
17
mathematical model of essentially all possible continuous
backmixed c r y s t a l l i z e r s . The basis for the model is the
population balance developed by Randolph and Larson (1971).
The computer model is designed to be able to handle seed
ing, multiple inlet and outlet streams, fines removal,
classification, staging, size-dependent growth rates, and
secondary nucleation k i n e t i c s . The computer algorithm com
bines the generality of the mathematical model without re
quiring internal modification for the study of various
crys,tallizer configurations and conditions. This is made
possible through a subroutine into which the program user
may place specific subfunctions which mathematically d e
scribe the physical configuration of the crystallizer being
studied. The user is limited only by his ability to d e
scribe physical systems mathematically.
The Mark III simulator is an extension of the
steady-state simulation to the problem of CSD dynamics.
The model employs the distributed dynamic population b a l
ance, hut still can solve steady-state problems. The heart
of the program is a Golden Section search r o u t i n e , which
facilitates the steady-state solution by eliminating the
need to iterate through the main loop of the program. The
routine quickly finds the growth rate required to maintain
a particular production rate. Only after this has been
determined is the dynamic solution a t t e m p t e d .

In this study the Mark III simulator was used to
model the dynamic behavior of a single stage crystallizer
with fines removal, liquor advance, and product classifi
cation. In particular it was desired to simulate condi
tions which would produce a cycling C S D . These conditions
had previously resulted in a cycling CSD. in a bench-scale
crystallizer of the type being simulated. It was the in-r
tention of this study to show that such computer programs
can be valuable tools for crystallizer design and analysis.
It has been qualitatively known that such processes
as fines destruction, classified product removal, and clear
liquor advance can cause cycling of the C S D . The ability
to be able to predict the limits to which these processes
may be taken before cycling occurs is a major concern for
those who would design an industrial crystallizer. This
was the goal set b y .Beer (1973), who performed a stability
analysis using spectral techniques bn the linearized popu
lation balance. A Class II classified crystallizer with
fines removal and magma-dependent nucleation kinetics was
studied. Results from Beer f s study were presented as crit
ical contours of the nucleation/growth rate exponent i =
d (log B ° )/d (log G ) . The most inf luential parameters lead
ing to CSD instability were found to be the size at which
product classification occurred and the presence of recycle
of dissolved fines back to the crystallizer.
19
To produce a cycling CSD it was necessary to lower
the natural stability limit of i = 21 so that it became
equal to or less than the experimental value of i deter
mined in the MSMPR studies » The contours presented by Beer
were used as a reference for the amount of classification
and recycle necessary to attain c y c l i n g . Without these
contours much additional work and experimentation would
have been required. B e e r ’s study is an important addition
to crystallization theory and practice.
THEORY
Most physical systems can be completely described
through mass and energy balances, along with kinetic or
equilibrium relationships. More information is required
and vital for a complete description of particulate
dispersed-phase systems. This arises from the fact that
one or more independent properties can be given values for
each individual particle due to the processes which act in
a random manner to produce or influence each particle.
The concept of a population density and its u s eful
ness in the analysis of particulate systems has long been
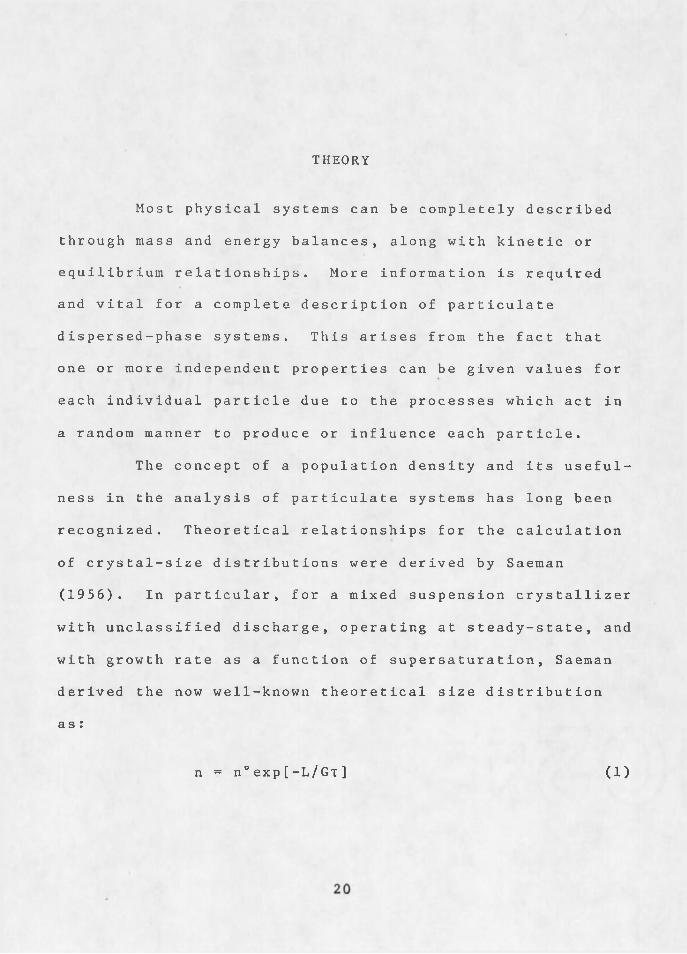
recognized. Theoretical relationships for the calculation
of crystal-size distributions were derived by Saeman
(1956). In particular, for a mixed suspension crystallizer
with unclassified d i s c h a r g e , operating at steady-state, and
with growth rate as a function of supersaturation, Saeman
derived the now well-known theoretical size distribution
as :
n = n° e x p [-L/G t ] (1)

21
Several investigators have built upon this early
work of Saeman to form a comprehensive theory for partic
ulate systems and in particular a theory for cryst alliza
tion processes. Randolph and Larson (1962) conducted an
extensive study of steady-state and transient operation of
a mixed suspension c r y s t a l l i z e r . This study provided the
basis of the population balance. Randolph (1964) presented
a more rigorous form of the population balance for systems
of countable entities. Other forms of the generalized p o p
ulation balance have since been presented by Hulbert and
Katz (1964). For a complete description of the theory b e
hind the population balance, the reader is referred to
Randolph and Larson (1971). What follows is the basic co n
cept of the population balance as it applies to this study.
Consider a size range from Li to L 2 > with L 2 larger
than Li, and let the difference L 2 - L % be designated A L .
The number of crystals in this size range per unit volume
is AN. The population density is then found by dividing
the number of crystals by the width of the size r a n g e .
Then in the limit as the size range becomes vanishingly
s m a l l :
lira AN dN /oxAL^O AL = dL = n <2 >

The population density must then depend upon the crystal
size at which the derivative in Equation 2 is evaluated.
There are several forms of the population balance
which are useful for describing various system configura
tions. The most general form is the micro-distributed po p
ulation balance:
If + + V * ( v en) - B + D = 0 (3)
In many cases of engineering i n t e r e s t , the pro
cesses involved in the crystallization system take place in
regions which can be considered to be well-mixed. In these
situations the spatial distribution of the crystals is not
of interest or i m p ortance. The volume of the well-mixed
region can then be averaged into the equations , yielding
the macro-distributed population balance:
It * ^ * » - » * <*>k
For a single stage, mixed suspension mixed product removal
cry s t a l l i z e r , Equation 4 can be considerably simplified
under the following conditions:
1. M c C a b e ’s AL law is applied to the system. This is a law of nature observed by McCabe that for many crystallization systems growth rate is independent of crystal size.
23
2. All feeds to the crys tallizer contain no cry s tals.
= 0 ( 6 )
3. The population density of the crystallizer d i s charge is identical to that of the mixed suspension.
nQ = n (7)
4. No agglomeration or gross crystal fracture o c curs .
D = B = 0 (8 )
5. The suspension volume is held constant.
d(log V) = od t
6 . The retention time in the crystallizer is:
(9)
t = (1 0 )O
Under these conditions Equation 4 b e c o m e s :
f t + G ! t - - 7 ( I D
If steady-state operation is also imposed upon the system.
Equation 11 can be directly integrated to obtain the expo
nential distribution:
n = n° e x p [-L/G t ] (12)
This equation is the steady-state solution of the
population balance for a mixed suspension mixed product

24
removal crys talliz e r . Equation 12 plots as a straight line
on semi-logarithmic graph p a p e r . The intercept of the line
is the natural logarithm of the zero-size population den-
ity, often called the nuclei density, defined as:s
(13)L = 0
The slope of the line has a value of - 1 /G t . Knowing the
residence time, T , for a particular experiment, the growth
rate can be determined from the slope of the line.
The suspension density, or weight of solids per
unit volume, is given by:
M t = 6 pkv n ° (Gt ) 4 (14)
This equation gives the theoretical value of the suspension
density for a given crystal-size distribution. Once the
values for growth rate and nuclei density have been d e ter
mined, the suspension density can be calculated by Equation
14. It is possible to measure M̂ , directly by collecting a
sample of the crys talliz er slurry , filtering the s a m p l e ,
and weighing the dried crystals. By comparing the values
of resulting from these two processes a consistency
check of the experimental data can be made.

25
In order to prepare a population density plot it is
first necessary to be able to calculate point values of the
population density. These can be calculated easily from
the following r e l a t i o n :
M (dW/dL)n = ------- (15)
P V 3
In this equation L is the average size of two successive
sieve screens, dL is the difference between the sizes of
the two screens, and dW is the weight fraction of crystals
in the sample trapped by the lower screen. The shape fac
tor, , relates the crystal volume to the cube of the a v
erage screen size. All of the quantities on the right-hand
side of Equation 15 can be determined from experiment or a
screen analysis. This equation was derived from the def i
nition of the weight fraction of crystals in a size range
being the number of crystals in that size range times the
weight per crystal divided by the weight of all crystals.
An important objective of this research was the d e
termination of nuclei densities and growth rates from v a r i
ous crystal-size distributions. These distributions were
generated from a series of experiments designed to meet the
conditions leading to the development of Equation 11. Four
variables--retention time, crystallizer temperature, feed

26
saturation temperature, and agitation rate--were studied
as to their effects on the crystal-size distribution.
Equally important in this study was the determination of
the nucleation rate. This is the rate at which crystals of
vanishingly small size are formed and is given by:
L-0 dt(16)
This derivative may be expanded into the following f o r m :
»• - 3T L-*0 £ < i n
It is recognized that the derivative dL/dt is the crystal
growth rate. From Equation 13 it is seen that dN/dL | L->0
is the nuclei density. Then it follows that:
B° = n°G (18)
Thus the nucleation rate can be directly obtained from the
experimental results.
Other investigators (Randolph and Cise, 1972;
Randolph and Youngquist, 19 7 2) have found that a suitable
correlation for the nucleation rate of many systems has the
f o r m :
B° = k n (T,RPM)G 1 M T:j (19)

27where may have the form:
kn = kiex p [ k 2 /T](RPM ) k 3 (20)
A model of this form was used to correlate nucleation rate
to the various physical parameters studied.
The development of the population balance approach
to crystallization has helped to bring this important unit
operation out of the realm of art and into the realm of
science. The ability to analyze experimental data in a
logical and thorough manner is the key to successful design
practices. It is hoped that this study will add to the
growing knowledge of crystallization and lead to more ef fi
cient and productive crystallization processes.

EQUIPMENT AND EXPERIMENTAL PROCEDURE
The experimental portions of this study fall into
two areaso Initial studies were carried out in a mixed
suspension mixed product removal c r y s t a l l i z e r « These were
followed by experiments with a classified product crystal-
lizer. The discussion here is divided along these lines.
- MSMPR Equipment and Procedure
This section combines two descriptions » First d i s
cussed is the construction of the MSMPR crystallizer and
associated e q u i p m e n t „ This is then followed by an outline
of the experimental procedure by which the data were ob
tained o
MSMPR Equipment
The crystallizer used in this portion of the study
was a ten liter polyethylene vessel, A stainless steel
draft tube was fixed concentric with the vessel and sup
ported by four stainless steel baffles extending about
three-quarters of the height of the vessel. To the draft
28
29tube was welded a tightly wound cooling coil of 3 / 8 inch
stainless tubing. A three-bladed impeller was fitted into
a seat in the bottom of the vessel and was driven by a m o d
el 2-R agitator manufactured by the Bench Scale Equipment
C o m p a n y , This agitator was capable of providing stirring
rates up to 800 r p m . A flexible coupling in the shaft b e
tween the motor and the blade eliminated much of the v i b r a
tion caused by imprecise placement of the motor mount above
the c r y s t a l l i z e r W a t e r was circulated through the cooling
coil and maintained at constant temperature by a Forma-
Junior Model 2095 bath and circulator obtained from the
Forma-Scientific Company of Marietta, O h i o „
A Model S-3 ,TTherm-0-Watch" electronic controller
manufactured by the I 2R Company maintained constant temper
ature in the crys t a l l i z e r . When the mercury level in a
thermometer immersed in the slurry moved up to a sensing
clip attached to the thermometer, a solenoid valve was
closed. This valve was located in the cooling water circu
lation line and when closed stopped flow of the water to a
bypass loop. Thus more water was directed to the crystal
lizer , which caused the temperature in the crystallizer to
drop. When the temperature dropped sufficiently, about
1 / 2 ° F , the solenoid was opened, and some of the cooling w a
ter then bypassed the crystallizer.

30
Liquid level was also controlled in the crystalliz-
ero This was achieved by the use of a Matheson "Lab-Stat"
controller which sensed changes in electrical conductance
of a glass probe filled with a salt solution. The probe
was suspended just above the desired liquid level and its
sensitivity was adjusted so that when the liquid touched
the probe the controller was activated. This caused an
air-operated ball pinch valve to open and an Eastern Model
D-ll centrifugal pump to operate. Slurry was removed for a
specific time period which could be dialed into a delay-
relay in the controller circuit. This time delay was a p
proximately four seconds for all of the experiments
conducted s, but was adjusted so that the liquid level was
lowered from 1/4 to 1/2 inch per removal period. A water
flush was continuously run through the pump to avoid crys
tal b u i l d - u p . Figure 5 shows the crystallizer assembly with
temperature and liquid level p r o b e s .
The port through which the slurry was removed was
located at approximately one-third of the height of the
crystallizer w a l l . Isokinetic removal of the slurry re
quired that removal be at the same velocity as the circula
tion rate of the slurry inside the c r y s t a l l i z e r . This was
achieved by connecting the Eastern pump to a powerstat and
adjusting the pump rpm by varying its power i n p u t . Slurry
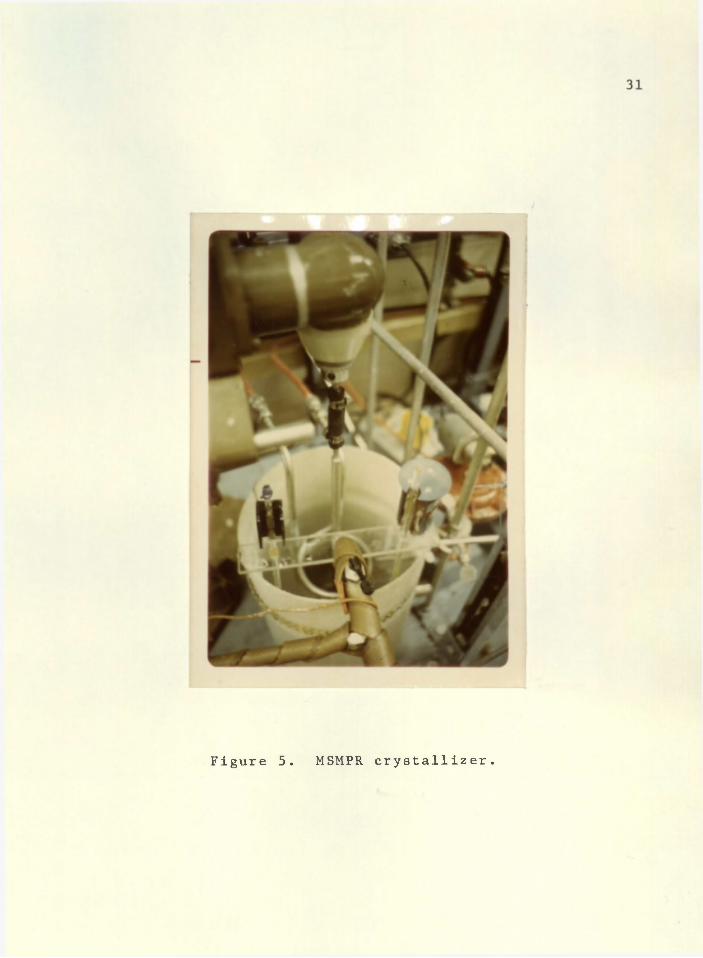
Figure 5. MSMPR crystallizer .

32
was pumped either to a drain or to a vacuum filtering appa
ratus if a sample was desired, depending on the position of
two ball valveso
The feed tank was a thirty gallon cylindrical tank
with an inner wall of heavy duty polyethylene and a fiber
glass outer w a l l » A single-loop heating coil of 3/8 inch
stainless tubing was fitted inside the vessel about one
inch above the bottom and connected through the walls by
"Swagelok" bulkhead unions. Heating was accomplished using
steam. A thermometer protruded into the feed liquor from
the side wall near the bottom of the tank but above the
heating coil. Another "Therm^O-Watch" controller sensed
the feed temperature and opened or closed a steam solenoid
valve as required. The tank had a removable polyethylene
cover through which was fitted an air-operated stirrer
which had as its main function the breaking-up of any ther
mal gradients. Also attached to the cover was a cooling
water condenser to avoid pressure buildup inside the tank
.by having its contents open to the atmosphere while not
losing any water vapor from the l i q u o r . A drain valve was
also fitted at the bottom of the t a n k .
The feed line was either 3/8 or 1/4 inch stainless-(
steel tubing and was wrapped with heating tapes to avoid
crystallization in the line. The feed was delivered to the

33
crystallizer by a Research Appliance Corporation micro-
bellows pump capable of delivering up to 185 ml/min. There
was no filter in the feed line. A feed sampling port was. " - • ' '
located just upstream from the c r y s t a l l i z e r . A water line
was also tapped into the feed line upstream from the pump.
to allow for washout of any plugging which might occur d u r
ing an experimento
Figure 6 shows the complete experimental apparatus
while Figure 7. is a schematic drawing of the equipment.
MSMFR Procedure
The day preceding an experimental run, a batch of
feed solution had to-be prepared. A known volume of water
was put into the feed tank. From the mutual solubility
curve for KC1 and NaCl the amount of each salt to be added
was calculated. These amounts were set such that the r e
sulting solution would be under saturated with respect to KC1
by 20°F and just saturated with respect to NaCl. Also added
was 0.75 g Mg/100 g water, in the form of M g S 0 4 »7 H % 0 . This
combination of salts represents a typical brine found in a
solution mining plant. The solution was allowed to sit
overnight at the desired feed temperature to insure that all
solid material was dissolved.
Before the run was started, the crystallizer temper
ature and level controllers were turned on to allow them to
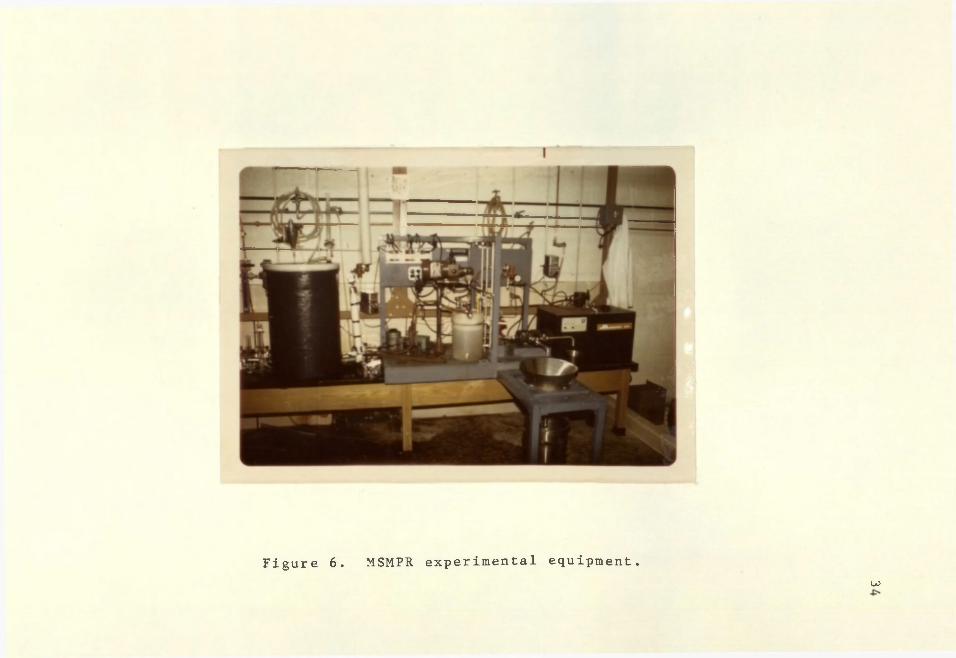
Figure 6 . MSMPR experimental equipment.u>
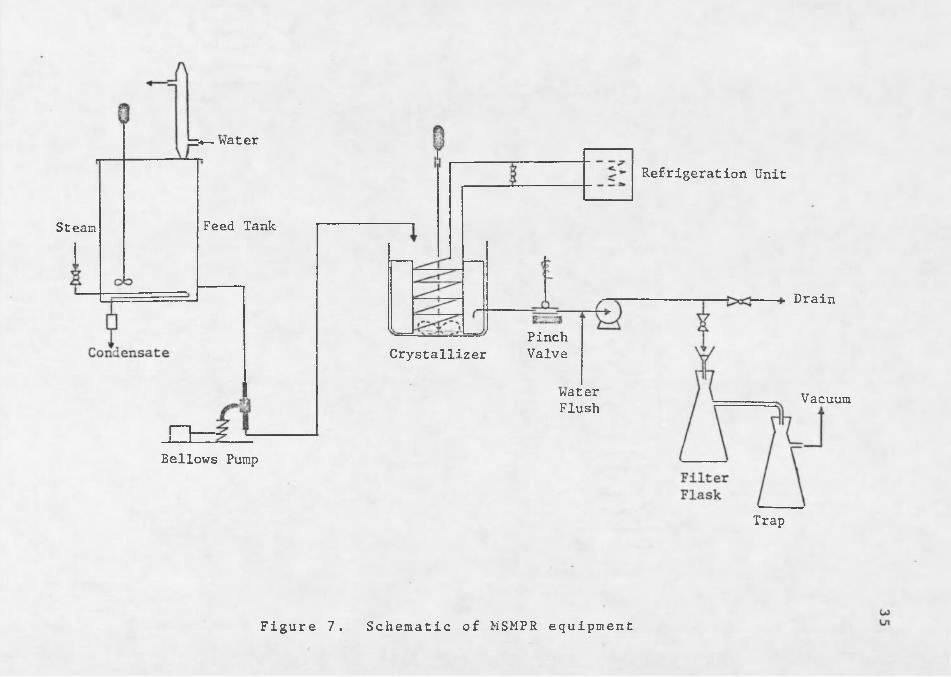
Steam
Bellows Pump
Refrigeration Unit
b*— water
Feed Tank
PinchValveCrystallizer
waterFlush
Drain
Vacuum
Trap
Figure 7. Schematic of MSMPR equipment

36
warm up. The crystallizer was charged with saturated li
quor saved from the previous run. The refrigeration unit
was turned on and water was circulated through the cooling
coil so that the liquor would be near the desired operating
temperature when the experiment was started. In this ini
tial stage the cooling water actually acted as a heating
medium for the crystallizer charge. At this time the w a
ter flush was started through the removal pump* The power
to the heating tapes was turned on to allow the feed line
to come to the feed temperature.
When all of this was accomplished the feed rate was
set to give the desired residence time in the crystallizer.
This was done by adjusting a screw setting on the bellows
pump. Flow was diverted from the crystallizer through the
sampling port so that the flowrate could be checked by a
bucket-and-stopwatch t e c h n i q u e . When the flowrate was at
the correct setting, the feed was allowed to flow into the
crystallizer. The proper agitation was set by adjusting a
speed control knob on the motor until the motion of the
shaft was frozen by a strobe tachometer. The crystallizer
was then seeded with approximately four pounds of potassium
chloride c r y s t a l s . At this point the experiment was in its
operating mode. Frequent checks on the feed flowrate. and
the various temperatures and controllers were made through
out the course of the experiment to minimize any fluctua-
t i o n s . ;

3 7
Feed samples were obtained at the beginning and end
of each run for later a n a l y s i s • At the end of a run a fil
tered sample of the crystallizer suspension was also ob
tained to be subjected to the same analysis. The purpose
of the analysis was to determine the concentration of the
potassium chloride in the stream. The samples were ob
tained by allowing some of the feed to be pumped into a
graduated cylinder containing a known volume of distilled
w a t e r . The volume increase indicated the size of the sam
ple. This technique removed the possibility of losing some
of the sample due to crystallization in the glassware. The
crystallizer sample was obtained by pipetting through a
cotton swab directly from the c r y s t a l l i z e r . A portion of
the pipetted sample was added to distilled water as previ
ously described.
The analysis consisted of treating the sample with
sodium tetraphenyIboron solution and titrating with a Zeph-
iran chloride solution. The STPB reacts with potassium to
form a white precipitate. The titration indicates the
amount of unreacted STPB 9 thus giving a measure of the po
tassium content by b a c k - c a l c u l a t i o n . Difficulties were en
countered with this; chemical analysis and are discussed in
the section on experimental r e s u l t s .
When a product sample was desired, the water flush
was stopped and the level controller was allowed to operate

38
once to remove- any water from the l i n e s „ Then the ball
valve in the drain line was closed while the valve in the
filter line was o p e n e d . Vacuum was applied to the filter
f l a s k » The next time that the level controller operated 9
flow went to the filter instead of the drain. After the
sample was. obtained the positions of the ball valves were
reversed and the water flush was resumed. The volume of
filtrate was measured and r e c o r d e d . The crystals were
washed and filtered twice with acetone which had been pre
viously saturated with potassium chloride. The crystals
were weighed and sieved. This sampling technique did not
interfere in any way with the normal operation of the crys-
tal l i z e r .
This procedure was observed for all r u n s . No sig
nificant deviations were made in the procedure for any run,
except as might occur as technique improved throughout the
course of the research.
Table 4 is a summary of the operating conditions :,
for the individual experimental The units ..for the v a r i
ables studied are given in Table 3. The order in which the
experiments were executed was determined by indiscriminantly
selecting an entry from a table of random n u m b e r s . This
was done in order to avoid trends in the data due to any

3 9
unidentified or uncontrolled variables. The experiments
represent a quarter replicate of a full factorial design
for the four independent variables studied.
Table 3. Units for Variables in Table 4
VariableRetention
Time
Crystallizer Temperature
Agitation RPM
Feed KC1 Saturation 0 FTemperature
Classifying Crystallizer Equipment and Procedure
The material in this section was part of a parallel
study conducted by E . P. K . Ottens (n .d .). As his work was
vital to this study, a brief description of the equipment
and procedure used by Ottens is included h e r e ,
Classifying Crystallizer Equipment
The classified product crystallizer had a volume of
21 liters and was constructed of fiberglass. The cooling
assembly consisted of two concentric tight-wound coils. The
Units
minutes

40
Table 4. MSMPR Experimental Operating Conditions
Feed K G 1Run Retention Crystallizer A g i t a t i o n Saturation Time Temperature . Temperature
1 46 100 800 160
2 60 100 750 160
3 60 90 800 160
4 90 90 750 160
5 90 80 800 160
6 120 80 750 160
7 60 100 800 140
8 90 100 750 140
9 120 80 800 140
10 120 90 750 140
11 90 90 800 140
12 46 80 7 50 140
13 4 6 80 7 50 140
outer coil was welded to a stainless steel draft tube sup
ported, by three baffles. Agitation was achieved using a
Bench Scale Company agitator fitted with a marine propeller.
Temperature and liquid level were monitored using two Math-
eson "Lab-Stat" controllers in a manner similar to that used
in the MSMPR crystallizer.

41
Attached to the side wall of the crystallizer was a
vertical plexiglass c y l i n d e r . This cylinder acted as a
trap for the small crystals. Crystals of all sizes were
forced into the bottom of the cylinder by the action of the
agitator. A peristaltic pump withdrew liquid from the top
of the cylinder at a predetermined flow rate. . The smaller
crystals were carried out the top with the liquid . The
larger c r y s t a l s , being too heavy to flow with the liquid,
fell to the bottom of the cylinder and back into the crys
tallizer. The maximum size crystal carried out the top of
the trap could be adjusted by changing the flow rate and
could be calculated from S t o k e ’s Law. The cylinder was
compartmentalized by a plexiglass baffle assembly. Liquid
was withdrawn from each of the four compartments via a
stainless steel dip tube. The liquid level control probe
was immersed in one of the compartments because the surface
was less turbulent in the fines trap than in the crystal
lizer itself.
From the fines trap the slurry was pumped to a
steam-heated tank to dissolve the crystals in the stream.
A fraction of this stream was routed back to the crystal
lizer after passing through a precooler to remove excess
heat Introduced by the fines dissolver. The remainder of
the stream was pumped back to the feed tank to be incorpo*- -
rated into the feed l i q u o r .

42
A stream of crystals was continuously removed from
the crystallizer in an isokinetic manner using another p e r
istaltic p u m p . The system was designed so t h a t .this stream
would pass over a wet screen. The Smaller crystals in the
stream would be washed through the screen and be recycled .
to the crystallizer. The larger crystals would pass over
the screen and return to the feed tank to be dissolved. If.
the liquid level in the crystallizer became too h i g h , the
controller would cause a motor-driven ball valve to rotate.
This valve was part of a flow-direction device and would
make the stream bypass the wet screen and flow directly to
the feed tank. In practice the wet screen was not u s e d .
It was discovered that classification was occurring inter
nally at the product removal port, making, external classi^
fication an unnecessary complication.
The feed tank was molded from fiberglass and had a
capacity of fifty gallons. A donut-shaped fiberglass d i v i
der split the tank into two sections. The bottom section
was steam-heated and was the compartment to which all r e
turning streams entered. The crystallizer feed was w i t h
drawn from the top section. Both sections were stirred by
a single agitator with two propellor blades fitted to its
s h a f t . The feed line was wrapped with heating tape to

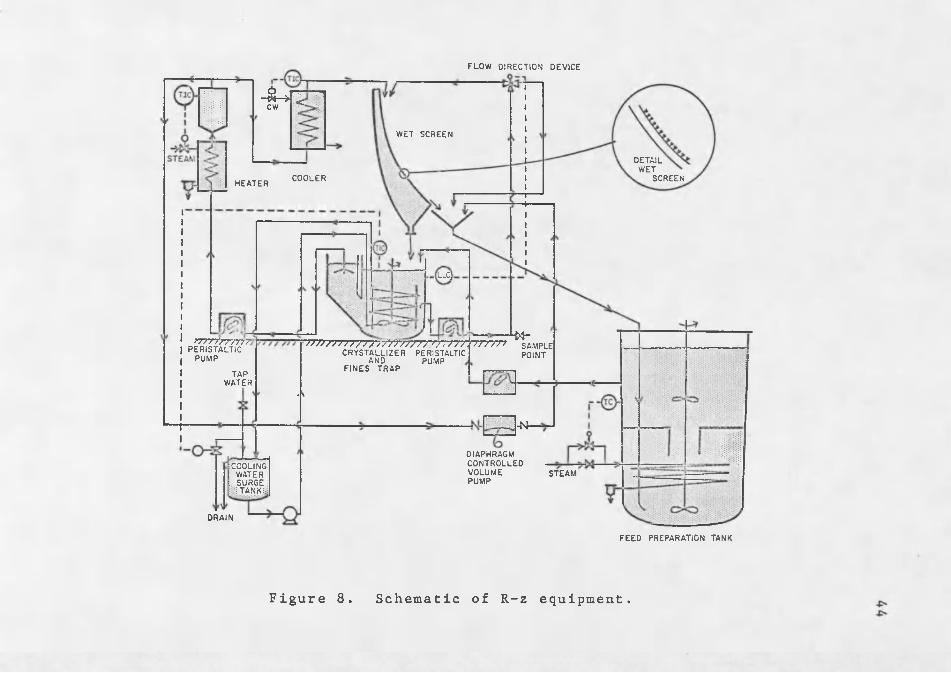
43prevent f o u l i n g . The complete apparatus is pictured in
Figure 8 . Details of the crystallizer-fines trap assembly
are seen in Figure 9.
Classifying Crystallizer Procedure
Feed solution was saved from run to run so it was
not usually necessary to make fresh stock. When it was
necessary the procedure was as described in the MSMPR sec
tion except that magnesium sulphate was not a d d e d . Freslv
initial charge for the crystallizer was prepared for each
run o Fifteen liters of water were put into the crystal-
lizer, along with enough potassium chloride to form a sat
urated solution and to act as seed, and sufficient sodium
chloride to form a nearly saturated solution with respect
to that salt. These amounts were determined from the m u t u
al solubility curve, Figure 3. Insoluble magnesium ca rbo
nate p a r t i c l e s , present in the sodium chloride, were
dissolved by adding dilute hydrochloric acid to the solu
tion.
The crystallizer impeller was started, cooling w a
ter was allowed to pass through the coil, and the heating
. tape around the feed line was allowed to warm up. Agita
tion was set to give a good rolling motion to the suspen-i
s i o n . Proper flow rates for the feed, liquor a d v a n c e , and
fines removal were set by the bucket-and-stopwatch m e t h o d .
F L O W DIRECTION DEVICE
-S—>1"̂c w
W E T SCREEN
DETAILW E T
COOLER SCREENHEATER
LLC]
"M-SAMPLEPOINT
rrrT-frrrrr?PERISTALTICPUM P
V7777/7 / V / y / z vYrrr/TT-nryry A -/nrn c r y s t a l l i z e r peristaltic
AND PUMPFINES TRA P — ™TAP
WATER< v
,-N-DIAPHRAGMCONTROLLEDV O L U M EPUM P
COOLING WATER : SURGE: 1 TANiC:.
STEAM
DRAIN
FEED PREPARATION TANK
Figure 8 . Schematic of R-z equipment.

F i n e sR e m o v a l
C a p a c i t a n c e S e n s o r f o r L L C
C a p a c i t a n c e r t . S e n s o r
f o r T CR e c y c l eF r o mW e t S c r e e n
C o o l i n gW a t e r F e e d
F i n e sT r a p
RX
— > P r o d u c t
Figure 9. Crystallizer-fines trap assembly
4
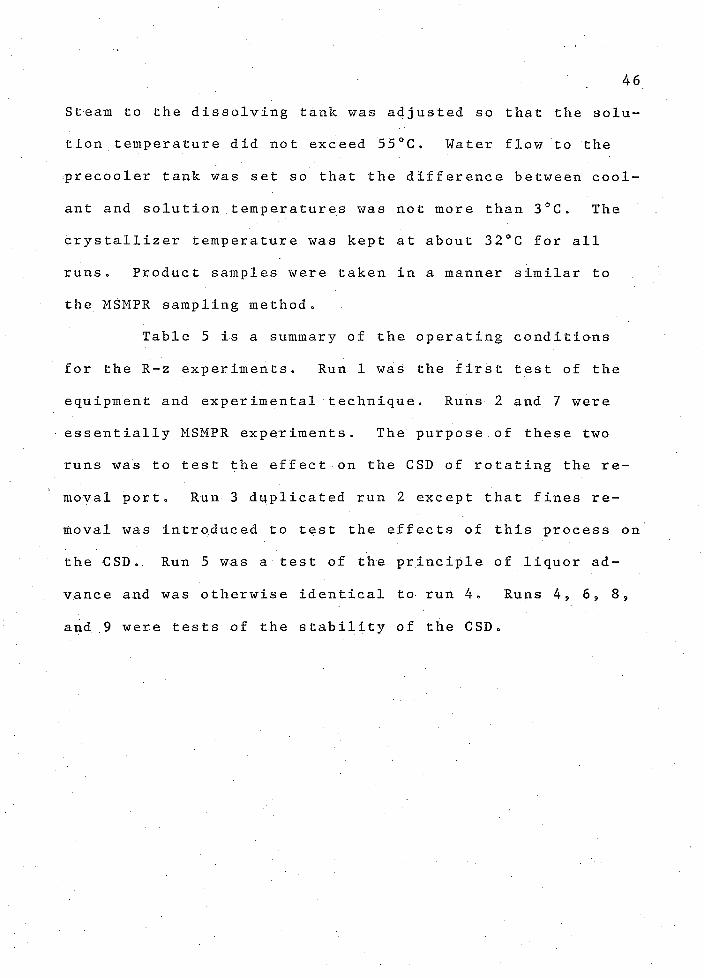
Steam to the dissolving tank was adjusted so that the solu
tion temperature did not exceed 55 °C „ Water flow to the
precooler tank was set so that the difference between cool
ant and solution temperatures was not more than 3 ° C • The
crystallizer temperature was kept at about 3 2°C for all
runs * Product samples were taken in a manner similar to
the MSMPR sampling m e t h o d „
Table 5 is a summary of the operating conditions
for the R-z experiments. Run 1 was the first test of the
equipment and experimental technique. Runs 2 and 7 were
essentially MSMPR experiments. The purpose of these two
runs was to test the effect on the CSD of rotating the r e
moval port. Run 3 duplicated run 2 except that fines r e
moval was introduced to test the effects of this process o
the CSD, Run 5 was a test of the principle of liquor ad
vance and was otherwise identical to run 4, Runs 4 , 6 9 8 ,
and 9 were tests of the stability of the CSD,
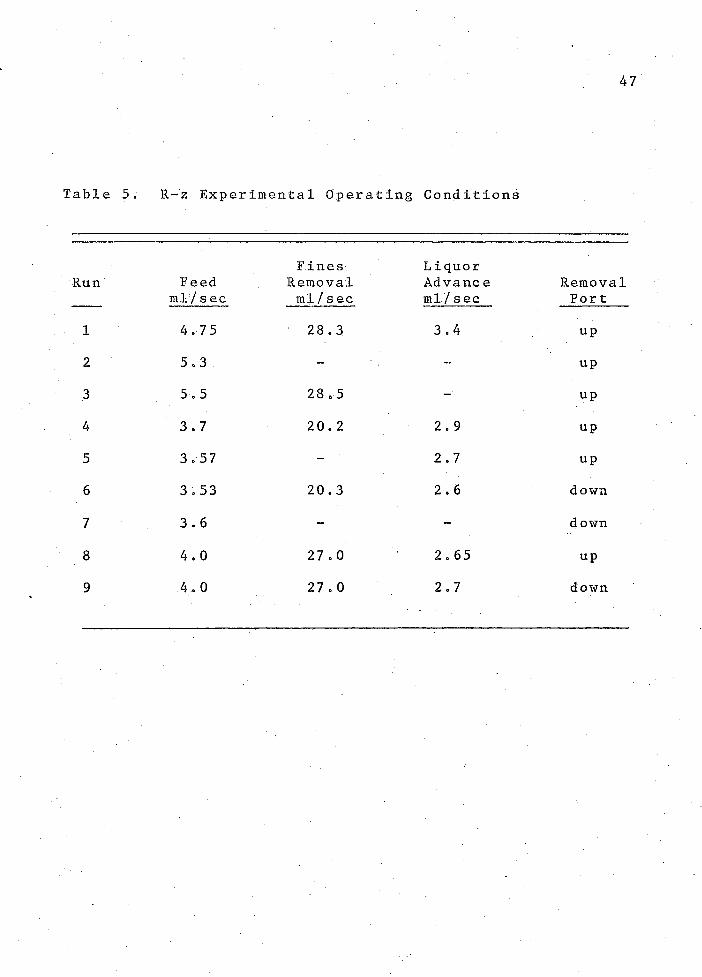
Table 5. R-z Experimental Operating Conditions
Fines LiquorRun Feed Removal Advance Removal ml/s ec ml/sec ml/sec Port
1 4.7 5 28.3 3.4 up
2 5.3 - - up
3 5.5 28.5 - up
4 3.7 2 0 . 2 2.9 up
5 3.57 - 2.7 up
6 3.53 20.3 2.6 down
7 3.6 - - down
8 4.0 27.0 2.65 up
9 4.0 27.0 2.7 down
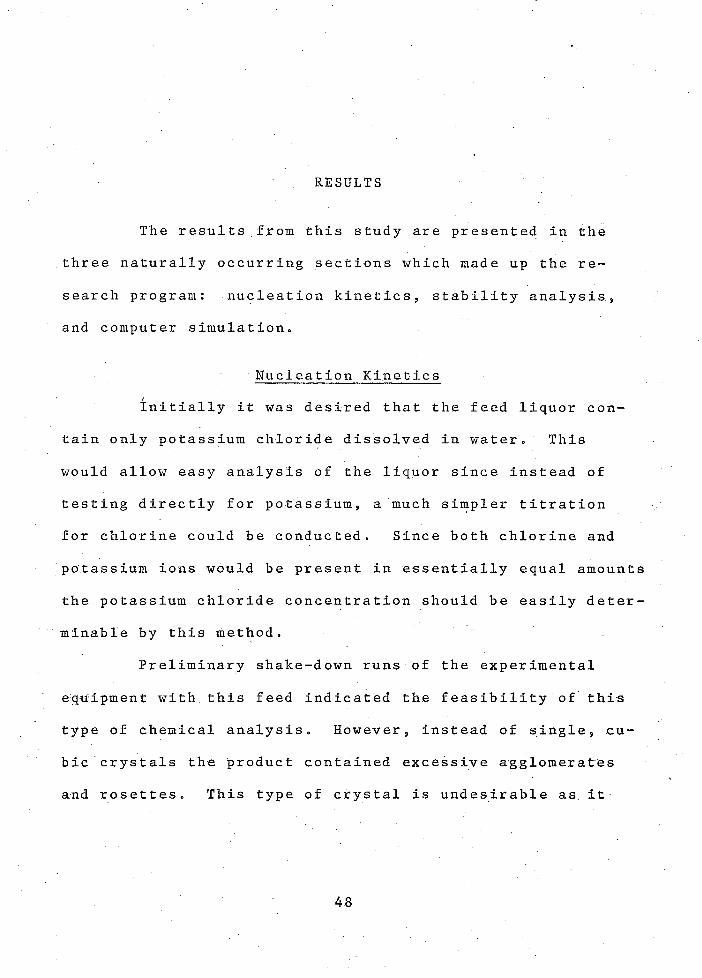
RESULTS
The results from this study are presented in the
three naturally occurring sections which made up the r e
search program: nucleation kinetics, stability analysis,
and computer simulation.
Nucleation Kinetics
Initially it was desired that the feed liquor con
tain only potassium chloride dissolved in water. This
would allow easy analysis of the liquor since instead of
testing directly for potassium, a much simpler titration
for chlorine could be conducted. Since both chlorine and
potassium ions would be present in essentially equal amounts
the potassium chloride concentration should be easily d e t e r
minable by this method.
Preliminary shake-down runs of the experimental
equipment with this feed indicated the feasibility of this
type of chemical analysis. However, instead of s i n g l e , c u
bic crystals the product contained excessive agglomerates
and rosettes. This type of crystal is undesirable as it
48

49
presents difficulties in analysis and tends to indicate
larger than normal growth rates. It was then 1 necessary to
conduct a brief study of chemical additives to find a suit
able habit modifier. Such an additive should have the
ability to prevent twinning of the crystals, while not in
terfering with the nucleation kinetics of the system or
introducing difficulties into the chemical analysis tech
nique already in u s e .
A list of possible additives was compiled from the
literature and a knowledge of the chemical species present
in an industrial potash crystallizer brine. The substances
tested are listed in Table 6 . Preliminary studies were
conducted in a shaker bath with a temperature controller.
Eight sample could be tested simultaneously in separate
Erlenmeyer flasks. A saturated solution of potassium chlo
ride containing an additive was placed in the bath, where
it was kept at constant temperature with agitation until
equilibrium was established at a temperature well below the
saturation temperature. The resulting crystals were m i c r o
scopically studied to select the more promising additives
for further investigation in the MSMPR e q u i p m e n t .
It was found that crystals produced using lead
chloride as an additive lost all semblance of the natural
cubic shape expected of potassium chloride crystals. The

50
Table 6 . Chemical Additives Studied as Habit Modifiers
SubstanceChemicalFormula
Concentration in Solution
Lead(II) Chloride PbCl 2 500 ppm
Sodium 01 eate Na 2 C 1 e H 3 2 0 2 1 0 0 ppm
P-Toluene Sulfonic Acid (Sodium Salt)
SO 3 ~Na+
0c h 3
500 ppm
TetraethylAmmoniumChloride
C 2 H 5
C 2 H 5 —N — C 2 H 5 —Cl 1C 2 H 5
1 0 0 ppm
Armac T 1 ppm
Sodium Chloride NaCl Saturated Solution
Magnesium Sulphate Mg 2 SO 0.75 g Mg/100 g H 20
product could not be called agglomerated in the sense of two
or more crystals sticking together. Instead it appeared as
if a single crystal grew in all directions in a random m a n
ner, completely disregarding any molecular orientation into
a crystal lattice. Figure 10 shows crystals grown from a
solution containing only potassium chloride. The degrada
tion in crystal habit when lead chloride is also present is
seen by comparison with Figure 11. Obviously lead chloride
had to be rejected as a habit modifier.

51
r W
Figure 10. Crystals grown from saturated KC1 solution Average size = 254 microns.
Figure 11. Crystals grown from saturated KC1 solution inpresence of PbCl 2 » Average size = 254 microns.

52Noticeable improvement in crystal habit was found
from the use of sodium chloride. Single cubic crystals
were present in large amounts in sizes up to approximately
4 00 m i c r o n s , In the larger sizes agglomerates did appear
but the extent of agglomeration was not as severe as when
the additive was not present. Addition of magnesium sul
phate did,not significantly improve the crystal habit.
Neither did it degrade the habit, and since magnesium and
sulphate ions are present in industrial potash brines it
was decided to retain the magnesium sulphate in the liquor
to make the system more realistic. Figure 12 shows the im
provement attained in crystal habit when this type of liquor
is u s e d .
The combination of chemicals chosen as a habit m o d
ifier complicated the analysis of the feed solution consid
erably. It was no longer possible to titrate for the
presence of chlorine ions since significant quantities were
introduced in the form of NaCl. Although the test for po
tassium is somawhat more complicated it still involves ti-
trimetric techniques. Since no other suitable agent was
found to act as a habit, modifier, it was decided to proceed
with the use of the sodium chloride/magnesium sulphate co m
bination.

53
Figure 12. Crystals grown from saturated KC1 solution in presence of NaCl and Mg SO 4 . Average crystal size = 2 54 microns.

54
A series of thirteen experiments was conducted to
determine growth rates and nuclei densities in the manner
previously described. From these experiments, nucleation
rates could also be determined using Equation 18. The r e
sults of these experiments are summarized in Table 7.
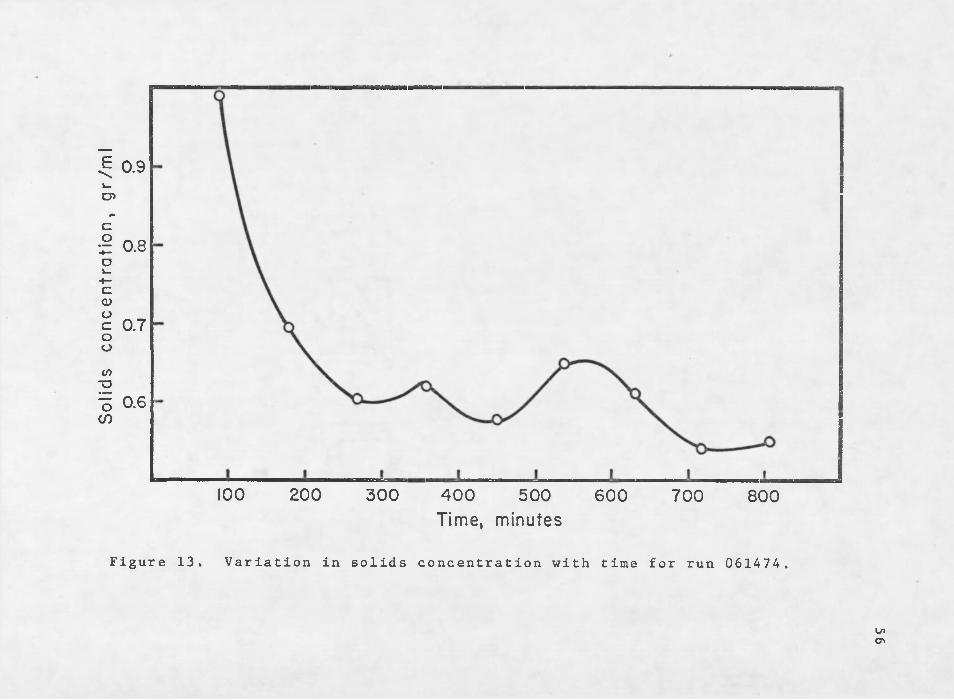
Whenever possible, two product samples were ob
tained from a single experiment. These were taken at times
corresponding to eight and nine residence times into the
run. If necessary an experiment could be run for as long .
as eleven residence times before lack of feed solution
forced termination of the experiment. It was found that
steady-state conditions were reached after approximately
seven retention times. This could be checked by following
the variation in solids concentration with time until tran
sients damped outo The variation in solids concentration
for a typical experiment is shown in Figure 13»
The two samples were treated separately to obtain
in effect two sets of population density data. These were
then plotted on the same semi-log graph and a single line
was f itted through the points by a least-squares technique e
This process yielded average values for the growth rate and
nuclei density. Two samples could not be obtained for each
experiment due to such calamities as a power failure or a c
cidental drainage of the crystallizer by the level control
ler.
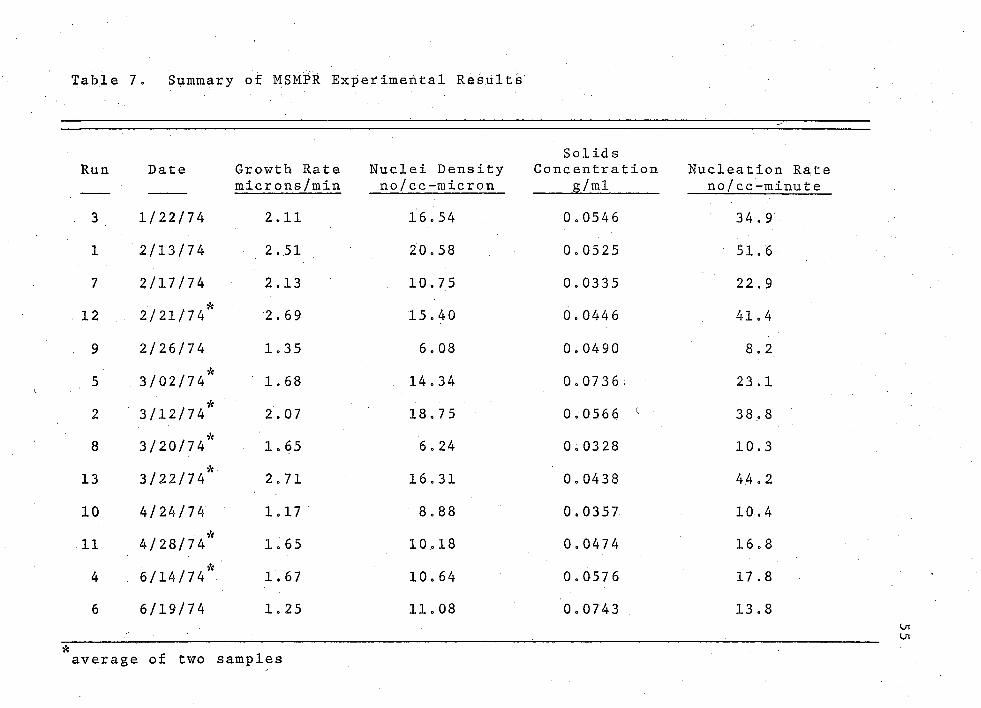
Table 7. Summary of MSMPR Experimental Results
Run Date Growth Rate microns/min
Nuclei Density no/cc-micron
SolidsConcentration
g/mlNucleation Rate
no/cc-minute
3 1/22/74 2.11 16.54 0.0546 34.9
1 2/13/74 2.51 2 0.58 0.0525 51.6
7 2/17/74 2.13 . 10.75 0.0335 22.9
12 2/21/7 4* 2.69 15.40 0.0446 41.4
9 2/26/74 1.35 6.08 0.0490 8.2
5 3/02/74* 1.68 14.34 0.0736, 23.1
2 3/12/74* 2.07 18.7 5 0.0566 ( 38,8
8 3/20/74* 1.65 6.24 0.0328 10.3
13 3/22/74* 2.71 16 i 31 0.0438 44.2
10 4/24/74 1.17 8.88 0.0357 10.4
. 11 4/28/74* 1.65 10.18 0.0474 16.8
4 . 6/14/74* 1.67 10.64 0.057 6 17.8
6 6/19/74 1.25 11.08 0.0743 13.8
average of two samples
55
Sol
ids
con
cen
tra
tio
n,
gr/
ml 0.9
0.8
0.7
0.6
100 200 300 400 500 600 700 800Time, minutes
Figure 13. Variation in solids concentration with time for run 061474.
UiON
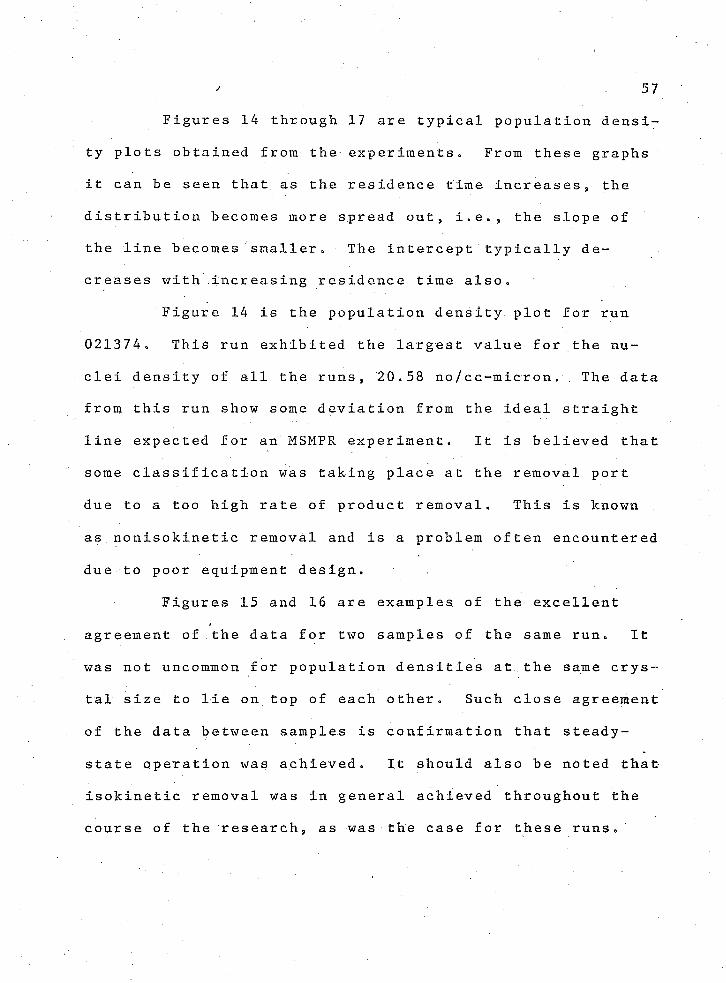
/ 57
Figures 14 through 17 are typical population de n s i
ty plots obtained from the e x p e r i m e n t s • From these graphs
it can be seen that as the residence time increases, the
distribution becomes more spread out , i.e., the slope of
the line becomes smaller. The intercept typically d e
creases with increasing residence time also.
Figure 14 is the population density, plot for run
021374« This run exhibited the largest value for the n u
clei density of all the runs, 20.58 n o /c c - m i c r o n . . The data
from this run show some deviation from the ideal straight
line expected for an MSMPR experiment. It is believed that
some classification was taking place at the removal port
due to a too high rate of product removal. This is known
as.nonisokinetic removal and is a problem often encountered
due to poor equipment design.
Figures 15 and 16 are examples of the excellent
agreement of the data for two samples of the same r u n . It
was not uncommon for population densities at the same crys
tal size to lie on top of each other. Such close agreement
of the data between samples is confirmation that steady-
state operation was achieved. It should also be noted that
isokinetic removal was in general achieved throughout the
course of the research, a is was the case for these r u n s .

5810 0 p*’**™0*1
Crystal 1izer Temp = 100*F= 800 RPMAgitation
Sat. KC1 Feed Temp= 160°F
•o
Q.S.
0.01
200 400 600 800 1000Crystal size, microns
Figure 14. Population density vs crystal size , run 0213 74.

100t = 60 mi nCrystallizer Temp = 100°F Agitation = 750 RPM Sat. KC1 Feed Temp= 160°F
CL
O.OI
O.OOI 200 600 800400 1000Crystal size, microns
Figure 15. Population density vs crystal size, run 031274

60100
Crystallizer Temp = 90°F Agi tation = 750 RPM Sat. KC1 Feed Temp= 160°F
in
*oo Sample # I □ Sample # 2
Q.
0.01
0.001 800200 400 600 1000Crystal size, microns
Figure 16. Population density vs crystal size, run 0614 74 .

61100
Crystallizer Temp = 80°F Agitation Sat. KC1 Temp
= 800 RPM = 140°F
*oc 0.1
Cl
0.01
0.001 200 400 600 800 1000Crystal s ize, m icrons
Figure 17. Population density vs crystal size, run 022674.

62
Figure 17 is the population density plot for run
022674. This run had the lowest nuclei density of all the
experiments, 6.08 n o /c c - m i c r o n . This run was subject to
very low driving forces since it had a long retention time
combined with a low temperature difference between feed and
cry s t a l l i z e r .
The population density plots for the remainder of
the runs can be found in Appendix A.
The log of the nucleation rates calculated using
Equation 18 are plotted against the log of the growth rate
in Figure 18. If nucleation is assumed to be independent
of the solids concentration, then the kinetic parameters
for the m o d e l :
B° = knG 1 (21)
can be evaluated from such a plot. This type of model was
used by Genck and Larson (197 2) . Their results for k^ have
previously been given in Table 2. For i, Genck and Larson
found a value of 2.55. Figure 18 indicates that the best
value for i from this data is 1.99.
It should be pointed out that Genck and Larson did
not use a habit modifier and reported that their product
crystals were mostly a g g l o m e r a t e s . The growth rates found
in their study were an order of magnitude larger than those

Nuc
leat
ion
Rat
e,
no
/cc-
min
63100
1.99
10 - °
2 4 6 8 10Growth Rate, m ic ro n s /m in u te
figure 18. Nucleation rate as a function of growth rate

64
found in this study. It was mentioned earlier that exces
sive agglomeration could result in larger than normal
growth r a t e s . The work of Genck and Larson appears to sup
port this idea. The discrepancy in the values for i is
very likely attributable to the agglomerated product.
The data collected in this work was fitted to a
model of the f o r m :
B° = knG 1M Tj (RPM)k l e x p[k2/T] (22)
This type of correlation has been found to be suitable for
other systems (Randolph and Cise 1972 , Randolph and Young-
quist 19 7 2) . A multiple linear regression computer program
was used to fit the data. This resulted in the following
c o r r e l a t i o n :
B ° = exp[17 .3]G2,05M T 0 , 8 7 (RPM)_ 1,l4exp[-2885/T] (23)
where temperature is in degrees R a n k i n e . The analysis of
variance for this correlation is given in Table 8. The m o d
el has an R 2 value of 0.914 for a correlation coefficient
of 95.,6%. However agitation and temperature are revealed
to be insignificant variables at an F-level of 9 5% and even
much l o w e r . These two variables were discarded and the d a
ta was refitted to a simpler model. The correlation resul
ting from this procedure is:
65
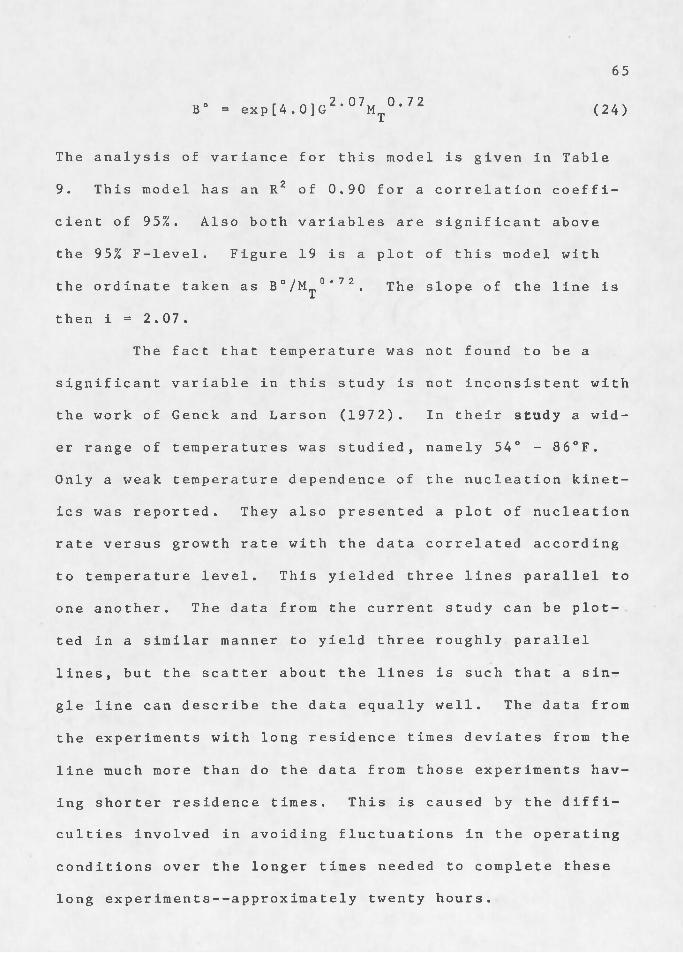
B° = exp[4.0]G2e07M T 0,72 (24)
The analysis of variance for this model is given in Table
9. This model has an R 2 of 0.90 for a correlation coef fi
cient of 95%. Also both variables are significant above
the 9 5% F-level. Figure 19 is a plot of this model with
the ordinate taken as B °/M ^ 0 * 7 2 „ The slope of the line is
then i = 2.07.
The fact that temperature was not found to be a
significant variable in this study is not inconsistent with
the work of Genck and Larson (1972). In their study a w i d
er range of temperatures was studied, namely 54° - 8 6 ° F .
Only a weak temperature dependence of the nucleation kinet
ics was reported. They also presented a plot of nucleation
rate versus growth rate with the data correlated according
to temperature level. This yielded three lines parallel to
one another. The data from the current study can be plot
ted in a similar manner to yield three roughly parallel
lines, but the scatter about the lines is such that a sin
gle line can describe the data equally well. The data from
the experiments with long residence times deviates from the
line much more than do the data from those experiments h a v
ing shorter residence times. This is caused by the d iffi
culties involved in avoiding fluctuations in the operating
conditions over the longer times needed to complete these
long experiments--approximately twenty hours.

66
Table 8» Analysis of Variance, Four Parameter Model
Source of Degrees Sum of MeanVariation of Freedom Squares Square
G 1 3.710 3.710 75.5
m t 1 0.422 0.422 8 . 60
RPM 1 0.017 0.017 0.34 6
T 1 0.055 0.055 1.12
Residual 8 0.393 0.049
Total 12 4.597
Table 9« Analysis of V a r i a n c e , Two Parameter Model
Source of Variation
Degrees of Freedom
Sum of Squares
MeanSquare F-Ratio
G 1 3.710 3.710 79.8
m t 1 0.422 0.422 9.08
Res idual 10 0.465 0.046 5
Total 12 4.597

67
1000
2.07
CM
100
O 80°F □ 90°F AlOO°F
6 8 102 4Growth Rate, m ic ro n s /m in u te
Figure 19. Nucleation rate as a function of growth rate and solids concentration.

68
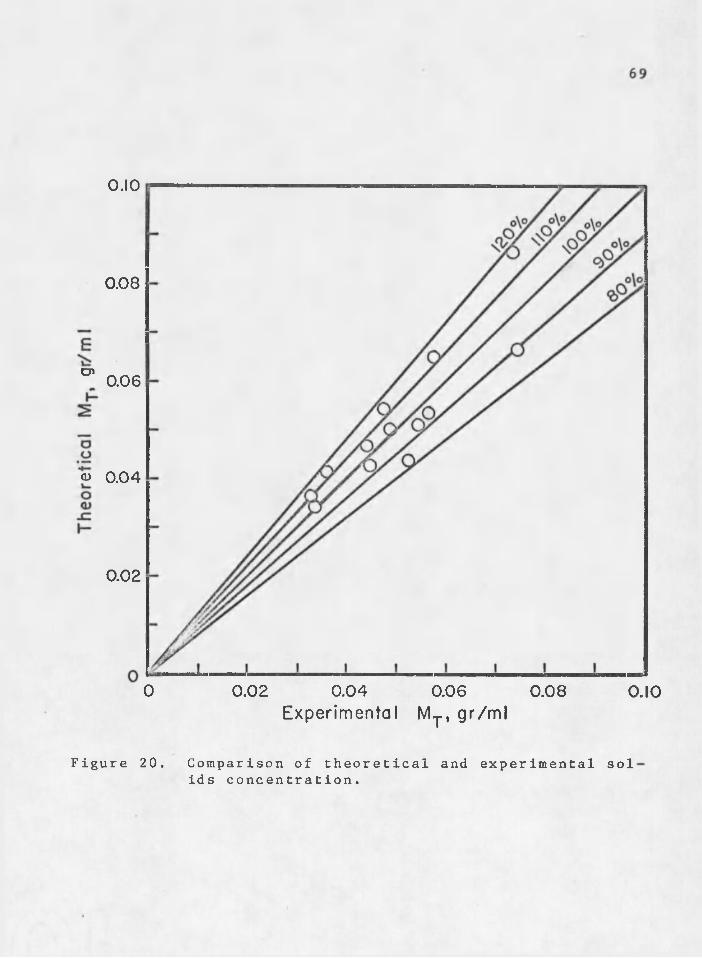
The solids concentration measured experimentally is
compared to the theoretical value in Figure 20. The theo
retical values were calculated using Equation 14 » This
type of comparison is a consistency check on the data. It
can be seen from the figure that all of the points lie
within ±20% of the 45° line which would be a perfect check
of the d a t a , *
A mass balance around the crystallizer could not be
m a d e , Feed and crystallizer suspension samples were to
have been titrated to measure their potassium concentra
tions, Difficulties arose in this procedure which could
not be resolved. These involved the pH sensitivity of the
reaction being used to indicate the end point. In the few
control samples that were titrated the end point was ex
tremely difficult to identify. The purpose of the mass
balance was to obtain a measure of the supersaturation and
the driving forces in the system. Since potassium chloride
is a Class II system, supersaturation should have been im
measurably small. This was the case for Genck and Larson
(197 2) who found that the crystallizer suspension was es
sentially at the saturation concentration for the operating
t emper a t u r e , It would have enhanced this study to have
been able to make this measurement but it was in no means
critical to the results.
0.10
0.08
cn 0.06
<v 0.04
0.02
0 0.02 0.04 0.080.06 0.10Exper imenta l M y , g r / m l
Figure 20. Comparison of theoretical and experimental sol ids concentration.

70Stability Analysis
It was soon discovered that internal classification
of the product stream was occurring at the removal port <,
Furthermore, this classification was of such magnitude as
to make the crystal-size distribution unstable. By rota
ting the removal port through 180*, so that the port poin
ted down instead o f . u p w a r d , classification was reduced
enough to stabilize the C S D „ This was an unlooked-for r e
sult and caused rethinking of the experimental plan o The
use of the wet screen was subsequently discontinued in lieu
of using the removal port as a source of classification.
This provided an non-off switch" for CSD i n s t a b i l i t y .
A series of nine experiments was conducted with the
R-z equipment to study CSD stability. The results of these
experiments are summarized in Table 10. The listed values
of the solids concentration of the unstable runs are the
averages about which cycling occurred.
The effect on the CSD of fines removal without li
quor advance was insignificant, as seen in Figure 21. This
is a. combined population density plot for runs 2/22/74 and
2/27/74. The two sets of data agree so well that a single
line has been used to fit the data. Better agreement could
not be expected between two experiments. It is to be c o n
cluded from this plot that the fines removed from the crys-
tallizer either were not being dissolved, they were removed
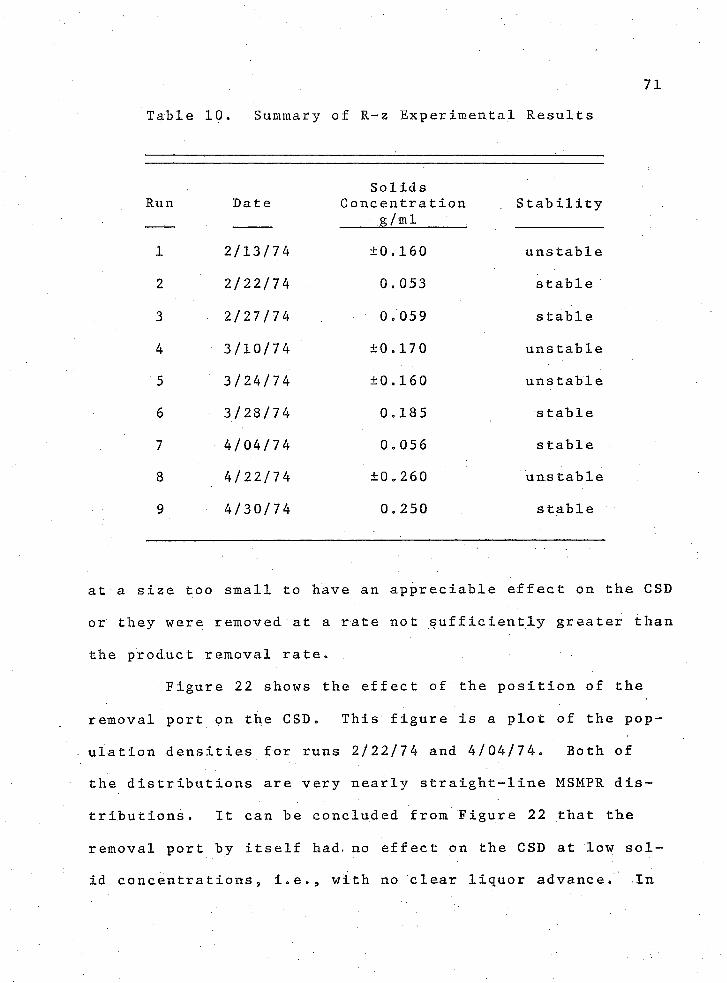
71Table 10. Summary of R-z Experimental Results
SolidsRun Date Concentration Stability g/ml ___________
1 2/13/74 ±0.160 unstable
2 2/22/74 0.053 stable
3 2/27/74 0.059 s table
4 3/10/74 ±0.170 unstable
5 3/24/74 ±0.160 unstable
6 3/28/74 0.185 stable
7 4/04/74 0.056 stable
8 4/22/74 ±0.260 unstable
9 4/30/74 0.250 stable
at a size too small to have an appreciable effect on the CSD
or they were removed at a rate not sufficiently greater than
the _ product removal rate*
Figure 22 shows the effect of the position of the
removal port on the C S D » This figure is a plot of the p o p
ulation densities for runs 2/22/7 4 and 4/04/74. Both of
the distributions are very nearly straight-line MSMPR d i s
tributions o It can be concluded from Figure 22 that the
removal port by itself had* no effect on the CSD at low sol
id con c e n t r a t i o n s 9 i . e . , with no clear liquor advance. In

Popu
latio
n de
nsit
y,
n,
no./c
c sl
urr
y-m
icro
n
72
100.0
10.0
i.o
o.i
_ O N o f i n e s r e m o v a l , n o l i q u o r a d v a n c e
D F i n e s r e m o v a l , n o l i q u o r a d v a n c e ( R = 5 )
0.01 200 600 1000 1200400 800Size, L , microns
Figure 21. Effect of fines removal on CSD.

Popu
latio
n de
nsit
y,
n, no
./cc
slur
ry
-mic
ron
73
100.0
10.0
1.0
0.1
Port up
O R e m o v a l p o r t " u p "
- □ R e m o v a l p o r t " d o w n 1P o r t d o w n
0.01 200 400 600 800 1000 1200Size, L , microns
Figure 22. Effect of removal port on CSD.

7 4
the presence of liquor advance, CSD form and stability were
found to depend solely on the direction in which the port
was pointing, up or down 0
Runs 3/10/74 and 3/28/74 were conducted under the
same conditions except that for run 3/10/74 the removal
port pointed up and for run 3/28/74 it pointed down* Fig
ure 23 shows the variation in solids concentration for the
two experimentso While the solids concentration for run
3/28/74 maintained a constant value of 0.17 g / m l s for tun
3/10/74 a definite cycling of the solids concentration o c
curred. Runs 4/22/74 and 4/30/74 were matched in the same
manner as these other two experiments. Figure 24 presents
the variation in solids concentration for these experiT .
ments. The same qualitative behavior is observed in this
figure as in Figure 23.
A comparison of Tables 5 and 10 lead to the follow
ing conclusions. First, in every case in which the removal
port pointed down, the CSD was stable. A l s o , w hen liquor
advance was not present, the CSD was always stable. This
includes the case for the removal port pointing up. Only
those runs which had both liquor advance and the removal
port pointing upward exhibited an unstable CSD. One or the
other of these conditions was not sufficient to destabilize
the distribution. It should be noted that clear liquor

Sol
ids
con
cen
tra
tio
n,
gr/
cc
slu
rry
0.20
0.18
0.16
0.14
0.12
- O Run 3 / 1 0 / 7 4 Removal port up -O- Run 3 / 2 8 / 7 4 Removal por t down
0.10 100 200 300 400 500 600 800700 900T im e , m in u te s
Figure 23. Variation of solids concentration with time. Results of experimental crystallization runs 3/10/74 and 3/28/74.
in
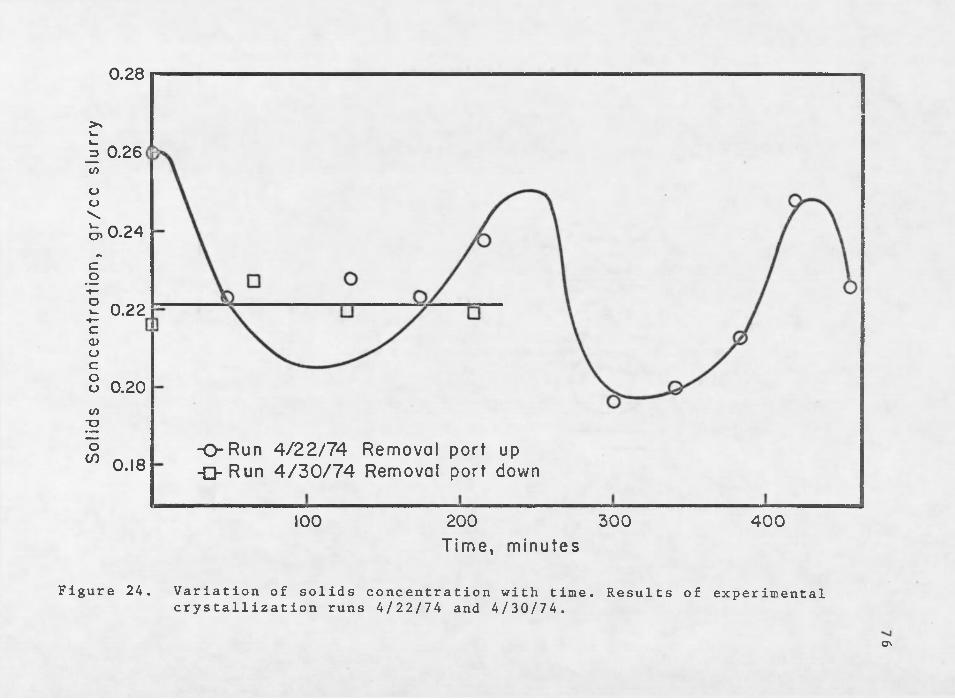
Sol
ids
co
nce
ntr
ati
on
, g
r/cc
sl
urr
y0.28
0.26
0.24
0.22
0.20
- O R u n 4 / 2 2 / 7 4 Removal p o r t up -O- Run 4 / 3 0 / 7 4 Removal po r t down0.18
300200100 400T im e , m in u te s
Figure 24. Variation of solids concentration with time. Results of experimental crystallization runs 4/22/74 and 4/30/74.
OX

77advance greatly decreases the product removal flow rate,^
thus exacerbating the classification effects due to removal
port orientation.
Comput er S imula tion
The purpose of the computer simulation was to show
that such models as the Mark III program can be valuable
tools for crystallizer design. It was also to demonstrate
that the nucleation kinetics observed in the MSMPR experi
ments are independent of the apparatus from which they are
obtained.
The operating conditions of the R-z experiments and
the nucleation kinetics obtained from the MSMPR experiments
were used as input data to the computer program. From the
population density plots of the R-z distributions and a
Stoke*s Law calculation, the various classification func
tions were estimated. This was the weakness of the study.
The first estimates of the classification functions had to
be modified somewhat to fit the data well. This necessity
arose from the internal classification which occurred at the
removal port. Had isokinetic removal taken p l a c e , classifi
cation would have been a controlled and known variable by
the use of the wet screen. Predictions as to CSD stability
could then have been made prior to conducting the experi
ments. As it turned o u t , it was necessary to have the ex
perimental results before the simulation could be d o n e . -

Four of the R-z experiments were modelled, two of
which exhibited stable CSDs and two of which exhibited u n
stable CSDs. Furthermore, the experiments were matched in
such a way that each stable run was conducted under nearly
identical conditions as an unstable run, with the only sig
nificant difference being the position of the removal port.
In terms of the simulation this meant that the only differ
ence in the input data between matched runs was the two
classification functions.
The basic equation which the Mark III program uses
is given by:
In this equation is an average flow rate upon which c a l
culations are based. The removal function C (L) is definedwas :
MSMPR case, Q q (L) is a constant for all L so that a suitable
choice of will result in a C ^ ( L ) function of unity. For
differs from unity depending upon the various removal r a t e s .
(25)
(26)
where Q q (L) is the total rate of removal at size L. For the
a classified product crystallizer with fines removal, (L)

79
It was necessary in the computer simulation to find
suitable values for the C^(L) function in order to fit the
steady-state data. Tables 11 and 12 list some of the v a l
ues of this function which produced the best fits of the
data for the stable and unstable runs m o d e l l e d . There are
three distinct sections in each c a s e . Below a fines size,
k f 5 ^w has a value of R which depends upon the rate at 3 ■ “ ■
which the fines are removed during the e x p e r i m e n t . For the
sizes between L^ and a product size L , C is equal to uni-f p w ^ty o This is the MSMPR section of the d i s t r i b u t i o n . Final
ly, above size L the C function takes on a value of zP wdetermined by the experiment. As is seen from the two ta
bles the two stable runs had much lower values of z than
did the two unstable r u n s . This is consistent with the
work of Beer (197 3) who found that large values for the
product classification rate will destabilize the C S D .
The steady-state CSDs for the four runs are plotted
in Figures 25 - 28. The solid lines are the result of the
computer simulation and the circles represent the actual
experimental data. The data points for the unstable CSDs
were obtained by averaging the data obtained throughout the
experiment on the assumption that the CSD was cycling about
a mean v a l u e .

Table 11. Values of for Modelling of Stable Runs
Lmicrons
• 0
9
10
260
300
340
341
CRun 3/28/74
23.0
23 .0
1. 0
1.01.4
1.8 1.8
Run 4/30/74
20.0 20.01.0 1 o 0
1.4
1.8 1.8
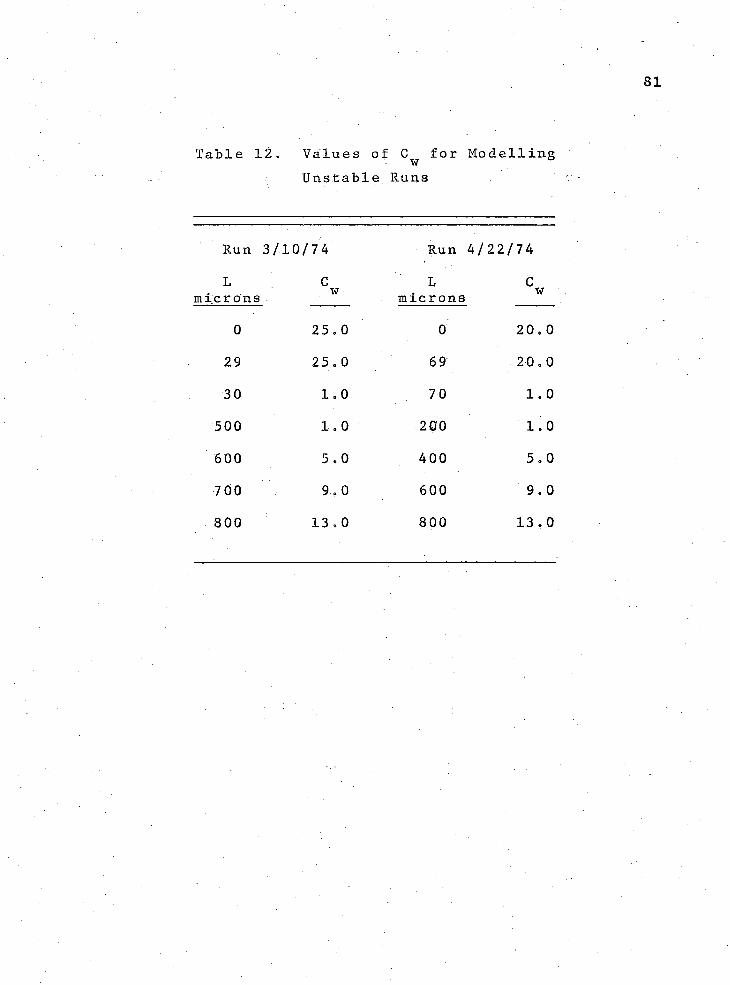
81
Table 12. Values of for Modelling Unstable Runs
Run 3/10/7 4 Run 4/22/74
microns w microns W
0 25.0 0 20.0
29 25.0 69 20.0
30 1.0 70 1.0
500 1.0 200 1.0
600 5.0 400 5.0
700 9.0 600 9.0
800 13.0 800 13,0

Popu
latio
n de
nsity
, n,
no./c
c sl
urr
y-m
icro
n
82
100.0
T = 385 min GCaic " 1-25 microns/minn°calc = 15.6 no/cc-micron (C VJcolc = 0 845 /
10.0
Note: Removal Port in up position
0 T
0.1
0.014 0 0200 6 0 0 8 0 0 1000
Size, L, microns
Figure 25. Time-averaged population density p l o t , run3/10/74.

Popu
latio
n de
nsity
, n,
no
./cc
slur
ry
-mic
ron
100.0
10.0
T = 99 minGCaic =2.28 microns/minn°rn|- = 59.6 no/cc- micron (C.V.)calc =0.966
1.0
Note: Removal Port in down position
0.1
0.01 200 4 0 0 6 0 0 8 0 0 1000Size, L, microns
Figure 26. Time-averaged Population density plot, run3/28/74.

Popu
latio
n de
nsity
, n,
no./c
c sl
urr
y-m
icro
n84
100.0
T = 219 minGcaic = 2.58 microns/min n°calc " 26.9 no/cc-micron (C.V.)c a |c = 1.16810.0
Note: Removal Port in up position
0.018 0 0 1000200 6 0 04 0 0
Size, L, microns
Figure 27. Time-averaged population density plot, run4/22/74.

Popu
latio
n de
nsity
, n,
no./c
c sl
urry
-
mic
ron
85
100.0
T = 92 minGCaic = 230 microns/min n°calc =67.7 no/cc-micron (Cv)calc = 0-947
10.0
1.0
Note: Removal Port in down position
O.Ol 200 4 0 0 6 0 0 8 0 0 1000Size, L, microns
Figure 28. Time-averaged population density plot, run4/30/74.
86The first point to be noted about these four plots
is that in each case a hump appears in the distribution at
the size where classification first b e g i n s « This peculiar
ity is discussed by Nuttall (1971) and is characteristic of
all CSDs from classifying c r y s t a l l i z e r s » The magnitude of
the hump is directly related to the amount of classifica
tion o c c u r r i n g , . The two CSDs with the large humps are the
steady-state averages of the unstable r u n s » The unstable
runs were subject to greater amounts of classification due
to the position of the removal p o r t »
A mechanism for the internal classification is pr o
posed as follows o The action of the agitater forced crys
tals and slurry up the inside of the draft tube and over the
top of the cooling a s s e m b l y « The smaller crystals tended to
be thrown towards the middle of the annulus between the wall
of the crystallizer and the cooling assembly. The larger
c r y s t a l s , because of their greater momentum, were forced
against the crystallizer wall. The removal port was located
near the wall. When the port was in its upward pointing p o
sition the large crystals could flow directly into the port
and out of the c r y s t a l l i z e r . Thus the larger crystals were
preferentially removed and internal classification occurred.
When the port was in its downward pointing position, any
crystal that was to be removed had to be pulled into the

8 7
port. This meant that a change in flow direction had to be
e f f e c t e d , The small crystals could easily make this change.
The large crystals 9 having greater m o m e n t u m 9 resisted the
change in flow direction. Even though there were more large
than small crystals near the port, they could not be removed
as easily as the small crystals. Thus the internal cl assi
fication effect was d e c r e a s e d ,
The classification functions obtained from the
steady-state simulation of the crystal-size distributions
were used as data for the dynamic simulations. The results
of these simulations are presented for the four runs m o d
elled in Figures 2 9 and 30, Stability or instability was
successfully predicted for all four r u n s , Figures 31 and
3 2 are comparisons of the experimental and simulated sol
ids concentration for runs 3/10/74 and 4/22/74 respective
ly, These figures show that the period and magnitude of the
oscillations were accurately predicted. However, the pre
dicted value of the solids concentration was in error.
The Mark III CSD simulater was used in this study
to analyze an operating system. Such questions as "Why does
the CSD cycle?11 and "Why is such a CSD produced ?" can be a n
swered in this manner. It is also possible to use this p r o
gram for crys talliz er design if the kinetics, of the system
are known. The type of CSD likely to be produced, its sta
bility, production and growth rates can be determined before

Sol
ids
co
nc
en
tra
tio
n,
gr/
cc
slu
rry
0.20
0.18 -
0.16 -
0.14 -
0.12 -
0.10
3/10/74
3/28/74
100 200 300 400 500T im e , m in u te s
600 700 800 900
Figure 29. Variation of solids concentration with time, lation of runs 3/10/74 and 3/28/74.
Results of computer simu-
00o o

Sol
ids
co
nc
en
tra
tio
n,
gr/
cc
slu
rry
0.19
0.18
0.17
0.16
0.15
0.14
0.13
Figure 30. Variation of solids concentration with time. Results of computer simu- co lation of runs 4/22/74 and 4/30/74.
Run 4 / 2 2 / 7 4
Run 4 / 3 0 / 7 4
100 200 300 400T im e , m in u te s
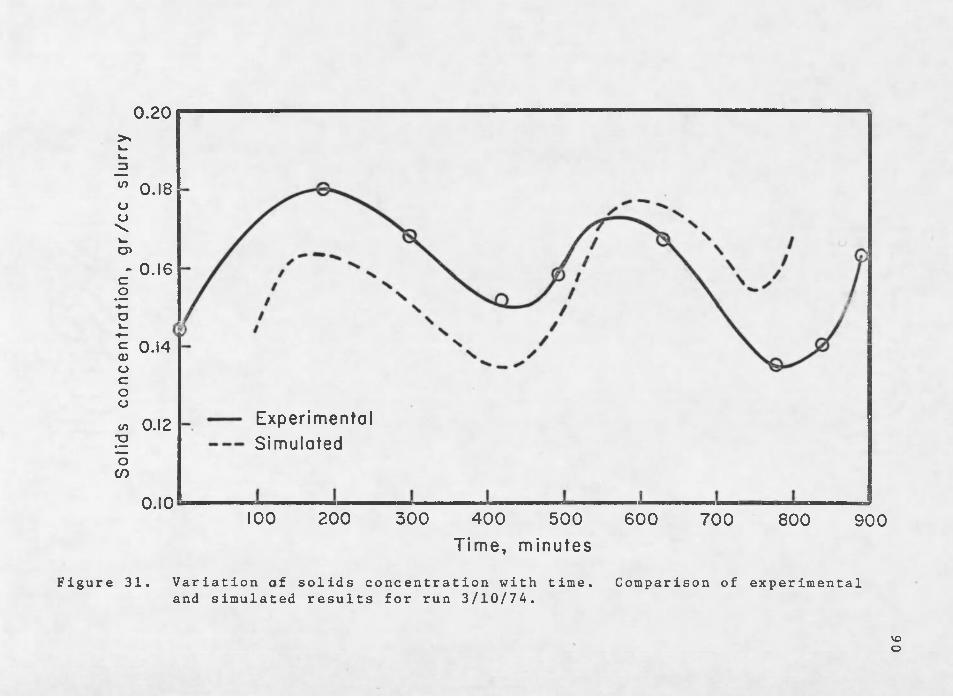
Sol
ids
co
nc
en
tra
tio
n,
gr/
cc
slu
rry
0.20
0.18
0.16
0.14
Exper imenta lSimula ted
0.12
0.10 100 200 300 400 500 600 700 800 900T im e , m in u te s
Figure 31. Variation of solids concentration with time.and simulated results for run 3/10/74.
Comparison of experimental
VOo
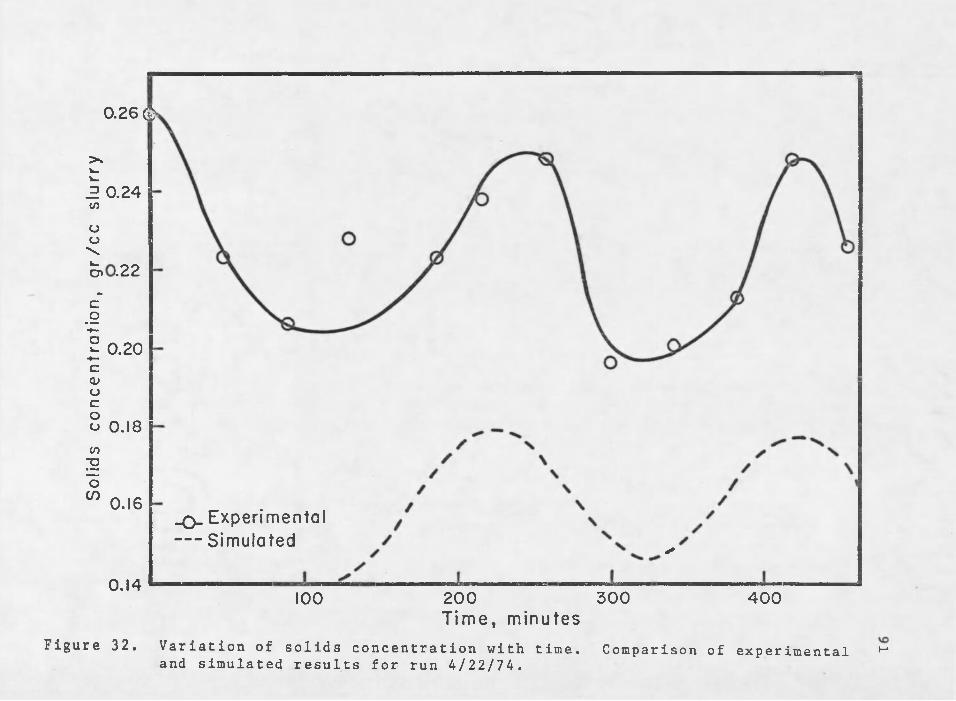
Sol
ids
co
nc
en
tra
tio
n,
gr/
cc
slu
rry
0.26 &
0.24
i.22
0.20
0.18
0.16_Q_ Exper im en ta l — Simula ted ✓
0.14 300 400200100T im e , m in u te s
Figure 32. Variation of solids concentration with time. Comparison of experimental 1-1 and simulated results for run 4/22/74.

92
any experiments are c o n d u c t e d , This type of analysis could
make better use of expensive bench-scale studies. If the
system kinetics are not k n o w n , they can Jbe determined using
relatively simple MSMPR techniques. In this manner much
time and expense can be saved in crystallizer design.
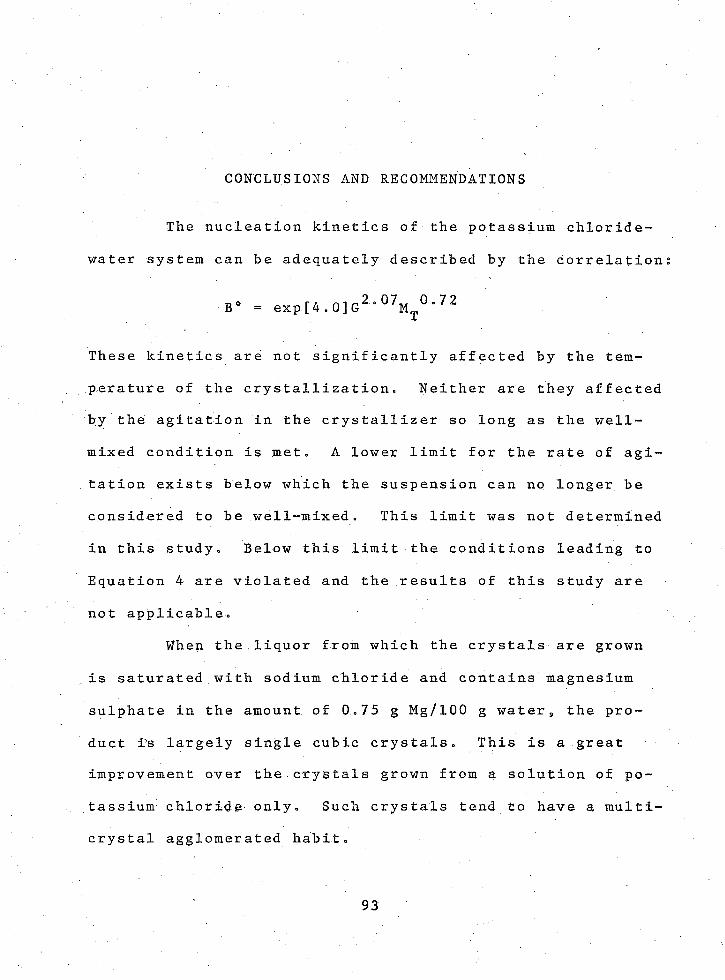
water
These
perature of the crystallization. Neither are they affected
by the agitation in the crystallizer so long as the well-
mixed condition is m e t . A lower limit for the rate of a g i
tation exists below which the suspension can no longer be
considered to be well-mixed. This limit was not determined
in this study. Below this limit the conditions leading to
Equation 4 are violated and the results of this study are
not applicable.
When the liquor from which the crystals are grown
is saturated with sodium chloride and contains magnesium
sulphate in the amount of 0.75 g Mg/100 g water, the pro
duct iA largely single cubic crystals. This is a great
improvement over the.crystals grown from a solution of p o
tassium chloride only. Such crystals tend to have a multi-
crystal agglomerated habit.
CONCLUSIONS AND RECOMMENDATIONS
The nucleation kinetics of the potassium chloride-
system can be adequately described by the correlation
B° = exp[4.0]G2 ‘07M T ° ‘72
kinetics are not significantly affected by the tem-
93

94
Improper crystallizer design can cause cycling of
the crys.tal-size distribution. Nonisokinetic removal of
product due to improper design can increase classification
to such a point that the stability limit is exceeded, caus
ing the CSD to cycle.
Nucleation kinetics determined through MSMPR exper
iments can be used in computer models such as the Mark III
CSD Simulator. This type of program is useful for cr ystal
liz er design and system analysis of operating crysta l l i z e r s .
It was shown in this study that the stability of a crystal-
size distribution can be accurately predicted numerically.
It is also possible to predict the shape of the CSD. The
use of computer simulations enables the designer to test a
number of configurations and operating conditions quickly
and economically to find the best possible design for an in
dustrial c r y s t a l l i z e r .\It is suggested that the MSMPR equipment be rebuilt
so that the crystallizer discharge can be returned to the
feed tank instead of being sent down the d r a i n . This would
stop much waste and eliminate unneeded expense for fresh raw
m a t e r i a l s . It would also allow the experiments to be car-. *
rled out over longer times. Too often an experiment was
unavoidably subjected to a major operational disturbance.
Since insufficient feed stock remained to allow the experi
ment to recover from the disturbance, the run had to be
95
t e r m i n a t e d , An alternative approach would be to let the
discharge go into a surge tank to dissolve the entrained
crystals and attain saturation before allowing it to return
to the feed tank.
The lower limit of the rate of agitation should be
determined and the effects of surpassing this limit inves
tigated. Whereas agitation has no effect on the nucleation
kinetics, when the suspension is well-mixed, it is likely
that there will be an effect if the suspension is not well-
mixed o
The product removal port on the classified product
crystallizer should be redesigned so that isokinetic r e m o v
al of the product can be achieved. Experiments can then be
conducted for which the classification function is known
explicitely by the use of wet screens. Predictions can then
be made using the Mark III program and verified by experi^
ment. This would demonstrate the usefulness of the program
for design purposes o

APPENDIX A
POPULATION DENSITY PLOTS
This section contains all population density plots
generated during the MSMPE kinetic studies and not included
elsewhere in the.text. The specific values for growth rate
and nuclei density obtained from these plots have previous
ly been listed in Table 7.
96

97100
Crystallizer Temp = 90°F Agitation = 800 RPM Sat. KC1 Feed Temp= 160°F
u
*o
CL
0.01
0.001 4000 200 600 800 1000Crystal s ize, microns
Figure A 1 . Population density vs crystal size, run 012274.

98100
Crystallizer Temp = 100°F= 800 RPMAgi tation
Sat. KC1 Feed Temp= 140°F
u
CO
CL
O.OI
0.001 800600200 4000 1000Crystal size, microns
Figure A2. Population density vs crystal size, run 0217 74.

99
Crystal 1izer Temp = 80°F Agitation Sat. KC1 Feed Temp= 140°F
= 750 RPM
o Sample # I □ Sample # 2
Q.
aoi
o.ooi 800 1000600400Crystal s ize, microns
200
Figure A3. Population density vs crystal size, run 02217 4.
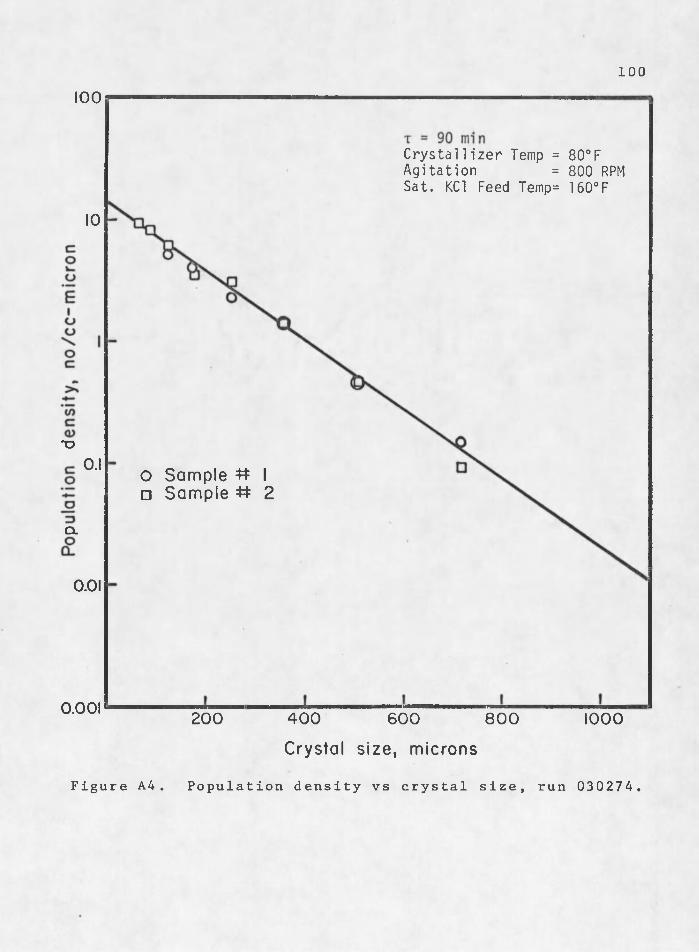
100100
Crystallizer Temp = 80°F Agitation Sat. KC1 Feed Temp= 160°F
= 800 RPM
10
*u0.1
o Sample # I □ Sample # 2
Q.
0.01
0.001 200 400 600 800 1000Crystal size, microns
Figur e A4 . Population density vs crystal size. run 03 027 4.

101100
Crystal 1izer Temp = 100°F= 7 5 0 RPMAgi tation
Sat. KC1 Feed Temp= 140°F
"O
o Sample # I □ Sample # 2
Q.
0.01
0.001 200 400 600 800 1000Crystal s ize, microns
Figure A 5 . Population density vs crystal size, run 032074.

102100
Crystal!izer Temp = 80°F Agitation = 750 RPM Sat. KC1 Feed Temp= 140°F
*o
Cl
O.OI
0.001 200 400 600 800 1000Crystal size, microns
Figure A 6 . Population density vs crystal size, run 032274.
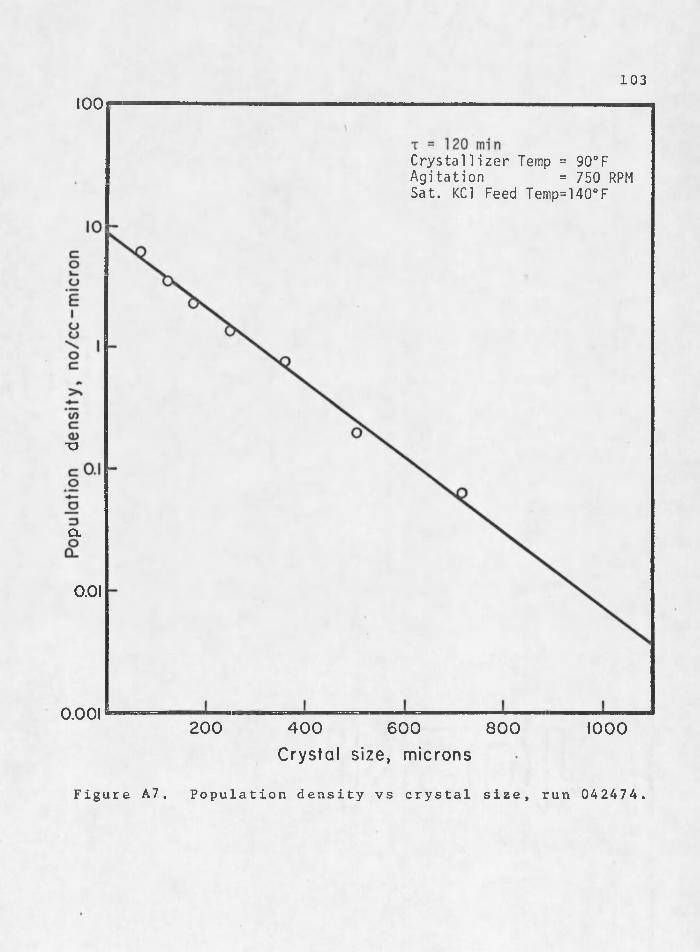
103100
Crystal!izer Temp = 90°F= 750 RPMAgitation
Sat. KC1 Feed Temp=140°F
T3
CL
0.01
0.001 200 400 600 800 1000Crysta l size, microns
Figure A 7 . Population density vs crystal s i z e , run 042474 .
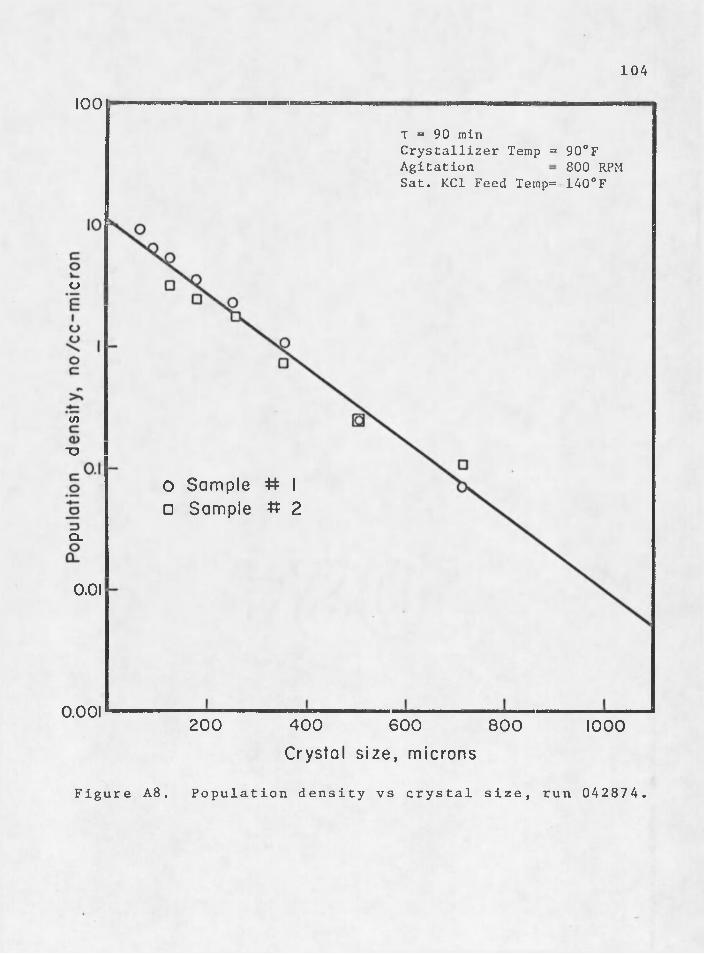
104
100T = 90 mlnCrystallizer Temp = 90°F Agitation 800 RPM Sat. KC1 Feed Temp= 140°F
u
tn
"O
0 Sample # I a Sample # 2
Q.
0.01
0.001 200 400 600 800 1000Crystal s ize, microns
Figure A 8 . Population density vs crystal size, run 042874.

100x = 0 minCrystallizer Temp = 80°F
= 750 RPMAgitation Sat. KC1 Feed Temp= 60°F
*o
CL
O.OI
O.OOI 200 400 800600 1000Crystal size, m icrons
Figure A9. Population density vs crystal size, run 06197 4.
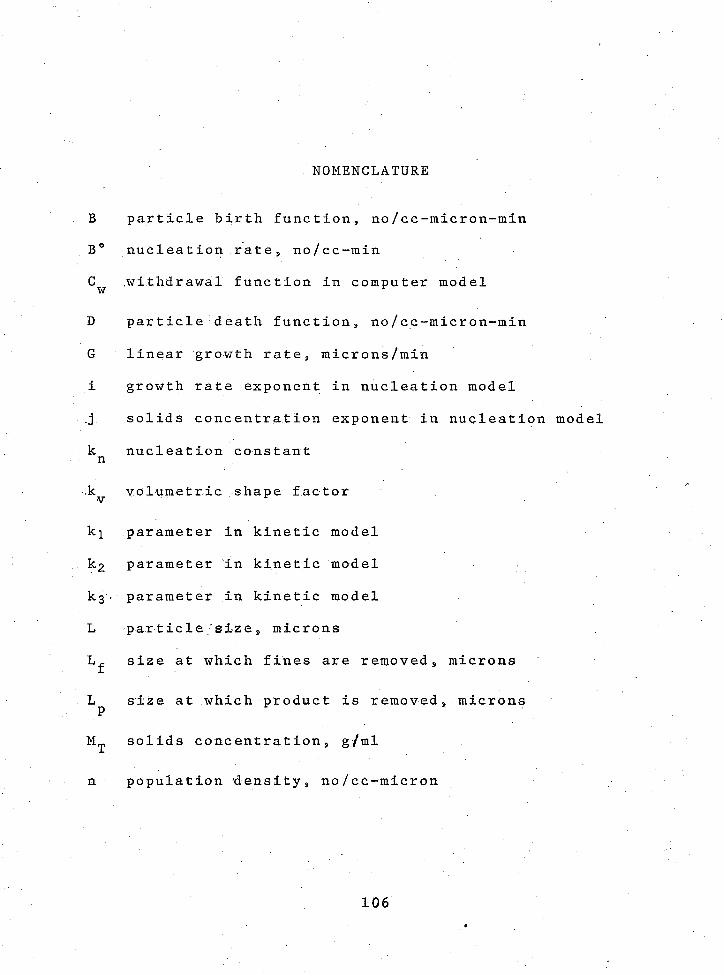
NOMENCLATURE
B particle birth f u n c t i o n , no/cc-micron-min
B 6 nucleation rate, no/cc-min
C .withdrawal function in computer modelw
D particle death function, no/cc-micron-min
G linear growth rate, micro ns/min
i growth rate exponent in nucleation model
j solids concentration exponent in nucleation model
k nucleation constantn
•-'k volumetric shape factor
ki parameter in kinetic model
k 2 parameter in kinetic model
k g , parameter in kinetic model
L particle size, microns
size at which fines are removed, microns
L size at which product is removed, micronsPM^ solids concentration, g/ml
n population density, no/cc-micron
106
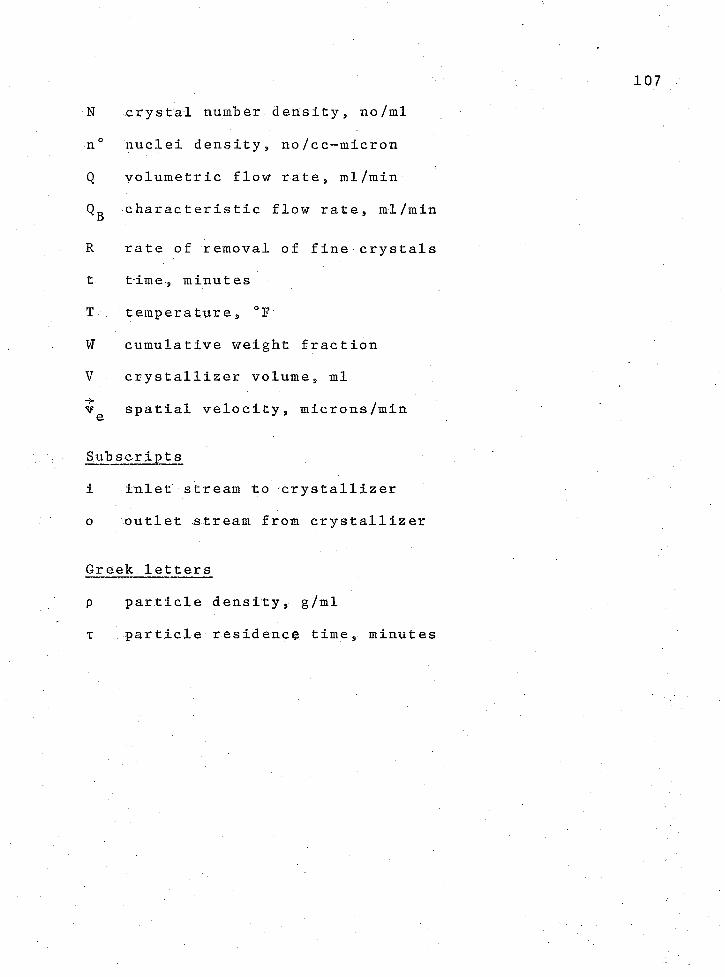
N crystal number density, n o /ml
n° nuclei density, no/cc-micron
Q volumetric flow rate, ml/min
Qg characteristic flow rate, ml/min
R rate of removal of fine crystals
t time, minutes
T temperature, °F
W cumulative weight fraction
V crystallizer volume, ml
v e spatial velocity, microns/min
Sub s cr i p t s
i inlet stream to crystallizer
o outlet stream from crystallizer
Greek letters
p p a r t i c l e d e n s i t y , g / m l
t p a r t i c l e r e s i d e n c e t im e , m i n u t e s

)
REFERENCES
Beer s Go L » 11 The Stability of Classified Cryst allizer s 9 n m a s t e r ?s thesis 9 University of A r i z o n a (197 3)»
Genck 9 Wo Jo and Mo A , Larson* "Temperature Effects.ofGrowth and Nucleat ion Rates in Mixed Suspension Crystallization," AIChE Symposium Series N o » 121, 6 8 ,57 (1972) *'
Hulbert, H* M , and S. Katz* "Some Problems in Particle Technology, A Statistical Mechanical F o r m u l a t i o n ," Chemical Engineering S c i e n c e , 1^, 555 (1964.) »
" K a l i u m v s Potash Solution Mining Plant Will Go On-Strearn this Fall in Canada," Engineering and Mining Journal No* 6, 1_65_, 110(1964) *
L e s s i e u x , J « C 0 and D 0 Svoronos » " Sur la Cristallisationdu Chlorure de Potassium en Solution Aqueuse," Comptes Rendus de 1 vAcademie des S c i e n c e s , Series C , No * 19, 2 6 3 , 1146(1966).
Noyes, R * Potash and Potassium F e r t i l i z e r s , Chemical Process Monograph, 15(1966)*
Nut tall , Ho Eo "Computer Simulation of Steady-State andDynamic C r y s t a l l i z e r s ," Ph »D 0 Dissertation, University of A r i z o n a (1971) o .
O t t e n s , Eo P * K» Laboratory notebook on crystal-size d i s tribution stability experiments. Chemical Engineering D e p a r t m e n t , University of A r i z o n a ( n o d •)•
Randolph, A* D , "A Population Balance for Countable Entities ," Canadian Journal of Chemical E n g i n e e r i n g , 4 2 , 28 0 ( 1 9 6 4 ) o
Randolph, A* Do and M * D » Cise * "Nucleation Kinetics of the Potassium Sulphate-Water System," AIChE J o u r n a l , 18, 798(1972)*
108

109
Randolph, A. D. and M . A. Larson. "Transient and Steady-State Size D i s t r i b u t i o n s ," AIChE Journal, 8, 639(1962).
Randolph, A. D . and M. A. Larson. Theory of Particulate P r o c e s s e s , Academic P r e s s (1971).
R a n d o l p h , A. D . and G . R. Youngquist. "Secondary Nuclea- t ion in a Class II System: Ammonium S u l p h ate-Water,"AIChE Journal , 1_8 , 421 (1972).
Saeman, W. C. "Crystal-Siz e Distribution in Mixed Suspensions," AIChE J o u r n a l , _2 , 107 (1956).

12rx /\ rr 1 o