Embed Size (px)
Citation preview
Nuclear Structure Investigation UsingParticle-Gamma Coincidence Technique
THESISSUBMITTED TO THE MAHARAJA
SAYAJIRAO UNIVERSITY OF
BARODA
IN THE FACULTY OF SCIENCE
FOR THE DEGREE OF
DOCTOR OF PHILOSOPHYin
PHYSICS
Rakesh Kumar
Department of PhysicsM.S.UNIVERSITY OF BARODA
VADODARA-390002, INDIA
December 2010

1
Preface
In this doctoral thesis the poorly known B(E2;0+→2+) values of 112Sn and 114Sn havebeen measured to high precision. Two experiments were performed to determine the reducedtransition probabilities of 112Sn and 114Sn relative to 116Sn in order to minimize the system-atic errors. The experiments were performed to improve these crucial data points and tofirmly establish the location of the unexpected sudden change of B(E2)-values along the Snisotopic chain. At GSI Helmholtzzentrum fur Schwerionenforschung, Darmstadt, Germany,we performed two consecutive measurements using 114Sn and 116Sn beams on a 58Ni target. Inthe experiment carried out at Inter University Accelerator Centre (IUAC), New Delhi, India,targets of 112Sn and 116Sn were bombarded with a 58Ni beam. The obtained B(E2;0+→2+)values of 0.242(8) e2b2 and 0.232(8) e2b2 for 112Sn and 114Sn respectively, are not consistentwith the recent large scale shell model (LSSM) calculations. The results confirm the ten-dency of large B(E2) values for lighter tin isotopes below the mid-shell 116Sn nucleus, thathas been observed recently in various radioactive ion beam experiments.
In neutron deficient Sn isotopes for which Coulomb excitation experiments are presentlynot possible due to lack of sufficient beam intensities, decay studies can be performed toobtain the level scheme in these exotic nuclei. In a fragmentation reaction, angular momentaare transferred to the nuclei of interest, which can be measured after the separation in thefragment separator (FRS) using an effecient gamma array. These experiments require anactive stopper detector in order to measure the implantation of the heavy ions as well as itsdecay peoperties such as electrons, protons and alpha particles. In the second part of thethesis the realization of the active stopper consisting of six double sided silicon strip detector(DSSSD) is discussed.

2
Acknowledgment
My thesis work involved a significant number of collaborators, and am indebted to allof them for bringing this thesis to its conclusion. It gives me great pleasure to acknowl-edge my indebtness to Dr. S. Mukherjee, my thesis supervisor, for invaluable guidance andencouragement during the course of this thesis work and motivating me to carry out thisinvestigation in the field of nuclear structure. I wish to thank Dr. Amit Roy, Director ofIUAC, for allowing me to carry out this thesis work and extending all the necessary support.
Words are insufficient to express my heartfelt thanks to Dr. R.K. Bhowmik, for hisconstant support, active involvement and valuable suggestions at every stage of this researchwork, especially during the data analysis. I really learnt from him “what is called dedication”.I owe a debt of gratitude to Dr. Pieter Doornenbal for proposing the experiment at GSI andallowing me to perform the second part of the experiment at IUAC. I thank Mr. AkhilJhingan for his great interest in the particle detection system, his design of the mechanicalstructure for the IUAC experiment, his support in the preparation phase and during theexperiment. I especially want to thank Mr. S. Muralithar for allowing me to pursue thiswork, for his help during the preparation and analysis of the experiment.
My sincere thank also goes to Mr. E.T. Subramaniam and Ms. Kusum Rani for theirimmense help for the electronics and data acquision system during the experiment. I alsoacknowledge the help of Mr. Rajeev Ahuja, Mr. Pradeep Barua ,Mr. Ashok Kothari, Mr. S.K.Saini for their immense effort for installing the mechanical structure and Clover detectors.
I gratefully acknowledge the help from the Pelletron staff at IUAC especially Dr. SandeepChopra and Mr. Sunil Ojha for the smooth operation of the machines during my experiment.
I am grateful to my collaborators and colleague Mr. R.P. Singh, Dr. Pushpendra.P. Singh,Dr. S. Mandal, Mr. I. Kojouharov, Dr. M. Gorska, Dr. J. Gerl for there kind support duringthe thesis. I must thank Mr. S. Appannababu, Ms. R. Garg, Ms. J. Kaur, Mr. D. Siwal, Ms.A. Sharma for collaborating in the experiment.
I must thank the the RISING collaboration for showing the faith in assigning me thejob of developing the beta counting system. Of course, the success of develoment would nothave been achieved without the hardwork of all of YOU guys - the local RISING family.Thanks to Pieter Doornenbal for all the help, whenever I asked you, Mr. I. Kojouharov foryour advice regarding these delicate detectors, Mr. W. Prokopowicz for the help providingfor the detection chamber, your expertise in the field is of all mechanical questions, Mr. H.Schaffner and Mr. Nick Kurz for the data acquisition. Special thanks to Pancho during allthe critical moments while testing active stopper. I also thank Dr Stephane Peitri for hiskind support during this development.
I am also greateful to Dr. Jurgen Gerl, Dr. Christoph Scheidenberger and Dr. Hans Emlingthe former head of KPII group for supporting my visit and stay at GSI. I also acknowledgethe help of Dr. B. Rubio, Dr. P. Regan, Dr. J. Benlliure, who financially supported theactive stopper project. I also thank Dr. E. Casarejos, Dr. A. Algora and Dr. Zs. Podolyakfor providing the help during testing of active stopper with and without beam. A special

3
thanks to Dr. S. Tashenov for showing great interest in our work and taking the initiativefor doing the simulation for this detector.
I express my indebtedness to Prof. A. C. Sharma, Head of the Department, M.S. Uni-versity of Baroda, Vadodara, for providing me all the necessary facilities during the courseof these investigations. I also wish to thank Prof. C. F. Desai, former Head, Physics Depart-ment and Prof. N. L. Singh for their encouragement. I express my regards to all the staffmembers of the Physics Department for their cooperation.
I offer a big special thanks for which the words are insufficient to Hans Jurgen Wollersheimfor scientific, financial support and for teaching me every thing about Coulomb excitationand active stopper and for the hours of interesting conversations and for forcefully keepingme in track through out my thesis. This thesis would not have been possible without yourhelp . Well I really learnt how the things are done step by step and paitiently . I will neverforget the nice moments which I have spent in your office and those three days of hard workin fort Unchagaon in INDIA where we almost worked for 12 hours a day. I am still learninghow to organise things in proper orderly way. A special thanks to Renate for moral support.
Finally, I would like to thank all of my friends and family that were supportive as I workedtoward the completion of this work. Thanks to Fouran Singh for encouraging me to do thesis,a big thanks to Sonti for helping me through out my thesis work also a big thanks for takingcare of my cars when ever I was away. Thanks to Thomas for all the support and help.Thanks to my small friends Abhishek and honey for short drives and picnic trips we madewhen ever i felt little depressed. I express my thanks to Jean Claude Pivin and AbhishekYadav for there kind support. My grandmother (Mrs. Praksho Devi), my grandfather (Mr.Kanshi Ram), who could not survive to see this thesis, my wife (Kamna), my son (Aditya),my mom, you were a big inspiration to me, my dad, my sister, my brother and my father-in-law, you were more than a father to me in this whole period. Thank you for everything.Ive appreciated all of your support and encouragement, and Im thankful that I always knewthat you all were proud of me.
There are hundreds of other people to thank, and if youre reading this, youre probablyone of them. So, thank you!
(Rakesh Kumar)

4
List of Publications
A. Publications in International Journals:
1. Two-proton alignment and shape changes in 65ZnB. Mukherjee, S. Muralithar, R. P. Singh, R. Kumar, K. Rani, R. K. Bhowmik andS. C. PancholiPhys. Rev. C 64, 024304 (2001).
2. γ-ray spectroscopy of odd-odd 62CuB. Mukherjee, S. Muralithar, R. P. Singh, R. Kumar, K. Rani, and R. K. BhowmikPhys. Rev. C 63, 057302 (2001).
3. Recoil distance lifetime measurements in 118XeI. M. Govil, A. Kumar, Hema Iyer, P. Joshi, S. K. Chamoli, R. Kumar, R. P. Singh,and U. GargPhys. Rev. C 66, 064318 (2002).
4. Search for entrance channel effects in heavy ion induced fusion reactions via neutronevaporationAjay Kumar, A. Kumar, G. Singh, B. K. Yogi, R. Kumar, S. K. Datta, M. B. Chat-terjee, and I. M. GovilPhys. Rev. C 68, 034603 (2003).
5. Complete and incomplete fusion reactions in the 16O+169Tm system: Excitation func-tions and recoil range distributionsManoj Kumar Sharma, Unnati, B. K. Sharma, B. P. Singh, H. D. Bhardwaj, R. Ku-mar, K. S. Golda, and R. PrasadPhys. Rev. C 70, 044606 (2004).
6. Anomalous behavior of the level density parameter in neutron and charged particleevaporationAjay Kumar, A. Kumar, G. Singh, Hardev Singh, R. P. Singh, R. Kumar, K. S.Golda, S. K. Datta, and I. M. GovilPhys. Rev. C 70, 044607 (2004).
5

6
7. Lifetime measurements in 112SbA. Y. Deo, S. K. Tandel, S. B. Patel, P. V. Madhusudhana Rao, S. Muralithar, R. P.Singh, R. Kumar, R. K. Bhowmik and AmitaPhys. Rev. C 71, 017303 (2005).
8. Observation of antimagnetic rotation in 108CdP. Datta, S. Chattopadhyay, S. Bhattacharya, T. K. Ghosh, A. Goswami, S. Pal, M.Saha Sarkar, H. C. Jain, P. K. Joshi, R. K. Bhowmik, R. Kumar, N. Madhavan, S.Muralithar, P. V. Madhusudhana Rao, and R. P. SinghPhys. Rev. C 71, 041305 (R) (2005).
9. Systematics of the shears mechanism in silver isotopesA. Y. Deo, S. B. Patel, S. K. Tandel, S. Muralithar, R. P. Singh, R. Kumar, R. K.Bhowmik, S. S. Ghugre, A. K. Singh, V. Kumar and AmitaPhys. Rev. C 73, 034313 (2006).
10. Fission hindrance studies in 200Pb: Evaporation residue cross section and spin distri-bution measurementsP. D. Shidling, N. M. Badiger, S. Nath, R. Kumar, A. Jhingan, R. P. Singh, P.Sugathan, S. Muralithar, N. Madhavan, A. K. Sinha, Santanu Pal, S. Kailas, S. Verma,K. Kalita, S. Mandal, R. Singh, B. R. Behera, K. M. Varier, M. C. RadhakrishnaPhys. Rev. C 74, 064603 (2006).
11. Shape changes at high spin in 78KrA. Dhal1, R. K. Sinha1, P. Agarwal, S. Kumar, Monika, B.B. Singh, R. Kumar, P.Bringel, A. Neusser, R. Kumar, K.S.Golda, R.P. Singh, S. Muralithar, N. Madhavan,J.J. Das, A.Shukla, P.K.Raina, K.S.Thind, A.K. Sinha, I.M. Govil, P.K. Joshi, R.K.Bhowmik, A.K. Jain, S.C. Pancholi, and L. ChaturvediEur. Phys. J. A 27, 3336 (2006).
12. Rotational structures in the 125Cs nucleusK. Singh, S. Sihotra, S.S. Malik, J. Goswamy, D. Mehta, N. Singh, R. Kumar, R.P.Singh, S. Muralithar, E.S.Paul, J.A. Sheikh, and C.R. PraharajEur. Phys. J. A 27, 321324 (2006).
13. Loss of collectivity in 79RbR.K. Sinha, A. Dhal, P. Agarwal, S. Kumar, Monika, B.B. Singh, R. Kumar, P. Bringel,A. Neusser, R. Kumar, K.S. Golda, R.P. Singh, S. Muralithar, N. Madhavan, J.J. Das,K.S. Thind, A.K. Sinha, I.M. Govil, R.K. Bhowmik, J.B. Gupta, P.K. Joshi, A.K. Jain,S.C. Pancholi and L. ChaturvediEur. Phys. J. A 28, 277281 (2006).

7
14. Band structure in 83Rb from lifetime measurementsS. Ganguly, P. Banerjee, I. Ray, R. Kshetri, S. Bhattacharya, M. Saha-Sarkar, A.Goswami, S. Muralithar, R.P. Singh, R. Kumar, and R.K. BhowmikNucl. Phys. A 768, 43c (2006).
15. A study of the reactions occurring in 16O + 159Tb system: Measurement of excitationfunctions and recoil range distributionsManoj Kumar Sharma, Unnati, B.P. Singh, R. Kumar, K.S. Golda, H.D. Bhardwaj,and R. PrasadNucl. Phys. A 776, 83c (2006).
16. Observation of isomeric decays in the r-process waiting-point nucleus 130Cd82
A. Jungclaus, L. Caceres, M. Gorska, M. Pfutzner, S. Pietri, E. Werner-Malento, H.Grawe, K. Langanke, G. Martınez-Pinedo, F. Nowacki, A. Poves, J. J. Cuenca-Garcıa,D. Rudolph, Z. Podolyak, P. H. Regan, P. Detistov, S. Lalkovski, V. Modamio, J.Walker, P. Bednarczyk, P. Doornenbal, H. Geissel, J. Gerl, J. Grebosz, I. Kojouharov,N. Kurz, W. Prokopowicz, H. Schaffner, H. J. Wollersheim, K. Andgren, J. Benlliure,G. Benzoni, A. M. Bruce, E. Casarejos, B. Cederwall, F. C. L. Crespi, B. Hadinia, M.Hellstrom, R. Hoischen, G. Ilie, J. Jolie, A. Khaplanov, M. Kmiecik, R. Kumar, A.Maj, S. Mandal, F. Montes, S. Myalski, G. S. Simpson, S. J. Steer, S. Tashenov, andO. WielandPhys. Rev. L 99, 13250 (2007).
17. Multiparticle M1 band in 134LaVinod Kumar,Pragya Das, R. P. Singh, R. Kumar, S. Muralithar, and R. K. BhowmikPhys. Rev. C 76, 014309 (2007).
18. Bandcrossing of magnetic rotation bands in 137PrPriyanka Agarwal, Suresh Kumar, Sukhjeet Singh, Rishi Kumar Sinha, Anukul Dhal,S. Muralithar, R. P. Singh, N. Madhavan, R. Kumar, R. K. Bhowmik, S. S. Malik,S. C. Pancholi, L. Chaturvedi, H. C. Jain, and A. K. JainPhys. Rev. C 76, 024321 (2007).
19. Observation of complete- and incomplete-fusion components in 159Tb,169Tm(16O, x) reactions: Measurement and analysis of forward recoil ranges at E/A ≈5-6 MeVPushpendra P. Singh, Manoj Kumar Sharma, Unnati, Devendra P. Singh, R.Kumar,K.S. Golda, B.P. Singh, and R. PrasadEur. Phys. J. A 34, 2939 (2007).

8
20. Influence of incomplete fusion on complete fusion: Observation of a large incompletefusion fraction at E ≈ 5-7 MeV/nucleonPushpendra P. Singh, B. P. Singh, Manoj Kumar Sharma, Unnati, Devendra P. Singh,R. Prasad, R. Kumar and K. S. GoldaPhys. Rev. C 77, 014607 (2008).
21. Spin-distribution measurement: A sensitive probe for incomplete fusion dynamicsPushpendra P. Singh, B. P. Singh, Manoj Kumar Sharma, Unnati, R. Kumar, K.S. Golda, D. Singh, R. P. Singh, S. Muralithar, M. A. Ansari, R. Prasad, and R. K.BhowmikPhys. Rev. C 78, 017602 (2008).
22. Abrupt change of rotation axis in 109AgP. Datta, S. Roy, S. Pal, S. Chattopadhyay, S. Bhattacharya, A. Goswami, M. SahaSarkar, J. A. Sheikh, Y. Sun, P. V. Madhusudhana Rao, R. K. Bhowmik, R. Kumar,N. Madhavan, S. Muralithar, R. P. Singh, H. C. Jain, P. K. Joshi, and AmitaPhys. Rev. C 78, 021306 (R) (2008).
23. Enhanced strength of the 2+1 →0+
g.s. transition in 114Sn studied via Coulombexcitation in inverse kinematicsP. Doornenbal, P. Reiter, H. Grawe, H. J. Wollersheim, P. Bednarczyk, L. Caceres, J.Cederkall, A. Ekstrom, J. Gerl, M. Gorska, A. Jhingan, I. Kojouharov, R. Kumar,W. Prokopowicz, H. Schaffner, and R. P. SinghPhys. Rev. C 78, 031303 (R) (2008).
24. Pre-compound neutron evaporation in low energy heavy ion fusion reactionsAjay Kumar, Hardev Singh, Rajesh Kumar, I.M.Govil, R.P. Singh, R. Kumar, B.K.Yogi, K.S. Golda, S.K. Datta and G. ViestiNucl. Phys. A 798, 1c (2008).
25. Observation of large incomplete fusion in 16O + 103Rh system at ≈ 3-5 MeV/nucleonUnnati Gupta, Pushpendra P. Singh, Devendra P. Singh, Manoj Kumar Sharma, Ab-hishek Yadav, R. Kumar, B.P. Singh, R. PrasadNucl. Phys. A 811, 77c (2008).
26. A compact pulse shape discriminator module for large neutron detector arraysS. Venkataramanan, Arti Gupta, K.S. Golda, Hardev Singh, R. Kumar, R.P. Singh,and R.K. BhowmikNucl. Instr. Meth A 596 248c (2008).

9
27. Measurement and analysis of excitation functions and forward recoil range distributionin 12C + 59Co systemAvinash Agarwal, I. A. Rizvi, R. Kumar, B. K. Yogi, and A. K. ChaubeyInt. Jour. of Mod. Phy. E Vol. 17, No. 2 393c (2008).
28. First results with the RISING active stopperP. H. Regan, N. Alkhomashi, N. Al-dahan, Zs. Podolyak, S. B. Pietri, S. J. Steer, A. B.Garnsworthy, E. B. Suckling, P. D. Stevenson, G. Farrelly, I. J. Cullen, W. Gelletly, P.M. Walker, J. Benlliur, A. I. Morales, E. Casajeros, M. E. Estevez, J. Gerl, M. Gorska,H. J. Wollersheim, P. Boutachkov, S. Tashenov, I. Kojouharov, H. Schaffner, N. Kurz,R. Kumar, B. Rubio, A. Algora, F. Molina, J. Grebosz, G. Benzoni, D. Mucher, A.M. Bruce, A. M. Denis Bacelar, S. Lalkovski, Y. Fujita, A. Tamii, R. Hoischen, Z. Liu,P. J. Woods, C. Mihai, and J. J. Valiente-DobonInt. Jour. of Mod. Phy. E Vol. 17, Supplement 8c (2008).
29. Spherical proton-neutron structure of isomeric states in 128CdL. Caceres, M. Gorska, A. Jungclaus, M. Pfutzner, H. Grawe, F. Nowacki, K. Sieja,S. Pietri, D. Rudolph, Zs. Podolyak, P. H. Regan, E. Werner-Malento, P. Detistov,S. Lalkovski, V. Modamio, J. Walker, K. Andgren, P. Bednarczyk, J. Benlliure, G.Benzoni, A. M. Bruce, E. Casarejos, B. Cederwall, F. C. L. Crespi, P. Doornenbal,H. Geissel, J. Gerl, J. Grebosz, B. Hadinia, M. Hellstrom, R. Hoischen, G. Ilie, A.Khaplanov, M. Kmiecik, I. Kojouharov, R. Kumar, N. Kurz, A. Maj, S. Mandal, F.Montes, G. Martınez-Pinedo, S. Myalski, W. Prokopowicz, H. Schaffner, G. S. Simpson,S. J. Steer, S. Tashenov, O. Wieland, and H. J. WollersheimPhys. Rev. C 79, 011301 (R) (2009).
30. Band structures in 129CsS. Sihotra, K. Singh, S. S. Malik, J. Goswamy, R. Palit, Z. Naik, D. Mehta, N. Singh,R. Kumar, R. P. Singh, and S. MuralitharPhys. Rev. C 79, 044317 (2009).
31. High spin states in 139PmA. Dhal, R. K. Sinha, L. Chaturvedi, P. Agarwal, S. Kumar, A. K. Jain, R. Kumar, I.M. Govil, S. Mukhopadhyay, A. Chakraborty, Krishichayan, S. Ray, S. S. Ghugre, A.K. Sinha, R. Kumar, R. P. Singh, S. Muralithar, R. K. Bhowmik, S. C. Pancholi,and J. B. GuptaPhys. Rev. C 80, 014320 (2009).
10
32. Investigation of the role of break-up processes on the fusion of 16O induced reactionsDevendra P. Singh, Unnati, Pushpendra P. Singh, Abhishek Yadav, Manoj KumarSharma, B. P. Singh, K. S. Golda, R. Kumar, A. K. Sinha, and R. PrasadPhys. Rev. C 80, 014601 (2009).
33. Absence of entrance channel effects in fission fragment anisotropies of the 215Fr com-pound nucleusS. Appannababu, S. Mukherjee, N. L. Singh, P. K. Rath, G. Kiran Kumar, R. G.Thomas, S. Santra, B. K. Nayak, A. Saxena, R. K. Choudhury, K. S. Golda, A. Jhin-gan, R. Kumar, P.Sugathan, and H.SinghPhys. Rev. C 80, 024603 (2009).
34. Disentangling full and partial linear momentum transfer events in the 16O+169Tm sys-tem at Eproj ≤ 5.4 MeV/nucleonUnnati Gupta, Pushpendra P. Singh, Devendra P. Singh, Manoj Kumar Sharma, Ab-hishek Yadav, R. Kumar, S. Gupta, H. D. Bhardwaj, B. P. Singh, and R. PrasadPhys. Rev. C 80, 024613 (2009).
35. Shape evolution of the highly deformed 75Kr nucleus examined with the Doppler-shiftattenuation methodT. Trivedi, R. Palit, D. Negi, Z. Naik, Y.-C. Yang, Y. Sun, J. A. Sheikh, A. Dhal,M.K. Raju, S. Appannababu, S. Kumar, D. Choudhury, K. Maurya, G. Mahanto,R.Kumar, R. P. Singh, S. Muralithar, A. K. Jain, H. C. Jain, S. C. Pancholi, R.K.Bhowmik, and I. MehrotraPhys. Rev. C 80, 047302 (2009).
36. β−-delayed spectroscopy of neutron-rich tantalum nuclei: Shape evolution in neutron-rich tungsten isotopesN. Alkhomashi, P. H. Regan, Zs. Podolyak, S. Pietri, A. B. Garnsworthy, S. J. Steer,J. Benlliure, E. Caserejos, R. F. Casten, J. Gerl, H. J. Wollersheim, J. Grebosz, G.Farrelly, M. Gorska, I. Kojouharov, H. Schaffner, A. Algora, G. Benzoni, A. Blazhev, P.Boutachkov, A. M. Bruce, A. M. Denis Bacelar, I. J. Cullen, L.Caceres, P. Doornenbal,M. E. Estevez, Y. Fujita, W. Gelletly, R. Hoischen, R. Kumar, N. Kurz, S. Lalkovski,Z. Liu, C. Mihai, F. Molina, A. I. Morales, D. Mucher, W. Prokopowicz, B. Rubio, Y.Shi, A. Tamii, S. Tashenov, J. J. Valiente-Dobon, P. M. Walker, P. J. Woods, and F.R. XuPhys. Rev. C 80, 0643308 (2009).

11
37. Role of high ℓ values in the onset of incomplete fusionPushpendra P. Singh, Abhishek Yadav, Devendra P. Singh, Unnati Gupta, Manoj K.Sharma, R. Kumar, D. Singh, R.P. Singh, S. Muralithar, M.A. Ansari, B.P. Singh,R. Prasad, and R.K. BhowmikPhys. Rev. C 80, 064603 (2009).
38. Probing of incomplete fusion dynamics by spin-distribution measurementPushpendra P. Singh, B.P. Singh, M.K. Sharma, Unnati Gupta, R. Kumar, D. Singh,R.P. Singh, S. Murlithar, M.A. Ansari, R. Prasad, R.K. BhowmikPhysics. Letters. B 671, 20c (2009).
39. Proton-hole excitation in the closed shell nucleus 205AuZs. Podolyak, G.F. Farrelly, P.H. Regan, A.B. Garnsworthy, S.J. Steer, M. Gorska, J.Benlliure, E. Cesarejos, S. Pietri, J. Gerl, H.J. Wollersheim, R. Kumar, F. Molina,A. Algora, N. Alkhomashi, G. Benzoni, A. Blazhev, P. Boutachkov, A.M. Bruce, L.Caceres, I.J. Cullen, A.M. Denis Bacelar, P. Doornenbal, M.E. Estevez, Y. Fujita, W.Gelletly, H. Geissel, H. Grawe, J. Grebosz, R. Hoischen, I. Kojouharov, S. Lalkovski, Z.Liu, K.H. Maier, C. Mihai, D. Mucher, B. Rubio, H. Schaffner, A. Tamii, S. Tashenov,J.J. Valiente-Dobon, P.M. Walker, P.J. WoodsPhysics. Letters. B 672, 116c (2009).
40. Evolution of the N = 82 shell gap below 132Sn inferred from core excited states in 131InM. Gorska, L. Caceres, H. Grawe, M. Pfutzner, A. Jungclaus, S. Pietri, E. Werner-Malento, Z. Podolyk, P.H. Regan, D. Rudolph, P. Detistov, S. Lalkovski, V. Modamio,J. Walker, T. Beck, P. Bednarczyk, P. Doornenbal, H. Geissel, J. Gerl, J. Grebosz,R. Hoischen, I. Kojouharov, N. Kurz, W. Prokopowicz, H. Schaffner, H. Weick, H.-J. Wollersheim, K. Andgren, J. Benlliure, G. Benzoni, A.M. Bruce, E. Casarejos, B.Cederwall, F.C. L. Crespi, B. Hadinia, M. Hellstrm, G. Ilie, A. Khaplanov, M. Kmiecik,R. Kumar, A. Maj, S. Mandal, F. Montes, S. Myalski, G.S. Simpson, S.J. Steer, S.Tashenov, O. Wieland, Zs. Dombradi, P. Reiter, D. SohlerPhysics. Letters. B 672, 313c (2009).
41. Testing of a DSSSD detector for the stopped RISING projectR. Kumar, F.G. Molina, S. Pietri, E. Casarejos, A. Algora, J. Benlliure, P. Doornen-bal, J. Gerl, M. Gorska, I. Kojouharov, Zs. Podolyak, W. Prokopowicz, P.H. Regan,B. Rubio, H. Schaffner, S. Tashenov, H.-J. Wollersheim.Nucl. Instr. Meth A 598 754c (2009).
12
42. β-delayed γ-ray spectroscopy of heavy neutron rich nuclei south of leadA.I. Morales, J. Benlliure, P.H. Regan, Z. Podolyak, M. Gorska, N. Alkhomashi, S.Pietri, R. Kumar, E. Casarejos, J. Agramunt, A. Algora, H. lvarez-Pol, G. Benzoni,A. Blazhev, P. Boutachkov, A.M. Bruce, L.S. Cceres, I.J. Cullen, A.M. Denis Bacelar,P. Doornenbal, D. Dragosavac, M.E. Estvez, G. Farrelly, Y. Fujita, A.B. Garnsworthy,W. Gelletly, J. Gerl, J. Grbosz, R. Hoischen, I. Kojouharov, N. Kurz, S. Lalkovski, Z.Liu, D. Prez-Loureiro, W. Prokopowicz, C. Mihai, F. Molina, D. Mucher, B. Rubio,H. Schaffner, S.J. Steer, A. Tamii, S. Tashenov, J.J. Valiente Dobon, S. Verma, P.M.Walker, H.J. Wollersheim, P.J. WoodsAct. Phys. Pol. B Vol.40 No 3 867c (2009).
43. Enhanced 0+g.s.→2+
1 transition strength in 112SnR. Kumar, P. Doornenbal, A. Jhingan, R. K. Bhowmik, S. Muralithar, S. Appannababu,R.Garg, J. Gerl, M. Gorska, J. Kaur, I. Kojouharov, S. Mandal, S. Mukherjee, D. Si-wal, A. Sharma, Pushpendra P. Singh, R. P. Singh and H. J. WollersheimPhys. Rev. C 81, 024306 (2010).
44. Lifetime measurement of high spin states in 75KrT. Trivedi, R. Palit, D. Negi, Z. Naik, Y.-C. Yang, Y. Sun, J. A. Sheikh, A. Dhal,M. K. Raju, S. Appannababu, S. Kumar, D. Choudhury, K. Maurya, G. Mahanto,R.Kumar, R. P. Singh, S. Muralithar, A. K. Jain, H. C. Jain, S. C. Pancholi, R. K.Bhowmik, and I. MehrotraNucl. Phys. A 834, 72c (2010).
45. Incomplete fusion dynamics by spin distribution measurementsD. Singh, R. Ali, M. Afzal Ansari, K. Surendra Babu, Pushpendra P. Singh, M. K.Sharma, B. P. Singh, Rishi K. Sinha, R. Kumar, S. Muralithar, R. P. Singh, and R.K. BhowmikPhys. Rev. C 81, 027602 (2010).
46. Band crossing in a shears band of 108CdSantosh Roy, Pradip Datta, S. Pal, S. Chattopadhyay, S. Bhattacharya, A. Goswami,H. C. Jain, P. K. Joshi, R. K. Bhowmik, R. Kumar, S. Muralithar, R. P. Singh, N.Madhavan, and P. V. Madhusudhana RaoPhys. Rev. C 81, 0543111 (2010).
47. Energy dependence of incomplete fusion processes in the 16O+181Ta system: Measure-ment and analysis of forward-recoil-range distributions at Elab ≤ 7 MeV/nucleonDevendra P. Singh, Unnati, Pushpendra P. Singh, Abhishek Yadav, Manoj KumarSharma, B. P. Singh, K. S. Golda, R. Kumar, A. K. Sinha, and R. PrasadPhys. Rev. C 81, 054322 (2010).

13
48. High spin spectroscopy and shears mechanism in 107InD. Negi, T. Trivedi, A. Dhal, S. Kumar, V. Kumar, S. Roy, M. K. Raju, S. Ap-pannababu, G. Mohanto, J. Kaur, R. K. Sinha, R. Kumar, R. P. Singh, S. Muralithar,A. K. Bhati, S. C. Pancholi and R. K. BhowmikPhys. Rev. C 81, 054607 (2010).
49. Band structure and shape coexistence in 135BaSuresh Kumar, A. K. Jain, Alpana Goel, S. S. Malik, R. Palit, H. C. Jain, I. Muzumdar,P. K. Joshi, Z. Naik, A. Dhal, T. Trivedi, I. Mehrotra, S. Appannababu, L. Chaturvedi,V. Kumar, R. Kumar, D. Negi, R. P. Singh, S. Muralithar, R. K. Bhowmik and S.C. PancholiPhys. Rev. C 81, 067304 (2010).
50. Indian National Gamma Array at Inter University Accelerator Centre, New DelhiS. Muralithar, K. Rani, R. Kumar, R.P. Singh, J.J. Das, J. Gehlot, K.S. Golda,A. Jhingan, N. Madhavan, S. Nath, P. Sugathan, T. Varughese, M. Archunan, P.Barua, A. Gupta, M. Jain, A. Kothari, B.P.A. Kumar, A.J. Malyadri, U.G. Naik, RajKumar, Rajesh Kumar, J. Zacharias, S. Rao, S.K. Saini, S.K. Suman, M. Kumar, E.T.Subramaniam, S. Venkataramanan, A. Dhal, G. Jnaneswari, D. Negi, M.K. Raju, T.Trivedi, R.K. BhowmikNucl. Instr. Meth A (2010) in Press.
51. Enhanced E2 transition strength in 112,114SnR. Kumar, P. Doornenbal, A. Jhingan, R.K. Bhowmik, S. Muralithar, P. Reiter,H. Grawe, S. Appannababu, P. Bednarczyk, L. Caceres, J. Cederkall, A. Ekstrom,R. Garg, J. Gerl, M.Grska, J. Kaur, I. Kojouharov, S. Mandal, S. Mukherjee, W.Prokopowicz, H. Schaffner, D.Siwal, A. Sharma, Pushpendra P. Singh, R.P. Singh,and H.-J. WollersheimAct. Phys. Pol. (2010) in Press.


Contents
1 Introduction 27
2 Pairing and Seniority in Sn Isotopes 312.1 Two Particle Configurations . . . . . . . . . . . . . . . . . . . . . . . . . . . 312.2 Geometrical Analysis of δ-Function Residual
Interaction . . . . . . . . . . . . . . . . . . . . . . . . . . . . . . . . . . . . . 332.3 Generalized Seniority Scheme . . . . . . . . . . . . . . . . . . . . . . . . . . 34
3 Coulomb Excitation 393.1 Theoretical Description . . . . . . . . . . . . . . . . . . . . . . . . . . . . . . 393.2 Semiclassical Theory . . . . . . . . . . . . . . . . . . . . . . . . . . . . . . . 393.3 Multipole Expansion . . . . . . . . . . . . . . . . . . . . . . . . . . . . . . . 433.4 Angular Distribution of De-Excitation γ-Rays . . . . . . . . . . . . . . . . . 47
4 The Experimental Method 514.1 Overview . . . . . . . . . . . . . . . . . . . . . . . . . . . . . . . . . . . . . . 514.2 Kinematics and Particle Identification . . . . . . . . . . . . . . . . . . . . . . 534.3 Electronics . . . . . . . . . . . . . . . . . . . . . . . . . . . . . . . . . . . . . 554.4 Doppler Correction . . . . . . . . . . . . . . . . . . . . . . . . . . . . . . . . 57
5 Analysis and Results 615.1 Data Analysis with INGASORT . . . . . . . . . . . . . . . . . . . . . . . . . 615.2 Add-back of the Individual γ-Ray Signals
within a Clover Ge-Detector . . . . . . . . . . . . . . . . . . . . . . . . . . . 615.3 Particle Identification at IUAC . . . . . . . . . . . . . . . . . . . . . . . . . 625.4 Suppression of the γ-Ray Background Events . . . . . . . . . . . . . . . . . . 645.5 Determination of the Scattering Angles . . . . . . . . . . . . . . . . . . . . . 655.6 Doppler-Shift Correction . . . . . . . . . . . . . . . . . . . . . . . . . . . . . 68
5.6.1 Method for Improved Doppler Correction . . . . . . . . . . . . . . . . 685.7 Experimental γ-Ray Yields . . . . . . . . . . . . . . . . . . . . . . . . . . . . 72
5.7.1 Dependence of 112Sn/116Sn Ratio on the Azimuthal Angle . . . . . . . 735.8 Experimental 112Sn/116Sn Intensity Ratio . . . . . . . . . . . . . . . . . . . . 74
5.8.1 Correction for Photopeak Efficiency . . . . . . . . . . . . . . . . . . 74
15

16 CONTENTS
5.8.2 Correction for Isotopic Impurity . . . . . . . . . . . . . . . . . . . . . 765.8.3 Coulomb Excitation Cross Sections . . . . . . . . . . . . . . . . . . . 76
6 Comparision with Theoretical Predictions 796.1 Experiment Evidence for Shell Effects . . . . . . . . . . . . . . . . . . . . . . 796.2 The Average Potential of the Nucleus . . . . . . . . . . . . . . . . . . . . . . 80
6.2.1 The Electric Quadrupole Moment and Effective Charges . . . . . . . 816.2.2 Comparision with Large-Scale-Shell-Model Calculations . . . . . . . . 82
6.3 Relativistic Quasi-Particle Random PhaseApproximation . . . . . . . . . . . . . . . . . . . . . . . . . . . . . . . . . . 856.3.1 Density Functional Theory . . . . . . . . . . . . . . . . . . . . . . . . 866.3.2 Comparision with Relativistic Quasi-Particle Random Phase Approx-
imation . . . . . . . . . . . . . . . . . . . . . . . . . . . . . . . . . . 88
7 Active Stopper 917.1 Active Stopper . . . . . . . . . . . . . . . . . . . . . . . . . . . . . . . . . . 917.2 GEANT4 Simulation . . . . . . . . . . . . . . . . . . . . . . . . . . . . . . . 927.3 Measurements with mesytec Electronics . . . . . . . . . . . . . . . . . . . . . 93
7.3.1 Energy Resolution Measured with α-Particles of a241Am Source . . . . . . . . . . . . . . . . . . . . . . . . . . . . . . . 95
7.3.2 Energy Resolution Measured with Electrons of a 207Bi Source . . . . 977.4 Measurements with Multi Channel Systems
Electronics . . . . . . . . . . . . . . . . . . . . . . . . . . . . . . . . . . . . . 997.4.1 Energy Resolution Measured with β-Particles of a 207Bi Source . . . . 100
7.5 Chamber for the RISING Active Stopper . . . . . . . . . . . . . . . . . . . . 1017.6 Implantation Measurement with a 136Xe Beam . . . . . . . . . . . . . . . . . 102
7.6.1 Results with the Linear MPR-32 mesytec
Preamplifier . . . . . . . . . . . . . . . . . . . . . . . . . . . . . . . . 1037.6.2 Results with the Logarithmic MPR-32 mesytec
Preamplifier . . . . . . . . . . . . . . . . . . . . . . . . . . . . . . . . 1057.7 Experiments with Active Stopper . . . . . . . . . . . . . . . . . . . . . . . . 107
8 Summary and Outlook 110
A Analysis and Results 112A.1 Generating Clover PPAC Time Difference
Spectrum . . . . . . . . . . . . . . . . . . . . . . . . . . . . . . . . . . . . . 112A.2 Nuclear Structure Data . . . . . . . . . . . . . . . . . . . . . . . . . . . . . 113A.3 Doppler Correction . . . . . . . . . . . . . . . . . . . . . . . . . . . . . . . . 114
A.3.1 Details of 58Ni measured with PPAC, 58Ni excited . . . . . . . . . . 114A.3.2 Details of 112Sn measured with PPAC, 58Ni excited . . . . . . . . . . 115A.3.3 Details of 112Sn measured with PPAC, 112Sn excited . . . . . . . . . 116A.3.4 Details of 58Ni measured with PPAC, 112Sn excited . . . . . . . . . . 117
CONTENTS 17
A.4 Range Energy Table for Sn on Sn . . . . . . . . . . . . . . . . . . . . . . . . 118A.5 Input for Coulomb Excitation (lell30e1.f) . . . . . . . . . . . . . . . . . . . . 120A.6 Input for Angular Distribution (anggro.f) . . . . . . . . . . . . . . . . . . . . 121A.7 Important Formulas . . . . . . . . . . . . . . . . . . . . . . . . . . . . . . . . 123
B Active Stopper 124B.1 mesytec Electronics . . . . . . . . . . . . . . . . . . . . . . . . . . . . . . . . 124B.2 Block Diagram using mesytec Electronics . . . . . . . . . . . . . . . . . . . . 125B.3 Multi Channel Systems . . . . . . . . . . . . . . . . . . . . . . . . . . . . . . 125B.4 Block Diagram using Multi Channel System . . . . . . . . . . . . . . . . . . 126B.5 Maximun Incident Energy for Heavy Ions
Implanted in 0.5mm and 1mm Silicon . . . . . . . . . . . . . . . . . . . . . . 127B.6 Pre-Amplifier Signals Measured with
MPR-32 (lin) . . . . . . . . . . . . . . . . . . . . . . . . . . . . . . . . . . . 128B.7 Pre-Amplifier Signals Measured with
MPR-32 (log) . . . . . . . . . . . . . . . . . . . . . . . . . . . . . . . . . . . 128B.8 Amplifier Signals Measured together with
MPR-32 (log) . . . . . . . . . . . . . . . . . . . . . . . . . . . . . . . . . . . 129B.9 Decay Scheme of 207Bi . . . . . . . . . . . . . . . . . . . . . . . . . . . . . . 129

List of Figures
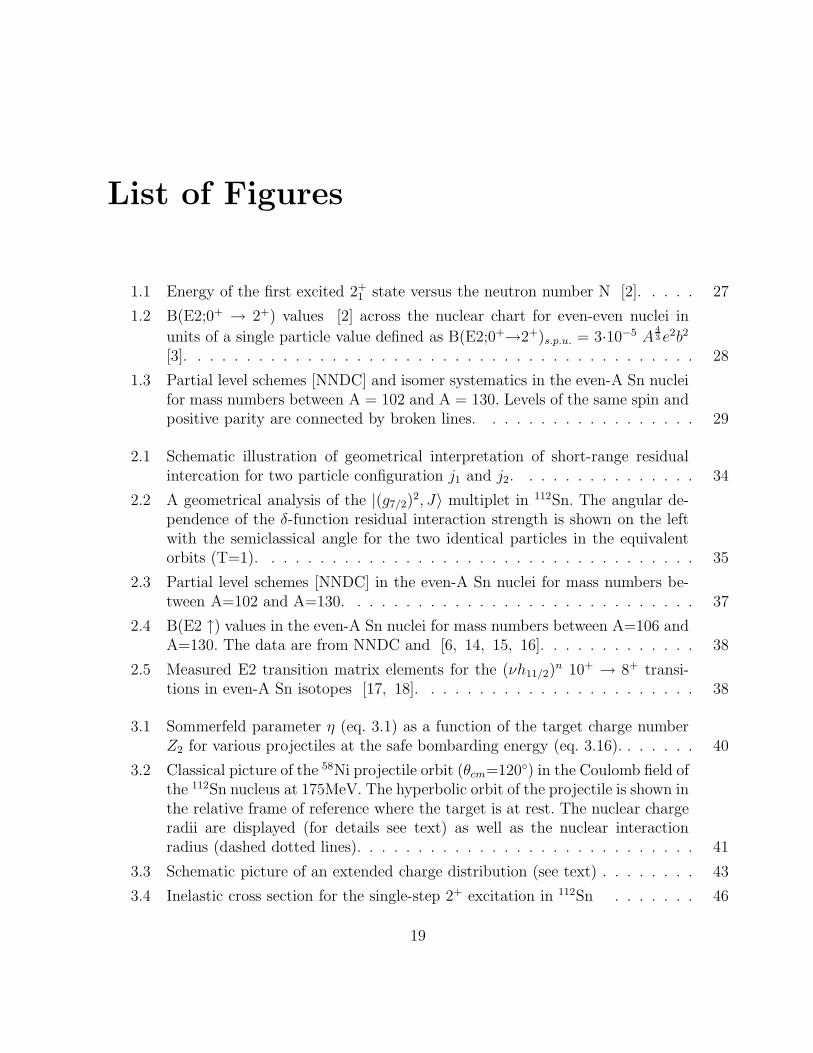
1.1 Energy of the first excited 2+1 state versus the neutron number N [2]. . . . . 27
1.2 B(E2;0+ → 2+) values [2] across the nuclear chart for even-even nuclei in
units of a single particle value defined as B(E2;0+→2+)s.p.u. = 3·10−5 A4
3 e2b2
[3]. . . . . . . . . . . . . . . . . . . . . . . . . . . . . . . . . . . . . . . . . . 28
1.3 Partial level schemes [NNDC] and isomer systematics in the even-A Sn nucleifor mass numbers between A = 102 and A = 130. Levels of the same spin andpositive parity are connected by broken lines. . . . . . . . . . . . . . . . . . 29
2.1 Schematic illustration of geometrical interpretation of short-range residualintercation for two particle configuration j1 and j2. . . . . . . . . . . . . . . 34
2.2 A geometrical analysis of the |(g7/2)2, J〉 multiplet in 112Sn. The angular de-
pendence of the δ-function residual interaction strength is shown on the leftwith the semiclassical angle for the two identical particles in the equivalentorbits (T=1). . . . . . . . . . . . . . . . . . . . . . . . . . . . . . . . . . . . 35
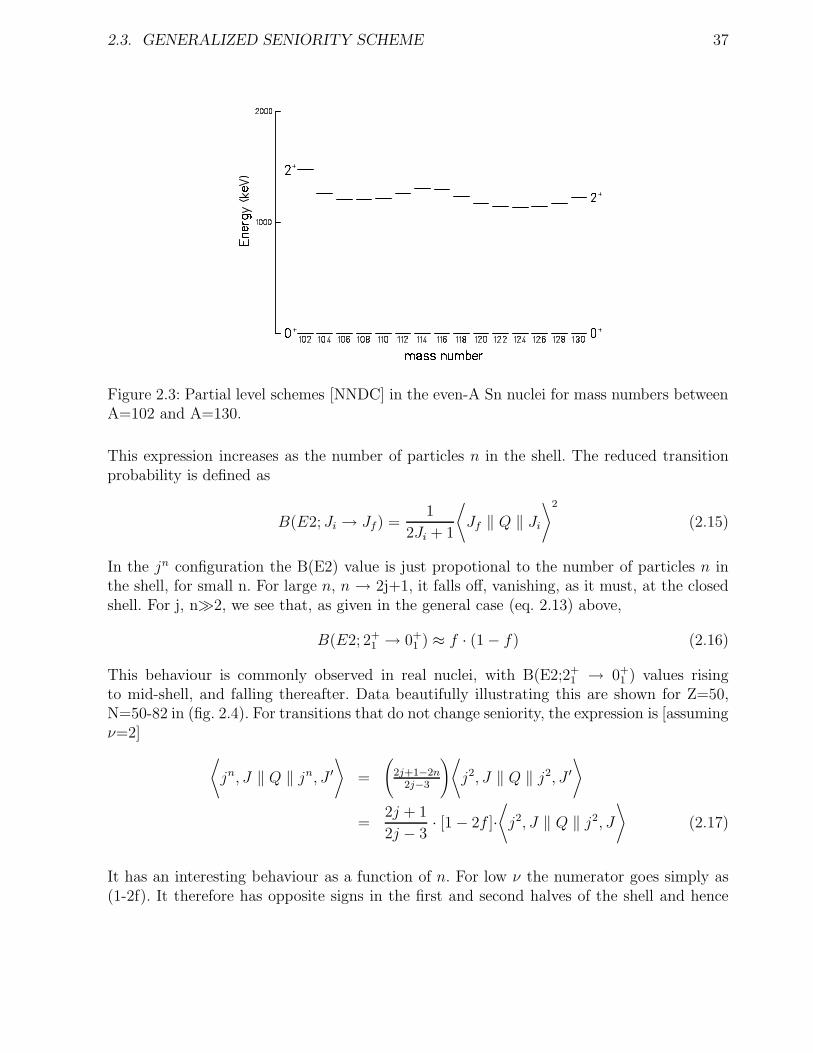
2.3 Partial level schemes [NNDC] in the even-A Sn nuclei for mass numbers be-tween A=102 and A=130. . . . . . . . . . . . . . . . . . . . . . . . . . . . . 37
2.4 B(E2 ↑) values in the even-A Sn nuclei for mass numbers between A=106 andA=130. The data are from NNDC and [6, 14, 15, 16]. . . . . . . . . . . . . 38
2.5 Measured E2 transition matrix elements for the (νh11/2)n 10+ → 8+ transi-
tions in even-A Sn isotopes [17, 18]. . . . . . . . . . . . . . . . . . . . . . . 38
3.1 Sommerfeld parameter η (eq. 3.1) as a function of the target charge numberZ2 for various projectiles at the safe bombarding energy (eq. 3.16). . . . . . . 40
3.2 Classical picture of the 58Ni projectile orbit (θcm=120) in the Coulomb field ofthe 112Sn nucleus at 175MeV. The hyperbolic orbit of the projectile is shown inthe relative frame of reference where the target is at rest. The nuclear chargeradii are displayed (for details see text) as well as the nuclear interactionradius (dashed dotted lines). . . . . . . . . . . . . . . . . . . . . . . . . . . . 41
3.3 Schematic picture of an extended charge distribution (see text) . . . . . . . . 43
3.4 Inelastic cross section for the single-step 2+ excitation in 112Sn . . . . . . . 46
19

20 LIST OF FIGURES
3.5 Particle-γ angular correlation for 58Ni projectiles scattered at angles of θcm=45
and −9 ≤ φcm ≤ 9 (full curve) and 81 ≤ φcm ≤ 99 (dashed curve). Theγ-rays of the 2+ → 0+ transition in 112Sn are measured with Ge-detectors inplane (φγ =0 or φγ =180). The beam and target is indicated as well as thescattering at θcm=45. . . . . . . . . . . . . . . . . . . . . . . . . . . . . . . 48
3.6 γ-ray angular correlation for 2+ → 0+ transition in 112Sn after the scattering of58Ni projectiles at an angle of θcm=45. The calculation was performed withouttaking into account the deorientation effect (Gk=1) and the integration overa finite size of the Ge detector (Qk = 1). The dashed line shows an isotropicγ-ray angular correlation. . . . . . . . . . . . . . . . . . . . . . . . . . . . . 49
4.1 Particle-γ coincidence set-up at GSI (left) and at IUAC (right). . . . . . . . 514.2 Schematic view of the experiment perfomed at IUAC. A position sensitive
annular gas-filled parallel plate avalanche counter (PPAC) was placed in for-ward direction covering the angular range of 15 ≤ ϑlab ≤ 45. Four Cloverdetectors were mounted at ϑγ ∼135 with respect to the beam direction. . . 52
4.3 Kinematics of Coulomb excitation experiments with 114Sn beam on 58Ni target(left) and with 58Ni beam on 112Sn target (right). Energy dependence of bothreaction partners is plotted as a function of the scattering angle in the centreof mass system (θcm) and laboratory frame (ϑ3,ϑ4). Solid lines correspond toprojectile-like fragment and the dashed lines correspond to target-like fragments. 54
4.4 Scattered projectiles and target nuclei coincidences were detected in the PPACfor the 116Sn beam incident on the 58Ni target. The scattering angle is plottedversus the flight time differences of both reaction partners. The correspondingkinematical cuts applied for coincident γ-rays are indicated. See text for details. 54
4.5 Kinetic energies of the scattered 58Ni projectiles and 112Sn recoils detected inthe angular range of 15 to 45 covered by the PPAC. The dashed lines arebased on two body kinematics for a beam energy of 175 MeV, while full linesare corrected for energy loss [32] in a 10 µm MYLAR foil, which was used asentrance window of the PPAC. . . . . . . . . . . . . . . . . . . . . . . . . . . 55
4.6 Block diagram showing the electronics used for the Coulomb excitation ex-periments at IUAC. (CFD: constant fraction discriminator,SH: shaper, GG:gate generator, A(T)DC: analog-(time)-to-digital-coverter). . . . . . . . . . . 56
4.7 Ungated γ-ray spectrum from Clover-2 detector (IUAC experiment) in coin-cidence with scattered projectiles measured in the particle detector. . . . . . 57
4.8 Doppler corrected γ-ray spectra associated with a coincidence of two particlesin the PPAC. The Doppler correction (case 4) was applied using kinematicalinformation of the target nuclei (58Ni cuts in fig. 4.4), but assuming a projectileexcitation of 114Sn (left) and 116Sn (right), respectively. The elevation between1400keV and 1600keV corresponds to decays from the 2+
1 state of the 58Niejectiles. In order to obtain narrow peaks for the target excitation of 58Ni,the same data were used but the Doppler correction (case 3) was applied toobatin the lower spectra. . . . . . . . . . . . . . . . . . . . . . . . . . . . . 60

LIST OF FIGURES 21
5.1 Ungated γ-ray spectrum for Clover-2 (black) and γ-ray spectra gated by (a)left delay-line and (b) right delay-line. The spectra in coincidence with thesmall angle end of the delay line (inner contact readout) are plotted in bluewhile the spectra in coincidence with the large angle end of the delay line(outer contact readout) are plotted in red. For all spectra the add-back pro-cedure was applied. . . . . . . . . . . . . . . . . . . . . . . . . . . . . . . . . 63
5.2 Gamma-particle time-of-flight (TOF) spectrum (black) and γ-energy gatedspectra for Ni(blue, Eγ=1264keV) or Sn(red, Eγ=1200keV) particles detectedin PPAC. . . . . . . . . . . . . . . . . . . . . . . . . . . . . . . . . . . . . . 64
5.3 γ-spectra associated with the random events (bottom red curve) and background-subtracted prompt spectrum (top black curve). . . . . . . . . . . . . . . . . 65
5.4 Total number of counts recorded for each ϕ-segment during the γ-p coin-cidence measurement (black curve). The blue and red histograms show thecorresponding counts in coincidence with signals from inner and outer con-tacts of the delay-lines. . . . . . . . . . . . . . . . . . . . . . . . . . . . . . 65
5.5 Top panel shows the SDL readout for different ϕ-segments: #1(black), #8(blue),#16(red), #19(green) and #4(black), #7(blue), #11(red) and #17(green). Inthe bottom panel the corresponding spectra are shown in coincidence with theouter contact. . . . . . . . . . . . . . . . . . . . . . . . . . . . . . . . . . . . 66
5.6 DDL spectra for segments 1-10 (black) and segments 11-20 (red). The countrates in both halves are different as there were some of the ϕ-segments notworking during the experiment. . . . . . . . . . . . . . . . . . . . . . . . . . 67
5.7 SDL spectrum gated by different regions of the DDL spectrum (see fig. 5.6)(i)black - ungated, (ii)green full DDL range, (iii)blue L-region, (iv)red M-region and (v)pink H-region (see text for details) . . . . . . . . . . . . . . . 68
5.8 Doppler corrected γ-ray spectra for individual crystals of Clover-2 assuminga common correction (ϑγ ,ϕγ) for the Clover. . . . . . . . . . . . . . . . . . . 69
5.9 Doppler oscillations for Crystal-1 of Clover-2. The circles are experimentalcentroids for Ni and Sn peaks for gate-M of the DDL spectrum (fig. 5.6). Thesolid curves correspond to the theoretical predictions for Elab= 167MeV, ϑp =32.9, ϑγ = 142.7 and ϕγ=143.2 (see text). For Sn γ-rays, theoretical curvesfor two different beam energies Elab= 167MeV and 138MeV are shown. (seealso Appendix A.3) . . . . . . . . . . . . . . . . . . . . . . . . . . . . . . . . 70
5.10 Calculated Doppler-shifted peak positions for projectile and target excitationas a function of detector angle ϑp. The energy loss in the target was neglectedin the above calculations. . . . . . . . . . . . . . . . . . . . . . . . . . . . . 70
5.11 Doppler corrected γ-ray spectra for the systems 112Sn+58Ni(blue) . . . . . . 72
5.12 Doppler corrected add-back spectra for Clover-2. The black and red curvescorrespond to spectra under ’prompt’and ’random’ conditions in Clover-PPACTOF spectrum. The top and bottom spectra correspond to Doppler correc-tions assuming projectile (Ni) excitation and target (Sn) excitation. . . . . . 73

22 LIST OF FIGURES
5.13 Doppler corrected add-back spectra for Clover-2. The black and red spectracorrespond to correlations for −90<ϕγp<90 and 90<ϕγp<270. The topand bottom sets correspond to Doppler corrections assuming projectile andtarget excitations. . . . . . . . . . . . . . . . . . . . . . . . . . . . . . . . . 75
6.1 Two-neutron separation energy S2n for the tin isotopes as a function of theneutron number. . . . . . . . . . . . . . . . . . . . . . . . . . . . . . . . . . 79
6.2 Effective charge for a neutron induced by the attractive strong interactionbetween single nucleon and the core. . . . . . . . . . . . . . . . . . . . . . . 82
6.3 Graphical representation of a particle in an orbital j, polarizing the core to-wards oblate deformation with a negative quadrupole moment (left), and ahole in an orbital giving rise to a prolate core polarization (right). . . . . . . 83
6.4 The increase in the absolute value of the quadrupole moments of isomers inthe Pb region has been understood as due to a coupling of the valence particleswith the quadrupole excitations of the underlying core. . . . . . . . . . . . . 83
6.5 Experimental data on B(E2;0+g.s → 2+
1 ) values in the Sn isotope chain fromthe current results for 112,114Sn and from [2, 6, 14, 15, 16]. The dotted andthe full lines show the predictions of the large-scale shell model calculations[6] performed with a 100Sn core and a 90Zr core, respectively. . . . . . . . . . 85
6.6 The attractive scalar field S(r) and the repulsive vector field V(r) form theweak nuclear mean field (S+V) and the strong spin-orbit term (S-V). . . . . 86
6.7 Experimental data on B(E2;0+g.s → 2+
1 ) values in the Sn isotope chain fromthe current results for 112,114Sn and from [2, 6, 14, 15, 16]. The full line showsthe predictions of the RQRPA calculations [54] . . . . . . . . . . . . . . . . 89
7.1 Schematic drawing of the W1(DS)-1000 double-sided silicon strip detector(DSSSD) from Micron Semiconductor Ltd [59]. . . . . . . . . . . . . . . . . 92
7.2 Schematic drawing of the position correlation between the projectile implantand the subsequent β-decay measured with the double-sided silicon strip de-tector (DSSSD). . . . . . . . . . . . . . . . . . . . . . . . . . . . . . . . . . . 92
7.3 Simulated energy spectrum of β-particles emitted from fragments implanteduniformly (solid line) and exactly in the centre (dashed line) of a DSSSD (left).The simulation assumes a Qβ-value of 5MeV and a Fermi-Curie distributionfor β-particles. The right figure shows the calculated β-detection efficiency asa function of the DSSSD threshold for the two considered implantation senarios. 93
7.4 Output signal of the MPR-32 preamplifier for a 207Bi β-source (pulse-height200mV, decay time 30µs) . . . . . . . . . . . . . . . . . . . . . . . . . . . . . 94
7.5 The characteristics of the logarithmic MPR-32 preamplifier was measuredwith a 10 MeV linear range setting and STM-16 spectroscopy amplifiers. . . 94
7.6 Energy spectra of a 207Bi β-source measured for different discriminator thresh-olds labelled T=8 to T=32 of the Mesytec STM-16 module. . . . . . . . . . 95
7.7 Energy spectrum of a 241Am α-source measured with DSSSD-2512-17 frontstrip X4 (left) and back strip Y4 (right). . . . . . . . . . . . . . . . . . . . . 96
LIST OF FIGURES 23
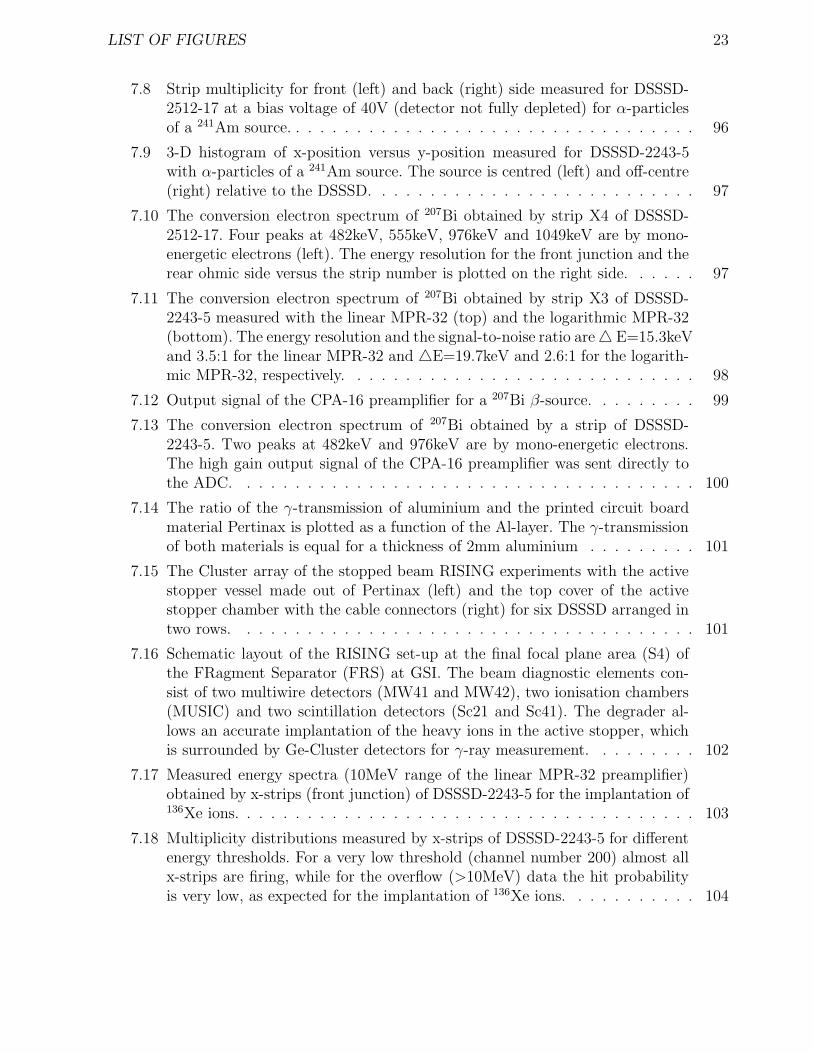
7.8 Strip multiplicity for front (left) and back (right) side measured for DSSSD-2512-17 at a bias voltage of 40V (detector not fully depleted) for α-particlesof a 241Am source. . . . . . . . . . . . . . . . . . . . . . . . . . . . . . . . . . 96
7.9 3-D histogram of x-position versus y-position measured for DSSSD-2243-5with α-particles of a 241Am source. The source is centred (left) and off-centre(right) relative to the DSSSD. . . . . . . . . . . . . . . . . . . . . . . . . . . 97
7.10 The conversion electron spectrum of 207Bi obtained by strip X4 of DSSSD-2512-17. Four peaks at 482keV, 555keV, 976keV and 1049keV are by mono-energetic electrons (left). The energy resolution for the front junction and therear ohmic side versus the strip number is plotted on the right side. . . . . . 97
7.11 The conversion electron spectrum of 207Bi obtained by strip X3 of DSSSD-2243-5 measured with the linear MPR-32 (top) and the logarithmic MPR-32(bottom). The energy resolution and the signal-to-noise ratio are E=15.3keVand 3.5:1 for the linear MPR-32 and E=19.7keV and 2.6:1 for the logarith-mic MPR-32, respectively. . . . . . . . . . . . . . . . . . . . . . . . . . . . . 98
7.12 Output signal of the CPA-16 preamplifier for a 207Bi β-source. . . . . . . . . 99
7.13 The conversion electron spectrum of 207Bi obtained by a strip of DSSSD-2243-5. Two peaks at 482keV and 976keV are by mono-energetic electrons.The high gain output signal of the CPA-16 preamplifier was sent directly tothe ADC. . . . . . . . . . . . . . . . . . . . . . . . . . . . . . . . . . . . . . 100
7.14 The ratio of the γ-transmission of aluminium and the printed circuit boardmaterial Pertinax is plotted as a function of the Al-layer. The γ-transmissionof both materials is equal for a thickness of 2mm aluminium . . . . . . . . . 101
7.15 The Cluster array of the stopped beam RISING experiments with the activestopper vessel made out of Pertinax (left) and the top cover of the activestopper chamber with the cable connectors (right) for six DSSSD arranged intwo rows. . . . . . . . . . . . . . . . . . . . . . . . . . . . . . . . . . . . . . 101
7.16 Schematic layout of the RISING set-up at the final focal plane area (S4) ofthe FRagment Separator (FRS) at GSI. The beam diagnostic elements con-sist of two multiwire detectors (MW41 and MW42), two ionisation chambers(MUSIC) and two scintillation detectors (Sc21 and Sc41). The degrader al-lows an accurate implantation of the heavy ions in the active stopper, whichis surrounded by Ge-Cluster detectors for γ-ray measurement. . . . . . . . . 102
7.17 Measured energy spectra (10MeV range of the linear MPR-32 preamplifier)obtained by x-strips (front junction) of DSSSD-2243-5 for the implantation of136Xe ions. . . . . . . . . . . . . . . . . . . . . . . . . . . . . . . . . . . . . . 103
7.18 Multiplicity distributions measured by x-strips of DSSSD-2243-5 for differentenergy thresholds. For a very low threshold (channel number 200) almost allx-strips are firing, while for the overflow (>10MeV) data the hit probabilityis very low, as expected for the implantation of 136Xe ions. . . . . . . . . . . 104
24 LIST OF FIGURES
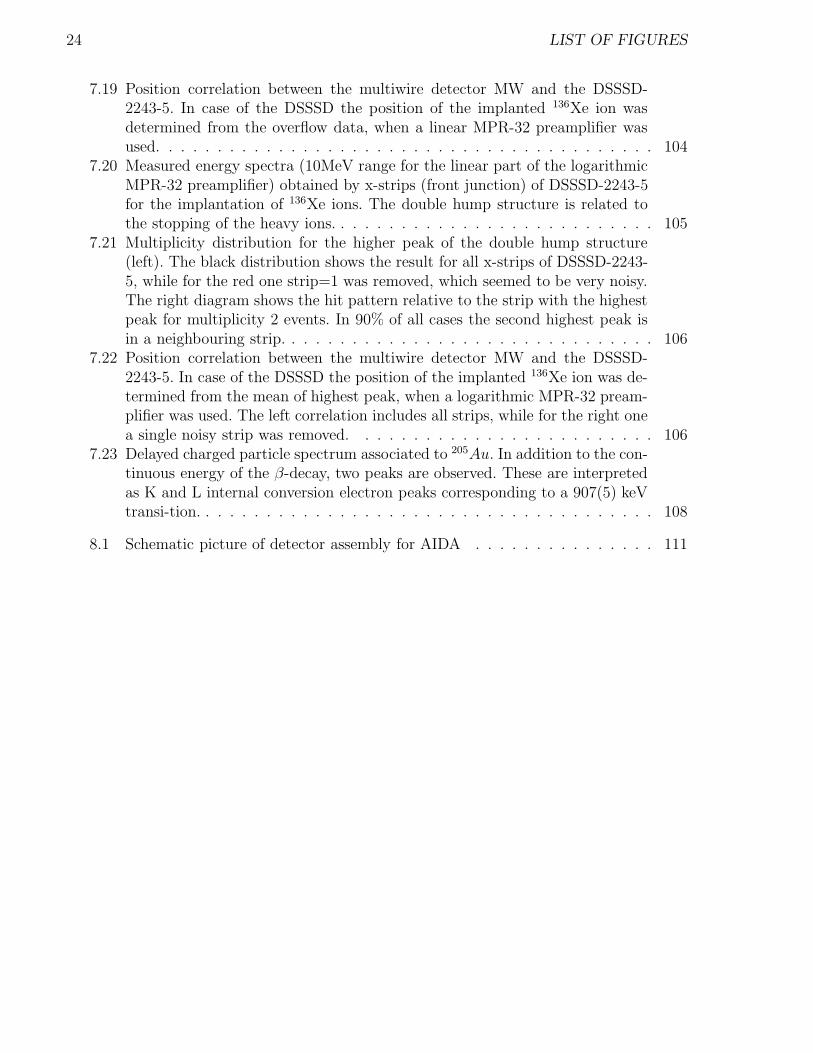
7.19 Position correlation between the multiwire detector MW and the DSSSD-2243-5. In case of the DSSSD the position of the implanted 136Xe ion wasdetermined from the overflow data, when a linear MPR-32 preamplifier wasused. . . . . . . . . . . . . . . . . . . . . . . . . . . . . . . . . . . . . . . . . 104
7.20 Measured energy spectra (10MeV range for the linear part of the logarithmicMPR-32 preamplifier) obtained by x-strips (front junction) of DSSSD-2243-5for the implantation of 136Xe ions. The double hump structure is related tothe stopping of the heavy ions. . . . . . . . . . . . . . . . . . . . . . . . . . . 105
7.21 Multiplicity distribution for the higher peak of the double hump structure(left). The black distribution shows the result for all x-strips of DSSSD-2243-5, while for the red one strip=1 was removed, which seemed to be very noisy.The right diagram shows the hit pattern relative to the strip with the highestpeak for multiplicity 2 events. In 90% of all cases the second highest peak isin a neighbouring strip. . . . . . . . . . . . . . . . . . . . . . . . . . . . . . . 106
7.22 Position correlation between the multiwire detector MW and the DSSSD-2243-5. In case of the DSSSD the position of the implanted 136Xe ion was de-termined from the mean of highest peak, when a logarithmic MPR-32 pream-plifier was used. The left correlation includes all strips, while for the right onea single noisy strip was removed. . . . . . . . . . . . . . . . . . . . . . . . . 106
7.23 Delayed charged particle spectrum associated to 205Au. In addition to the con-tinuous energy of the β-decay, two peaks are observed. These are interpretedas K and L internal conversion electron peaks corresponding to a 907(5) keVtransi-tion. . . . . . . . . . . . . . . . . . . . . . . . . . . . . . . . . . . . . . 108
8.1 Schematic picture of detector assembly for AIDA . . . . . . . . . . . . . . . 111
List of Tables
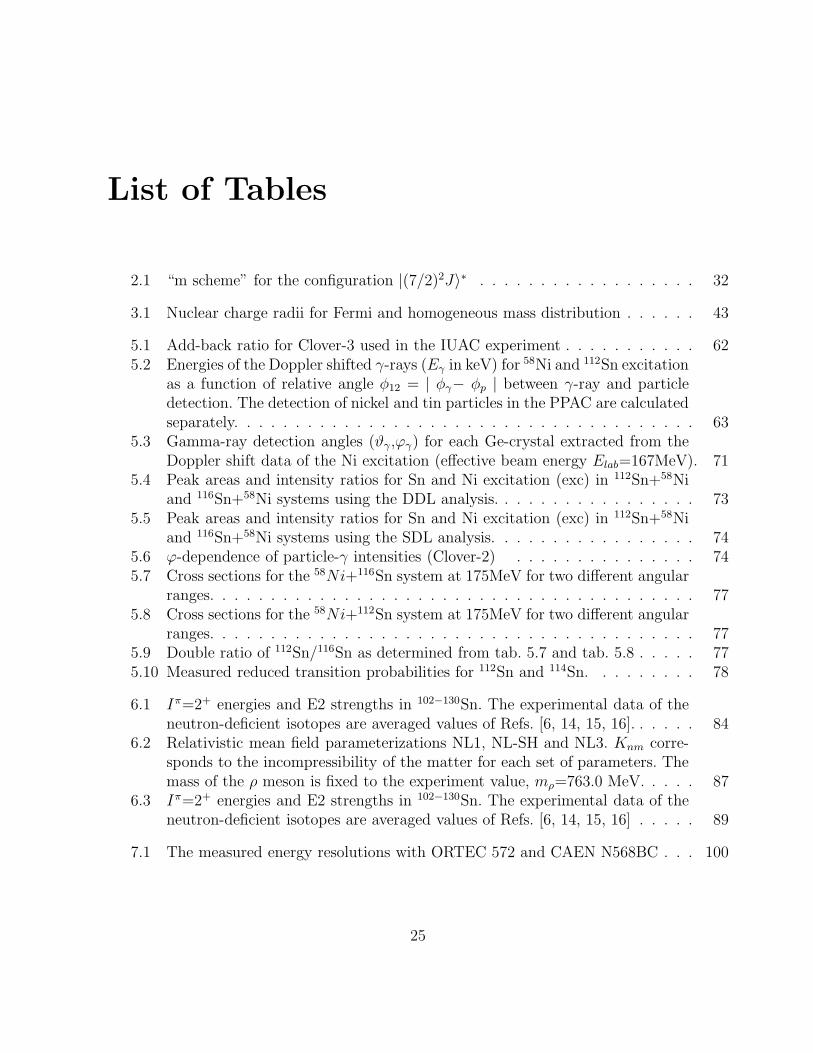
2.1 “m scheme” for the configuration |(7/2)2J〉∗ . . . . . . . . . . . . . . . . . . 32
3.1 Nuclear charge radii for Fermi and homogeneous mass distribution . . . . . . 43
5.1 Add-back ratio for Clover-3 used in the IUAC experiment . . . . . . . . . . . 625.2 Energies of the Doppler shifted γ-rays (Eγ in keV) for 58Ni and 112Sn excitation
as a function of relative angle φ12 = | φγ− φp | between γ-ray and particledetection. The detection of nickel and tin particles in the PPAC are calculatedseparately. . . . . . . . . . . . . . . . . . . . . . . . . . . . . . . . . . . . . . 63
5.3 Gamma-ray detection angles (ϑγ,ϕγ) for each Ge-crystal extracted from theDoppler shift data of the Ni excitation (effective beam energy Elab=167MeV). 71
5.4 Peak areas and intensity ratios for Sn and Ni excitation (exc) in 112Sn+58Niand 116Sn+58Ni systems using the DDL analysis. . . . . . . . . . . . . . . . . 73
5.5 Peak areas and intensity ratios for Sn and Ni excitation (exc) in 112Sn+58Niand 116Sn+58Ni systems using the SDL analysis. . . . . . . . . . . . . . . . . 74
5.6 ϕ-dependence of particle-γ intensities (Clover-2) . . . . . . . . . . . . . . . 745.7 Cross sections for the 58Ni+116Sn system at 175MeV for two different angular
ranges. . . . . . . . . . . . . . . . . . . . . . . . . . . . . . . . . . . . . . . . 775.8 Cross sections for the 58Ni+112Sn system at 175MeV for two different angular
ranges. . . . . . . . . . . . . . . . . . . . . . . . . . . . . . . . . . . . . . . . 775.9 Double ratio of 112Sn/116Sn as determined from tab. 5.7 and tab. 5.8 . . . . . 775.10 Measured reduced transition probabilities for 112Sn and 114Sn. . . . . . . . . 78
6.1 Iπ=2+ energies and E2 strengths in 102−130Sn. The experimental data of theneutron-deficient isotopes are averaged values of Refs. [6, 14, 15, 16]. . . . . . 84
6.2 Relativistic mean field parameterizations NL1, NL-SH and NL3. Knm corre-sponds to the incompressibility of the matter for each set of parameters. Themass of the ρ meson is fixed to the experiment value, mρ=763.0 MeV. . . . . 87
6.3 Iπ=2+ energies and E2 strengths in 102−130Sn. The experimental data of theneutron-deficient isotopes are averaged values of Refs. [6, 14, 15, 16] . . . . . 89
7.1 The measured energy resolutions with ORTEC 572 and CAEN N568BC . . . 100
25

26 LIST OF TABLES

Chapter 1
Introduction
Numerous experimental and theoretical studies are currently focused on nuclear shell struc-ture far from the line of stability [1 and references contained therein]. In particular, theevolution of nuclear properties, e.g. the energy of the first excited 2+
1 state and the reducedtransition probabilities across the Z = 50 chain of tin isotopes are the area of great interest forresearchers. This constitutes the longest shell-to-shell chain of semi-magic nuclei investigatedin nuclear structure to date. Radioactive ion beams yield new experimental results close tothe doubly-magic 100Sn and 132Sn, but very accurate data of the stable midshell nuclei arealso of great relevance for our understanding of nuclear structure. This thesis presents anexperimental study of reduced transition probabilities in the stable isotopes 112Sn and 114Sn,which are poorly known.
Figure 1.1: Energy of the first excited 2+1 state versus the neutron number N [2].
The experimental evidences of the closed shells (magic numbers) are displayed in fig. 1.1which shows the first excited 2+
1 states in even-even nuclei through out the periodic table.
27

28 CHAPTER 1. INTRODUCTION
Near closed shells the energies E2+
1are rather high compared to the midshell nuclei. This
experimental findings at neutron number 8, 20, 28, 50, 82 and 126 is clearly seen in thisfigure.
Figure 1.2: B(E2;0+ → 2+) values [2] across the nuclear chart for even-even nuclei in units
of a single particle value defined as B(E2;0+→2+)s.p.u. = 3·10−5 A4
3 e2b2 [3].
Another experimental indication yields the B(E2;0+→2+) values across the nuclear chart(see fig. 1.2). They are rather small for closed shell nuclei. Besides the energies E2+
1and
the reduced transition probabilities B(E2;0+ → 2+) one observes the existence of the shellstructure also from the investigation of the neutron (proton) separation energy S2n(S2p) asdiscussed in chapter 6.
The nuclear shell-model is the most successful theoretical framework for understandingthe atomic nucleus in terms of its constituent nucleons. In the shell-model, the nucleons aremoving, to first order, independently in a static potential created by all other nucleons. Theresidual interaction between nucleons is not considered. This model calculates the energyeigen-values of the nucleons which are grouped in major shells. This result explains theexperimental observation that nuclei with so-called magic proton or neutron numbers 2, 8,20, 28, 50, 82, and 126 are particularly stable. This simple model works extremely well forselected group of nuclei, namely those with one particle outside a doubly magic core.
In nuclei with more than one neutron or proton outside the major shell one has to considerthe residual interaction between the valence nucleons. When there are numerous particlesoutside the closed shells, they can enter different shell model orbits. For example, in thetin isotopes the up to 32 valence neutrons might be in five orbits 1g7/2, 2d5/2, 2d3/2, 3s1/2,1h11/2. Fig. 1.3 shows the partial level schemes of even-A Sn isotopes with the dominating6+ and 10+ yrast isomers resulting from the filling of the g7/2 and h11/2 neutron subshells in

29
A = 102-114 and A = 116-130, respectively. These two regions seem to be divided by a softclosed subshell at N = 64. If spectroscopic properties of nuclei with more than six or eightvalence neutrons are studied with the shell model, the required model space is, however,already exceedingly large. It is therefore appropriate to resort to further simplifications.
Figure 1.3: Partial level schemes [NNDC] and isomer systematics in the even-A Sn nuclei formass numbers between A = 102 and A = 130. Levels of the same spin and positive parityare connected by broken lines.
In semi-magic nuclei, such as the Sn isotopes, the seniority scheme provides a very valu-able tool for describing the low-energy spectra. The nearly constant energy of the first excited2+
1 state between N = 52 and N = 80 [2] is one of the well known features of Sn isotopes(see fig. 1.3), and is well explained within the generalized seniority model [5]. It seems toindicate that only one of the two kinds of nucleons contributes to the low energy states. As aconsequence, only the isovector (T = 1) interaction plays a leading role outside the doubly-magic core, which cannot generate quadrupole deformation [3]. Furthermore, according tothis theory, the electromagnetic transition rates between the 0+ ground and the first excited2+
1 state exhibit a parabolic behaviour as a function of mass number across the Sn isotopechain. Thus, for a seniority changing transition, the B(E2 ↑) values increase at first, peakat midshell (A = 116) and fall off thereafter.
The experimental B(E2; 0+g.s. → 2+
1 ) values, henceforth abbreviated as B(E2 ↑), onthe neutron-rich side of the Sn chain follow the theoretical predictions. For the mass rangeA = 116-130, the first excited 2+
1 state is generally an admixture of different neutron configu-rations in contrast to the pure neutron (h11/2)
n configuration for the long lived 10+ isomeric

30 CHAPTER 1. INTRODUCTION
state. For the lighter Sn isotopes, where the neutrons are filling the almost degenerate single-particle 1g7/2 and 2d5/2 states, one observes an unexpected asymmetry in E2 strengths withrespect to the heavier isotopes. This might indicate that the effective charge values dependon the orbit occupied by the nucleon. Two stable tin isotopes, 112Sn and 114Sn, yield higherB(E2 ↑) values than expected from shell model calculations, but so far large experimentalerrors prohibited further theoretical interpretations. One should also note that the B(E2 ↑)value obtained for the unstable 108Sn [6] in a RISING experiment is based on a measurementrelative to 112Sn.
The large uncertainty of the B(E2 ↑) values in 112Sn and 114Sn motivated two Coulombexcitation experiments to improve these crucial data points. In this technique the nucleus ofinterest is excited via the well known electromagnetic interaction between the two collisionpartners. In contrast to other nuclear reactions the excitation can be exactly calculated andthe B(E2) values are extracted in the model independent way.
When Coulomb excitation experiments cannot be performed due to the lack of beamintensities, nuclear information are obtained from decay studies. An active stopper for theRISING (Rare Isotope Spectroscopic INvestigation at GSI) project was developed for the β-decay studies and conversion electron spectroscopy following projectile fragmentation/fissionreactions. This system employes six double-sided silicon strip detectors in the final focalplane of the GSI FRagment Separator (FRS) to detect both the fragment implantations andtheir subsequent charged-particles (α, β, p) decays. Its development will be presented in thesecond part of this thesis.
In this doctoral thesis the less known B(E2) values of 112Sn and 114Sn are measured withhigher precision at GSI Helmholtzzentrum and at the Inter University Accelerator Centre.Chapter 2 describes the seniority scheme for the Sn isotopes. The theoretical description ofthe Coulomb excitation is given in Chapter 3. Details of the performed experiments can befound in Chapter 4. In Chapter 5 the data analysis is described and the results of B(E2)values are given. They are compared in Chapter 6 with the theoritical values of the largescale shell model (LSSM) and the relativistic quasi-particle random phase approximation(RQRPA) calculations. In Chapter 7 the realization of active stopper detector is described.Summary and the outlook can be found in Chapter 8.

Chapter 2
Pairing and Seniority in Sn Isotopes
In the shell model, the nucleus is considered as a system of nucleons moving in a commonpotential well. Many properties of such idealized systems can be obtained from the studyof the motion of one particle, the other particles showing their effect through the Pauliprinciple only, namely, in forbidding the occupation of some states by the particle considered.Obviously, a common single particle central interaction cannot replace completely the actualmutual interactions in a system of many particles. We are therefore interested in solving theSchrodinger equation
(H0 +Hresidual)Ψ(r1, r2, ..., rA) = E · Ψ(r1, r2, ..., rA) (2.1)
where H0 is the Hamiltonian of the central field
H0 =∑
[Ti + U(ri)] (2.2)
and Hresidual may include corrections to the single particle potential U(ri) as well as addi-tional two-body interactions between the particles.
2.1 Two Particle Configurations
We now discuss the effects of residual interactions which affect the energies of multi-particleconfigurations. If we consider two identical nucleons with angular momentum j1 and j2, theycan be coupled to the total angular momentum J. The easiest method to calculate J is the“m-scheme”, which is shown for the configuration |(7/2)2J〉 in tab. 2.1.
The states of two non-interacting particles moving in a central field are generally degener-ate. The residual interactions affect the energies of two-particle configuration, leading to adifference in the energies E which is given by
E(j1j2J) = 〈j1j2JM |V12|j1j2JM〉 (2.3)
31

32 CHAPTER 2. PAIRING AND SENIORITY IN SN ISOTOPES
j1=7/2 j2=7/2m1 m2 M J7/2 5/2 67/2 3/2 57/2 1/2 47/2 -1/2 3 67/2 -3/2 27/2 -5/2 17/2 -7/2 05/2 3/2 45/2 1/2 35/2 -1/2 2 45/2 -3/2 15/2 -5/2 03/2 1/2 23/2 -1/2 1 23/2 -3/2 01/2 -1/2 0 0
∗Only positive total M values are shown. The table is symmetric for M<0
Table 2.1: “m scheme” for the configuration |(7/2)2J〉∗

2.2. GEOMETRICAL ANALYSIS OF δ-FUNCTION RESIDUAL INTERACTION 33
In the following, we consider the simple δ-function interaction, which can be written as
V12(δ) = −V0 · δ(r1 − r2) (2.4)
Using the polar coordinates and performing angular momentum algebra calculations [3], weobtain for the energy shifts in the identical particle configuration |j1j2J〉
∆E(j2J) = −V0 · FR(nl) · A(j2J) (J even) (2.5)
where
FR(nl) =1
4π
∫
1
r2· R4
nl(r) dr (2.6)
and
A(j2J) =(2j + 1)2
2
j j J1/2 −1/2 0
2
(2.7)
Note that for J=0 the energy lowering is largest and the energy spacings decrease with J.For the 2-particle configuration |7/2, 7/2, J〉 the relative energy values∆E/[V0FR(nl)] are 4.0 (0+ state), 0.952(2+ state), 0.467(4+ state) and 0.233(6+ state). Thisproperty is identical to that defined for a pairing interaction.
2.2 Geometrical Analysis of δ-Function Residual
Interaction
It is also possible to approach this entire subject from an alternate view point and actuallyderive the typical behaviour of the 3J-symbol from a simple geometrical analysis. Using asemi-classical concept, we can determine an angle θ between the angular momentum vectorsj1 and j2 of the two particles, as illustrated schematically in fig. 2.1. In this case,
cosθ =J2 − j2
1 − j22
2|j1||j2|(2.8)
Note that θ=180 corresponds to J=0.In the following, we make use of some trignometric equations. Finally we can approxio-
mate the 3-J symbol for identical particles by
j j J1/2 −1/2 0
2
≈ sin2 θ2
π · j2 · sinθ (2.9)
For the angular dependence of the δ-function residual interaction we obtain
∆E(j2J) =−V0 · FR
πtan
θ
2(T = 1, J even) (2.10)

34 CHAPTER 2. PAIRING AND SENIORITY IN SN ISOTOPES
Figure 2.1: Schematic illustration of geometrical interpretation of short-range residual inter-cation for two particle configuration j1 and j2.
This extremely simple result expresses the energy shifts in different J states for a δ-interaction between two identical particles in equivalent orbits. It was derived for large j, J,but is remarkably accurate even for low spins. This property is identical to that defined fora pairing intercation.
For the 2-particle configuration |(7/2)2, J〉 the angle θ between the angular momentumvectors is 171 (0+ state), 143 (2+ state), 111 (4+ state) and 72 (6+ state). For 112Sn thegeometrical analysis of the partial level scheme is shown in fig. 2.2. In the T=1 case, theempirical energy distribution follows the expected energy pattern quite well.
2.3 Generalized Seniority Scheme
The shell model [7] has been used for many years to describe the structure of nuclei, especiallythose that are fairly light or moderately near closed shells. With the steady improvement ofcomputers, the size of the model space that can be accomodated has grown, expanding theregion of nuclei that can be treated. Even so, some nuclear properties are not well explainedwith the valence space comprising a single major shell, suggesting the need for still largermodel spaces. It is clear, however, that when the size of the single-particle valence space isincreased, some truncation of the configuration space is necessary if calculations are to becarried out. One possibility is to use the generalized-seniority [5] or broken-pair [8] approx-

2.3. GENERALIZED SENIORITY SCHEME 35
Figure 2.2: A geometrical analysis of the |(g7/2)2, J〉 multiplet in 112Sn. The angular depen-
dence of the δ-function residual interaction strength is shown on the left with the semiclassicalangle for the two identical particles in the equivalent orbits (T=1).
imation. This method has been widely used to approximate the shell model [9], especiallywhen dealing with semi-magic nuclei. In the following, a brief overview of the generalized-seniority approach is presented [3].The seniority scheme was introduced by Racah [10, 11] for the classification of states inatomic spectra. His aim was to find an additional quantum number in order to distinguishbetween states of electron ℓn configurations which have the same values of S, L and J (andM). This problem arises most frequently in LS-coupling, which is the prevalent couplingscheme of atomic electrons, than in jj-coupling. The seniority scheme for jn configurationsof identical nucleons was introduced by Racah [12] and independently by Flowers [13].
The scheme introduced by Racah is based on the idea of pairing of particles into J=0pairs. Loosely speaking, the seniority quantum number ν , is equal to the number of un-paired particles in the jn configuration, where n is the number of valence nucleons. Thedoubly-magic core nucleus plays the role of the vacuum. In the special case of j2 configu-rations, there is complete pairing in the J=0 state and its seniority is ν = 0. In all otherj2 states, with J=2, 4,.....2j-1, there are no pairs coupled to J=0 and the seniority is ν=2.Hence, the low energy states of (semi-magic) nuclei are states of low generalized seniority.The shell-model problem can now be solved in a truncated space of low generalized seniority.
Of particular interest are the energy levels in semi-magic nuclei with ν=2 and J=2, 4,....,2j-1. They appear in all jn configurations with n even and 2j+1>n>0. If the two-body inter-action V=
∑ni<k Vik is diagonal in the seniority scheme, they should have the same spacing

36 CHAPTER 2. PAIRING AND SENIORITY IN SN ISOTOPES
(also between them and the J=0, ν=0 ground state) in all nuclei. The relevant formulae forthe energy differences are given below
E(jn, ν = 2, J) − E(jn, ν = 0, J = 0) = 〈j2J |V |j2J〉 +n− 2
2V0 −
n
2V0
= 〈j2J |V |j2J〉 − V0 (2.11)
The energies of the ν=2 states are independent of n. For the spacing within the ν=2states one obtains
E(jn, ν = 2, J) −E(jn, ν = 2, J ′) =
[
〈j2, J |V |j2, J〉 +n− 2
2V0
]
−[
〈j2, J ′|V |j2, J ′〉 +n− 2
2V0
]
= 〈j2, J |V |j2, J〉 − 〈j2, J ′|V |j2, J ′〉 (2.12)
Thus, all the energy differences of seniority ν=0 and ν=2 states in the n-particle configu-ration are identical to those in the two-particle system and are independent of n. It is alsoimportant to note, that the two-body interaction matrix elements of seniority ν states in thejn configuration (n even) are related to the matrix elements in a jν configuration.The Sn nuclei provide a classic example of eq. 2.11 and its generalization to the multi-j case:the entire known set of ν=2 levels, J=0+, 2+,... is virtually constant across an entire majorshell (fig. 2.3)
For the E2 transition rates, induced by the operator Q=r2Y2, from the first 2+ state tothe 0+ ground state in even-even nuclei one obtains
⟨
jn, J = 2 ‖ Q ‖ jn, J = 0
⟩2
=
[
n·(2j+1−n)2·(2j−1)
]
·⟨
j2, J = 2 ‖ Q ‖ j2, J = 0
⟩2
=(2j + 1)2
2 · (2j − 1)· f · (1 − f)
·⟨
j2, J = 2 ‖ Q ‖ j2, J = 0
⟩2
(2.13)
where f=n/(2j+1) is the fractional filling of the shell. One should notice that matrix elementsin the configuration jn are linked to those in the configuration jν which is the power of theseniority scheme. For shells that are not too filled, so that (2j±1)≫n, this becomes
⟨
jn, J = 2 ‖ Q ‖ jn, J = 0
⟩2
≈ n
2
⟨
j2, J = 2 ‖ Q ‖ j2, J = 0
⟩2
(2.14)
2.3. GENERALIZED SENIORITY SCHEME 37
Figure 2.3: Partial level schemes [NNDC] in the even-A Sn nuclei for mass numbers betweenA=102 and A=130.
This expression increases as the number of particles n in the shell. The reduced transitionprobability is defined as
B(E2; Ji → Jf) =1
2Ji + 1
⟨
Jf ‖ Q ‖ Ji
⟩2
(2.15)
In the jn configuration the B(E2) value is just propotional to the number of particles n inthe shell, for small n. For large n, n → 2j+1, it falls off, vanishing, as it must, at the closedshell. For j, n≫2, we see that, as given in the general case (eq. 2.13) above,
B(E2; 2+1 → 0+
1 ) ≈ f · (1 − f) (2.16)
This behaviour is commonly observed in real nuclei, with B(E2;2+1 → 0+
1 ) values risingto mid-shell, and falling thereafter. Data beautifully illustrating this are shown for Z=50,N=50-82 in (fig. 2.4). For transitions that do not change seniority, the expression is [assumingν=2]
⟨
jn, J ‖ Q ‖ jn, J ′
⟩
=
(
2j+1−2n2j−3
)⟨
j2, J ‖ Q ‖ j2, J ′
⟩
=2j + 1
2j − 3· [1 − 2f ]·
⟨
j2, J ‖ Q ‖ j2, J
⟩
(2.17)
It has an interesting behaviour as a function of n. For low ν the numerator goes simply as(1-2f). It therefore has opposite signs in the first and second halves of the shell and hence

38 CHAPTER 2. PAIRING AND SENIORITY IN SN ISOTOPES
Figure 2.4: B(E2 ↑) values in the even-A Sn nuclei for mass numbers between A=106 andA=130. The data are from NNDC and [6, 14, 15, 16].
Figure 2.5: Measured E2 transition matrix elements for the (νh11/2)n 10+ → 8+ transitions
in even-A Sn isotopes [17, 18].
must vanish identically at mid-shell. This is why nuclei are prolate at the begining of theshell and (sometimes) oblate at the shell.Fig. 2.5 shows the square root of the reduced transition probabilities B(E2, 10+ → 8+) ver-sus the mass number in even-A Sn isotopes. The square root leaves ambiguity about the signof the E2 matrix element, but in practice this causes no difficulty because opposite signs arerequired in the bottom and top halves of the subshell.

Chapter 3
Coulomb Excitation
Coulomb excitation is a nuclear reaction in which a target/projectile nucleus is excited bythe common electromagnetic field. Stable targets are bombarded with heavy ions at energiesso low that the Coulomb repulsion prevents the particle from touching each other, thus as-suring a pure Coulomb interaction process. This process has been extensively used to studythe excited states in nuclei. Let us discuss the theory in detail.
3.1 Theoretical Description
In the collison between two heavy ions the electromagnetic interaction depends on the electro-magnetic multipole moments of both nuclei, thus during the process, one or both nuclei maybe excited. The excitation cross section can be expressed in terms of the same electromag-netic multipole matrix elements which also characterize the decay process. If the Coulombexcitation can be described in the semiclassical approach the calculations becomes very easy.
3.2 Semiclassical Theory
Although quantam-mechanical calculations are performed for heavy ion scattering, the un-derstanding of reactions between heavy ions is greatly facilitated by applying semiclassicalconcepts [19, 20] to these processes. In order to decide whether a classical description isjustified one should compare the wavelength λ− (eq. 3.15) of the projectile with a dimensioncharacteristic for the classical orbits, e.g the distance of closest approach in a head on col-lision D(θcm = π) (eq. 3.13). If λ− ≪ D(θcm = π), one can form a wave packet which movesalong a hyperbolic orbit exactly like a classical particle. It is convenient to introduce theSommerfield parameter which measures the strength of the Coulomb interaction i.e.,
η =D(θcm = π)
2 · λ− = 0.157 · Z1 · Z2 ·√
A1
Tlab
(3.1)
39

40 CHAPTER 3. COULOMB EXCITATION
In eq. 3.1, the numerical value is obtained for the initial energy Tlab expressed in MeV. Z1, A1
and Z2, A2 denote charge and mass numbers (in atomic mass unit) of projectile and targetnucleus, respectively. The Sommerfeld parameter η is illustrated in fig. 3.1 as a function ofthe target charge number for various projectiles.
Figure 3.1: Sommerfeld parameter η (eq. 3.1) as a function of the target charge number Z2
for various projectiles at the safe bombarding energy (eq. 3.16).
If the Sommerfield parameter is significantly larger than unity (η ≫ 1), one may describethe relative motion of the particles by classical hyperbolic orbits. In the heavy ion reaction58Ni on 112Sn at 175 MeV investigated at IUAC the value for η = 127 which justifies the useof semiclassical approach.Fig. 3.2 shows the hyperbola (θcm=120) for the 58Ni+112Sn system at 175 MeV, which iscompletely specified by the charge numbers, the energy and the scattering angle. It is usu-ally described in its parametric representation which simultaneously determines the positionof the projectile and the time in terms of a dimensionless parameter. The parameter ω isintroduced by the relations
r = a · (ǫ · coshω + 1) (3.2)

3.2. SEMICLASSICAL THEORY 41
t =a
v· (ǫ · sinhω + ω) (3.3)
where ǫ = 1/sin(12θcm) is the excentricity of the classical orbit, v the projectile velocity and
the quantity a is half the distance of closest approach in a head-on-collision, i.e.
a =0.72 · Z1 · Z2
Tlab· A1 + A2
A2[fm] (3.4)
When the parameter ω varies from -∞ to +∞ the particle moves along the hyperbola
Figure 3.2: Classical picture of the 58Ni projectile orbit (θcm=120) in the Coulomb field ofthe 112Sn nucleus at 175MeV. The hyperbolic orbit of the projectile is shown in the relativeframe of reference where the target is at rest. The nuclear charge radii are displayed (fordetails see text) as well as the nuclear interaction radius (dashed dotted lines).
in such a way that the point of closest approach is reached for ω=t=0. In the coordinatesystem where the z-axis is chosen along the angular momentum ℓ, the projectile coordinatesare given by
x = a · (coshω + ǫ) (3.5)
y = a ·√ǫ2 − 1 · sinhω (3.6)
z = 0 (3.7)

42 CHAPTER 3. COULOMB EXCITATION
The resulting hyperbola is symmetric around the x-axis, while the one depicted in fig. 3.2 isrotated around the z-axis with an angle of ϑR = θcm−π
2, using the following relations
x1 = x · cosϑR + y · sinϑR (3.8)
y1 = −x · sinϑR + y · cosϑR (3.9)
z1 = z (3.10)
For the hyperbola, we can determine the impact parameter b [for y1(ω = −∞)], angularmomentum ℓ and the distance of closest approach D [for r(ω = 0)] from the measuredscattering angle θcm.
b = a · cotθcm
2(3.11)
ℓ = k∞ · b = η · cotθcm
2(3.12)
D = a·[
sin−1
(
θcm
2
)
+ 1
]
(3.13)
The asymptotic wave number k∞ is given by
k∞ = 0.219 · A2
A1 + A2·√
A1 · Tlab [fm−1] (3.14)
For the 58Ni+112Sn system at 175 MeV, an asymptotic wave number of k∞=14.5 fm−1 iscalculated which yields an impact parameter of b=5.05 fm, an angular momentum of 73.4h and a distant of closest approach of D=18.8 fm at a scattering angle of θcm=120.The de Broglie wavelength is given by
λ− = (k∞)−1 (3.15)
We can rewrite eq. 3.13 for the special case θcm = 180 (D=2a) to obtain the expression forthe safe bombarding energy
Tsafe =1.44 · Z1 · Z2
D· A1 + A2
A2[MeV ] (3.16)
where D= C1 + C2 + 5.0 [fm] is the safe distance.C1 and C2 are the matter half-density radii (Fermi distribution) of the collision partners[21]. For the estimates in the present section, we use
Ci = Ri · (1 −R−2i ) (3.17)
and where Ri is the nuclear radius for a homogeneous mass distribution [22], which isparametrized as
Ri = 1.28 · A1/3i − 0.76 + 0.8 · A−1/3
i (3.18)

3.3. MULTIPOLE EXPANSION 43
Isotope Ri(fm) Ci(fm)58Ni(i=1) 4.40 4.17112Sn(i=2) 5.58 5.40
Table 3.1: Nuclear charge radii for Fermi and homogeneous mass distribution
For the 58Ni+112Sn system the nuclear charge radii are displayed in fig. 3.2 and the summa-rized in tab. 3.1.
Fig. 3.2 shows for completeness the nuclear interaction radius Rint=12.55fm which iscalculated by
Rint = C1 + C2 + 4.49 − C1 + C2
6.35[fm] (3.19)
In the present Coulomb excitation experiment, this distance required for nuclear reactions isnot reached since the incident energy of 175MeV is well below the safe bombarding energyof 210MeV for the 58Ni+112Sn system.
3.3 Multipole Expansion
Figure 3.3: Schematic picture of an extended charge distribution (see text)
In the semiclassical approach the projectile is treated as a point object and target nucleusas an extended object (see fig. 3.3) . The electric potential is defined as

44 CHAPTER 3. COULOMB EXCITATION
U(~r) =∫ ∫ ∫
ρp(~r′)
| ~r − ~r′ |dτ ′ (3.20)
where ρp(~r′) is the electric charge distribution. One expands the radial dependence as afunction of spherical harmonics
1
|~r − ~r′|=
∞∑
ℓ=0
r′ℓ
rℓ+1· 4π
2 · ℓ+ 1
ℓ∑
m=−ℓ
Yℓm(θ, φ) · Y ⋆ℓm(θ′, φ′) (3.21)
In the following we consider two physical cases:CASE 1: electric monopole when ℓ=m=0
Y00(θ, φ) = Y00(θ′, φ′) =
1√4π
(3.22)
In this case one obtain the following radial dependence
1
|~r − ~r′|=
1
r(3.23)
Therefore, the potential for the electric monopole is given by
U(~r) =∫ ∫ ∫
ρp(~r′)
rdτ ′ (3.24)
Inserting the homogenous charge distribution
ρp(~r′) =3 · Z · e
4 · π · R03 (3.25)
in eq. 3.24 one obtains, the well-known result
U(~r) =3 · Z · e
4 · π · R03 · 1
r·∫ ∫ ∫
r′2dr′sinθ′dθ′dφ′
=3 · Z · e
4 · π · R03 · 1
r· R0
3
3· 4 · π
=Z · er
(3.26)
For point like charges, the scattering cross-section is given by the Rutherford cross section
dσRuth
dΩcm=a2
4· sin−4 θcm
2(3.27)
CASE 2: electric multipole when ℓ=2,mThe potential is given by
U(~r) =∞∑
ℓ=0
ℓ∑
m=−ℓ
4 · π2 · ℓ+ 1
· 1
rℓ+1· Yℓm(θ, φ)
∫ ∫ ∫
ρp(~r′) · r′ℓ · Y ⋆ℓm(θ′, φ′)dτ ′ (3.28)

3.3. MULTIPOLE EXPANSION 45
After reordering the multipole moment is defined by
M⋆(ℓ,m) =∫ ∫ ∫
ρp(~r′) · r′ℓ · Y ⋆ℓm(θ′, φ′)dτ ′ (3.29)
The reduced transition probability B(E2 ↑) is related to the nuclear matrix element by theformula
B(Eℓ = 2; Ii → If ) =∑
Mf ,m
< IfMf |M(ℓ = 2, m)|IiMi >2 (3.30)
According to the Wigner-Eckart theorem, a matrix element of an operator M(ℓ,m) leads tothe following reduced matrix element
< IfMf |M(E2, m)|IiMi >= (Ii2Mim|IfMf ) < If ||M(E2)||Ii > (3.31)
where (Ii2Mim|IfMf) is a Clebsch-Gordan coefficient. The reduced matrix element < If ||M(E2)||Ii >contains the information about the nuclear wave functions. Then, according to the or-thonormality of the Clebsch-Gordan coefficients, we obtained the following expression forthe B(E2 ↑) values:
B(E2; Ii → If) =1
2 · I1 + 1< If ||M(E2)||Ii >2 (3.32)
This expression assures that the lifetime of a state does not depend on its orientation (ro-tational invariance). Neglecting conversion coefficients, one obtains the following relationbetween the lifetime of a state and the reduced transition probability
1
τ∼= 1.23 · 1013 · B(E2, If → Ii) · E5
γ [s−1] (3.33)
For the scattering of point-like objects with an extended nucleus (shown in fig. 3.3), thedifferential inelastic cross section is given by
dσi→f
dΩcm
= Pi→f ·dσRuth
dΩcm
(3.34)
where Pi→f is the excitation probability. For the simplest case of a one step excitation theinelastic cross section can be written analytically as
dσE2∼= 4.819·
(
1 +A1
A2
)−2A1
Z22
· TMeV · B(E2; Ii → If ) · dfE2(η, ξ) [b] (3.35)
where dfE2 is a classical function which is closely related to the orbital integral. The functiondfE2 depends on the adiabaticity parameter ξ, which is given by
ξ =Z1 · Z2 · A1
1
2 · E ′
MeV
12.65 · (TMeV − 12E ′
MeV )3
2
(3.36)
where

46 CHAPTER 3. COULOMB EXCITATION
E ′
MeV =(
1 + A1
A2
)
· EMeV
and E is the energy of an excited state. For the 58Ni+112Sn system at 175 MeV oneobtains an adiabaticity parameter of 0.70. Fig. 3.4 shows the inelastic cross section for the2+ excitation in 112Sn. The single step excitation was performed with a reduced transitionprobability of B(E2; 0+ → 2+)=0.240e2b2. One notices a maximum of the inelastic crosssection which can be moved to higher scattering angles for larger adiabaticity parameter ξ.The relation of the reduced transition probability between the excitation B(E2 ↑) and thedecay B(E2 ↓) of the nuclear state is given by
B(E2; If → Ii) =2 · Ii + 1
2 · If + 1· B(E2; Ii → If ) (3.37)
since the absolute value of the reduced matrix element is invariant under the interchange ofIi and If . In case of an E2 transition between ground state 0+
gs and the first excited state2+
1 , we obtainB(E2; 0+
gs → 2+1 ) = 5 · B(E2; 2+
1 → 0+gs) (3.38)
Figure 3.4: Inelastic cross section for the single-step 2+ excitation in 112Sn(B(E2; 0+ → 2+ )= 0.240 e2b2) after the scattering of 58Ni projectiles at an energy of175MeV.
In the collision between two heavy ions, both target and projectile can usually be ex-cited. In most cases one has to consider only the monopole-multipole fields, in which themonopole moments, i.e. the electric charges, are undisturbed by excitations. If the projec-tile is a composite particle (fig. 3.3), the process is entirely analogous to the excitation ofthe target nucleus, and corresponds merely to the interchange of the roles of target nucleus

3.4. ANGULAR DISTRIBUTION OF DE-EXCITATION γ-RAYS 47
and projectile. It differs from the evaluation of the target excitation through kinematical ef-fects associated with the centre-of-mass motion (Tlab/A1=constant). The interaction is nowpropotional to the projectile reduced transition probability.In the collision of two heavy ions, where both of them may have large deformations, one hasto study the effect of the multipole-multipole interactions. In most experiments these effectsare, however, negligibly small.
3.4 Angular Distribution of De-Excitation γ-Rays
The nuclear states populated by Coulomb excitation decay by emission of γ-radiation orconversion electrons. Since the time scales for the excitation process (10−22 − 10−21s) andthe γ-ray decay (10−15−10−9s) are quite different, the differential cross section for observingboth the scattered particle and the γ-quantum is given by the following product
d2σ
dΩlabp dΩlab
γ
=dσRuth
dΩcm· dΩcm
dΩlab· dW (γN→M)
dΩrestγ
· dΩrestγ
dΩlabγ
(3.39)
where dσRuth
dΩcmis the Rutherford cross-section (eq. 3.27) in the centre-of-mass system. If the
projectile is detected, the transformation from the cm-system to the lab-system yields
dΩcm
dΩlab=
sin2ϑ1
sin2θcm· cos(θcm − ϑ1) (3.40)
with
θcm = ϑ1 + arcsin(
A1
A2· sinϑ1
)
(3.41)
For the detection of the target nucleus, one obtains
dΩcm
dΩlab
=1
4 · cosϑ2
(3.42)
The angular distribution for γ-quanta from an excited state N to a state M has also to betransformed from a coordinate system where the target nucleus is at rest to the laboratorycoordinate system by
dΩrestγ
dΩlabγ
=
(
Eγ
Eγ0
)2
(3.43)
where Eγ is the Doppler shifted γ-ray energy in the laboratory frame and Eγ0 is the tran-sition energy between the energy levels N and M. The angular distribution may be written as
dW (γN→M)
dΩrestγ
= (4 · π)−1
2 ·∑
k=0,2,4
∑
−k≤K≤k
AkK ·Qk ·Gk · FkK(IM , IN) · YkK(θγ , φγ − φ1) (3.44)
where AkK denote the statistical tensors of the excitation, Qk are corrections due to thefinite solid angle of the Ge-detectors [23], Gk are the deorientation coefficients [24] and

48 CHAPTER 3. COULOMB EXCITATION
Fk(IM , IN) are the γγ-correlation coefficients [20] . The spherical harmonics YkK dependon the polar angles θγ and φγ . Fig. 3.5 shows a particle-γ correlation with 58Ni projectilesbeing detected at angles of θcm = 45 and −9 ≤ φcm ≤ 9 (full curve) and 81 ≤ φcm ≤99 (dashed curve). The γ-rays of the 2+ → 0+ transition in the 112Sn are measured with aGe-detector in plane (φγ = 0 or φγ = 180). No intergration over the finite solid angle ofthe Ge-detector was performed and the deorientation effect was not considered.
Figure 3.5: Particle-γ angular correlation for 58Ni projectiles scattered at angles of θcm=45
and −9 ≤ φcm ≤ 9 (full curve) and 81 ≤ φcm ≤ 99 (dashed curve). The γ-rays of the2+ → 0+ transition in 112Sn are measured with Ge-detectors in plane (φγ =0 or φγ =180).The beam and target is indicated as well as the scattering at θcm=45.
For the geometry in which the projectiles are detected in an annular counter symmetricaround the beam axis, one finds the following angular distribution:
dW (γN→M)
dΩrestγ
= A00 ·Q0 ·G0 · F0(0, 2) · 1
2
+ A20 ·Q2 ·G2 · F2(0, 2) ·√
5
16· (3 · cos2θγ − 1)
+ A40 ·Q4 ·G4 · F4(0, 2)
·√
9
256· (35 · cos4θγ − 30 · cos2θγ + 3) (3.45)
with the γγ-correlation coefficients for the 2+ → 0+ transition F0(0, 2)=1,
F2(0, 2)= -√
514
and F4(0, 2)= -√
87
one obtains

3.4. ANGULAR DISTRIBUTION OF DE-EXCITATION γ-RAYS 49
dW (γN→M)
dΩrestγ
= A00 ·Q0 ·G0 ·1
2
− A20 ·Q2 ·G2 ·√
25
56· 1
2(3 · cos2θγ − 1)
− A40 ·Q4 ·G4 ·√
18
7· 1
8(35 · cos4θγ − 30 · cos2θγ + 3) (3.46)
A γ-ray angular correlation for a 2+ → 0+ transition in 112Sn after the scattering of 58Niprojectiles at an angle of θcm=45 is shown in fig. 3.6.
Figure 3.6: γ-ray angular correlation for 2+ → 0+ transition in 112Sn after the scatteringof 58Ni projectiles at an angle of θcm=45. The calculation was performed without takinginto account the deorientation effect (Gk=1) and the integration over a finite size of the Gedetector (Qk = 1). The dashed line shows an isotropic γ-ray angular correlation.


Chapter 4
The Experimental Method
4.1 Overview
Two Coulomb excitation experiments [25, 26] were performed at Helmholtzzentrum fur Schw-erionenforchung GSI, Darmstadt (Germany) [27] and Inter University Accelerator CentreIUAC, New Delhi (India) [28] to investigate the different tin isotopes. Fig 4.1 shows thepictures of the particle-γ coincidence set-up at GSI and at IUAC.
Figure 4.1: Particle-γ coincidence set-up at GSI (left) and at IUAC (right).
At GSI we performed two consecutive measurements using 114Sn and 116Sn beams atan energy of 3.4A MeV on a 58Ni target. The tin beams were provided by the UNILACaccelarator at GSI. Beam particles were incident on a 0.7mg/cm2 58Ni target with a purityof 99.9%. In the experiment carried out at IUAC, targets of 112Sn and 116Sn were bombardedwith 58Ni beam at 175 MeV using a tandem Van de Graaf accelerator. Both targets were ofthickness 0.53mg/cm2 with an enrichment of 99.5% and 98%, respectively. In both cases thebombarding energy was well below the safe bombarding energy [see chapter 3].
51

52 CHAPTER 4. THE EXPERIMENTAL METHOD
The scattered beam particles and recoils were detected in an annular gas-filled parallel plateavalance counter PPAC [29, 30], subtending the angular range 15 to 45 in the forwarddirection. De-excitation γ-rays emitted after Coulomb excitation were measured with twoSuper-Clover (Ge) detectors [31] mounted at forward direction (GSI) and four Clover(Ge)detectors [31] mounted at backward direction (IUAC), respectively. The schematic view ofthe experiment performed at IUAC is shown in fig. 4.2.
Figure 4.2: Schematic view of the experiment perfomed at IUAC. A position sensitive annulargas-filled parallel plate avalanche counter (PPAC) was placed in forward direction coveringthe angular range of 15 ≤ ϑlab ≤ 45. Four Clover detectors were mounted at ϑγ ∼135
with respect to the beam direction.
The PPAC was position-sensitive in both the azimuthal ϕ and the polar ϑ angles. Theazimuthal angle ϕ was obtained from the anode foil which was divided into 20 radial sectionsof 18 each. In order to measure the polar angle, ϑ, the cathode was patterned in concentricalconductor rings of constant tanϑ, each 1mm wide, with an insulating gap of 0.5mm betweenthem. Each ring was connected to its neighbour by a delay-line of 2ns per tap. The cathodesignals were read out from the innermost and outermost rings, and the ϑ information wasderived from the time difference of the anode and cathode signals. The scattering angle ϑ is

4.2. KINEMATICS AND PARTICLE IDENTIFICATION 53
related to the delay line signals by
tanϑ ≈ delay inner contact− delay outer contact (4.1)
It can be calibrated by the boundaries of the PPAC using the following linear equation.
tanϑ =tan45 − tan15
ch2 − ch1· (ch− ch1) + tan15 (4.2)
In both experiments Clover Germanium (Ge) detectors were used to measure the de-excitedgamma rays. Each Clover detector consists of four coaxial N-type Ge crystals arranged like afour leaf clover. At GSI two Super-Clover Ge-detectors were mounted at angles of ϑγ = 25
relative to the beam axis in the forward direction at a distance of 20 cm from the target.Each Germanium crystal had a length of 140 mm and a square front face with two flat partsat 90 along the whole length and two tapered parts at an angle of 15. The front sidesof the Super-clover detectors were covered by a stacked shielding of 0.2mm Ta, 1.0mm Sn,and 0.5mm Cu plates. The addback factor of Super Clovers at 1.3 MeV was 1.3. At IUACthe Ge crystals dimensions were 80cm in diameter and 80cm in length. The four Cloverdetectors (distance to target 22±2cm) were mounted at ϑγ ∼135 with respect to the beamdirection. The ϕγ-angles for the Clover detectors were ±55 and ±125 with respect to thevertical direction (see fig. 4.2). Low energy radiations were suppressed by using Cu, Sn andPb absorbers of thickness between 0.5 mm and 0.7 mm placed in front of Clover detectors.The addback factor for the Clovers was 1.5 for a γ-ray energy of 1MeV.
4.2 Kinematics and Particle Identification
In the following, the kinematics for both experiments will be discussed. The data are dis-played in the fig. 4.3 for the Coulomb excitation performed at GSI (left) and at IUAC (right).The kinetic energies of both reaction partners are displayed as a function of the centre-of-mass (c.m) scattering angle (θcm) and the scattering angles in the laboratory frame for therecoil nucleus (ϑ4) and the projectile (ϑ3), respectively. In both the cases the scattered par-ticles are detected in the angular range between 15 and 45 in laboratory frame.
For Sn beams (GSI) kinematical correlations were used to discriminate between targetnuclei and projectiles. The used parallel plate avalanche counter (PPAC) was placed 13cmdownstream of the target and splitted into two independent parts, in a left (L) and a right(R) half. The flight time difference TOF was measured between L and R. If the projectile(particle-3) is detected in the left half, then ϑ3 is plotted versus t3 − t4 in the correlationdiagram. In case of a detected target nucleus in the left half, ϑ4 is plotted versus t4 − t3.In this way one obtains the theoreitical plot which can be compared with the experimentaldata in fig. 4.4. The figure presents data from the 116Sn beam striking on the 58Ni target asan example.

54 CHAPTER 4. THE EXPERIMENTAL METHOD
Figure 4.3: Kinematics of Coulomb excitation experiments with 114Sn beam on 58Ni target(left) and with 58Ni beam on 112Sn target (right). Energy dependence of both reactionpartners is plotted as a function of the scattering angle in the centre of mass system (θcm)and laboratory frame (ϑ3,ϑ4). Solid lines correspond to projectile-like fragment and thedashed lines correspond to target-like fragments.
Figure 4.4: Scattered projectiles and target nuclei coincidences were detected in the PPACfor the 116Sn beam incident on the 58Ni target. The scattering angle is plotted versus theflight time differences of both reaction partners. The corresponding kinematical cuts appliedfor coincident γ-rays are indicated. See text for details.
For the Sn projectiles there exists a maximum kinematical angle given by
ϑmax = arcsinA2
A1(4.3)

4.3. ELECTRONICS 55
yielding a value of ϑmax=30.0(30.6) for the system 116Sn(114Sn)+58Ni. Fig. 4.4 demonstratesthe unambiguous identification of projectile and target nucleus and the assignment of thecorresponding scattering angle θcm. For ejectiles detected in the PPAC, the correspondingscattering angles of 114Sn and 116Sn varied between 24 ≤ ϑlab ≤ 31.
Figure 4.5: Kinetic energies of the scattered 58Ni projectiles and 112Sn recoils detected in theangular range of 15 to 45 covered by the PPAC. The dashed lines are based on two bodykinematics for a beam energy of 175 MeV, while full lines are corrected for energy loss [32]in a 10 µm MYLAR foil, which was used as entrance window of the PPAC.
For the measurement performed at IUAC only one particle, the projectile or the recoil,was detected in the sensitive angular range. Therefore TOF measurements were not pos-sible. However, the differential energy loss dE
dX(Z=28) 6= dE
dX(Z=50) allowed to suppress one
reaction partner. An entrance window of 10µm thick MYLAR foil was used for the particlecounter which reduced the kinetic energy of both reaction partners (see fig. 4.5). The energyloss in MYLAR (ρ=1.39 g/cm3) was taken from Northcliff and Schilling [32]. While the 58Niprojectiles could still be measured in the PPAC, the Sn recoils were either stopped in theentrance window or were close to the detection limit (for details of the analysis see chapter5). In this way distant collisions (Ni detected in PPAC) could be selected for the analysis.
4.3 Electronics
Both data acquisition (DAQ) systems for the experiments performed at GSI and IUAC werevery similar. During the IUAC experiment, 16 energies from the four Clover detectors, fourtiming signals from the Clover, 20 timing signals from individual front PPAC detectors, andfour signals from the two ends of the delay lines were recorded event by event. Energy andtime signals were taken from each Ge crystal and the pulse processing was carried out using

56 CHAPTER 4. THE EXPERIMENTAL METHOD
Figure 4.6: Block diagram showing the electronics used for the Coulomb excitation exper-iments at IUAC. (CFD: constant fraction discriminator,SH: shaper, GG: gate generator,A(T)DC: analog-(time)-to-digital-coverter).
special Clover electronic modules [33, 34]. This double width NIM module replaces variouselectronics modules necessary to operate a Clover detector. It consists of four spectroscopicamplifiers of 3µs shaping time, five timing filter amplifiers (TFA), five constant fractiondiscriminator (CFD), five gate generators (GG) and one coincidence unit. The performanceof this special electronic module with respect to conventional electronics was tested with aSuper-Clover detectors at GSI and the results are summarized in the following paper [35]. Forthe PPAC standard NIM modules were used with the following CFD settings: fraction=0.2(0.4) and delay=6ns(18ns) for the anode segments and the delay lines, respectively. All this isdepicted in the schematic diagram of the Coulomb excitation DAQ system shown in fig. 4.6.
All time and energy signals were read out for the following two trigger conditions:i) particle signals registered in the annular counter, as a measure of the beam intensity, andii) particle-γ coincidences measured with the annular counter and one of the Ge crystals.In order to avoid any systematic error due to instrumental drift, runs from 112Sn and 116Sntargets, each of ∼3hours duration, were interspersed alternatively.Energy and effeciency calibration run for the Clover detectors was carried out at the end ofexperiment using a 152Eu source.

4.4. DOPPLER CORRECTION 57
The raw γ-ray spectrum from a Clover detector in coincidence with the scattered projectileis shown in fig. 4.7. It shows the background radiation (narrow peaks) and the broad dis-tributions as of the Doppler shifted γ-radiation from the scattered projectiles (∼1430 keV)and the target recoils (∼1225 keV). The shifted energy Eγ is strongly dependent on the ionvelocity and on the relative angle between the particle and Ge detector. The velocities ofboth scattered projectiles and target recoil could be calculated from the measured scatteringangle using two-body kinematics.
Figure 4.7: Ungated γ-ray spectrum from Clover-2 detector (IUAC experiment) in coinci-dence with scattered projectiles measured in the particle detector.
4.4 Doppler Correction
If a nucleus emits a γ-ray of energy Eγ0 while it is moving with a velocity vi at a relative angleϑγi between the γ-emission and the particle direction, the measured energy Eγ is Dopplershifted. Therefore, Doppler shift corrections were performed for both experiments at GSIand IUAC. We distinguish four different cases for projectile and target excitation and thedetection of either the projectile or target nucleus. In the following, A1, Z1 and A2, Z2 arethe mass (in amu) and charge number of the projectile and target nucleus, respectively, andElab is the lab-energy of the projectile (in MeV). (The subscript i is used with the conventioni = 1 for projectile and i = 2 for target excitation). The velocity of the centre of mass (c.m)system is given by (all velocities are in units of the velocity of light)
vcm = 0.04634 ·(
1 +A2
A1
)−1√
Elab
A1
(4.4)

58 CHAPTER 4. THE EXPERIMENTAL METHOD
CASE 1: Projectile measured with PPAC and projectile excitationThe scattering angle of the projectile in the c.m. system is given by
θcm = ϑ1 + arcsin
(
A1
A2sinϑ1
)
(4.5)
and allows the calculation of the velocity of the excited nucleus in the laboratory system
v1 = vcm·[
1+
(
A2
A1
)2
+ 2·(
A2
A1
)
· cosθcm
]1
2
(4.6)
The correlation angle ϑγ1 can be calculated from the γ-emission angles (ϑγ ,ϕγ) in the labo-ratory frame by
cosϑγ1 = cosϑγ · cosϑ1 + sinϑγ · sinϑ1 · cos(ϕγ − ϕ1) (4.7)
with
cos(ϕγ − ϕ1) = cosϕγ · cosϕ1 + sinϕγ · sinϕ1 (4.8)
The unshifted γ-ray energy Eγ0 is calculated from the measured energy Eγ by
Eγ0
Eγ=
1 − v1 · cosϑγ1√
1 − v21
(4.9)
CASE 2: Projectile measured with PPAC and target excitationThe recoil angle can be calculated by using eq. 4.5
ϑ2 = 0.5 · (180 − θcm) (4.10)
which allows the determination of the recoil velocity by
v2 = 2 · vcm · cosϑ2 (4.11)
The correlation angle ϑγ2 can be calculated from the γ-emission angles (ϑγ ,ϕγ) in the labo-ratory frame by
cosϑγ2 = cosϑγ · cosϑ2 − sinϑγ · sinϑ2 · cos(ϕγ − ϕ1) (4.12)
with
cos(ϕγ − ϕ1) = cosϕγ · cosϕ1 + sinϕγ · sinϕ1 (4.13)
The Doppler shift correction is done by the following formulae
Eγ0
Eγ=
1 − v2 · cosϑγ2√
1 − v22
(4.14)

4.4. DOPPLER CORRECTION 59
CASE 3: Target nucleus measured with PPAC and target excitationFrom the measured scattering angle ϑ2 the recoil velocity can be calculated by
v2 = 2 · vcm · cosϑ2 (4.15)
The correlation angle ϑγ2 can be calculated from the γ-emission angles (ϑγ ,ϕγ) in the labo-ratory frame by
cosϑγ2 = cosϑγ · cosϑ2 + sinϑγ · sinϑ2 · cos(ϕγ − ϕ2) (4.16)
with
cos(ϕγ − ϕ2) = cosϕγ · cosϕ2 + sinϕγ · sinϕ2 (4.17)
The Doppler shift correction is done by the following formulae
Eγ0
Eγ=
1 − v2 · cosϑγ2√
1 − v22
(4.18)
CASE 4: Target nucleus measured with PPAC and projectile excitationThe c.m. angle can be calculated from the recoil angle in the laboratory frame
θcm = 180 − 2 · ϑ2 (4.19)
This allows the determination of the recoil velocity by
v1 = vcm·[
1+
(
A2
A1
)2
+ 2·(
A2
A1
)
· cosθcm
]1
2
(4.20)
The scattering angle ϑ1 can be calculated by
cosϑ1 =vcm
v1
(
1 +A2
A1
· cosθcm
)
(4.21)
The correlation angle ϑγ1 can be calculated from the γ-emission angles (ϑγ ,ϕγ) in the labo-ratory frame by
cosϑγ1 = cosϑγ · cosϑ1 − sinϑγ · sinϑ1 · cos(ϕγ − ϕ2) (4.22)
with
cos(ϕγ − ϕ2) = cosϕγ · cosϕ2 + sinϕγ · sinϕ2 (4.23)
The Doppler shift correction is done by the following formulae
Eγ0
Eγ=
1 − v1 · cosϑγ1√
1 − v21
(4.24)

60 CHAPTER 4. THE EXPERIMENTAL METHOD
The Doppler correction is essential for reducing the often considerable Doppler broadeningof the peaks. The fig. 4.8 shows the Doppler corrected γ-ray spectra measured at GSI forcase 3 and case 4. Due to the PPAC polar angle resolution of 2, the scattering angle of theprojectile and, accordingly, the velocity were best determined by a reconstruction from theposition information of the target nucleus (see fig. 4.4 with cuts on 58Ni) and hence usedfor the Doppler correction. A γ-ray energy resolution of 0.7% (FWHM) was obtained fordecays from projectile excitation and 1.0% (FWHM) for decays from target excitation. Thedifference was caused by the Doppler broadening due to the higher velocity of the latterparticles.
Figure 4.8: Doppler corrected γ-ray spectra associated with a coincidence of two particlesin the PPAC. The Doppler correction (case 4) was applied using kinematical information ofthe target nuclei (58Ni cuts in fig. 4.4), but assuming a projectile excitation of 114Sn (left)and 116Sn (right), respectively. The elevation between 1400keV and 1600keV corresponds todecays from the 2+
1 state of the 58Ni ejectiles. In order to obtain narrow peaks for the targetexcitation of 58Ni, the same data were used but the Doppler correction (case 3) was appliedto obatin the lower spectra.
Chapter 5
Analysis and Results
Since the data analysis was very similar for both experiments, it will be described in thefollowing only for the measurement performed at IUAC.
5.1 Data Analysis with INGASORT
The standard INGASORT analysis package [36] was modified to incorporate the additionalsignals obtained from the Coulomb excitation experiment. The command PPAC gave infor-mation about the φ-angles (ranging from 1-20) depending on which PPAC TAC was non-zeroand also identified the multi-hit events. Multi-hit events (cross talk between neighbouringφ-segments) were less than 5% of the total events. In the IUAC experiment only one reac-tion partner could be measured at a given time, either the scattered projectile or the recoilnucleus (see Chapter 4.2). The existing TDC command could identify which pair of delayline signals had data and determined the difference between them. CLOVER command wasused to match amplifier gains and provided the add-back energies of the Clover detectors.In addition, it identified which of the segments had data allowing for segment-wise Dopplercorrection. The Doppler correction was incorporated in the USER command that used theinformation from the Clover angles (ϑγ ,ϕγ) and the PPAC signals (ϑp,ϕp) computed frominput data.
5.2 Add-back of the Individual γ-Ray Signals
within a Clover Ge-Detector
In both experiments γ-ray detectors were used which consisted of four Ge-crystals arrangedlike a clover leaf. As mentioned before, their γ-ray energies were readout individually. Sincethe Ge-crystals are closely packed within a Clover detector, the Compton scattered γ-raysusually escaping a single Ge-crystal might be registered by the surrounding three Ge-crystals.In this way these γ-ray signals, which usually form the Compton background, add up to the
61

62 CHAPTER 5. ANALYSIS AND RESULTS
photopeak of the γ-ray transition.
Crystal No COUNTS112Sn excitation 58Ni excitation
1 11367±319 4661±1712 12786±293 5151±1373 10893±292 4391±1494 10045±297 3998±161
SUM 45091±601 18201±310ADD BACK 68013±721 27681±397
Table 5.1: Add-back ratio for Clover-3 used in the IUAC experiment
From the energy data of individual crystals, the gain in photopeak efficiency, the so-called add-back factor, could be determined (using INGASORT command area or fit). ForClover-3 the add-back factor for the 2+→0+ transition in 112Sn and 58Ni (see Table. 5.1) wasdetermined to be ∼ 1.5 calculated by the ratio of counts in the add-back spectrum relativeto the sum of the counts in the individual Ge-spectra. In order to reduce the uncertainities,the analysis was performed for the Doppler-corrected peaks.
5.3 Particle Identification at IUAC
Fig. 4.5 shows the calculated kinetic energies of the 58Ni projectiles and 112Sn recoils based ontwo-body kinematics for the angular range 15 to 45 (dashed lines). Due to the use of ratherthick entrance window (10µm MYLAR, ρ=1.39 g/cm3) for the PPAC, the detected kineticenergies of the 58Ni projectiles and 112Sn recoils were much lower (full drawn lines). Theenergy loss in MYLAR was taken from Northcliff and Schilling [32]. In the following it willbe shown that the fast anode signals in the PPAC for both particles were sufficiently largeto trigger the timing electronics. The corrosponding slower cathode signal for the recoiling112Sn nuclei, which was used for the delay-line read out of the angle (∼tanϑ) information,was however below the detection threshold. In this way the close collision (θcm=90-150)events were not considered in the present measurement.Fig. 5.1 shows the ungated γ-ray energy spectrum, coloured in black, measured with one ofthe Clover detectors in coincidence with PPAC detector. Six broad peaks, three each in thevicinity of 1.2 MeV and 1.4 MeV, could be identified. From kinematics (see Tab. 5.2), theycan be identified as projectile excitation (∼ 1.4 MeV) and target excitation (∼ 1.2 MeV) forvalues φ12 ranging between 0 and 180 where φ12 = | φγ− φp |. From phase space consid-eration one expects to see peaks at Eγ = 1200keV, 1233keV and 1264keV corresponding to112Sn and at Eγ=1350keV, 1413keV and 1495keV corresponding to 58Ni excitation.

5.3. PARTICLE IDENTIFICATION AT IUAC 63
PPAC signal φ1258Ni excitation 112Sn excitation
0 1413 1233Nickel detected 90 1381 1249
180 1350 12640 1410 1235
Sn detected 90 1451 1217180 1495 1200
Table 5.2: Energies of the Doppler shifted γ-rays (Eγ in keV) for 58Ni and 112Sn excitationas a function of relative angle φ12 = | φγ− φp | between γ-ray and particle detection. Thedetection of nickel and tin particles in the PPAC are calculated separately.
Figure 5.1: Ungated γ-ray spectrum for Clover-2 (black) and γ-ray spectra gated by (a) leftdelay-line and (b) right delay-line. The spectra in coincidence with the small angle end ofthe delay line (inner contact readout) are plotted in blue while the spectra in coincidencewith the large angle end of the delay line (outer contact readout) are plotted in red. For allspectra the add-back procedure was applied.
This spectrum is compared with two spectra, coloured in blue and red, analysed with acondition that the inner or outer contact of the delay-line registered a particle, respectively.Data are shown for the left half (fig. 5.1a) and right half (fig. 5.1b) of the PPAC. It isclearly seen, that the triple hump structure is only partially reproduced after requiring theadditional condition on the delay-line. The γ-ray peaks can only be related to the detectionof nickel ions. The slowed-down Sn recoil nuclei could be measured with the ϕ-segmentsbut not with the delay-line (energy signals are one order of magnitude smaller). For the leftdelay-line the Sn excitation (fig. 5.1a) should occur at ∼1234keV and the Ni excitation at∼1405keV for the detection of target nuclei. When gated on the right delay-line the γ-ray

64 CHAPTER 5. ANALYSIS AND RESULTS
spectrum of Clover-2 (fig. 5.1b) should show the Sn excitation at 1245-1261keV and the Niexcitation at 1350-1382keV. (for details see Appendix A.3)
Figure 5.2: Gamma-particle time-of-flight (TOF) spectrum (black) and γ-energy gated spec-tra for Ni(blue, Eγ=1264keV) or Sn(red, Eγ=1200keV) particles detected in PPAC.
A time-of-flight (TOF) spectrum was also generated between the γ-ray signal from theClover detectors and timing from the PPAC detectors. The method of the INGASORT anal-ysis is described in detail in Appendix A.1 . The centroids of the time peaks for differentϕ-segments measured for Ni projectiles were matched within ±10 channels (∼1ns). Fig. 5.2shows the TOF-spectra for Clover detectors with respect to PPAC detectors gated by dif-ferent energy windows in the Clover detector. The TOF difference between the scatteredprojectiles (fig. 5.2a), gated on Eγ=1264keV for Ni detected in PPAC and target recoils((fig. 5.2b), gated on Eγ=1200keV in Sn detected in PPAC) was found to be too smallcompared to the timing resolution of the Clover detectors.
5.4 Suppression of the γ-Ray Background Events
As a result of the TOF information, the timing between Clover and PPAC was only sufficientto separate the ’random’ events from the ’prompt’ coincidences. The events associated withrandom coincidence between the γ-rays in the Clover detectors and the particles detectedin the PPAC were typically less than 1% of the prompt events. Fig. 5.3 shows the γ-spectrafor random events (bottom red curve) and the background-subtracted prompt events (topblack curve). As expected, the discrete γ-ray transitions due to background radiation (e.g.1461keV of 40K) disappear in the corrected spectrum.

5.5. DETERMINATION OF THE SCATTERING ANGLES 65
Figure 5.3: γ-spectra associated with the random events (bottom red curve) and background-subtracted prompt spectrum (top black curve).
5.5 Determination of the Scattering Angles
Figure 5.4: Total number of counts recorded for each ϕ-segment during the γ-p coincidencemeasurement (black curve). The blue and red histograms show the corresponding counts incoincidence with signals from inner and outer contacts of the delay-lines.
For the angle readout, four signals were recorded from the two ends of the right andleft delay-lines. The ϑ information can be obtained by two different methods (i) from the

66 CHAPTER 5. ANALYSIS AND RESULTS
difference in time between the inner and outer contact of the delay-lines (DDL = tinner -touter) and (ii) the difference in time between either of the readouts and the timing derivedfrom the anode signals recorded for the individual ϕ-segments (SDL =tinner - tanode). Duringdata collection, some of the ϕ-segments were completely missing or showed lower count ratescompared to the other segments (see fig. 5.4). One also observes different count rates recordedby the inner (blue curve) and the outer contact (red curve) which were a factor of 2-4 lowercompared to the raw PPAC signals.
Figure 5.5: Top panel shows the SDL readout for different ϕ-segments: #1(black), #8(blue),#16(red), #19(green) and #4(black), #7(blue), #11(red) and #17(green). In the bottompanel the corresponding spectra are shown in coincidence with the outer contact.
The SDL readouts for different individual ϕ-segments are shown in fig. 5.5a-b (top panel).The bottom panel (fig. 5.5c-d) shows the corresponding results gated by a non-zero signalfrom the outer readout. The following conclusions can be drawn by inspecting these figures.Firstly, the segments having similar count rates in fig. 5.4 show similar delay-line spectra.The edges of these spectra match with the geometrical acceptance angles of 15-45 in thelaboratory system. Secondly, the ϕ-segments with a lower counting rate seem to have some-times a problem with the anode foil at forward angles and consequently show a truncatedposition spectrum. The difference between top and bottom spectra results from the thresholdsettings of the constant fractions: particle signals measured at forward angles and attenuatedby the delay-line readout are sometimes not registered by the outer contacts.From the observed delay-line spectra, the scattering angle ϑp of the Ni projectiles can becalculated from the following relationship

5.5. DETERMINATION OF THE SCATTERING ANGLES 67
tanϑp = a · x+ b (5.1)
where x is the time difference tinner - tanode and the constants a and b are calculated assumingthe TAC edges of channels 3400 and 4550 (fig. 5.5) correspond to the angles 15 and 45,respevtively.
Figure 5.6: DDL spectra for segments 1-10 (black) and segments 11-20 (red). The countrates in both halves are different as there were some of the ϕ-segments not working duringthe experiment.
An independent position spectrum (fig. 5.6) was constructed from the time differencespectra between pairs of delay-line signals DDL=tinner - touter. While the right edge of thisspectrum corresponds to ϑp ∼ 45, the angle corresponding to the left edge is expected tobe somewhat larger than the geometrical edge of 15. From the DDL spectrum, the angle ofthe detected particle can be calculated by using the similar relationship:
tanϑp = a · y + b (5.2)
where y is the time difference tinner-touter.In order to calibrate the DDL spectrum (fig. 5.6), the total angular range was subdivided
into three regions L (channels 2920-3590), M (channels 3590-4265) and H (4265-4940). Theknown SDL spectrum was gated by these three angular regions and the results are shownin fig. 5.7. Using the calibration for the SDL spectrum, the boundaries of the DDL regionscorresponds to angles of 21.1, 28.9, 36.9 and 43.6, respectively. With a linear least squarefit, the boundaries (15,45) of the PPAC are expected at channel 2637 and 5216, respectively.
The azimuthal angle ϕp of the detected particle was calculated from
ϕp = 18 · [K − ξ] (5.3)
where K is the segment number and ξ is a random number between 0 and 1.

68 CHAPTER 5. ANALYSIS AND RESULTS
Figure 5.7: SDL spectrum gated by different regions of the DDL spectrum (see fig. 5.6)(i)black - ungated, (ii)green full DDL range, (iii)blue L-region, (iv)red M-region and(v)pink H-region (see text for details)
5.6 Doppler-Shift Correction
From the knowledge of the scattering angles (ϑp,ϕp), the Doppler correction of the measuredγ-ray energies can be performed event-by-event. Initially the nominal values (ϑγ ,ϕγ) for thecentre of the Clover detectors were used for the Doppler correction, but the results were notvery satisfying for Eγ0, showing prominent tailing at both low and higher energy side.
The centroids of the Doppler-corrected peaks showed a residual dependence on the ϕ-segments. There was also a shift in peak shape between individual crystals (fig. 5.8). Althoughthe peak intensity of the interesting γ-ray transitions was not effected by the peak-shape,systematic errors can be introduced in the estimation of the Compton background undera rather broad peak. It was decided to minimise the peak widths by applying individualDoppler corrections for different Ge crystals instead of a common correction for a Cloverdetector. Readjustment of calibrations (ϑγ ,ϕγ) for individual Ge crystals was carried out toeliminate the residual ϕp dependence.
5.6.1 Method for Improved Doppler Correction
The Doppler-shifted γ-ray energy Eγ is given by
Eγ∼= Eγ0 · [1 +
vp
c· cos(ϑγp)] (5.4)
withcos(ϑγp) = cos(ϑγ) · cos(ϑp) + sin(ϑγ) · sin(ϑp) · cos(ϕγ − ϕp) (5.5)

5.6. DOPPLER-SHIFT CORRECTION 69
Figure 5.8: Doppler corrected γ-ray spectra for individual crystals of Clover-2 assuming acommon correction (ϑγ ,ϕγ) for the Clover.
For a given ϑp and ϑγ , the γ-ray energy shows a strong dependence on the phase angleϕγp between both detectors. Since the γ-rays are detected in the backward hemisphere andthe scattered projectiles are measured in the forward direction, one obtains (ϑp+ϑγ) ∼ 180.For the following discussion we define two quantities by
Eminγ = Eγ
∼= Eγ0 · [1 +vp
c· cos(ϑγ + ϑp)] (5.6)
Emaxγ = Eγ
∼= Eγ0 · [1 +vp
c· cos(ϑγ − ϑp)] (5.7)
The minimum value of γ-ray energy Eγ (for Ni excitation) corresponds to the case (ϕγ-ϕp)∼180, when γ-rays and Ni projectiles are detected on diametrically opposite side and itreaches a maximum value when they are detected on the same side [(ϕγ-ϕp)∼0]. A plot ofEγ versus ϕp closely resembles a sine-wave (fig. 5.9), given by
Eγ = A+B · cos(ϕγ − ϕp) (5.8)
From a least-square fit of the experimental energies Eγ with a sine-wave, the quantitiesEmin
γ , Emaxγ and ϕγ can be determined. The phase angle ϕγ corrosponds to the projectile
excitation and (π + ϕγ) to the target excitation.
The calculated variation of Emaxγ and Emin
γ with the scattering angle ϑp for differentvalues of ϑγ are shown in fig. 5.10 for Ni excitation (a,b) and Sn excitation (c,d). The angledifference (ϑγ − ϑp) can be calculated from Emax
γ . The quantity (ϑγ + ϑp) determined fromEmin
γ , is not very well determined since cosϑ is insensitive in the vicinity of ∼ 180.

70 CHAPTER 5. ANALYSIS AND RESULTS
Figure 5.9: Doppler oscillations for Crystal-1 of Clover-2. The circles are experimental cen-troids for Ni and Sn peaks for gate-M of the DDL spectrum (fig. 5.6). The solid curvescorrespond to the theoretical predictions for Elab= 167MeV, ϑp = 32.9, ϑγ = 142.7 andϕγ=143.2 (see text). For Sn γ-rays, theoretical curves for two different beam energies Elab=167MeV and 138MeV are shown. (see also Appendix A.3)
Figure 5.10: Calculated Doppler-shifted peak positions for projectile and target excitationas a function of detector angle ϑp. The energy loss in the target was neglected in the abovecalculations.
We have tried to extract the geometrical angles (ϑγ ,ϕγ) for the Clover detectors from theexperimental data by analyzing the Doppler shift pattern for each Clover crystal as a functionof the anode segment ϕp. The DDL position spectrum (fig. 5.6) was divided into three regions

5.6. DOPPLER-SHIFT CORRECTION 71
Low (L), Middle (M) and High (H) which nominally corresponded to angular ranges of ϑp ∼21.1-28.9, 28.9-36.9 and 36.9-43.6. For each combination, the γ-ray spectra from a givenGe-crystal gated by different ϕ-segments (3 x 4 x 4 x 20 spectra) were collected and the peakcentroids for the projectile and target excitation γ-rays were determined. The geometricalangles (ϑγ ,ϕγ) for each Clover crystal were adjusted to reproduce the phase and amplitudeof oscillation for the Ni excitation. Since the lifetime of the 2+ states in Ni and Sn are largerthan the transit times through the target foil, the γ-decay takes place primarily after passingthe target. Therefore, an effective beam energy of Elab= 167MeV (∼8MeV energy loss inthe target) was used for the Doppler correction of the Ni excitation. The extracted average(ϑγ ,ϕγ) for each crystal are summarised in Tab. 5.3.
CLOVER Crystal-1 Crystal-2 Crystal-3 Crystal-4# ϑγ[
] ϕγ [] ϑγ [
] ϕγ[] ϑγ [
] ϕγ[] ϑγ [
] ϕγ[]
1 130.7 53.4 140.3 64.9 146.1 55.5 140.5 43.52 142.7 144.2 147.6 124.4 137.0 118.9 133.2 132.93 137.1 -33.4 143.8 -46.9 135.3 -56.5 128.8 -44.04 144.5 -114.1 138.9 -129.2 128.3 -118.0 135.4 -106.5
Table 5.3: Gamma-ray detection angles (ϑγ ,ϕγ) for each Ge-crystal extracted from theDoppler shift data of the Ni excitation (effective beam energy Elab=167MeV).
For γ-rays of Sn excitation, shown in the right panel of fig. 5.9, the calculated amplitudeof the Doppler oscillations are overestimated by about 10% using the values (ϑγ ,ϕγ) neededto reproduce the γ-rays for Ni excitation. This difference can be qualitatively understoodby incorporating the significant energy loss of the slow moving Sn recoils. The programSHRIM-2008 [37] was used to calculate the specific energy loss of Ni and Sn nuclei in theSn target. For a target thickness of ∼0.55 mg/cm2 one calculates an average energy loss ofthe Sn recoils, which is ∼20% of the initial value. In the Doppler correction routine of theINGASORT analysis, the required recoil velocity (10% reduction) was simulated by reducingthe effective beam energy by 20% to Elab=138 MeV (Appendix A.4).
For single-hit γ-events, the angles (ϑγ ,ϕγ) for individual Ge-crystals were used. For multi-hit γ-events, we used the average angle of the involved Ge-crystals. This is a reasonableassumption as computer simulation indicates that double-hit events (which correspond toabout 50% of single-hit events) are localised near the common edge of the Ge-crystals.
Fig. 5.11 shows the final Doppler-corrected γ-ray spectra for the systems112Sn+58Ni and 116Sn+58Ni for target (top) and projectile excitation (middle). For complete-ness the uncorrected γ-ray spectra are shown at the bottom.

72 CHAPTER 5. ANALYSIS AND RESULTS
Figure 5.11: Doppler corrected γ-ray spectra for the systems 112Sn+58Ni(blue)and 116Sn+58Ni(red). The uncorrected spectra are shown at the bottom.
5.7 Experimental γ-Ray Yields
The Doppler-corrected add-back spectra for Coulomb excitation of Ni and Sn are shown infig. 5.12. For comparison, the ’random’ background is also shown. One observes a rathersmooth distribution with a residual peaking of less than 1% relative to the ’prompt’ peakarea. Therefore, a linear background underneath the ’prompt’ peak was assumed. For extract-ing the γ-ray yields, the peak shape was assumed to be Gaussian in nature with exponentialtail on both sides. To reduce systematic errors, identical line shapes were used to extractpeak areas for 112Sn excitation (1257keV) and 116Sn excitation (1294keV).
We used two different methods for the determination of the particle angular range: (i)DDL readout which yield a reduced γ-ray background but was limited in angular acceptancerange ϑp ∼ 21-44 and (ii) SDL readout having a larger acceptance range of ϑp ∼ 15-44
but suffered from increased γ-ray background due to higher ’random’ events. The exper-imental γ-ray yields for projectile and target excitation and the 112Sn/116Sn γ-ray ratios,extracted using DDL and SDL readouts are tabulated in tab. 5.4 and tab. 5.5, respectively.For Clover-1 and Clover-4, one of the crystals (#2) showed considerable gain drift duringthe experimental run and has been excluded from the analysis. Crystal-4 of Clover-4 had amuch poorer intrinsic resolution (∼10keV) compared to the other three (2.53keV) and wasalso been excluded. As a result, the absolute number of counts from Clover-1 and Clover-4were substantially smaller than those of Clover-2 and Clover-3.
Both methods gave very similar results despite covering different angular ranges. Theinsensitive dependence of 112Sn/116Sn ratio on the angular range will be discussed later inthe context of the Coulomb excitation calculations.

5.7. EXPERIMENTAL γ-RAY YIELDS 73
Figure 5.12: Doppler corrected add-back spectra for Clover-2. The black and red curves cor-respond to spectra under ’prompt’and ’random’ conditions in Clover-PPAC TOF spectrum.The top and bottom spectra correspond to Doppler corrections assuming projectile (Ni)excitation and target (Sn) excitation.
Clover 112Sn target 116Sn target 112Sn/Ni 116Sn/Ni 112Sn/116Sn
# Sn exc Ni exc Sn exc Ni exc ratio ratio ratio1 26237±23311142±15521208±22412129±1732.355±0.0391.748±0.031 1.346±0.032
2 59050±34925093±27548567±39327902±2972.353±0.0291.741±0.023 1.352±0.025
3 55357±37823732±24744573±30325656±2832.333±0.0301.737±0.022 1.343±0.024
4 19488±202 8160±129 15614±180 9124±138 2.388±0.0451.711±0.0321.396±0.0037
Table 5.4: Peak areas and intensity ratios for Sn and Ni excitation (exc) in 112Sn+58Ni and116Sn+58Ni systems using the DDL analysis.
5.7.1 Dependence of 112Sn/116Sn Ratio on the Azimuthal Angle
It was already shown that the γ-ray energy resolution for different ϕ-segments dependsstrongly on the relative phase difference ϕγp=(ϕγ-ϕp) (|dEγ/dϕ| is minimum for ϕγp∼0 and∼180). The particle-γ angular correlations for Ni and Sn nuclei are also expected to besignificantly different in the laboratory frame.In order to check the sensitivity of the 112Sn/116Sn ratio to this depedence, we have subdi-vided the data into two halves of the PPAC: (i) | ϕγ- ϕp| < 90 and(ii) 90< (ϕγ-ϕp) < 270. The resulting spectra are shown in fig. 5.13 for Clover-2. Theareas under the Sn and Ni peaks are tabulated in tab. 5.6. Although the Sn/Ni ratios weresensitive to the ϕ-range selected in this analysis, the overall ratio for 112Sn/116Sn was not

74 CHAPTER 5. ANALYSIS AND RESULTS
Clover 112Sn target 116Sn target 112Sn/Ni 116Sn/Ni 112Sn/116Sn
# Sn exc Ni exc Sn exc Ni exc ratio ratio ratio
1 30932±25112969±20424496±25113823±2192.385±0.0431.772±0.033 1.345±0.035
2 69957±41628984±33056421±45631659±3442.413±0.0311.782±0.024 1.354±0.025
3 65376±53227426±36351903±50429202±3892.383±0.0371.777±0.029 1.341±0.030
4 24042±24010025±15419005±23010928±1612.398±0.0431.739±0.0331.379±0.0036
Table 5.5: Peak areas and intensity ratios for Sn and Ni excitation (exc) in 112Sn+58Ni and116Sn+58Ni systems using the SDL analysis.
varing at all.
ϕγp112Sn target 116Sn target 112Sn/Ni 116Sn/Ni 112Sn/116Sn
Sn exc Ni exc Sn exc Ni exc ratio ratio ratio
-90-90 24993±15810799±20821040±31412194±2952.314±0.0461.725±0.0491.341±0.046
90-27033800±34314069±43827597±26015377±553 2.402±0.078 1.794±0.0661.338±0.066
Table 5.6: ϕ-dependence of particle-γ intensities (Clover-2)
5.8 Experimental 112Sn/116Sn Intensity Ratio
From the weighted average of four measurements (using four Clover detectors) the intensityratio 112Sn/116Sn is given by
σ(112Sn)/σ(116Sn)=1.347±0.015 (DDL analysis)σ(112Sn)/σ(116Sn)=1.348±0.017 (SDL analysis)
5.8.1 Correction for Photopeak Efficiency
The measured 112Sn/116Sn intensity ratio had to be corrected for the photopeak efficiency ofthe different Doppler shifted γ-ray energies Eγ. A 152Eu source placed at the target positionwas used for relative effeciency determination. In the limited energy range 1.0-1.5MeV, theefficiency curve could be approximated by an exponential function given by
f(E) ∼ f0 · exp(−E/E0) (5.9)
with E0 ≈ 2096, 2184, 2245 and 2262keV for Clover-1 to Clover-4, respectively. Since thedifference in the energies of the Doppler shifted peak is small, the ratio of the two efficienciescan be approximated as:

5.8. EXPERIMENTAL 112SN/116SN INTENSITY RATIO 75
Figure 5.13: Doppler corrected add-back spectra for Clover-2. The black and red spectracorrespond to correlations for −90<ϕγp<90 and 90<ϕγp<270. The top and bottom setscorrespond to Doppler corrections assuming projectile and target excitations.
f(112Sn)/f(116Sn)≈ exp (E/E0) ≈ 1.017±0.001
E ≈(1293.5-1256.8)·(1249.0/1256.8)=36.5keV is the shifted energy difference between thetwo γ-ray transitions. The double ratio, corrected for the detector efficiency, is givenby
σ(112Sn)/σ(116Sn)=1.324±0.015

76 CHAPTER 5. ANALYSIS AND RESULTS
5.8.2 Correction for Isotopic Impurity
The used Sn targets were enriched to 99.5±0.2% and 98.0±0.1% for 112Sn and 116Sn, re-spectively. For the Ni excitation, all Sn isotopes contribute equally. On the other hand, theexcitation of the different Sn isotopes can be discriminated due to their different transitionenergies (see table below).
Isotope 112Sn 114Sn 116Sn 118Sn 120Sn2+ energy (keV) 1257 1300 1293 1230 1171
Except for the pair 114,116Sn, other γ-rays can be uniquely identified (energy resolution∼6keV after Doppler correction). The amount of 114Sn impurity in the 116Sn target is reportedto be less than 0.1%. The measured 112Sn/116Sn intensity ratio should therefore be reducedby a factor corresponding to the isotopic purity of the targets:
(98.0±0.1%)/(99.5±0.2%) = 0.985±0.003
The final double ratio, corrected for detector efficiency and target purity, is given by
σ(112Sn)/σ(116Sn)=1.305±0.015
5.8.3 Coulomb Excitation Cross Sections
Coulomb excitation calculations were performed with the Winther-de Boer Coulex code[38]. In a first step the excitation cross sections were calculated as a function of the reducedtransition matrix elements (see Appendix A.5 and A.7). Since, the time scales for the ex-citation (∼10−22s) and decay (10−15-10−9s) are quite different, the γ-decay was determinedwith a separate computer code (see Appendix A.6). For the particle-γ angular correlationwe can distinguish three cases: (i) calculation in the rest-frame (input parameter I24=1,Q0=1, Q2=0, Q4=0), (ii) calculation in the laboratory frame (only Lorentz-boost, inputparameter I24=0, Q0=1, Q2=0, Q4=0), (iii) calculation in the laboratory frame with γ-ray angular correlation ( input parameter I24=0, Q0=Q2=Q4=1). In table. 5.7 the crosssections for the 58Ni→116Sn system at 175MeV are given for two different angular rangesin the laboratory frame: ϑlab=15-45 and ϑlab=21.1-43.7. For the excitation of 116Sn aB(E2;0+→2+)=0.209e2b2 value was used (see Appendix A.2).
In a second step the cross sections were calculated for 58Ni→112Sn system at 175MeVfor the same angular ranges: ϑlab=15-45 and ϑlab=21.1-43.7 and the results are given intable. 5.8. For the excitation of 112Sn a B(E2;0+→2+)=0.240e2b2 value was used (AppendixA.2).
From both tables the double ratio 112Sn/116Sn was determined (see the table. 5.9) Acomparision of these effects shows that the analysis is completly insensitive to the γ-rayangular distribution and the different angular ranges. Since the g-factor of the first excitedstate in all Sn isotopes is very small (g(2+)∼0), one expects no distortion of the γ-ray angulardistribution due to the deorientation effect. Therefore, the calculated double ratio 1.283 forthe angular range of ϑlab=21.1-43.7 was used to determine from the experimental doubleratio 1.305±0.024 the B(E2)-value for 112Sn using the following formula:

5.8. EXPERIMENTAL 112SN/116SN INTENSITY RATIO 77
ϑγϕγ θcm116Sn:σ2[mb] 58Ni:σ2[mb] ratio58Ni→116Sn 58Ni→116Sn 116Sn/58Ni
175MeV 175MeV135,55 22.4-65.7 (i) 60.80 39.77 1.529
(ii) 59.94 36.46 1.644(iii) 61.63 38.26 1.611
31.5-63.9 (i) 53.09 35.07 1.514(ii) 52.34 32.14 1.629(iii) 53.80 33.72 1.596
Table 5.7: Cross sections for the 58Ni+116Sn system at 175MeV for two different angularranges.
ϑγϕγ θcm112Sn:σ2[mb] 58Ni:σ2[mb] ratio58Ni→112Sn 58Ni→112Sn 112Sn/58Ni
175MeV 175MeV135,55 22.7-66.5 (i) 74.88 37.98 1.972
(ii) 73.78 34.81 2.120(iii) 75.78 36.52 2.075
31.8-64.7 (i) 65.32 33.63 1.942(ii) 64.37 30.75 2.093(iii) 66.05 32.26 2.046
Table 5.8: Cross sections for the 58Ni+112Sn system at 175MeV for two different angularranges.
ϑγϕγ ϑlab ratio112Sn/116Sn
135,55 15-45 (i) 1.290(ii) 1.290(iii) 1.288
21.1-43.7 (i) 1.283(ii) 1.285(iii) 1.283
Table 5.9: Double ratio of 112Sn/116Sn as determined from tab. 5.7 and tab. 5.8

78 CHAPTER 5. ANALYSIS AND RESULTS
B(E2;0+→2+)= 1.3051.283
· 0.240e2b2=0.244e2b2
Since the B(E2) values are directly proportional to the Coulomb excitation cross sections,the error of the B(E2)-value for 112Sn was determined from the B(E2) ratio
B(E2; 0+ → 2+)112−Sn
B(E2; 0+ → 2+)116−Sn=B(E2; 0+ → 2+)112−Sn
0.209(6)= 1.168(22) (5.10)
The error propagation (df 2=(x · dy)2 + (y · dx)2) for a product (f = x · y) yields thefollowing result
B(E2;0+→2+)=0.244(8) e2b2
Additional Coulomb excitation calculations were performed taking into account theslowing-down of the projectiles in the targets. A corrected beam energy of 171MeV wasused in order to consider the slowing down in 50% of the target thickness. For 58Ni pro-jectiles at 175MeV slowed down in a Sn target (0.53 mg/cm2) an energy loss of dE
dx=16.4
[ MeVmg/cm2 ] was calculated. The slowing down of the projectiles changed the calculated double
ratio by less than 0.8%.Calculations included the feeding contributions from the 0+
2 , 2+2 , 3−1 and 4+
1 states in 112Snand 116Sn, which were obtained from the known excitation strengths given in Appendix A.2.In both cases the summed intensity from decays of higher-lying states added up to less than2% of the 2+
1 → 0+g.s. decay intensity, which agreed with our experimental findings. The
calculated double ratio changed by less than 1% when the feeding states were neglected.The final B(E2) value for 112Sn, which includes the slowing down of 58Ni projectiles
in the Sn targets and the feeding contributions from higher lying states is given in tab. 5.10together with the extracted B(E2) value for 114Sn measured at GSI.
Isotope B(E2;0+→2+)112Sn 0.242(8)e2b2
114Sn 0.232(8)e2b2
Table 5.10: Measured reduced transition probabilities for 112Sn and 114Sn.
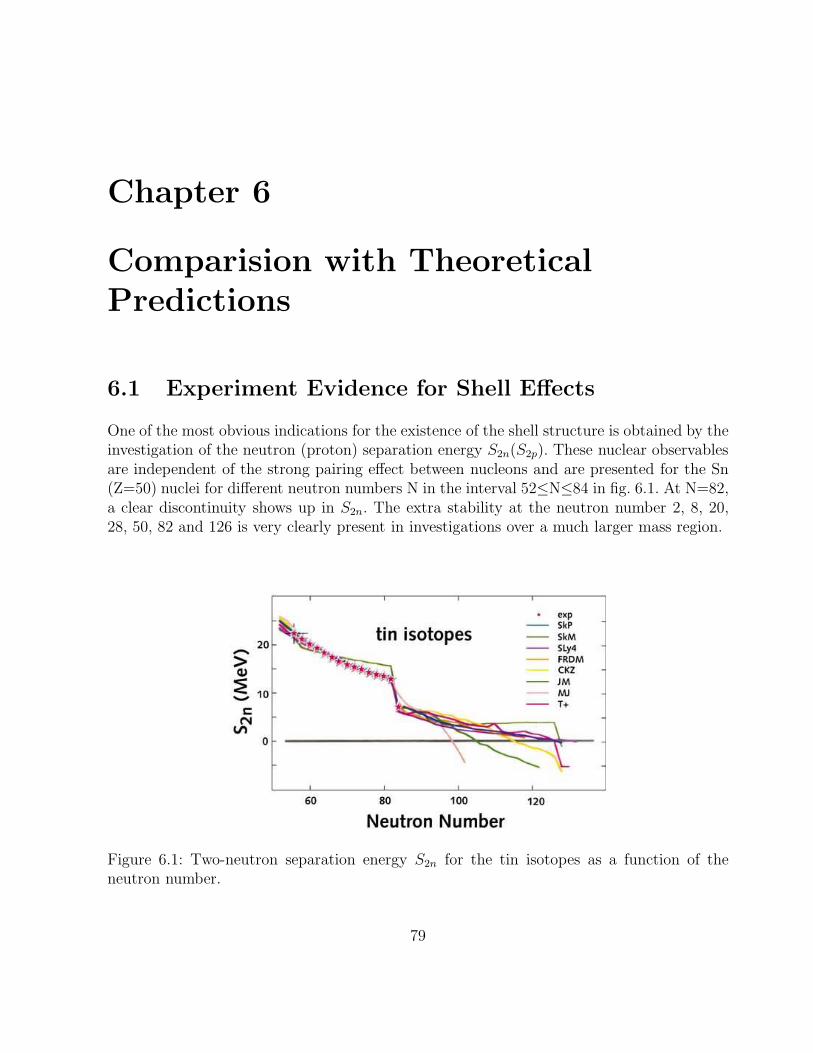
Chapter 6
Comparision with TheoreticalPredictions
6.1 Experiment Evidence for Shell Effects
One of the most obvious indications for the existence of the shell structure is obtained by theinvestigation of the neutron (proton) separation energy S2n(S2p). These nuclear observablesare independent of the strong pairing effect between nucleons and are presented for the Sn(Z=50) nuclei for different neutron numbers N in the interval 52≤N≤84 in fig. 6.1. At N=82,a clear discontinuity shows up in S2n. The extra stability at the neutron number 2, 8, 20,28, 50, 82 and 126 is very clearly present in investigations over a much larger mass region.
Figure 6.1: Two-neutron separation energy S2n for the tin isotopes as a function of theneutron number.
79

80 CHAPTER 6. COMPARISION WITH THEORETICAL PREDICTIONS
A number of other indicators are obtained by studying the Z, N variations of various nu-clear observables, e.g. excitation energy E2+
1of the first excited state in all even-even nuclei
(see fig. 1.1).
6.2 The Average Potential of the Nucleus
In the conventional theory of the nuclear structure at low energies the nucleus is treatedas a quantum-mechanical many-body problem of Fermions interacting by a non-relativistictwo-body interaction (see for instance [39, 40]). The starting point is the nuclear A-bodyHamiltonian
H =A∑
i=1
~pi2
2 ·mi
+A∑
i<j
V (~ri, ~rj) (6.1)
With the assumption that nucleons mainly move independently from each other in an aver-age field with a large mean-free path, the above equation reduces to a much simpler equation
H0 +Hres =
[
A∑
i=1
~pi2
2 ·mi+ U(~ri)
]
+
[
−A∑
i=1
U(~ri) +A∑
i<j
V (~ri, ~rj)
]
(6.2)
In the following the residual interaction Hres is neglected. If one considers the spin-orbitcoupling, the single-particle spectra are obtained which yield the correct ’magic’ nuclearnumbers. Besides the correct reproduction of global properties of the nucleus, a microscopiccalculation should also aim at a correct description of finer details, i.e. local excitations inthe nucleus. This is a highly ambitious task since the typical energy scales (binding energyE0 ∼ 103MeV, excitation energies Ex ∼1-2MeV) differ by three orders of magnitude. Thestarting point should be a realistic interaction, i.e. a potential V(~ri, ~rj) which reproduces thenucleon-nucleon scattering properties in the energy region 0-500MeV. Typical radial shapesfor V(~ri, ~rj) are Yukawa shapes [41]
V (r) =e−µ·r
µ · r (6.3)
with r ≡| ~r1 − ~r2 |.One of the problems related to the study of nuclear structure at low excitation energy isthe choice of the model space to be used. Including explicit correlations between nucleons,the model space expands quickly with the number of particles. Modern large-scale shell-model configurations try to treat many or all of the possible ways in which nucleons can bedistributed over the available single-particle orbits that are important in a particular massregion. It is clear that nuclei in the mid-shell region will obtain a very large model space andextensive numerical computations will be needed. The increase in computing facilities hasmade the implementation of large model spaces and configuration mixing possible. In thepresent case a 90Zr or 100Sn core was used which requires an effective charge for the valence
6.2. THE AVERAGE POTENTIAL OF THE NUCLEUS 81
particles.
6.2.1 The Electric Quadrupole Moment and Effective Charges
The non-spherical distribution of the charges in a nucleus gives rise to a quadrupole moment.The classical definition of the charge quadrupole moment operator in a Cartesian axis systemis given [42] by:
Qz =A∑
i=1
ei · (3z2i − r2
i ) (6.4)
with ei being the charge of the respective nucleon and (xi,yi,zi ) its coordinates. In a sphericaltensor basis the z-component of the quadrupole operator is more easily expressed as the zeroorder tensor component of rank 2 tensor:
Q20 = Qz =A∑
i=1
ei · r2i · Y20(θi, φi) ·
√
16π
5(6.5)
The nucleus is a quantum mechanical system that is described by a nuclear wave function,characterized by a nuclear spin I. In experiments we observe the spectroscopic quadrupolemoment, which is the expectation value of the quadrupole operator, defined as
Q(I) = 〈IM ||Qz||IM〉M=I (6.6)
or with spherical tensor notation
Q(I) = 〈IM ||Q20||IM〉M=I (6.7)
In the shell model, the nuclei are described by a nuclear mean field (core) in which someindividual valence nucleons move and interact with each other through a residual interaction.For calculating the spectroscopic quadrupole moment, the sum over all nucleons in expression(Eq. 6.5 and Eq. 6.7) is reduced to the sum over the valence particles. In the extreme singleparticle shell model the quadrupole moment of an odd-proton (or an odd-neutron) nucleuswith spin I is determined by the single particle moment of the unpaired proton (or neutron)in the orbital j. If I=j, then quadrupole moment is given by the single-particle moment [43]
Qsp = −ej ·2j − 1
2j + 2· 〈r2
j 〉 (6.8)
Here ej is the charge of the nucleon in orbital j and 〈r2j 〉 is the mean square radius of
the nucleon in that orbital. Note that free neutrons have no charge, eν = 0, and thereforedo not induce a single-quadrupole moment. Free protons with eπ = +1 induce a negativequadrupole moment.
However, valence nucleons in a nucleus interact with the nucleons of the core and canpolarize the core, which is reflected by giving neutrons as well as protons an effective charge.
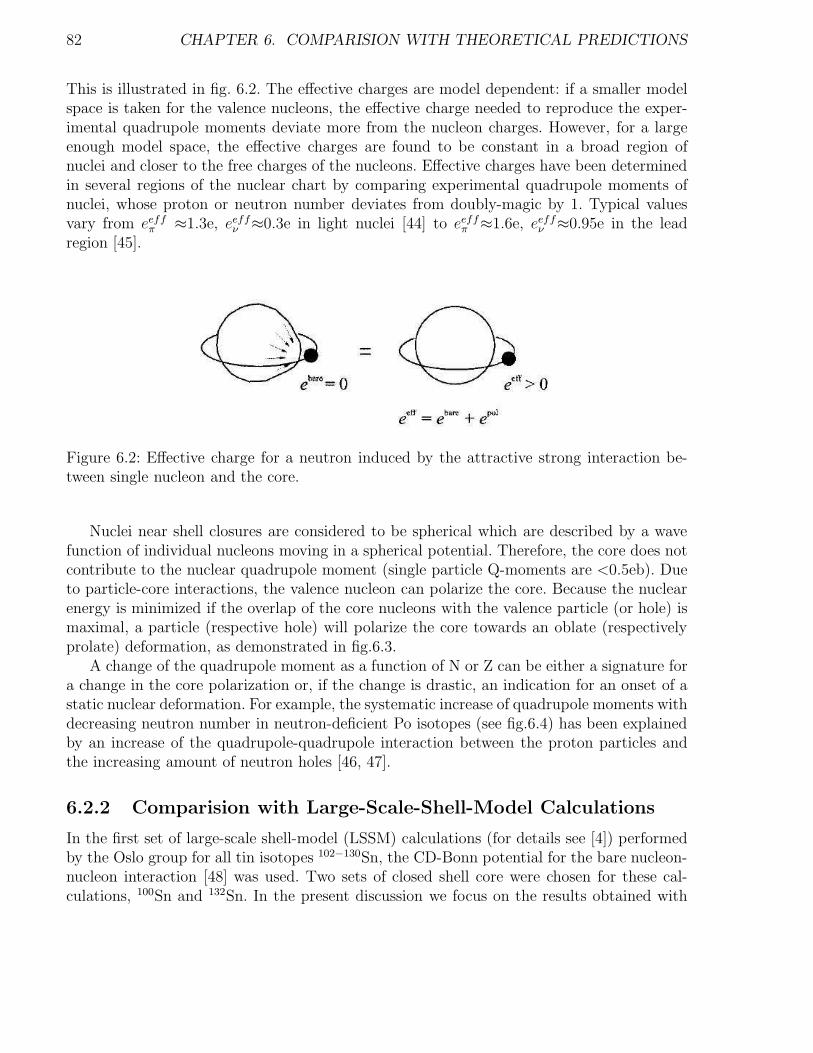
82 CHAPTER 6. COMPARISION WITH THEORETICAL PREDICTIONS
This is illustrated in fig. 6.2. The effective charges are model dependent: if a smaller modelspace is taken for the valence nucleons, the effective charge needed to reproduce the exper-imental quadrupole moments deviate more from the nucleon charges. However, for a largeenough model space, the effective charges are found to be constant in a broad region ofnuclei and closer to the free charges of the nucleons. Effective charges have been determinedin several regions of the nuclear chart by comparing experimental quadrupole moments ofnuclei, whose proton or neutron number deviates from doubly-magic by 1. Typical valuesvary from eeff
π ≈1.3e, eeffν ≈0.3e in light nuclei [44] to eeff
π ≈1.6e, eeffν ≈0.95e in the lead
region [45].
Figure 6.2: Effective charge for a neutron induced by the attractive strong interaction be-tween single nucleon and the core.
Nuclei near shell closures are considered to be spherical which are described by a wavefunction of individual nucleons moving in a spherical potential. Therefore, the core does notcontribute to the nuclear quadrupole moment (single particle Q-moments are <0.5eb). Dueto particle-core interactions, the valence nucleon can polarize the core. Because the nuclearenergy is minimized if the overlap of the core nucleons with the valence particle (or hole) ismaximal, a particle (respective hole) will polarize the core towards an oblate (respectivelyprolate) deformation, as demonstrated in fig.6.3.
A change of the quadrupole moment as a function of N or Z can be either a signature fora change in the core polarization or, if the change is drastic, an indication for an onset of astatic nuclear deformation. For example, the systematic increase of quadrupole moments withdecreasing neutron number in neutron-deficient Po isotopes (see fig.6.4) has been explainedby an increase of the quadrupole-quadrupole interaction between the proton particles andthe increasing amount of neutron holes [46, 47].
6.2.2 Comparision with Large-Scale-Shell-Model Calculations
In the first set of large-scale shell-model (LSSM) calculations (for details see [4]) performedby the Oslo group for all tin isotopes 102−130Sn, the CD-Bonn potential for the bare nucleon-nucleon interaction [48] was used. Two sets of closed shell core were chosen for these cal-culations, 100Sn and 132Sn. In the present discussion we focus on the results obtained with

6.2. THE AVERAGE POTENTIAL OF THE NUCLEUS 83
Figure 6.3: Graphical representation of a particle in an orbital j, polarizing the core towardsoblate deformation with a negative quadrupole moment (left), and a hole in an orbital givingrise to a prolate core polarization (right).
Figure 6.4: The increase in the absolute value of the quadrupole moments of isomers inthe Pb region has been understood as due to a coupling of the valence particles with thequadrupole excitations of the underlying core.
the 100Sn closed-shell core. The model space for neutrons comprises in all cases of the 1d5/2,0g7/2, 1d3/2, 2s1/2 and 0h11/2 orbitals. A harmonic-oscillator basis was chosen for the single-particle wave functions, with an oscillatory energy hω =45 · A−1/3- 25 · A−2/3 =8.5MeV.The single-particle energies of the chosen model space orbits are set, relative to the 1d5/2
orbital (ǫ1d5/2=0.0MeV), as follows: ǫ0g7/2=0.08MeV, ǫ1d3/2=1.66MeV, ǫ2s1/2=1.55MeV, andǫ0h11/2=3.55MeV. The neutron effective charge was set to 1.0e. The results of the calcula-tions for the energies of the 2+
1 excites states and the B(E2;0+g.s → 2+
1 ) values are presentedin columns 3 and 5 of tab. 6.1 together with experimental data.

84 CHAPTER 6. COMPARISION WITH THEORETICAL PREDICTIONS
To shed more light on the role of core polarization effects, a second set of LSSM calculationsincludes protons in the 0g9/2, 0g7/2, 1d5/2, 1d3/2 and 2s1/2 single-particle orbits as well, inaddition to neutrons in the same model space as in the first set of calculations. The calcu-lations, performed with the coupled code NATHAN [49], allowed up to 4p-4h proton coreexcitations. The closed-shell core is this time 90Zr and the effective charges are set to 1.5eand 0.5e for protons and neutrons, respectively. In this model space the m-scheme dimensionwas excessively large. Because of the seniority truncation in that calculation the systematictrend in B(E2↑) values was retained. The comparision between experiment and theory showsagreement for the heavier Sn isotopes assuming a 100Sn core. However, for the lighter Sn iso-topes one observes an asymmetry of the B(E2↑) systematics. The experimental information
Isotope E(2+1 ) [keV] B(E20+
g.s → 2+1 ) e2b2
Exp SM b Exp SM b SM c
102Sn 1472.0(2) 1647 0.043 0.044104Sn 1260.1(3) 1343 0.094 0.090106Sn 1207.7(5) 1231 0.209(32) 0.137 0.125108Sn 1206.1(2) 1243 0.224(16) 0.171 0.162110Sn 1211.9(2) 1259 0.226(18) 0.192 0.192112Sn 1256.9(7) 1237 0.242(8) 0.203 0.219114Sn 1299.9(7) 1208 0.232(8) 0.209 0.235116Sn 1293.6(8) 1135 0.209(6) 0.210 0.241118Sn 1229.7(2) 1068 0.209(8) 0.208 0.239120Sn 1171.3(2) 1044 0.202(4) 0.201 0.228122Sn 1140.6(3) 1076 0.192(4) 0.184 0.206124Sn 1131.7(2) 1118 0.166(4) 0.156 0.174126Sn 1141.2(2) 1214 0.10(3) 0.118 0.134128Sn 1168.8(4) 1233 0.073(6) 0.079 0.090130Sn 1121.3(5) 1191 0.023(5) 0.042 0.047
bLSSM in ν(g7/2, d, s, h11/2) shell model space with 100Sn closed-shell core and eνeff=1.0e.
cLSSM in π(g, d, s) and ν(g7/2, d, s, h11/2) shell model space with 90Zr closed-shell core andthe effective charge eπ
eff=1.5e and eνeff=0.5e.
Table 6.1: Iπ=2+ energies and E2 strengths in 102−130Sn. The experimental data of theneutron-deficient isotopes are averaged values of Refs. [6, 14, 15, 16].
in the B(E2↑) systematics of the tin isotopes with the new values of 112Sn and 114Sn includedis also presented in fig. 6.5. It is appearent that the result from 112Sn is about 20% largerthan the one for 120Sn, in contrast to the symmetric distribution expected with respect tothe midshell A=116. According to the seniority model the B(E2↑) values naturally decreasewith the decreasing number of particles outside the closed core. This trend cannot be foundin our data for 112Sn and 114Sn.

6.3. RELATIVISTIC QUASI-PARTICLE RANDOM PHASE APPROXIMATION 85
Figure 6.5: Experimental data on B(E2;0+g.s → 2+
1 ) values in the Sn isotope chain from thecurrent results for 112,114Sn and from [2, 6, 14, 15, 16]. The dotted and the full lines show thepredictions of the large-scale shell model calculations [6] performed with a 100Sn core and a90Zr core, respectively.
6.3 Relativistic Quasi-Particle Random Phase
Approximation
For the study of the heavier nuclei alternative methods have been developed, usually inthe form of self-consistent mean field theories. Phenomenological in nature (an effective in-teraction and an average potential is introduced), their success in describing bulk nuclearproperties all across the nuclear chart make them a very good tool for the study of nuclearphenomena.It is understood that the interaction V(~ri, ~rj) in a nucleus has its origin in the exchangeof mesons between the bare nucleons. The simplest form is the one-pion exchange potentialwhich has the radial dependence of the Yukawa potential [41]. In eq. 6.3 the parameter 1/µ=h/mπc denotes the Compton wavelength of the pion.In the relativistic mean field approximation RMF [51], nucleons are described as Dirac point-like particles that interact by the exchange of different type of mesons. The attraction ofnucleons is caused by the scalar meson σ(Iπ = 0+,T=0) field. The short repulsive interac-tion is connected with the exchange of vector meson ω(Iπ = 1,T=0). The isovector meson

86 CHAPTER 6. COMPARISION WITH THEORETICAL PREDICTIONS
ρ(Iπ = 0−,T=1) is also included. The electromagnetic interaction is carried by a photonfield. Although nucleons in nuclei have relatively small kinetic energies as compared to therest mass, there are reasons to study the nuclear many body problem in the relativisticframework. As a direct consequece of relativity two mean fields appear, i.e. an attractivescalar field S and a repulsive vector field V which characterise the essential features of nu-clear systems, i.e. the shell structure. Their difference (V-S) determines the weak nuclearmean field in which nucleons move and their sum (V+S) the strong spin-orbit term.
Figure 6.6: The attractive scalar field S(r) and the repulsive vector field V(r) form the weaknuclear mean field (S+V) and the strong spin-orbit term (S-V).
6.3.1 Density Functional Theory
The density functional theory is a quantum mechanical method used in many areas of physicsto investigate many-body systems. For such a system the ground state expectation value forthe Hamiltonian is the state energy
E0 =⟨
Ψ0|H|Ψ0
⟩
=⟨
Ψ0|T + U + V |Ψ0
⟩
(6.9)
where, in the customary decomposition of H , T is the kinetic energy term, U is the termcorresponding to the interaction between particles and V is an external potential. For agiven wave function Ψ one can calculate the local simple particle density as
ρ(r) =∫
d3r2...∫
d3rNΨ∗(r, r2, .., rN)Ψ(r, r2, .., rN) (6.10)
The previous relation can be inverted: for a given ground state density ρ(r), it is possible,in principle, to calculate the corresponding ground state wave function Ψ0. This means thatΨ0 is a function of ρ(r), and consequently, all ground state observables are functional of

6.3. RELATIVISTIC QUASI-PARTICLE RANDOM PHASE APPROXIMATION 87
ρ(r), too. Therefore, it is possible to calculate all properties of the system, in particular, itsground state energy E0=E(ρ). By minimization of the energy functional with respect to thedensity one obtains the ground state energy and density of fermionic system. This gives analternative way to describe an interacting system of fermions via its density and not via itsmany-body wave function. The greatest advantage of this method is that one does not haveto assume an inert core and adjust effective charge parameters for protons and neutronsfrom nucleus to nucleus or region to region of the periodic table.
One uses a phenomenological description of the nuclear many body problem and solvesit with an effective density dependent energy functional. The parameters of these functionalare fitted to the experimental data of nuclear matter and of finite nuclei. The number ofmesons, their quantum numbers such as spin I, Parity P and isospin T and the values oftheir masses and coupling constants are determined in such a way as to reproduce as well aspossible the experimental data. Simplicity is an essential ingredient. One therefore tries toinclude only as few as mesons as possible. There are eight free parameters in the relativisticmean field model: meson masses and their coupling constants.Various sets of interaction coupling constants - going by names such as NL1, NL-SH, andNL3 - are considered in the literature (see tab. 6.2)
NL1 NL-SH NL3m [MeV] 938.0 939.0 939.0mσ [MeV] 492.25 526.059 508.194mω [MeV] 795.359 783.0 782.501
gσ 10.138 10.444 10.217gω 13.285 12.945 12.868gρ 4.976 4.383 4.474
g2 [fm−1] -12.172 -6.9099 -10.431g3 -36.265 -15.8337 -28.885
Knm[MeV] 211.7 355.0 271.8
Table 6.2: Relativistic mean field parameterizations NL1, NL-SH and NL3. Knm correspondsto the incompressibility of the matter for each set of parameters. The mass of the ρ mesonis fixed to the experiment value, mρ=763.0 MeV.
Relativistic Hartree-Bogoliubov (RHB) theory was successfully applied to the study ofmany ground state properties in nuclei throughout the periodic table. It shows a high degreeof accuracy in the reproduction of experimental data: masses and radii, shape coexistence,halos, neutron and proton rich nuclei, rotational bands and nuclear magnetism, superdefor-mation, etc.For the description of vibrational excited states, the standard approach is the random-phaseapproximation (RPA) in the doubly magic spherical nuclei and it is the quasi-particle RPA

88 CHAPTER 6. COMPARISION WITH THEORETICAL PREDICTIONS
in open-shell spherical nuclei. RING and co-workers [52, 53] have recently derived fully self-consistent relativistic RPA and QRPA equations based on the RHB mean field. For theinteraction in the particle-hole channel three different density functionals were used, i.e. thestandard RMF functional with non-linear meson self interaction, the RMF functional withdensity dependent meson-nucleon coupling constants, and the RMF functional with densitydependent point couplings. The same interaction is used for the ground state and excitedstates calculation. The two-quasiparticle QRPA configuration space include states with bothnucleons in discrete bound levels, states with one nucleon in the continuum, and also stateswith both nucleons in the continuum.
6.3.2 Comparision with Relativistic Quasi-Particle Random Phase
Approximation
Recently [54], this approach has been applied to calculate the energies of the first excited 2+
states and corrsponding B(E2) decay data for tin isotopes with even mass numbers A=100-134. The great advantage of the RQRPA scheme is that it is not necessary to assume an inertcore and to adjust parameters of the Hamiltonian from nucleus to nucleus or region to regionof the periodic table. In tab. 6.3 we compare the measured B(E2↑) values of the Sn isotopeswith the calculated data [54]. In view of there being no free adjustment of parameters oreffective charges, the agreement with theoritical data is very good. The most important fea-ture is the asymmetric behaviour of the B(E2↑) data with respect to the midshell nucleus116Sn. Fig. 6.7 shows the comparision of the experimental B(E2↑) values of the tin isotopeswith the RQRPA calculations. It is interesting to note that the same RQRPA calculationsyield quite satisfactory agreement also for the Ni and Pb isotopes [55].

6.3. RELATIVISTIC QUASI-PARTICLE RANDOM PHASE APPROXIMATION 89
Isotope E(2+1 ) [keV] B(E20+
g.s → 2+1 ) e2b2
Exp RQRPA Exp RQRPA102Sn 1472.0(2) 1341 0.094104Sn 1260.1(3) 1001 0.185106Sn 1207.7(5) 891 0.209(32) 0.235108Sn 1206.1(2) 940 0.224(16) 0.227110Sn 1211.9(2) 1014 0.226(18) 0.202112Sn 1256.9(7) 1112 0.242(8) 0.176114Sn 1299.9(7) 1207 0.232(8) 0.155116Sn 1293.6(8) 1236 0.209(6) 0.144118Sn 1229.7(2) 1242 0.209(8) 0.146120Sn 1171.3(2) 1269 0.202(4) 0.150122Sn 1140.6(3) 1296 0.192(4) 0.152124Sn 1131.7(2) 1340 0.166(4) 0.145126Sn 1141.2(2) 1411 0.10(3) 0.126128Sn 1168.8(4) 1537 0.073(6) 0.096130Sn 1121.3(5) 1751 0.023(5) 0.055
Table 6.3: Iπ=2+ energies and E2 strengths in 102−130Sn. The experimental data of theneutron-deficient isotopes are averaged values of Refs. [6, 14, 15, 16]
Figure 6.7: Experimental data on B(E2;0+g.s → 2+
1 ) values in the Sn isotope chain from thecurrent results for 112,114Sn and from [2, 6, 14, 15, 16]. The full line shows the predictions ofthe RQRPA calculations [54]

Chapter 7
Active Stopper
In neutron deficient Sn isotopes where Coulomb excitation experiments are presently notpossible due to lack of sufficient beam intensities, decay studies can be performed to obtainthe level scheme in these exotic nuclei. At GSI Helmholtzzentrum fur Schwerionenforschungradioactive nuclei are produced following relativistic projectile fragmentation and/or fissionreactions. By utilizing the magnetic separator Fragment Separator (FRS) [56], specific nu-clei of interest can be distinguished from the vast plethora of other secondary products andcleanly transmitted to the final focus, where decay studies may be performed. Such studiesmake use of the RISING γ-ray array [57] which consists of fifteen, high efficiency seven-element Ge cluster detectors. In order to measure the γ-radiation following alpha and/orbeta-decay, the exotic nuclei have to be stopped in an active stopper. It was placed atthe final focus and consisted of a series of Double Sided Silicon Strip Detectors (DSSSDs).The DSSSDs were used to determine both the energy and position of the (a) implantedsecondary fragment of interest directly from the projectile fragmentation reaction and (b)beta-particle(s) following the subsequent radioactive decay(s) of the often highly exotic nu-cleus of interest and its daughter decays. The ultimate aim of the device is to correlatebeta-decay events to specific exotic radioactive mother nuclei on an event by event basis. Inthis chapter the development of the active stopper detector is discussed in detail.
7.1 Active Stopper
A new beta counting system has been developed for the RISING (Rare Isotope SpectroscopicINvestigation at GSI) project [58] to study the β-decay of exotic nuclei produced by pro-jectile fragmentation or fission. This system employs Micron Semiconductor Ltd. [59] ModelW1(DS)-1000 DC coupled double-sided silicon strip detectors (DSSSD) with 16 front stripsand 16 back strips, each of width 3mm (see fig. 7.1), to detect both fragment implants andtheir subsequent beta decays.
One of the challenges in designing electronics for the beta counting system is the rangeof charged particle energies that must be measured. A fast fragment implant will depositmore than 1GeV total energy in the DSSSD, while an emitted beta particle will deposit less
91
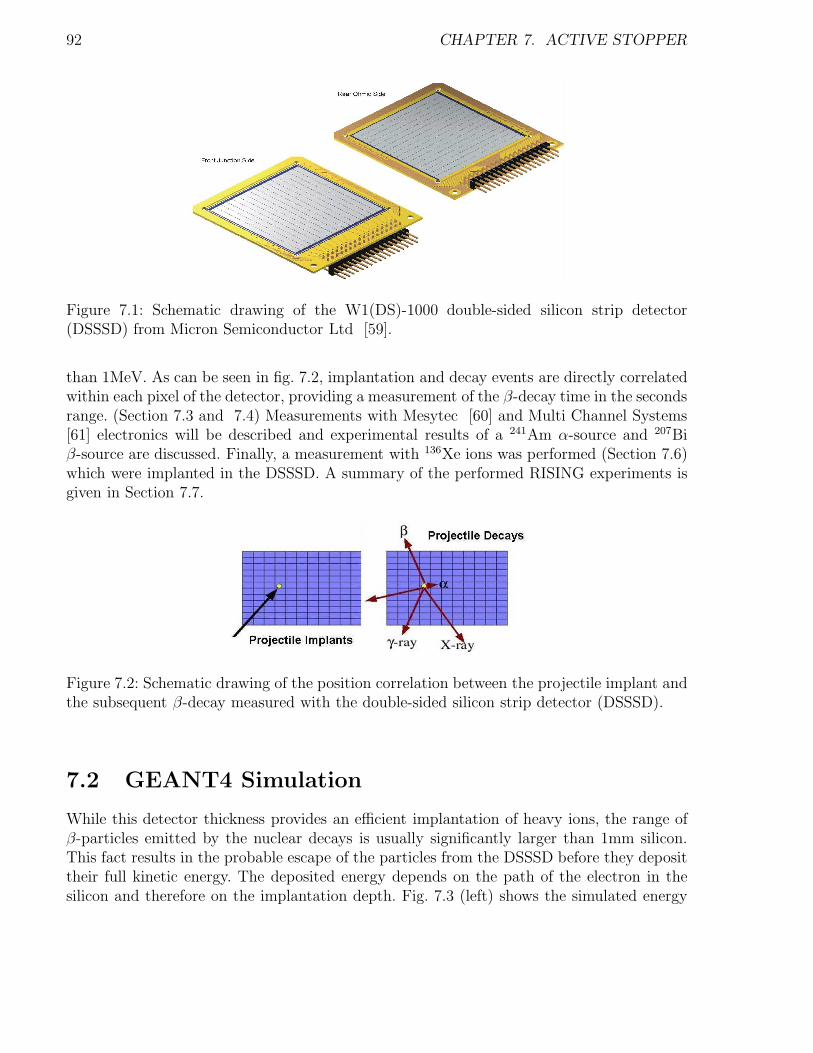
92 CHAPTER 7. ACTIVE STOPPER
Figure 7.1: Schematic drawing of the W1(DS)-1000 double-sided silicon strip detector(DSSSD) from Micron Semiconductor Ltd [59].
than 1MeV. As can be seen in fig. 7.2, implantation and decay events are directly correlatedwithin each pixel of the detector, providing a measurement of the β-decay time in the secondsrange. (Section 7.3 and 7.4) Measurements with Mesytec [60] and Multi Channel Systems[61] electronics will be described and experimental results of a 241Am α-source and 207Biβ-source are discussed. Finally, a measurement with 136Xe ions was performed (Section 7.6)which were implanted in the DSSSD. A summary of the performed RISING experiments isgiven in Section 7.7.
Figure 7.2: Schematic drawing of the position correlation between the projectile implant andthe subsequent β-decay measured with the double-sided silicon strip detector (DSSSD).
7.2 GEANT4 Simulation
While this detector thickness provides an efficient implantation of heavy ions, the range ofβ-particles emitted by the nuclear decays is usually significantly larger than 1mm silicon.This fact results in the probable escape of the particles from the DSSSD before they deposittheir full kinetic energy. The deposited energy depends on the path of the electron in thesilicon and therefore on the implantation depth. Fig. 7.3 (left) shows the simulated energy

7.3. MEASUREMENTS WITH MESYTEC ELECTRONICS 93
spectrum of the electrons emitted by the β-decay and detected by the DSSSD. A Fermi-Curieinitial electron energy distribution with Qβ = 5MeV was assumed.
0.0 0.2 0.4 0.6 0.8 1.00
1000
2000
3000
4000
5000
uniformly distributed implantation
implantation in center
counts
energy, MeV
0.0 0.1 0.2 0.3 0.4 0.50.0
0.2
0.4
0.6
0.8
1.0
effic
iency
threshold energy, MeV
uniformly distributed implantation
implantation in center
Figure 7.3: Simulated energy spectrum of β-particles emitted from fragments implanted uni-formly (solid line) and exactly in the centre (dashed line) of a DSSSD (left). The simulationassumes a Qβ-value of 5MeV and a Fermi-Curie distribution for β-particles. The right figureshows the calculated β-detection efficiency as a function of the DSSSD threshold for the twoconsidered implantation senarios.
For different Qβ- values the displayed energy distribution will only change on the high-energetic side. The Monte-Carlo simulations were performed using GEANT4 simulationtoolkit [62] with the ’GEANT4 Low Energy Electromagnetic Physics’ package [63]. Two casesof the implantation were considered: uniformly distributed and exact central implantation.In the later case the minimum distance to the surface is 0.5mm which corresponds to theminimum energy which electrons deposit in the crystal. This fact highlights the importanceof achieving the low energy threshold at 0.1 MeV as well as the importance of the accuratecentral implantation. Fig. 7.3 (right) shows the efficiency to detect β-particles in 1mm thickDSSSD in dependence on the energy threshold for the two considered implantation scenarioswhich is high for a low detection threshold.
7.3 Measurements with mesytec Electronics
The mesytec MPR-32 preamplifier was used for the 16 front and 16 back strips of a singleDSSSD. Positive and negative charge can be amplified equally. The input connectors aresubD 25 female connectors. For the differential outputs twisted pair 34 pin male headerconnectors are used. For a 207Bi β-source the MPR-32 output signal is displayed in fig. 7.4with a pulse height of approximately 200mV and a decay time of 30µs. The signal to noiseratio is 10:1.
The mesytec MPR-32 multi-channel preamplifier is available in a linear and logarithmicmode. A typical application of the logarithmic one is decay spectroscopy which allows the
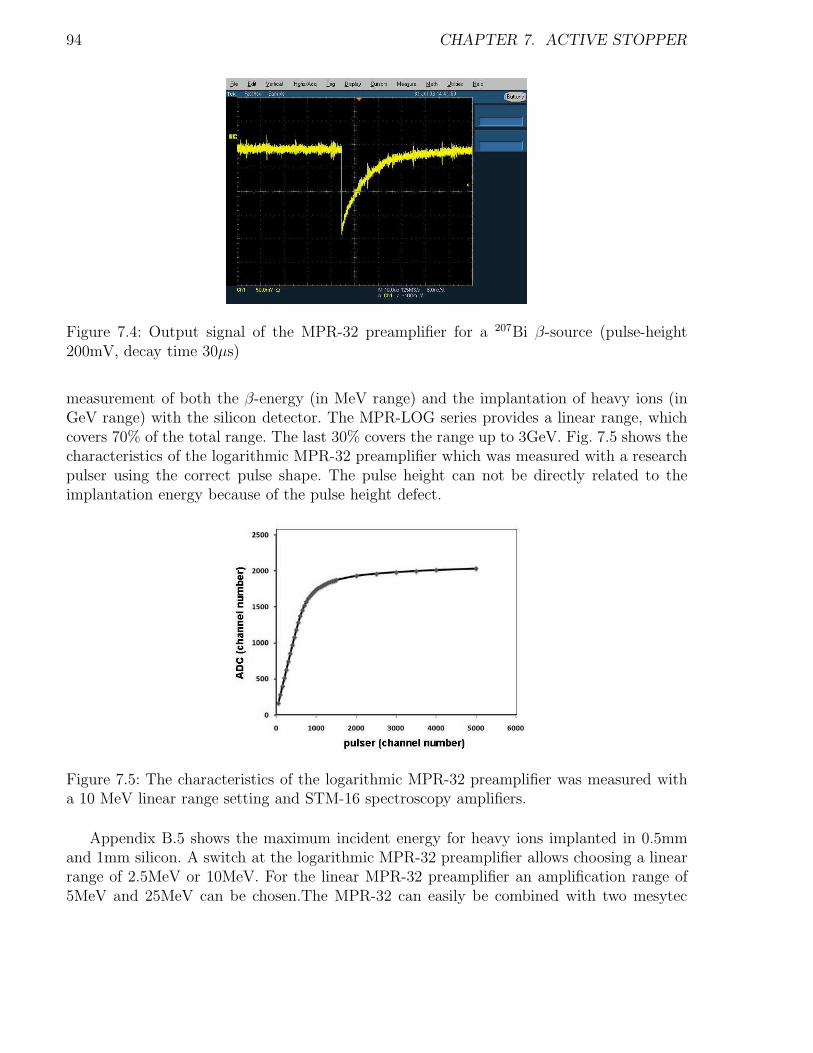
94 CHAPTER 7. ACTIVE STOPPER
Figure 7.4: Output signal of the MPR-32 preamplifier for a 207Bi β-source (pulse-height200mV, decay time 30µs)
measurement of both the β-energy (in MeV range) and the implantation of heavy ions (inGeV range) with the silicon detector. The MPR-LOG series provides a linear range, whichcovers 70% of the total range. The last 30% covers the range up to 3GeV. Fig. 7.5 shows thecharacteristics of the logarithmic MPR-32 preamplifier which was measured with a researchpulser using the correct pulse shape. The pulse height can not be directly related to theimplantation energy because of the pulse height defect.
Figure 7.5: The characteristics of the logarithmic MPR-32 preamplifier was measured witha 10 MeV linear range setting and STM-16 spectroscopy amplifiers.
Appendix B.5 shows the maximum incident energy for heavy ions implanted in 0.5mmand 1mm silicon. A switch at the logarithmic MPR-32 preamplifier allows choosing a linearrange of 2.5MeV or 10MeV. For the linear MPR-32 preamplifier an amplification range of5MeV and 25MeV can be chosen.The MPR-32 can easily be combined with two mesytec

7.3. MEASUREMENTS WITH MESYTEC ELECTRONICS 95
STM-16 shaping-/timing filter/ discriminator modules when the differential input version isused. The input resistance must be terminated with 50Ω for the linear MPR-32 and 100Ωfor the logarithmic MPR-32. The polarity can be changed with a 4*16 pole connector (insidethe case labelled differential input gain 2). Two shaping times of σ=0.4µs/1µs (1.0µs/2.5µsFWHM) can be selected by a jumper (short/long) which is common for all channels. Forthe following measurements a shaping time of 1µs (FWHM) was selected. The STM-16 canbe controlled by a NIM-module MRC-1 which works as a bus master. One mesytec MRC-1can control 32 various mesytec modules (not only STM-16). It is prepared for the remotecontrol of (i) individual discriminator thresholds (0% to 40% of maximum range, 4V) and(ii) gains (in 16 steps) for pairs of channels. Communication with a control PC is done viaRS-232 serial interface.Each analogue signal (34 pin male connector) was fed directly to aCAEN V785AF ADC. The trigger signal of STM-16 was used to produce the ADC gate.Details of the electronic modules and the electronics diagram can be found in Appendix B.1and B.2. Fig. 7.6 shows the energy spectrum of a 207Bi β-source measured for differentdiscriminator thresholds of the mesytec STM-16 module. The detection limit seems to be ataround 150keV.
Figure 7.6: Energy spectra of a 207Bi β-source measured for different discriminator thresholdslabelled T=8 to T=32 of the Mesytec STM-16 module.
7.3.1 Energy Resolution Measured with α-Particles of a241Am Source
The energy resolution of the individual strips was measured by a thin 241Am source placed5cm from the detector’s surface in a vacuum vessel, flooding it with α-particles. The rangeof 5MeV α-particles in silicon is ≈28µm. A Gaussian function was fitted to the 5.486MeVpeak. Individual strips displayed energy resolutions of 0.48-0.52 % (front) and 0.51-0.64 %(back) FWHM for the 5.486MeV peak. The edge strips showed a somewhat poorer resolution.

96 CHAPTER 7. ACTIVE STOPPER
Typical α-energy spectra for individual strips are displayed in fig. 7.7.
Figure 7.7: Energy spectrum of a 241Am α-source measured with DSSSD-2512-17 front stripX4 (left) and back strip Y4 (right).
Figure 7.8: Strip multiplicity for front (left) and back (right) side measured for DSSSD-2512-17 at a bias voltage of 40V (detector not fully depleted) for α-particles of a 241Amsource.
Neighbouring strips are separated by an insulating gap. It has already been observedby others [64] that a charged particle entering the detector through the gap between thestrips induces a reduced pulse height in the front strips in comparison to a particle enteringthrough a strip. This effect is believed to be the result of charge trapping between strips dueto the shape of the electric field between the strips. We have also observed this effect (seefig. 7.7 ). For a fully depleted DSSSD (bias voltage 200 V) the strip multiplicity is close tounity, while the maximum of the strip multiplicity (back side) is shifted to 2 for a detectorbias voltage of 40V (fig. 7.8).
The relative efficiency of the strips is roughly constant across the entire detector as itwas examined by C. Wrede et al.[64]. Therefore, the distribution of the α-source can beexamined with a resolution of 256 pixels. Data were taken under the following condition:

7.3. MEASUREMENTS WITH MESYTEC ELECTRONICS 97
First, the α-source was centred relative to the DSSSD and second, moved to one side of theDSSSD. Fig. 7.9 shows both 3-D histograms of x-position versus y-position. One can clearlysee the intensity distribution and the boundaries of the α-source.
Figure 7.9: 3-D histogram of x-position versus y-position measured for DSSSD-2243-5 withα-particles of a 241Am source. The source is centred (left) and off-centre (right) relative tothe DSSSD.
7.3.2 Energy Resolution Measured with Electrons of a 207Bi Source
Figure 7.10: The conversion electron spectrum of 207Bi obtained by strip X4 of DSSSD-2512-17. Four peaks at 482keV, 555keV, 976keV and 1049keV are by mono-energetic electrons(left). The energy resolution for the front junction and the rear ohmic side versus the stripnumber is plotted on the right side.
A 207Bi conversion electron source which emits mono-energetic β-particles was used tocalibrate the DSSSD. The 207Bi source was positioned at 5cm from the front face of thedetector. The measured electron spectrum for a front strip is shown in Fig. 7.10 (left).
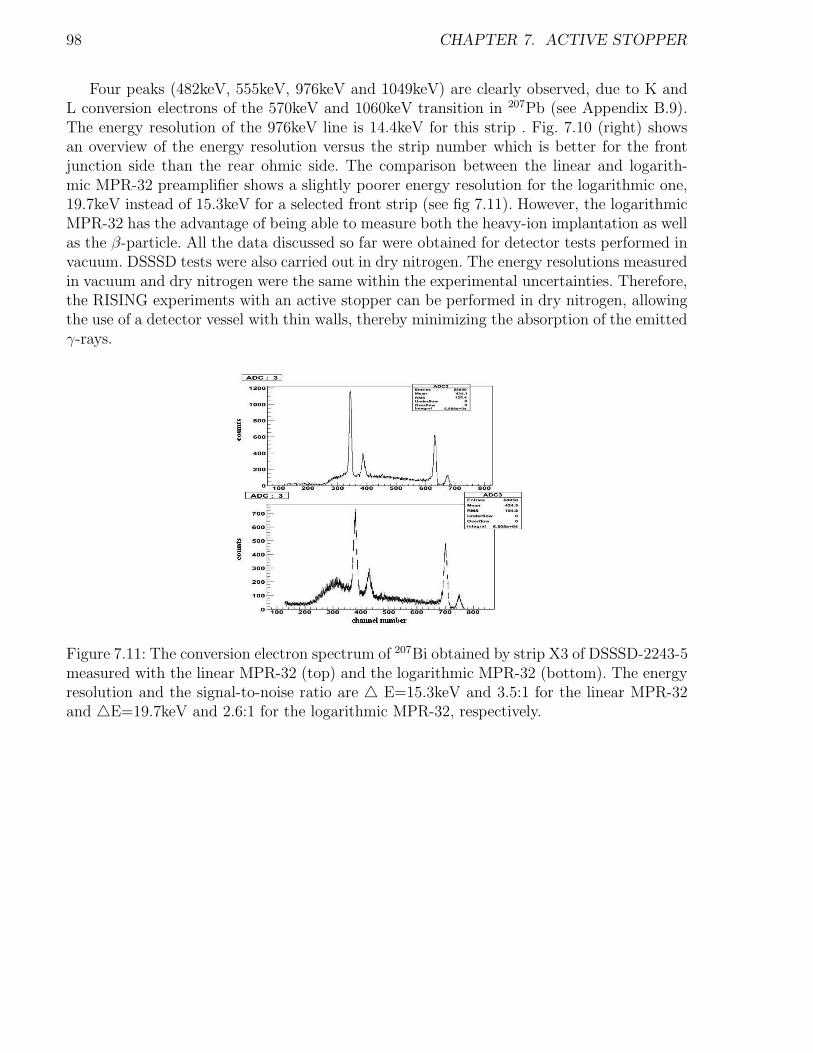
98 CHAPTER 7. ACTIVE STOPPER
Four peaks (482keV, 555keV, 976keV and 1049keV) are clearly observed, due to K andL conversion electrons of the 570keV and 1060keV transition in 207Pb (see Appendix B.9).The energy resolution of the 976keV line is 14.4keV for this strip . Fig. 7.10 (right) showsan overview of the energy resolution versus the strip number which is better for the frontjunction side than the rear ohmic side. The comparison between the linear and logarith-mic MPR-32 preamplifier shows a slightly poorer energy resolution for the logarithmic one,19.7keV instead of 15.3keV for a selected front strip (see fig 7.11). However, the logarithmicMPR-32 has the advantage of being able to measure both the heavy-ion implantation as wellas the β-particle. All the data discussed so far were obtained for detector tests performed invacuum. DSSSD tests were also carried out in dry nitrogen. The energy resolutions measuredin vacuum and dry nitrogen were the same within the experimental uncertainties. Therefore,the RISING experiments with an active stopper can be performed in dry nitrogen, allowingthe use of a detector vessel with thin walls, thereby minimizing the absorption of the emittedγ-rays.
Figure 7.11: The conversion electron spectrum of 207Bi obtained by strip X3 of DSSSD-2243-5measured with the linear MPR-32 (top) and the logarithmic MPR-32 (bottom). The energyresolution and the signal-to-noise ratio are E=15.3keV and 3.5:1 for the linear MPR-32and E=19.7keV and 2.6:1 for the logarithmic MPR-32, respectively.
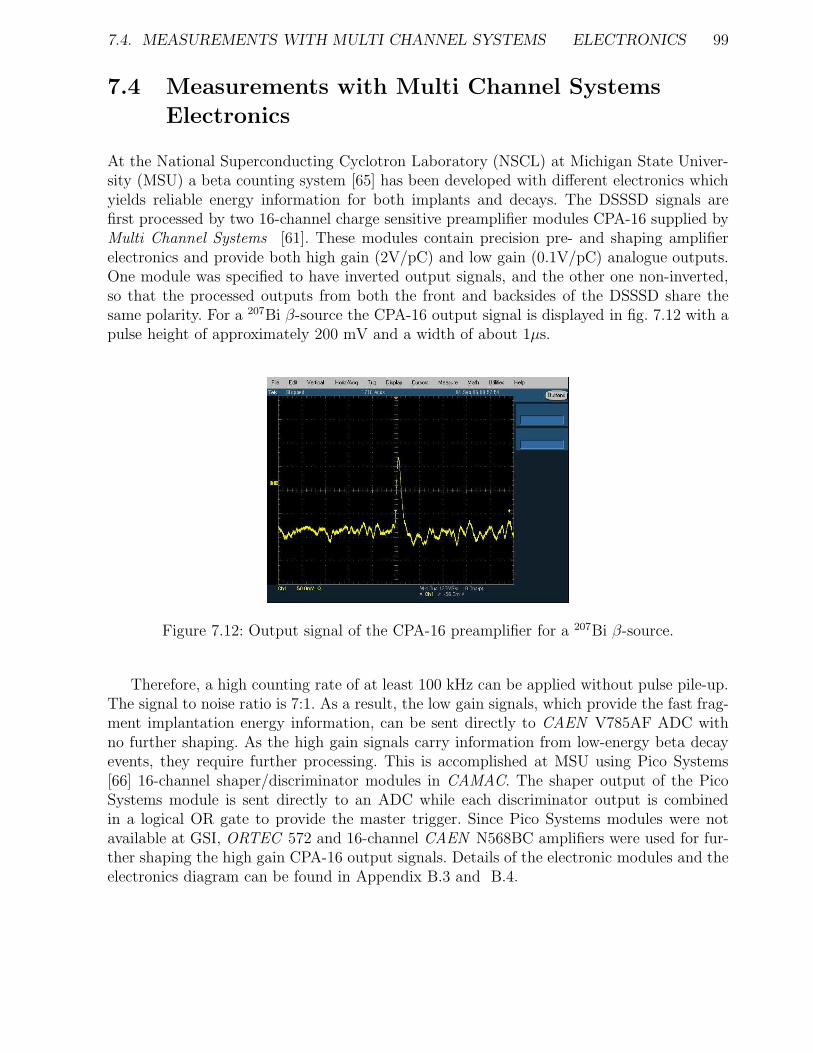
7.4. MEASUREMENTS WITH MULTI CHANNEL SYSTEMS ELECTRONICS 99
7.4 Measurements with Multi Channel Systems
Electronics
At the National Superconducting Cyclotron Laboratory (NSCL) at Michigan State Univer-sity (MSU) a beta counting system [65] has been developed with different electronics whichyields reliable energy information for both implants and decays. The DSSSD signals arefirst processed by two 16-channel charge sensitive preamplifier modules CPA-16 supplied byMulti Channel Systems [61]. These modules contain precision pre- and shaping amplifierelectronics and provide both high gain (2V/pC) and low gain (0.1V/pC) analogue outputs.One module was specified to have inverted output signals, and the other one non-inverted,so that the processed outputs from both the front and backsides of the DSSSD share thesame polarity. For a 207Bi β-source the CPA-16 output signal is displayed in fig. 7.12 with apulse height of approximately 200 mV and a width of about 1µs.
Figure 7.12: Output signal of the CPA-16 preamplifier for a 207Bi β-source.
Therefore, a high counting rate of at least 100 kHz can be applied without pulse pile-up.The signal to noise ratio is 7:1. As a result, the low gain signals, which provide the fast frag-ment implantation energy information, can be sent directly to CAEN V785AF ADC withno further shaping. As the high gain signals carry information from low-energy beta decayevents, they require further processing. This is accomplished at MSU using Pico Systems[66] 16-channel shaper/discriminator modules in CAMAC. The shaper output of the PicoSystems module is sent directly to an ADC while each discriminator output is combinedin a logical OR gate to provide the master trigger. Since Pico Systems modules were notavailable at GSI, ORTEC 572 and 16-channel CAEN N568BC amplifiers were used for fur-ther shaping the high gain CPA-16 output signals. Details of the electronic modules and theelectronics diagram can be found in Appendix B.3 and B.4.

100 CHAPTER 7. ACTIVE STOPPER
7.4.1 Energy Resolution Measured with β-Particles of a 207Bi Source
Figure 7.13: The conversion electron spectrum of 207Bi obtained by a strip of DSSSD-2243-5.Two peaks at 482keV and 976keV are by mono-energetic electrons. The high gain outputsignal of the CPA-16 preamplifier was sent directly to the ADC.
A 207Bi conversion electron source was used to measure the electron spectrum for onerepresentative strip of DSSSD-2243-5 (fig. 7.13). The β-source was also positioned about5cm from the front face of the detector. Three different measurements were performed: (i)the high gain output signal of the CPA-16 preamplifier was sent directly to the ADC, (ii)it was additionally amplified with ORTEC 572 using shaping times of 0.5s, 1.0s and 2.0s,respectively and (iii) with CAEN N568BC with shaping time 2.0s before sending it to theADC.
Fig. 7.13 shows the conversion electron spectrum of 207Bi without further amplification.Only two peaks (482keV and 976keV) are clearly seen and are due to K conversion electronsof the 570keV and 1060keV transition in 207Pb. The energy resolution of the 976keV line is100keV. The detection limit seems to be at around 300keV. The measured energy resolutionswith ORTEC 572 and CAEN N568BC are summarized in the table 7.1 below.
Shaping time [µs] ORTEC 572 CAEN N568C0.5 122keV1.0 112keV2.0 103keV 113keV
Table 7.1: The measured energy resolutions with ORTEC 572 and CAEN N568BC
In conclusion, for the DSSSD an energy resolution of 15keV and an energy thresholdof 150keV have been measured for the mesytec electronic which compares to a FWHM of100keV and a threshold of 300keV for Multi Channel Systems electronics.

7.5. CHAMBER FOR THE RISING ACTIVE STOPPER 101
7.5 Chamber for the RISING Active Stopper
After the decision to operate the DSSSD in dry nitrogen, γ-transmission measurementswere performed with 57Co (Eγ=0.122, 0.136MeV) and 60Co (Eγ=1.173, 1.332MeV) sources.Different aluminium plates varying between 1mm and 5mm as well as printed circuit boardmaterial Pertinax (phenolic-formaldehyd cellulose-paper PF CP 2061) of 6mm thickness wereirradiated and the none absorbed γ-rays were detected in a Geiger-Muller counter. The ratioof the γ-transmission of aluminium and Pertinax is plotted in fig. 7.14 as a function of theAl-layer thickness.
Figure 7.14: The ratio of the γ-transmission of aluminium and the printed circuit board ma-terial Pertinax is plotted as a function of the Al-layer. The γ-transmission of both materialsis equal for a thickness of 2mm aluminium
Figure 7.15: The Cluster array of the stopped beam RISING experiments with the activestopper vessel made out of Pertinax (left) and the top cover of the active stopper chamberwith the cable connectors (right) for six DSSSD arranged in two rows.
The γ-transmission of both materials is equal for a thickness of 2mm aluminium. Since
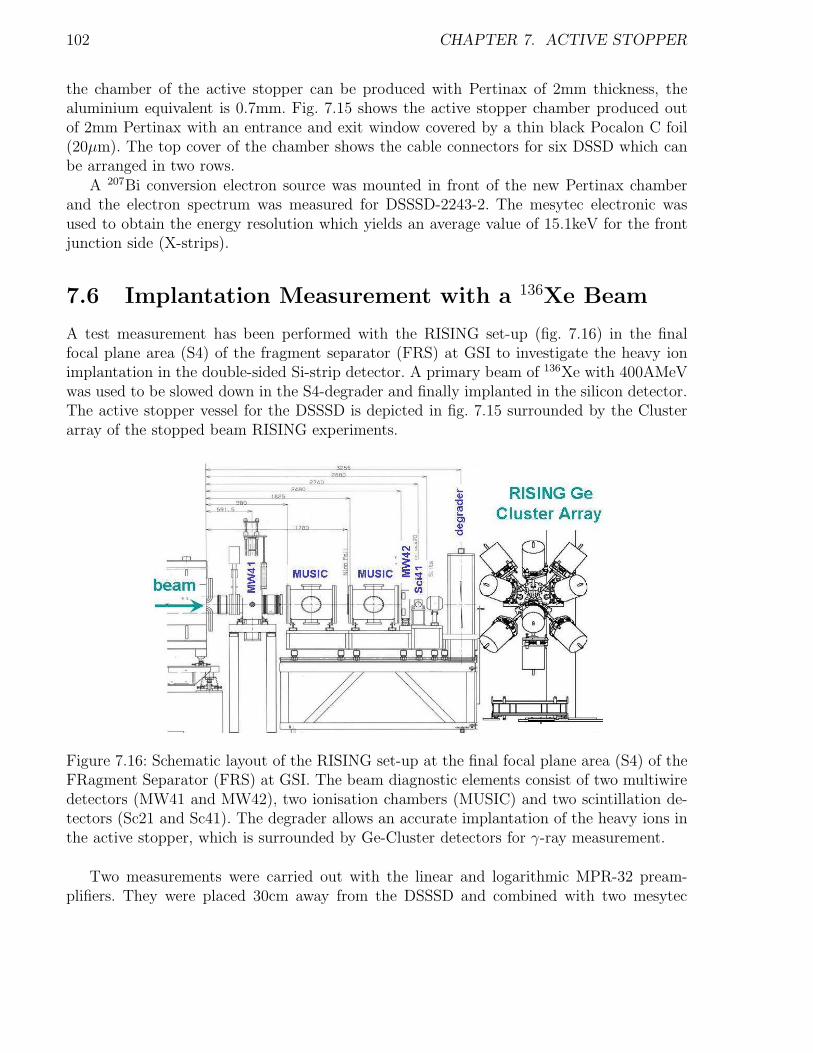
102 CHAPTER 7. ACTIVE STOPPER
the chamber of the active stopper can be produced with Pertinax of 2mm thickness, thealuminium equivalent is 0.7mm. Fig. 7.15 shows the active stopper chamber produced outof 2mm Pertinax with an entrance and exit window covered by a thin black Pocalon C foil(20µm). The top cover of the chamber shows the cable connectors for six DSSD which canbe arranged in two rows.
A 207Bi conversion electron source was mounted in front of the new Pertinax chamberand the electron spectrum was measured for DSSSD-2243-2. The mesytec electronic wasused to obtain the energy resolution which yields an average value of 15.1keV for the frontjunction side (X-strips).
7.6 Implantation Measurement with a 136Xe Beam
A test measurement has been performed with the RISING set-up (fig. 7.16) in the finalfocal plane area (S4) of the fragment separator (FRS) at GSI to investigate the heavy ionimplantation in the double-sided Si-strip detector. A primary beam of 136Xe with 400AMeVwas used to be slowed down in the S4-degrader and finally implanted in the silicon detector.The active stopper vessel for the DSSSD is depicted in fig. 7.15 surrounded by the Clusterarray of the stopped beam RISING experiments.
Figure 7.16: Schematic layout of the RISING set-up at the final focal plane area (S4) of theFRagment Separator (FRS) at GSI. The beam diagnostic elements consist of two multiwiredetectors (MW41 and MW42), two ionisation chambers (MUSIC) and two scintillation de-tectors (Sc21 and Sc41). The degrader allows an accurate implantation of the heavy ions inthe active stopper, which is surrounded by Ge-Cluster detectors for γ-ray measurement.
Two measurements were carried out with the linear and logarithmic MPR-32 pream-plifiers. They were placed 30cm away from the DSSSD and combined with two mesytec

7.6. IMPLANTATION MEASUREMENT WITH A 136XE BEAM 103
STM-16 shaping-/timing filter/ discriminator modules (at a distance of 10m). The STM-16units were operated with a gain-value of 1 and a threshold of 20. For the planned decayexperiment the optimal settings are a gain-factor of 2 and the threshold as low as possible(e.g. 2-3) to reach the highest efficiency for electron detection. The scintillation detectorSc41 served as a trigger for the measurement.
7.6.1 Results with the Linear MPR-32 mesytec
Preamplifier
The linear MPR-32 preamplifier is well suited for the electron measurement (MeV range),however, for the implantation of heavy ions (GeV range) the output signals saturate. Acollection of the measured preamplifier signals can be found in Appendix B.6. The measuredenergy spectra (10MeV range setting) obtained by x-strips (front junction) of DSSSD-2243-5are shown in fig. 7.17 for the implantation of 136Xe ions.
Figure 7.17: Measured energy spectra (10MeV range of the linear MPR-32 preamplifier)obtained by x-strips (front junction) of DSSSD-2243-5 for the implantation of 136Xe ions.
They show the low energetic part of the implantation caused by light charged particlesand atomic X-rays. In most cases all the strips of the DSSSD fire, since no condition is seton the implantation of the heavy ions. Fig. 7.18 shows the x-strip multiplicity distributionsfor different energy thresholds. If one takes only the overflow data of the energy spectra

104 CHAPTER 7. ACTIVE STOPPER
Figure 7.18: Multiplicity distributions measured by x-strips of DSSSD-2243-5 for differentenergy thresholds. For a very low threshold (channel number 200) almost all x-strips arefiring, while for the overflow (>10MeV) data the hit probability is very low, as expected forthe implantation of 136Xe ions.
(>10MeV), the multiplicity spectrum is localized at small values, which is expected for theimplantation. For multiplicity one on each side of DSSSD the position is uniquely determined,while for higher multiplicities the centroid has to be determined.
Figure 7.19: Position correlation between the multiwire detector MW and the DSSSD-2243-5. In case of the DSSSD the position of the implanted 136Xe ion was determined from theoverflow data, when a linear MPR-32 preamplifier was used.
In case of the linear MPR-32 preamplifier each strip has the same weight for this cal-culation, since the individual strip energies are not measured. Based on the overflow data,a position correlation between the DSSSD and the multiwire detector MW was determinedwhich is displayed in fig. 7.19.
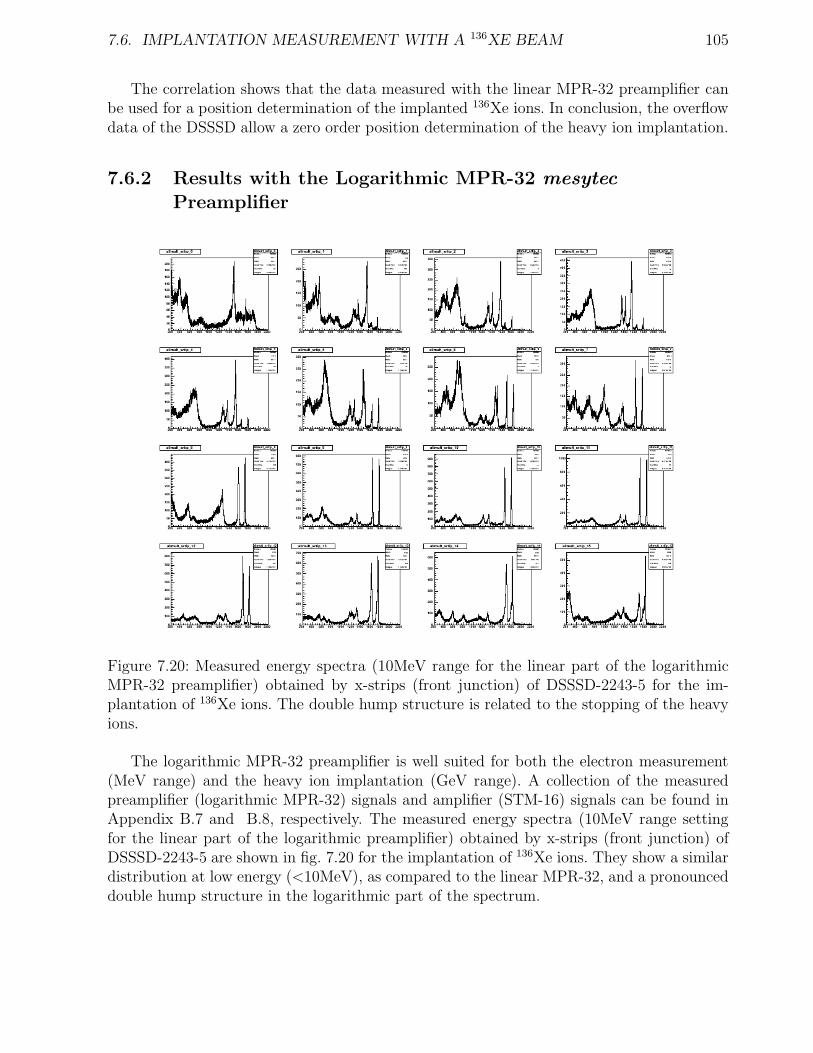
7.6. IMPLANTATION MEASUREMENT WITH A 136XE BEAM 105
The correlation shows that the data measured with the linear MPR-32 preamplifier canbe used for a position determination of the implanted 136Xe ions. In conclusion, the overflowdata of the DSSSD allow a zero order position determination of the heavy ion implantation.
7.6.2 Results with the Logarithmic MPR-32 mesytec
Preamplifier
Figure 7.20: Measured energy spectra (10MeV range for the linear part of the logarithmicMPR-32 preamplifier) obtained by x-strips (front junction) of DSSSD-2243-5 for the im-plantation of 136Xe ions. The double hump structure is related to the stopping of the heavyions.
The logarithmic MPR-32 preamplifier is well suited for both the electron measurement(MeV range) and the heavy ion implantation (GeV range). A collection of the measuredpreamplifier (logarithmic MPR-32) signals and amplifier (STM-16) signals can be found inAppendix B.7 and B.8, respectively. The measured energy spectra (10MeV range settingfor the linear part of the logarithmic preamplifier) obtained by x-strips (front junction) ofDSSSD-2243-5 are shown in fig. 7.20 for the implantation of 136Xe ions. They show a similardistribution at low energy (<10MeV), as compared to the linear MPR-32, and a pronounceddouble hump structure in the logarithmic part of the spectrum.

106 CHAPTER 7. ACTIVE STOPPER
The double hump structure, which relates to the implantation of the 136Xe ions, wasaligned for each strip and the strip multiplicity for the highest peak was determined. Fig. 7.21shows the multiplicity distribution for the heavy ion implantation. In most cases only one ortwo strips on the x- and y-side of DSSSD were activated. It turns out that the highest peakof the double hump structure is related to the implantation, while the second highest peak isinterpreted as a cross talk event with the neighbouring strip. The result of the double humpanalysis is also displayed in fig. 7.21 showing the hit pattern of the multiplicity 2 events. In90% of all cases the second highest peak is in a neighbouring strip.
Figure 7.21: Multiplicity distribution for the higher peak of the double hump structure (left).The black distribution shows the result for all x-strips of DSSSD-2243-5, while for the redone strip=1 was removed, which seemed to be very noisy. The right diagram shows the hitpattern relative to the strip with the highest peak for multiplicity 2 events. In 90% of allcases the second highest peak is in a neighbouring strip.
Figure 7.22: Position correlation between the multiwire detector MW and the DSSSD-2243-5.In case of the DSSSD the position of the implanted 136Xe ion was determined from the meanof highest peak, when a logarithmic MPR-32 preamplifier was used. The left correlationincludes all strips, while for the right one a single noisy strip was removed.
In case of the logarithmic MPR-32 preamplifier the mean of the highest peak of the

7.7. EXPERIMENTS WITH ACTIVE STOPPER 107
double hump structure was used for the position determination. In fig. 7.22 the positioncorrelation between the DSSSD and the multiwire detector MW is displayed. It shows astrong correlation but also an offset since the DSSSD was not accurately centred in theframe of the FRS. In conclusion, the logarithmic MPR-32 preamplifier is recommended tobe used for the active stopper measurements.
7.7 Experiments with Active Stopper
The following RISING experiments have made use of the newly developed active stopper.They will be briefly summarized in the following:
1. P. H. Regan et al. -First results with the RISING active stopper [67].This paper outlines some of the physics opportunities available with the GSI RIS-ING active stopper and presents preliminary results from an experiment aimed atperforming beta-delayed gamma-ray spectroscopic studies in heavy-neutron-rich nu-clei produced following the projectile fragmentation of a 1 GeV per nucleon 208Pbprimary beam. The energy response of the silicon active stopping detector for bothheavy secondary fragments and beta-particles is demonstrated and preliminary resultson the decays of neutron-rich Tantalum (Ta) to Tungsten (W) isotopes are presented asexamples of the potential of this technique to allow new structural studies in hithertoexperimentally unreachable heavy, neutron-rich nuclei. The resulting spectral informa-tion inferred from excited states in the tungsten daughter nuclei are compared withresults from axially symmetric HartreeFock calculations of the nuclear shape and sug-gest a change in ground state structure for the N = 116 isotone 190W compared to thelighter isotopes of this element.
2. N. Alkhomashi et al. - β−-delayed spectroscopy of neutron-rich tantalumnuclei: Shape evolution in neutron-rich tungsten isotopes [68].The low-lying structure of 188,190,192W has been studied following β decays of theneutron-rich mother nuclei 188,190,192Ta produced following the projectile fragmenta-tion of a 1-GeV-per-nucleon 208Pb primary beam on a natural beryllium target at theGSI Fragment Separator. The β-decay half-lives of 188Ta, 190Ta, and 192Ta have beenmeasured, with γ -ray decays of low-lying states in their respective W daughter nuclei,using heavy-ion β-γ correlations and a position-sensitive silicon detector setup. Thedata provide information on the low-lying excited states in 188W, 190W, and 192W,which highlight a change in nuclear shape at 190W compared with that of lighter Wisotopes. This evolution of ground-state structure along the W isotopic chain is dis-cussed as evidence for a possible proton subshell effect for the A ∼190 region and isconsistent with maximization of the γ-softness of the nuclear potential around N ∼116.

108 CHAPTER 7. ACTIVE STOPPER
3. Zs.Podolyak et al. - Proton-hole excitation in the closed shell nucleus 205Au [69].The neutron-rich N = 126 nucleus 205Au has been populated following the relativisticenergy projectile fragmentation of E/A = 1 GeV 208Pb, and studied via charged-particle decay spectroscopy. An internal decay with a transition energy of 907(5) keVand a half-life of T 1
2
= 6(2) s has been identified through the observation of the corre-
sponding K and L internal conversion electron lines (see fig. 7.23). The 907 keV energylevel corresponds to the π h−1
11/2 proton-hole state and decays both internally into the π
d−13/2 ground-state and via β-decay into 205Hg. The obtained data provides information
on the evolution of single-proton hole energies which are vital inputs of shell modeldescriptions for nuclei around the 208
82 Pb126 doubly magic core.
Figure 7.23: Delayed charged particle spectrum associated to 205Au. In addition to the con-tinuous energy of the β-decay, two peaks are observed. These are interpreted as K and Linternal conversion electron peaks corresponding to a 907(5) keV transi-tion.
4. P.H.Regan et al. - New insights into the structure of exotic nuclei using theRISING active stopper [70].This conference paper outlines the operation and some of the preliminary physicsresults using the GSI RISING active stopper. Data are presented from an experimentusing combined isomer and beta-delayed gamma-ray spectroscopy to study low-lyingspectral and decay properties of heavy-neutron-rich nuclei around A∼190 producedfollowing the relativistic projectile fragmentation of 208Pb primary beam. The responseof the RISING active stopper detector is demonstrated for both the implantation ofheavy secondary fragments and in-situ decay of beta-particles. Beta-delayed gamma-ray spectroscopy following decays of the neutron- rich 194Re isotopes is presented todemonstrate the experimental performance of the set-up. The resulting information

7.7. EXPERIMENTS WITH ACTIVE STOPPER 109
inferred from excited states in the W and Os daughter nuclei are compared with resultsfrom Skyrme Hartree-Fock predictions of the evolution of nuclear shape.
5. A.I. Morales et al. - β-delayed γ-ray spectroscopy of heavy neutron richnuclei south of lead [71].Relativistic projectile fragmentation of a 208Pb primary beam has been used to produceneutron-rich nuclei with proton-holes relative to the Z = 82 shell closure, i.e., southof Pb. β-delayed γ-ray spectroscopy allows to investigate the structural properties ofsuch nuclei with A 195 205. The current work presents transitions de-exciting excitedstates in 204Au, which are the first spectroscopic information on this N = 125 isotone.

Chapter 8
Summary and Outlook
Two Coulomb excitation experiments on stable Sn isotopes 112Sn and 114Sn were carried outat Inter University Accelerator Centre (India) and at GSI Helmholtzzentrum (Germany),respectively. It was concluded that the measured B(E2; 0+
g.s. → 2+1 ) values 0.242(8)e2b2
and 0.232(8)e2b2 of 112Sn and 114Sn are significantly larger than what is expected from theshell-model calculations based on the effective interaction outside the 100Sn and 90Zr core.For the Sn isotopic chain one expects a parabolic behaviour of B(E2) values as a functionof mass number that peaks at midshell for 116Sn and falls off thereafter towards doubly-magic 100Sn and 132Sn. The experimental B(E2) values, on the neutron-rich side follow thetheoretical predictions. However, for the lighter Sn isotopes one observes an enhancement ofthe electromagnetic transition propabilities. This is clearly seen from the measured B(E2)value of 112Sn which is 20% larger than 120Sn. Both B(E2) values of 112Sn and 114Sn show thisunexpected increase. The large scale shell model fails to describe the B(E2) systematics forthe Sn isotopes but the relativistic quasi particle random phase approximation predicts thistrend qualitatively. These two experiments clearly demonstrated the need for stable beamfacilities to measure very accurate data which helps in solving the open questions in nuclearphysics field.
In near future (2010) the B(E2; 0+g.s. → 2+
1 ) value of 104Sn will be measured in relativisticCoulomb excitation at GSI. This experimental technique was especially developed to performmeasurements with low intensities but using rather thick targets of approximatly 0.4g/cm2.
For decay experiments an active stopper detctor was developed for the RISING projectat GSI in order to study β-decay and conversion electron spectroscopy following projectilefragmentation/fission reactions. This system employs six double sided silicon strip detectorsin the final focal plane of the GSI FRagment Separator (FRS) to detect both the fragmentimplantations and their subsequent β-decays. It has a very high efficiency for β-particles dueto the low detection threshold of 150keV. The obtained excellent energy resolution of 20keVwas used in some experiments for conversion electron spectroscopy.
110

111
In future the active stopper detector will be replaced by Advanced Implantation DetectorArray (AIDA), which is part of Nuclear STructure, Astrophysics and Reactions (NUSTAR)project [73, 74] at Facility of Antiproton and Ion Research (FAIR) [75]. Fourteen countriesacross the globe are participating in the FAIR project including INDIA. AIDA will be usedfor implantation-decay experiments in which charged particle decays with energies fromtens of keV to MeV are measured. AIDA will also consist of large area double-sided siliconstrip detector (DSSSD) which is schematically illustrated in fig. 8.1. It will be operated inconjuction with other detection systems, such as gamma-ray and neutron detector arrays.The aim is to acheive this within microseconds of multi-GeV exotic ion implants.
Figure 8.1: Schematic picture of detector assembly for AIDA

Appendix A
Analysis and Results
A.1 Generating Clover PPAC Time Difference
Spectrum
1. Reject multi-hit events in PPAC
2. Reject zero events in Clover 2 TAC
3. Generate Clover-2 add-back energy spectrum (with energy gate?)
4. Copy ADC42 to ADC16 (to put Clover time before PPAC time)
5. Define TDC command between ADC16-36
6. ⋆New TAC is between Clover-2 (any segment) any of the PPAC detectors (ADC17-36)
7. Project this TAC with different Clover-2 energies
⋆ For getting the best time resolution, the centroids for each of the gamma-PPAC spectraare first matched for instrumental delays. To avoid variations in the timings for individualclover segments, TAC spectra were gated by individual Clover segments. The timing spreadsbetween individual Clover segments were ns for 1 MeV gamma rays To simplify centroidmatching, a condition of non-zero delayline signal was incorporated to eliminate the left-sidepeak associated with the detection of Sn-particles.
112
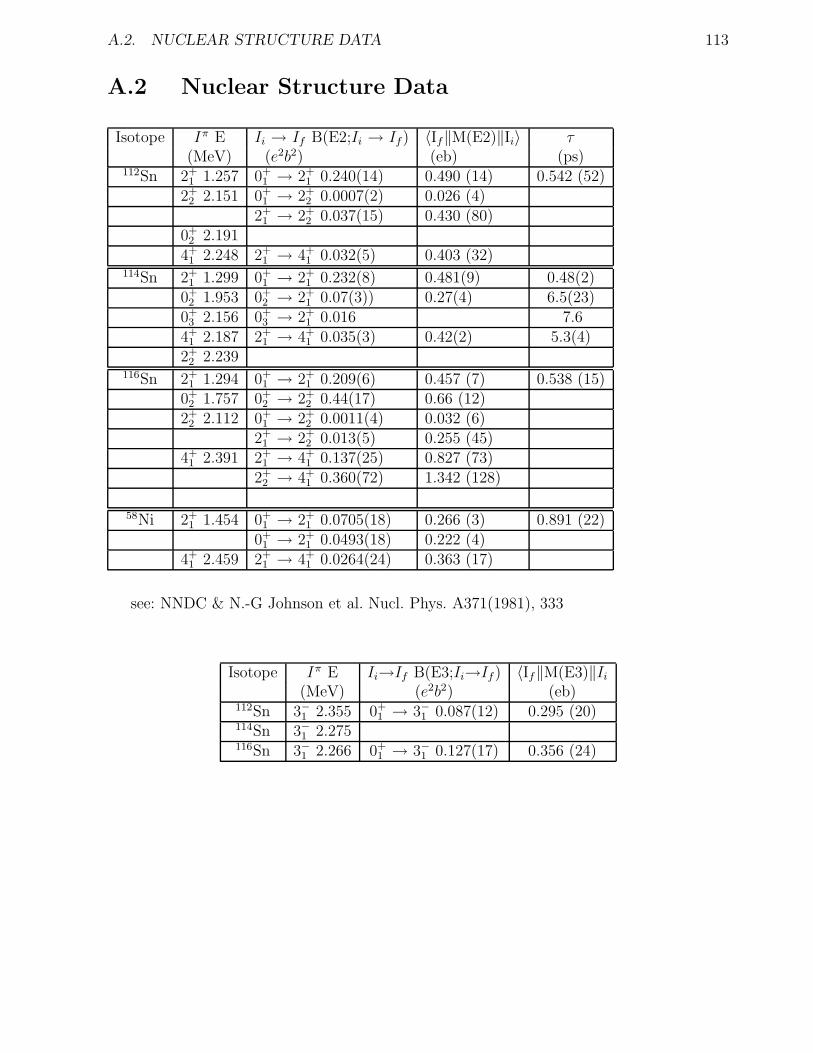
A.2. NUCLEAR STRUCTURE DATA 113
A.2 Nuclear Structure Data
Isotope Iπ E Ii → If B(E2;Ii → If) 〈If‖M(E2)‖Ii〉 τ(MeV) (e2b2) (eb) (ps)
112Sn 2+1 1.257 0+
1 → 2+1 0.240(14) 0.490 (14) 0.542 (52)
2+2 2.151 0+
1 → 2+2 0.0007(2) 0.026 (4)
2+1 → 2+
2 0.037(15) 0.430 (80)0+
2 2.1914+
1 2.248 2+1 → 4+
1 0.032(5) 0.403 (32)114Sn 2+
1 1.299 0+1 → 2+
1 0.232(8) 0.481(9) 0.48(2)0+
2 1.953 0+2 → 2+
1 0.07(3)) 0.27(4) 6.5(23)0+
3 2.156 0+3 → 2+
1 0.016 7.64+
1 2.187 2+1 → 4+
1 0.035(3) 0.42(2) 5.3(4)2+
2 2.239116Sn 2+
1 1.294 0+1 → 2+
1 0.209(6) 0.457 (7) 0.538 (15)0+
2 1.757 0+2 → 2+
2 0.44(17) 0.66 (12)2+
2 2.112 0+1 → 2+
2 0.0011(4) 0.032 (6)2+
1 → 2+2 0.013(5) 0.255 (45)
4+1 2.391 2+
1 → 4+1 0.137(25) 0.827 (73)
2+2 → 4+
1 0.360(72) 1.342 (128)
58Ni 2+1 1.454 0+
1 → 2+1 0.0705(18) 0.266 (3) 0.891 (22)
0+1 → 2+
1 0.0493(18) 0.222 (4)4+
1 2.459 2+1 → 4+
1 0.0264(24) 0.363 (17)
see: NNDC & N.-G Johnson et al. Nucl. Phys. A371(1981), 333
Isotope Iπ E Ii→If B(E3;Ii→If) 〈If‖M(E3)‖Ii(MeV) (e2b2) (eb)
112Sn 3−1 2.355 0+1 → 3−1 0.087(12) 0.295 (20)
114Sn 3−1 2.275116Sn 3−1 2.266 0+
1 → 3−1 0.127(17) 0.356 (24)

114 APPENDIX A. ANALYSIS AND RESULTS
A.3 Doppler Correction
A.3.1 Details of 58Ni measured with PPAC, 58Ni excited
58Ni → 112Sn, E=175MeV, ϑp=32.3, ϑγ=147, ϕγ=143.2
vcm = 0.04634 ·(
1 + A2
A1
)−1√
Elab
A1
vcm = 0.02746
θcm = ϑ1 + arcsin
(
A1
A2· sinϑ1
)
= 48.4
v1 = vcm·[
1+
(
A2
A1
)2
+ 2·(
A2
A1
)
· cosθcm
]1
2
v1 = 0.07417
cosϑγ1 = cosϑγ ·cosϑ1+sinϑγ ·sinϑ1 ·cos(ϕγ−ϕ1)
cos(ϕγ − ϕ1) = cosϕγ · cosϕ1 + sinϕγ · sinϕ1
Eγ0
Eγ= 1−v1·cosϑγ1√
1−v21
ϕ1[] cosϑγ1 Eγ=E
minγ [keV]
9 -0.9118 135827 -0.8374 136545 -0.7504 137463 -0.6594 138281 -0.5732 139199 -0.5003 1398117 -0.4478 1403135 -0.4208 1406153 -0.4221 1406171 -0.4515 1403189 -0.5060 1398207 -0.5804 1390225 -0.6674 1382243 -0.7584 1373261 -0.8446 1365279 -0.9175 1358297 -0.9700 1353315 -0.9969 1350333 -0.9957 1350351 -0.9663 1353
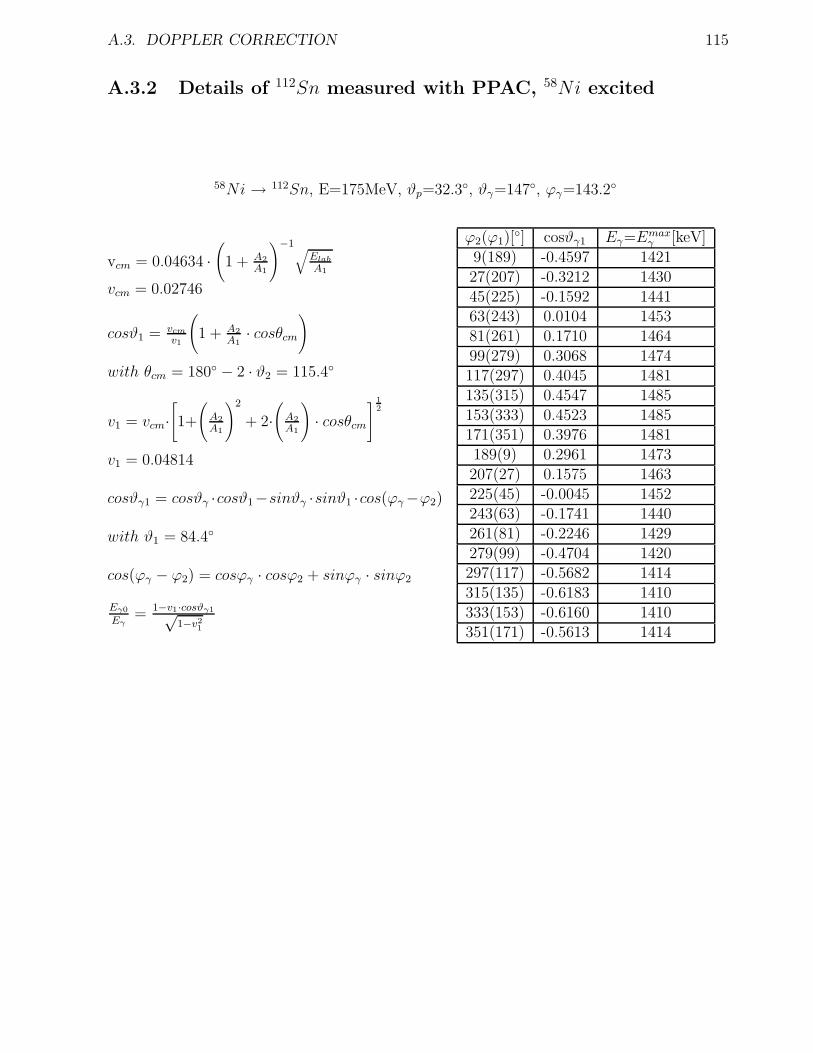
A.3. DOPPLER CORRECTION 115
A.3.2 Details of 112Sn measured with PPAC, 58Ni excited
58Ni → 112Sn, E=175MeV, ϑp=32.3, ϑγ=147, ϕγ=143.2
vcm = 0.04634 ·(
1 + A2
A1
)−1√
Elab
A1
vcm = 0.02746
cosϑ1 = vcm
v1
(
1 + A2
A1· cosθcm
)
with θcm = 180 − 2 · ϑ2 = 115.4
v1 = vcm·[
1+
(
A2
A1
)2
+ 2·(
A2
A1
)
· cosθcm
]1
2
v1 = 0.04814
cosϑγ1 = cosϑγ ·cosϑ1−sinϑγ ·sinϑ1 ·cos(ϕγ−ϕ2)
with ϑ1 = 84.4
cos(ϕγ − ϕ2) = cosϕγ · cosϕ2 + sinϕγ · sinϕ2
Eγ0
Eγ= 1−v1·cosϑγ1√
1−v21
ϕ2(ϕ1)[] cosϑγ1 Eγ=E
maxγ [keV]
9(189) -0.4597 142127(207) -0.3212 143045(225) -0.1592 144163(243) 0.0104 145381(261) 0.1710 146499(279) 0.3068 1474117(297) 0.4045 1481135(315) 0.4547 1485153(333) 0.4523 1485171(351) 0.3976 1481189(9) 0.2961 1473207(27) 0.1575 1463225(45) -0.0045 1452243(63) -0.1741 1440261(81) -0.2246 1429279(99) -0.4704 1420297(117) -0.5682 1414315(135) -0.6183 1410333(153) -0.6160 1410351(171) -0.5613 1414

116 APPENDIX A. ANALYSIS AND RESULTS
A.3.3 Details of 112Sn measured with PPAC, 112Sn excited
58Ni → 112Sn, E=175MeV, ϑp=32.3, ϑγ=147, ϕγ=143.2
vcm = 0.04634 ·(
1 + A2
A1
)−1√
Elab
A1
vcm = 0.02746
v2 = 2 · vcm · cosϑ2 = 0.04643
cosϑγ2 = cosϑγ ·cosϑ2+sinϑγ ·sinϑ2 ·cos(ϕγ−ϕ2)
cos(ϕγ − ϕ2) = cosϕγ · cosϕ2 + sinϕγ · sinϕ2
Eγ0
Eγ= 1−v2·cosϑγ2√
1−v22
ϕ2[] cosϑγ2 Eγ=E
minγ [keV]
9 -0.9118 120527 -0.8374 120945 -0.7504 121363 -0.6594 121881 -0.5732 122399 -0.5003 1227117 -0.4478 1230135 -0.4208 1232153 -0.4221 1232171 -0.4515 1230189 -0.5060 1227207 -0.5804 1223225 -0.6674 1218243 -0.7584 1213261 -0.8446 1208279 -0.9175 1204297 -0.9700 1202315 -0.9969 1200333 -0.9957 1200351 -0.9663 1202

A.3. DOPPLER CORRECTION 117
A.3.4 Details of 58Ni measured with PPAC, 112Sn excited
58Ni → 112Sn, E=175MeV, ϑp=32.3, ϑγ=147, ϕγ=143.2
vcm = 0.04634 ·(
1 + A2
A1
)−1√
Elab
A1
vcm = 0.02746
ϑ2 = 0.5 · (180 − θcm)
with θcm = ϑ1 + arcsin
(
A1
A2· sinϑ1
)
= 48.4
v2 = 2 · vcm · cosϑ2 = 0.02250
with ϑ2 = 65.8
cosϑγ2 = cosϑγ ·cosϑ2−sinϑγ ·sinϑ2 ·cos(ϕγ−ϕ1)
cos(ϕγ − ϕ2) = cosϕγ · cosϕ2 + sinϕγ · sinϕ1
Eγ0
Eγ= 1−v2·cosϑγ2√
1−v22
ϕ1(ϕ2)[] cosϑγ2 Eγ=E
maxγ [keV]
9(189) 0.0025 125727(207) -0.1245 125345(225) -0.2729 124963(243) -0.4283 124581(261) -0.5755 124199(279) -0.6999 1237117(297) -0.7895 1235135(315) -0.8355 1233153(333) -0.8333 1234171(351) -0.7832 1235189(9) -0.6901 1237207(27) -0.5631 1241225(45) -0.4146 1245243(63) -0.2592 1249261(81) -0.1121 1254279(99) 0.0124 1257297(117) 0.1019 1260315(135) 0.1479 1261333(153) 0.1457 1261351(171) 0.0956 1259

118 APPENDIX A. ANALYSIS AND RESULTS
A.4 Range Energy Table for Sn on Sn
================================================Calculation using SRIM-2006 SRIM version — SRIM-2008.04
Calc. date — March 14, 2009=================================================
Disk File = SRIM Outputs (Tin in Tin) Ion = Tin [50] , Mass = 119.902 amuTarget Density = 7.2816E+00 g/cm3 = 3.6939E+22 atoms/cm3
=============Target Composition========AtomName =Sn AtomNumber=50 Atomic Percent=100.00 Mass Percent=100
========================================Bragg Correction = 0.00% Stopping Units = MeV /(mg/cm2)
See bottom of Table for other Stopping units
Ion dE/dx dE/dx Projected Longitudinal LateralEnergy Elec. Nuclear Range Straggling Straggling
1.00 MeV 1.118E+00 3.234E+00 2357 A 1001 A 698 A1.10 MeV 1.182E+00 3.151E+00 2600 A 1088 A 761 A1.20 MeV 1.242E+00 3.071E+00 2846 A 1173 A 823 A1.30 MeV 1.297E+00 2.996E+00 3095 A 1258 A 886 A1.40 MeV 1.348E+00 2.924E+00 3347 A 1342 A 949 A1.50 MeV 1.397E+00 2.857E+00 3601 A 1425 A 1011 A1.60 MeV 1.442E+00 2.792E+00 3857 A 1507 A 1074 A1.70 MeV 1.486E+00 2.731E+00 4116 A 1589 A 1137 A1.80 MeV 1.529E+00 2.673E+00 4376 A 1670 A 1200 A2.00 MeV 1.611E+00 2.565E+00 4904 A 1830 A 1326 A2.25 MeV 1.709E+00 2.444E+00 5572 A 2025 A 1485 A2.50 MeV 1.807E+00 2.335E+00 6249 A 2216 A 1644 A2.75 MeV 1.906E+00 2.237E+00 6931 A 2401 A 1802 A3.00 MeV 2.005E+00 2.149E+00 7616 A 2580 A 1961 A3.25 MeV 2.107E+00 2.068E+00 8302 A 2754 A 2118 A3.50 MeV 2.211E+00 1.994E+00 8988 A 2922 A 2273 A3.75 MeV 2.317E+00 1.926E+00 9672 A 3084 A 2427 A4.00 MeV 2.426E+00 1.863E+00 1.04 um 3239 A 2579 A4.50 MeV 2.650E+00 1.751E+00 1.17 um 3533 A 2876 A5.00 MeV 2.881E+00 1.654E+00 1.30 um 3804 A 3162 A

A.4. RANGE ENERGY TABLE FOR SN ON SN 119
Ion dE/dx dE/dx Projected Longitudinal LateralEnergy Elec. Nuclear Range Straggling Straggling
5.50 MeV 3.118E+00 1.569E+00 1.43 um 4053 A 3435 A6.00 MeV 3.361E+00 1.493E+00 1.56 um 4282 A 3695 A6.50 MeV 3.606E+00 1.425E+00 1.68 um 4491 A 3942 A7.00 MeV 3.854E+00 1.364E+00 1.80 um 4683 A 4175 A8.00 MeV 4.352E+00 1.259E+00 2.02 um 5026 A 4605 A9.00 MeV 4.847E+00 1.171E+00 2.23 um 5317 A 4990 A10.00 MeV 5.334E+00 1.096E+00 2.43 um 5566 A 5333 A11.00 MeV 5.809E+00 1.031E+00 2.62 um 5782 A 5642 A12.00 MeV 6.270E+00 9.741E-01 2.80 um 5971 A 5921 A13.00 MeV 6.715E+00 9.242E-01 2.97 um 6137 A 6174 A14.00 MeV 7.144E+00 8.797E-01 3.13 um 6285 A 6405 A15.00 MeV 7.556E+00 8.399E-01 3.29 um 6417 A 6616 A16.00 MeV 7.953E+00 8.040E-01 3.44 um 6536 A 6810 A17.00 MeV 8.334E+00 7.714E-01 3.58 um 6643 A 6990 A18.00 MeV 8.700E+00 7.416E-01 3.72 um 6742 A 7157 A20.00 MeV 9.391E+00 6.893E-01 3.99 um 6919 A 7458 A22.50 MeV 1.018E+01 6.345E-01 4.30 um 7108 A 7785 A25.00 MeV 1.091E+01 5.886E-01 4.60 um 7267 A 8068 A27.50 MeV 1.158E+01 5.496E-01 4.88 um 7404 A 8317 A30.00 MeV 1.220E+01 5.160E-01 5.15 um 7523 A 8540 A32.50 MeV 1.278E+01 4.866E-01 5.40 um 7628 A 8740 A35.00 MeV 1.333E+01 4.608E-01 5.65 um 7721 A 8921 A37.50 MeV 1.385E+01 4.378E-01 5.89 um 7805 A 9087 A40.00 MeV 1.435E+01 4.173E-01 6.12 um 7881 A 9240 A
Multiply Stopping by for Stopping Units——————- ——————7.2814E+01 eV / Angstrom7.2814E+02 keV / micron7.2814E+02 MeV / mm1.0000E+00 keV / (ug/cm2)1.0000E+00 MeV / (mg/cm2)1.0000E+03 keV / (mg/cm2)1.9712E+02 eV / (1E15 atoms/cm2)9.6617E-02 L.S.S. reduced units=====================================================(C) 1984,1989,1992,1998,2008 by J.P. Biersack and J.F. Ziegler

120 APPENDIX A. ANALYSIS AND RESULTS
A.5 Input for Coulomb Excitation (lell30e1.f)
datacard# parameter input description1 NMAX number of nuclear states2 NCM index of level for which the lab-transformation is done3 NTIME -4 XIMAX largest number for ξ-parameter5 EMMAXI largest magnetic quantum number considered6 ACCUR absolute accuracy to which the final probabilities
should be computedQPAR effect of the giant dipole resonance
7 OUXI print-out of ξ-matrix8 OUPSI print-out of ψ-matrix9 OUAMP print-out of excitation amplitudes10 OUPROW print-out of excitation probability during integration11 OUANG0 print-out of angular distribution coefficients α0
12 OUANG1 print-out of angular distribution coefficients α1
13 OUANG2 print-out of angular distribution coefficients α2
14 OUANG3 print-out of angular distribution coefficients α3
15 NCORR16 INTERV number of integration steps17 Z1 charge number of the projectile
A1 mass of projectile [amu]18 Z2 charge number of the target nucleus
A2 mass of target nucleus [amu]19 EP laboratory energy of projectile [MeV]20 TLBDG deflection angle [degree] in the lab-system21 THETA deflection angle [degree] in the cm-system22 N index of level

A.6. INPUT FOR ANGULAR DISTRIBUTION (ANGGRO.F) 121
datacard# parameter input descriptionSPIN(N) spin quantum number of the Nth nuclear stateEN(N) excitation energy of the Nth nuclear stateIPAR(N) parity (-1 neg, 1 pos) of the Nth nuclear state
23 N index of levelM index of level (M≥N)ME(N,M,LA) electric matrix elementLA multipolarity (1≤LA≤6)
0 starts the calculation500 stops the calculation
A.6 Input for Angular Distribution (anggro.f)
datacard# parameter input description1 I11 output of the conversion coefficients (E2,M1,E1,E3)
I12 possible decays of a stateI13 HN (lifetime of the state)I14 GK(N,M)I15 FK(N,M)I16 α3(k,κ)+feedingI17 Spin(N),Spin(M),W(N,K)I18 Spin(N),Spin(M),DS(N,K)I19 γ-ray angular distribution θγ=0,180,5,φγ=0 and 180
I20 -I21 excitation probabilities, cross sections, α3(k,κ)I22 1 ≡ solid angle correction, 2 ≡ +deorientation, 3 ≡ +SBI23 input M1-matrix element + M1 conversion coefficientI24 1 ≡ calc. in rest system, 1 input of θγ, φγ in rest systemI25 projectile excitation

122 APPENDIX A. ANALYSIS AND RESULTS
datacard# parameter input description2 NCCK number of values given for K-conversion
NCCL number of values given for L-conversionNCCM number of values given for M-conversion
3-5 CCE1 lowest tabulated energy to be interpolated, -1.0 for L,MCCE2 lowest tabulated energy of the K, L2, M5 subshellCCMIN min. energy given in the conversion tableCCMAX max. energy given in the conversion table
61− αK ,I=1,NCCK conversion coefficients (K-shell)71− αL,I=1,NCCL conversion coefficients (L-shell)81− αM ,I=1,NCCM conversion coefficients (M-shell)9 IXYZ I23=1 IXYZ=initial state
JXYZ I23=1 JXYZ=final stateMM1(1XYZ,JXYZ) I23=1 M1-matrix element (IXYZJXYZ)
10 TT θγ
VGAMMA φγ
VI1 φ1
VI2 φγ
K1LAB state for cm to lab transformation11 Q0, Q2, Q4 I22=1 solid angle correction for Ge-detector
I22=2, I22=3, I22=4, I22=5 (see program)12 MZahl number of theta integrations
NORM normalization, neg. value Rutherford13 XA initial scattering angle in cm system for integration
XE final scattering angle in cm system for integration

A.7. IMPORTANT FORMULAS 123
A.7 Important Formulas
nuclear lifetime:
τ [S] =
∑
M
∑
L
δ2N→M(L) · [1 + αN→M(L)]
−1
(A.1)
withδ2N→M(E2)[s−1] = 1.225 · 1013 · Eγ[MeV ]5 ·B(E2; IN → IM)[e2b2] (A.2)
δ2N→M(M1)[s−1] = 1.758 · 1013 · Eγ[MeV ]3 · B(M1; IN → IM)
[
eh
2mpc
]2
(A.3)
δ2N→M(E1)[s−1] = 1.590 · 1017 · Eγ [MeV ]3 · B(E1; IN → IM)[eb] (A.4)
δ2N→M(E3)[s−1] = 5.709 · 108 · Eγ [MeV ]7 · B(E3; IN → IM)[e3b3] (A.5)
relation between B(E2) values:
B(EL; IN → IM) =2 · IM + 1
2 · IN + 1·B(EL; IM → IN) (A.6)
reduced matrix element
B(EL; IM → IN) =1
2 · IM + 1· 〈IN‖M(EL)‖IM〉2 (A.7)
Coulomb excitation cross section (single state excitation):
σE2 = 4.819·(
1+A1
A2
)−2
· A1
Z22
·(
EMeV −(
1+A1
A2
)
·EMeV
)
·B(E2; 0+ → 2+) ·fE2(ξ) (A.8)
with
ξ =Z1 · Z2 · A1
1
2 · E ′
MeV
12.65 · (EMeV − 0.5 · E ′
MeV )3
2
withE ′
MeV =
(
1 +A1
A2
)
.EMeV (A.9)

Appendix B
Active Stopper
B.1 mesytec Electronics
124

B.2. BLOCK DIAGRAM USING MESYTEC ELECTRONICS 125
B.2 Block Diagram using mesytec Electronics
B.3 Multi Channel Systems

126 APPENDIX B. ACTIVE STOPPER
B.4 Block Diagram using Multi Channel System

B.5. MAXIMUN INCIDENT ENERGY FOR HEAVY IONSIMPLANTED IN 0.5MM AND 1MM SILICON
B.5 Maximun Incident Energy for Heavy Ions
Implanted in 0.5mm and 1mm Silicon
Projectiles are implanted in 0.5mm (116.5 mg/cm2) and 1mm (233mg/cm2) silicon. Themaximum incident energy [Mev/u] is determined from the range tables of F.Hubertetal.Annales de Physiques 5 (1980),p.1 (open symbols) and from ranges calculated using theATIMA code (fullsymbol).
F.Hubert et al..
1.0mm Si:E=19.772+1.18791*Z-0.00606377*Z2
0.5mm Si:E=13.738+0.73188*Z-0.00417978*Z2
ATIMA
1.0mm Si:E=20.803+1.02507*Z-0.00611181*Z2
0.5mm Si:E=14.487+0.62831*Z-0.00411604*Z2

128 APPENDIX B. ACTIVE STOPPER
B.6 Pre-Amplifier Signals Measured with
MPR-32 (lin)
B.7 Pre-Amplifier Signals Measured with
MPR-32 (log)

B.8. AMPLIFIER SIGNALS MEASURED TOGETHER WITH MPR-32 (LOG) 129
B.8 Amplifier Signals Measured together with
MPR-32 (log)
B.9 Decay Scheme of 207Bi

Bibliography
[1] H.Grawe and M.Lewitowicz, Nucl. Phys. A693, 116 (2001).
[2] S. Raman, C. W. Nestor and P. Tikkanen,At. Data and Nucl. Data Tables 78, (2001) 1.
[3] R.F.Casten; Nuclear Structure from a Simple Prespective,Oxford Science publication (2000).
[4] M.Hjorth-Jensen et al Phys. Rep. 261 (1995), 124.
[5] I. Talmi, Nucl. Phys. A 172 (1971) 1.
[6] A. Banu et al., Phys. Rev. C 72, 061305(R) (2005).
[7] M.G.Mayer et al., Phys.Rev. 75 (1949), 1969
[8] Y.K.Gambhir et al., Phys.Rev. 188 (1969), 1573
[9] K.Allaart et al., Phys.Rep. 169 (1988), 209
[10] G.Racah et al., Phys.Rev. 61 (1942), 186
[11] G.Racah et al., Phys.Rev. 63 (1943), 367
[12] G.Racah et al., Phys.Rev. 85 (1952), 381
[13] B.H.Flowers et al., Proc.Roy.Soc. A 212 (1952), 248
[14] D.C.Radford et al., Nucl.Phys. A 752, 264c (2005)
[15] J.Cederkall et al., Phys.Rev.Lett. 98, 172501, (2007)
[16] A.Ekstrom et al., Phys.Rev.Lett. 101, 012502 (2008)
[17] C.T.Zhang et al., Phys.Rev. C 62 , 057305 (2000)
[18] R.Broda et al., Phys.Rev.Lett. 68,( 1992), 1671
[19] K.Alder and A. Winther, Coulomb Excitation, Academic Press,New York and London, 1966.
130

BIBLIOGRAPHY 131
[20] K.Alder and A. Winther Electromagnetic Excitation,North-Holland Publ. Comp., Amsterdam 1975.
[21] W.D.Myers, Nucl.Phys. A 204, (1973), 465.
[22] W.W.Wilcke et al., At. Data Nucl. Data Tables 25 (1980), 389.
[23] D.C.Camp and A.L. van Lehn; Nucl.instr.Meth 76 (1969), 192.
[24] A.Abragam and R.Pound, Phys.Rev.93 (1953), 943.
[25] P. Doornenbal et al., Phys. Rev. C 78, 031303(R)(2008).
[26] R.Kumar et al., Phys. Rev. C 81, 024306 (2010)
[27] http://www.gsi.de/portrait/index.html.
[28] http://www.iuac.ernet.in/indexlowers.html.
[29] H.Stelzer, Nucl.Phys. A 354, 433c(1981).
[30] H.Stelzer, Lecture notes in physics, Vol 178, Berlin, 25 (1983).
[31] Y.Kopach and H.J.Wollersheim;http://www-linux.gsi.de/ wolle/GSI-CLOVER/clover-yuri.pdf.
[32] L.C. Northcliffe and R.F. Schilling, Nucl. Data Tables bf A7, 233 (1970).
[33] S.Venkataramanan et al., Proc of DAE-BRNS Symp on Nucl. Phys. Vol 45B,424 (2002)
[34] S.Venkataramanan et al., Proc of DAE-BRNS Symp on Nucl. Phys. Vol 52, 149(2007)
[35] R.Kumar, P.Queiroz and H.J.Wollersheim,Testing of the NSC electronics Module with the GSI Clover Detector.http://www-linux.gsi.de/∼wolle/INDIA/INGA/SUMMER2005report-rakesh.pdf.
[36] R.K.Bhowmik, S.Muralithar and R.P.Singh, DAE Symp. on Nucl. Phys. Vol.44B,422 (2001).
[37] J.F. Ziegler, J.P. Biersack and U. Littmark, “The Stopping and Range of Ions inSolids”, Pergamon Press, New York, 1985.
[38] A. Winther and J. De Boer, A computer program for multiple Coulomb excitation,1965, in K. Alder and A. Winther, Coulomb Excitation, Academic Press, NewYork-London (1966).

132 BIBLIOGRAPHY
[39] P.Ring and P.Schuck; The Nuclear Many-Body Problem, Springer Verlag Heidel-berg (1980).
[40] K.Heyde, Basic Ideas and Concepts in Nuclear Physics, Institute of Physics Pub-lishing, Bristol and philadelphia, 2004.
[41] H.Yukawa; Proc. Phys. Math. Soc. Japan 17, 48 (1935).
[42] K.L.Heyde: The Nuclear Shell Model, 2nd ed. (Springer, Berlin Heidelberg 1994).
[43] B.Castel and I.S.Towner: Modern Theories of Nuclear Moments (Clarendon Press,Oxford 1990).
[44] S.E.Koonin, D.J.Dean and K.Langanke: Ann. Rev. Nucl. Part. Sci. 47, 463(1997).
[45] G.Neyens: Reports on Progress in Physics 66, 633 (2003):erratum p.1251.
[46] G.Neyens et al., Nucl.Phys. A 625, 668 (1997).
[47] K.Vyvey et al., Phys. Lett. B 538, 33 (2002).
[48] R.Machleidt, F.Sammarruca and Y.Song Phys. Rev C 53, 1483 (1996).
[49] E.Caurier and G.Martinez-Pinedo; Nucl.Phys. A 704, 60c (2002).
[50] J. Cederkall et al., Phys. Rev. Lett. 98, 172501 (2007).
[51] P.Ring; Prog.Part.Nucl.Phys. 37, 193 (1996).
[52] P.Ring et al., Nucl.Phys. A 694, 249 (2001).
[53] N.Paar et al., Phys. Rev. C 67, 034312 (2003).
[54] A. Ansari Phys. Lett. B 623, 37 (2005).
[55] A. Ansari and P. Ring, Phys. Rev. C 74, 054313 (2006).
[56] H.Geissel et al., Nucl. Instr. Meth. B 70, 286 (1992).
[57] M.Gorska et al., Acta. Phys. Pol. B 28, 1219 (2007).
[58] S.Pietri et al., Nucl. Instr. Meth. B 261, 1079 (2007).
[59] Micron Semiconductor ltd www.micronsemiconductor.co.uk.
[60] Mesytec www.mesytec.com.
[61] Multi Channel Systems www.multichannelsystems.com.

BIBLIOGRAPHY 133
[62] S.Agostinelli et al., Nucl. Instr. Meth. A 506, 250 (2003).
[63] S.Chauvie et al., in: Nuclear Science Symposium Conference Record, vol. 3,IEEE,New York, p.1881, 2004.
[64] C. Wrede et al., Nucl. Instr. Meth. B 204, 619 (2003).
[65] J.I. Prisciandaro et al., Nucl. Instr. Meth. A 505, 140 (2003).
[66] J. Elson, Pico Systems, 543 Lindeman Rd., Kirkwood, MO 63122,(314)[email protected] pico-systems.com/shapdisc.html.
[67] P. H. Regan et al. Int. Jour. of Mod. Phy. E Vol. 17, Supplement 8 (2008).
[68] N. Alkhomashi et al. Phys. Rev. C 80, 0643308 (2009).
[69] Zs. Podolyak et al. Physics. Letters. B 672, 116 (2009).
[70] P. H. Regan et al. AIP Conf. Proc. Volume 1090, 122 (2009).
[71] A.I. Morales et al. Acta. Phys. Pol. B 40, 867 (2009)
[72] Reiner Krucken (for the NuSTAR collaboration) J. Phys. G: Nucl. Part. Phys.31 S1807 (2005)
[73] www.gsi.de/nustar
[74] HISPEC/DESPEC technical proposal(www.gsi.de/fair/experiments/NUSTAR/Proposals.html)
[75] www.gsi.de/fair


![Gamma-ray spectroscopy I - GSIweb-docs.gsi.de/~wolle/TELEKOLLEG/KERN/PDF/Goergen/...Triaxial nuclei and wobbling spin E R (I,n w) [MeV] The wobbling mode is unique to nuclei with stable](https://img.pdfslide.us/doc/110x75/60f69838f24dc62b19115534/gamma-ray-spectroscopy-i-gsiweb-docsgsidewolletelekollegkernpdfgoergen.jpg)