Embed Size (px)
Citation preview
Nuclear receptor ligand-binding domains, looked at from all directions.
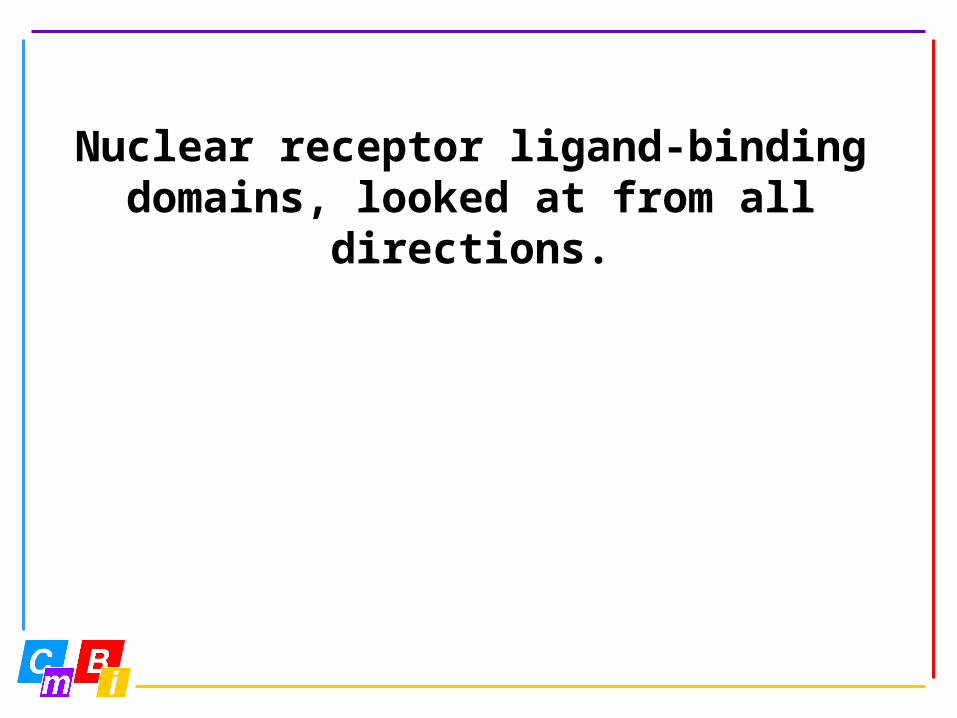
Nuclear receptor function
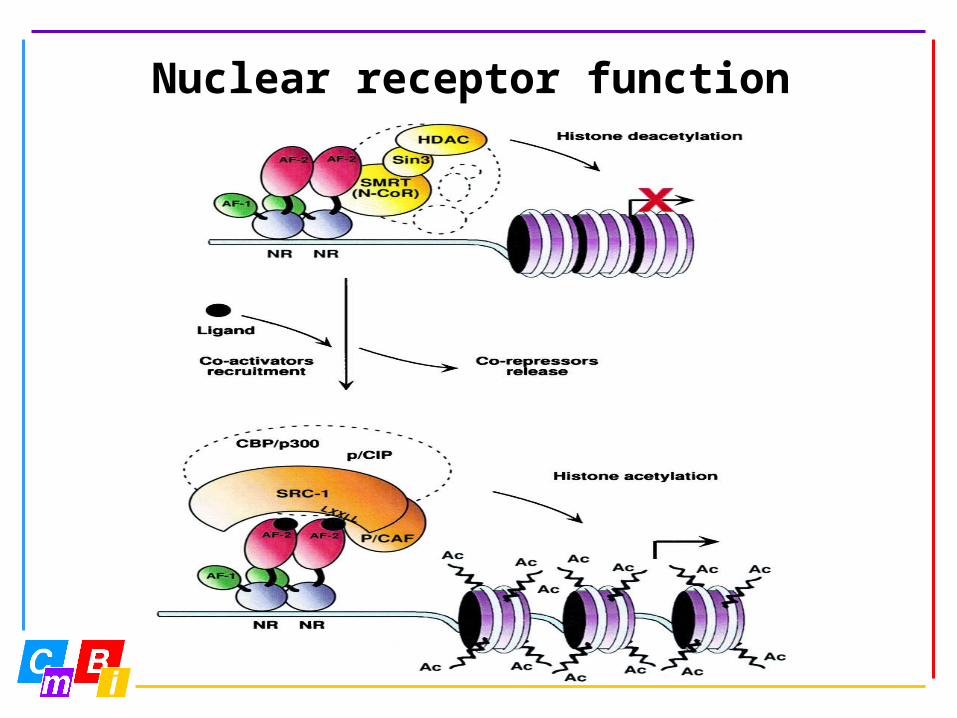
Nuclear receptor family
NR1C1-PPAR
NR1C2-PPAS
NR1C3-PPAT
NR1D1-EAR1NR1D2-BD73
NR1I3-MB67NR1I4-CAR1-MOUSE-
NR1H2-NER
NR1H3-LXR
NR1H4-FAR
NR4A2-NOT
NR4A3-NOR1
NR4A1-NGFINR2F1-COTF
NR2F2-ARP1
NR2F6-EAR2
NR2E3-PNR
NR2B1-RRXA NR2B2-RRXB
NR2A2-HN4G
NR3C1-GCRNR3C4-ANDR
NR3C3-PRGRNR3A1-ESTR
NR3A2-ERBT
NR3B1-ERR1
NR3B2-ERR2
NR5A1-SF1NR5A2-FTF
NR1I1-VDR
NR1B3-RRG1
NR2E1-TLXNR2C1-TR2-11
NR2C2-TR4
NR6A1-GCNF
NR2B3-RRXG
NR2A1-HNF4NR2A5-HN4
NR0B1-DAX1NR0B2-SHP NR3C2-MCR
NR1F3-RORG
NR1F2-RORBNR1F1-ROR1NR1A2-THB1
NR1A1-THA1NR1I2-PXR
NR1B2-RRB2 NR1B1-RRA1
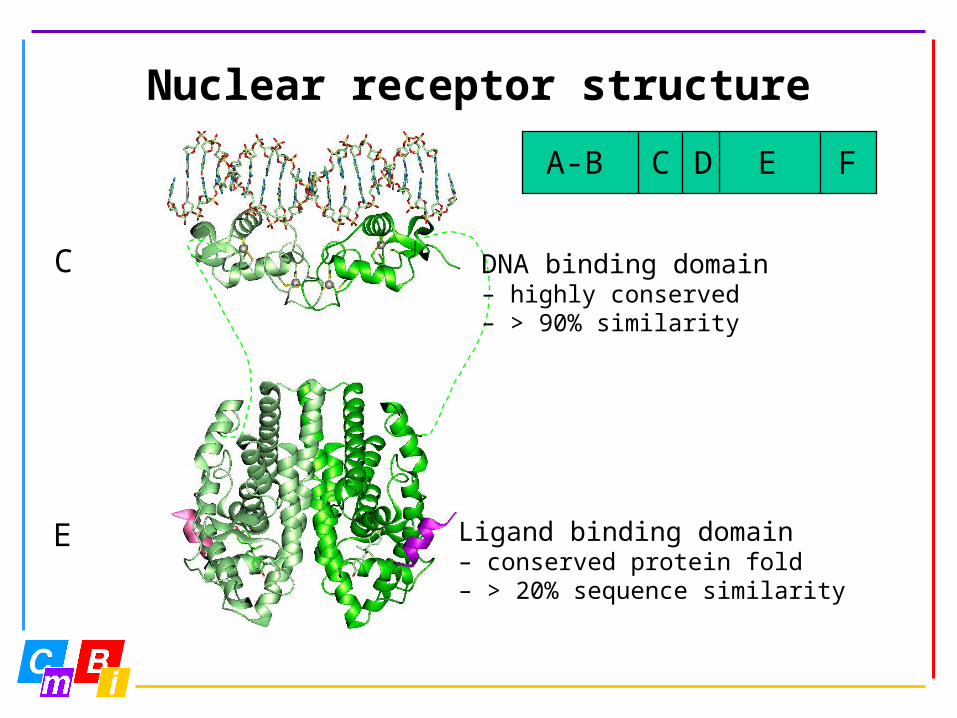
Nuclear receptor structure
A-B C D E F
Ligand binding domain– conserved protein fold– > 20% sequence similarity
DNA binding domain– highly conserved– > 90% similarity
C
E
AF-1 DNA LBD
The questions
As Organon is paying the bills, question one is, of course☺, how do ligands relate to activity?
NRs can bind co-activators and co-repressors, with or without ligand being present, so what are agonists, antagonists, and inverse agonists?
What is the role of each amino acid in the NR LBD?
Which data handling is needed to answer these questions?
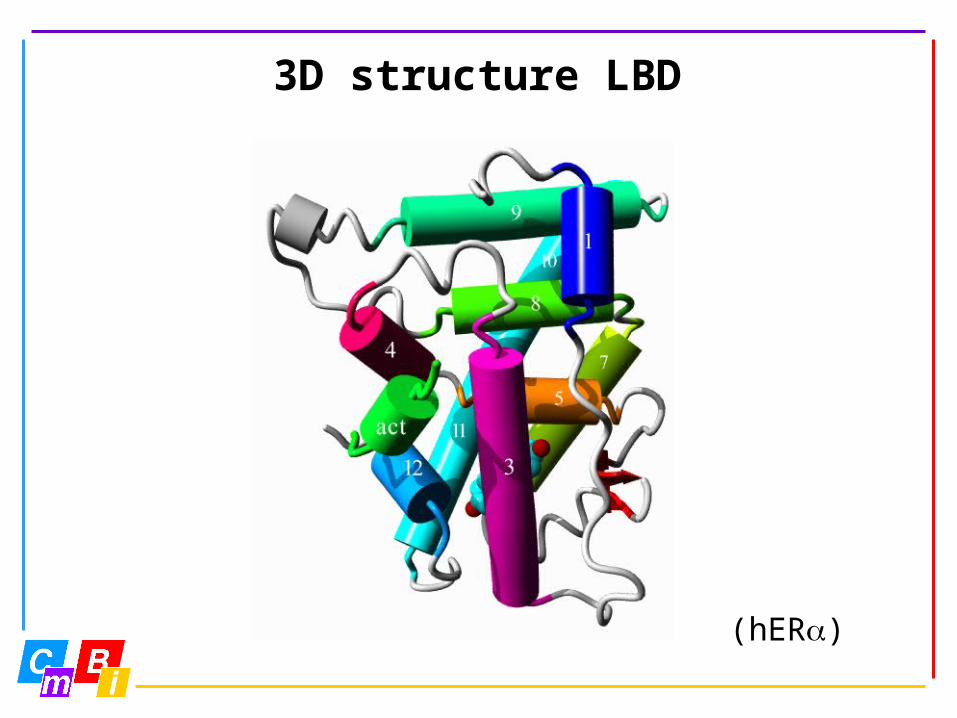
3D structure LBD
(hER)
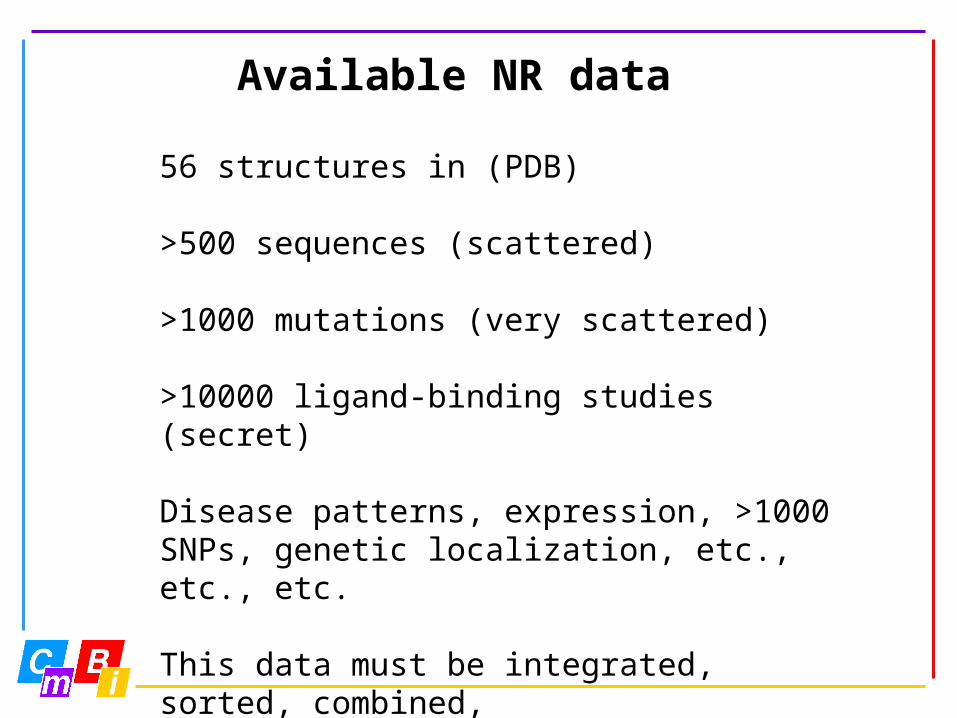
Available NR data
56 structures in (PDB)
>500 sequences (scattered)
>1000 mutations (very scattered)
>10000 ligand-binding studies (secret)
Disease patterns, expression, >1000 SNPs, genetic localization, etc., etc., etc.
This data must be integrated, sorted, combined,validated, understood, and used to answer our questions.
Step 1
The first important step is a common numbering scheme.
Whoever solves that problem once and for all should get three Nobel prices.
Large data volumes
Large data volumes allow us to develop new data analysis techniques.
Entropy-variability analysis is a novel technique to look at very large multiple sequence alignments.
Entropy-variability analysis requires ‘better’ alignments than routinely are obtained with ‘standard’ multiple sequence alignment programs.
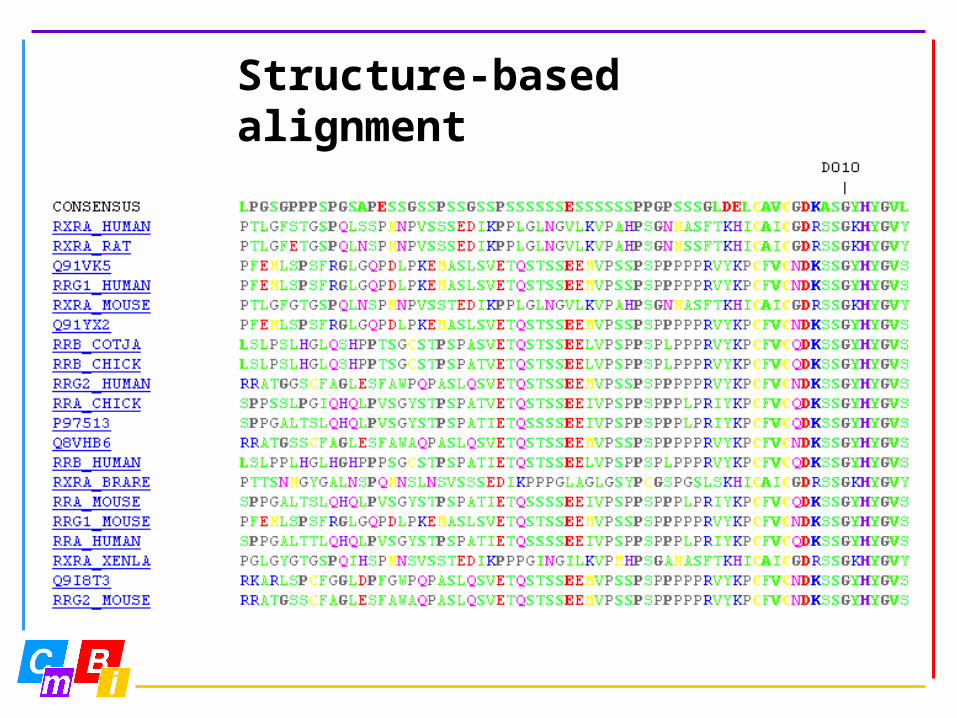
Structure-based alignment
Entropy
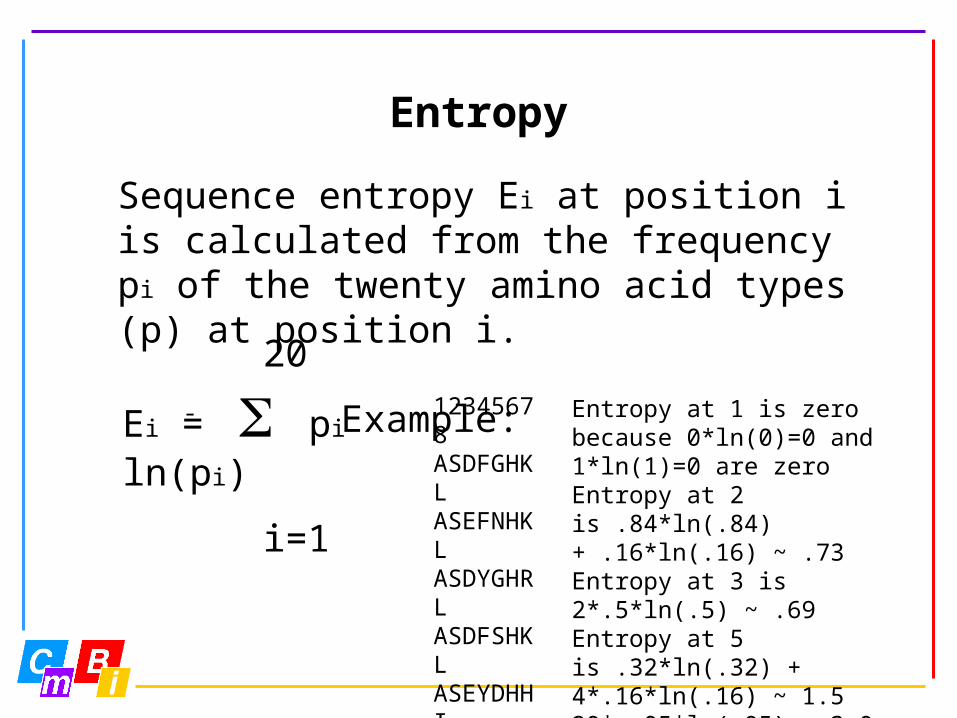
20
Ei = pi ln(pi)
i=1
Sequence entropy Ei at position i is calculated from the frequency pi of the twenty amino acid types (p) at position i. Example:
12345678ASDFGHKLASEFNHKLASDYGHRLASDFSHKLASEYDHHIATEYPHKL
Entropy at 1 is zero because 0*ln(0)=0 and 1*ln(1)=0 are zeroEntropy at 2 is .84*ln(.84) + .16*ln(.16) ~ .73Entropy at 3 is 2*.5*ln(.5) ~ .69Entropy at 5 is .32*ln(.32) + 4*.16*ln(.16) ~ 1.520* .05*ln(.05) ~ 3.0
-
Variability
Sequence variability Vi is the number of amino acid types observed at position i in more than 0.5% of all sequences.
Rules
1) If a residue is conserved, it is important
2) If a residue is very conserved, it is very important
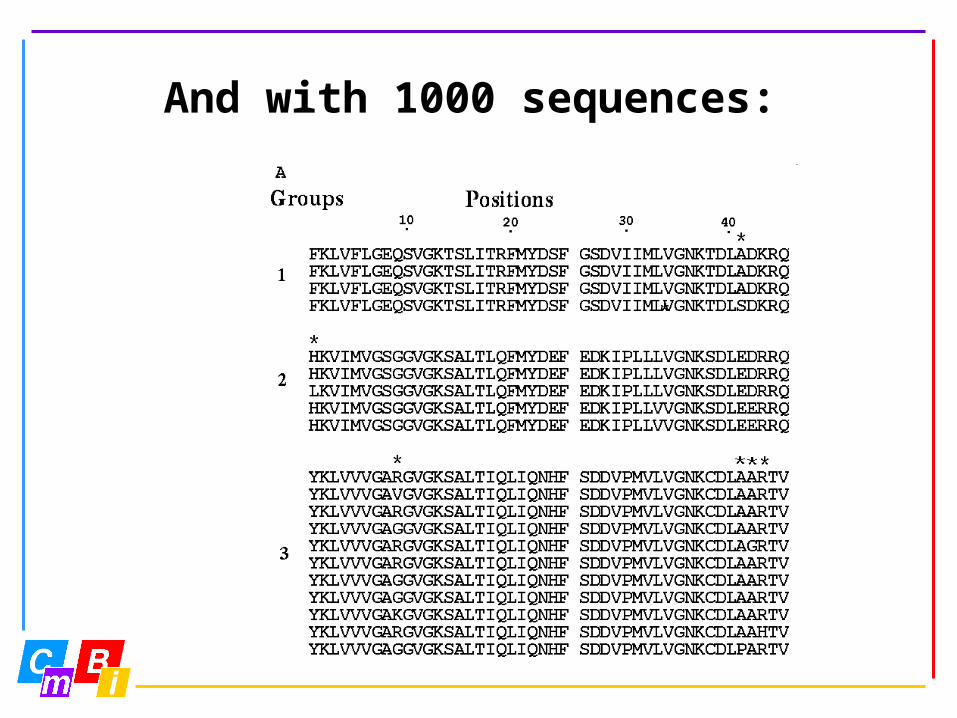
And with 1000 sequences:
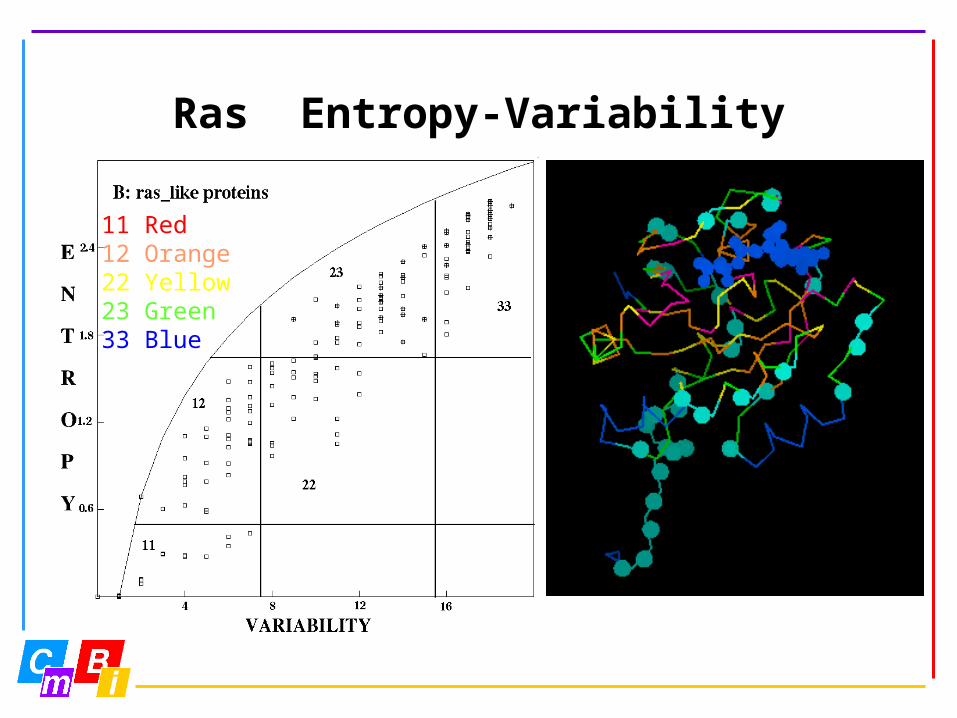
Ras Entropy-Variability
11 Red12 Orange22 Yellow23 Green33 Blue
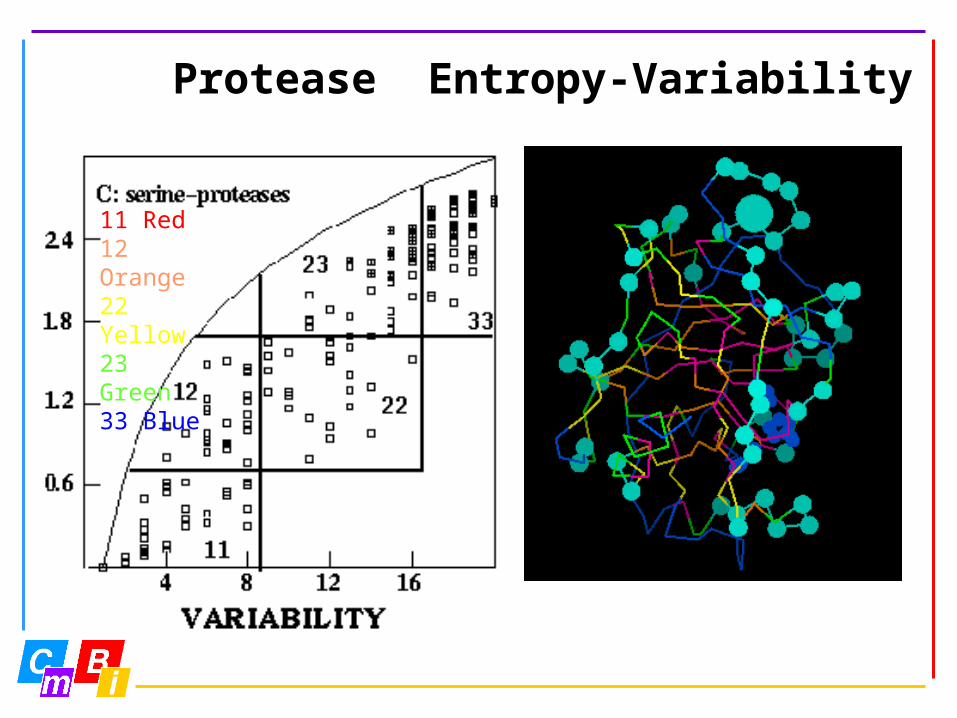
Protease Entropy-Variability
11 Red12 Orange22 Yellow23 Green33 Blue
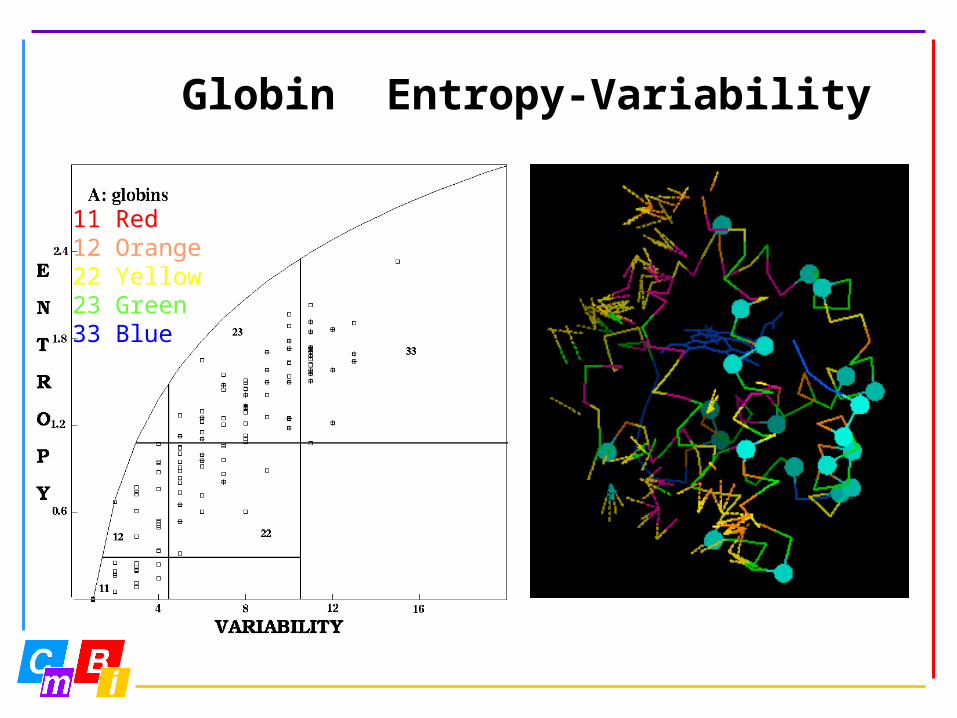
Globin Entropy-Variability
11 Red12 Orange22 Yellow23 Green33 Blue
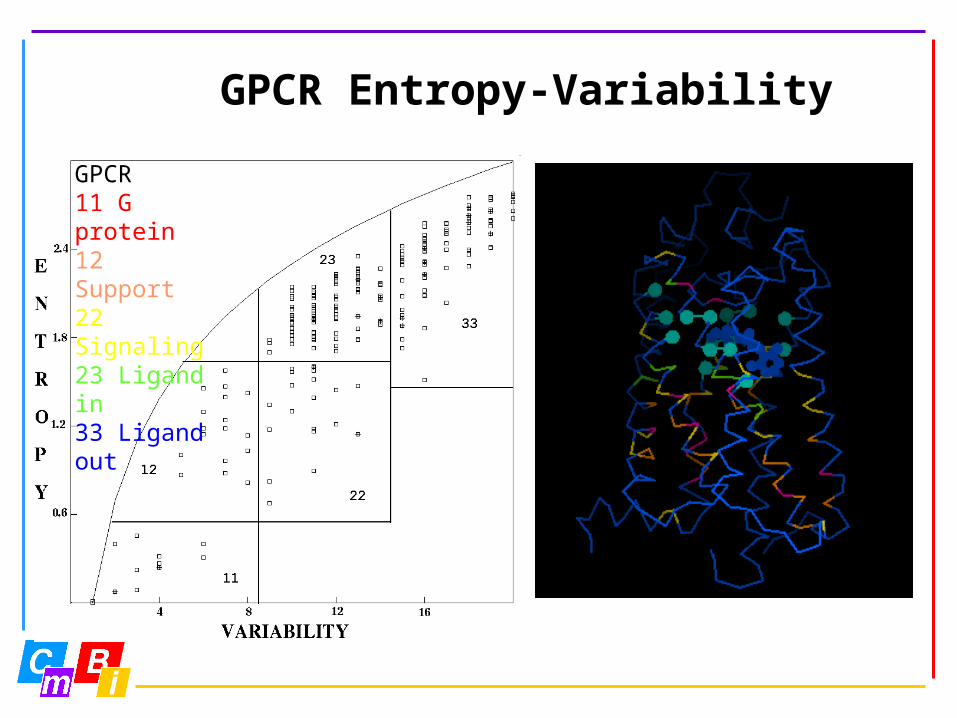
GPCR Entropy-Variability
GPCR11 G protein12 Support22 Signaling23 Ligand in33 Ligand out
0.0
0.4
0.8
1.2
1.6
2.0
2.4
2.8
0 2 4 6 8 10 12 14 16 18
VARIABILITY
ENTROPY
11
2212
23 33
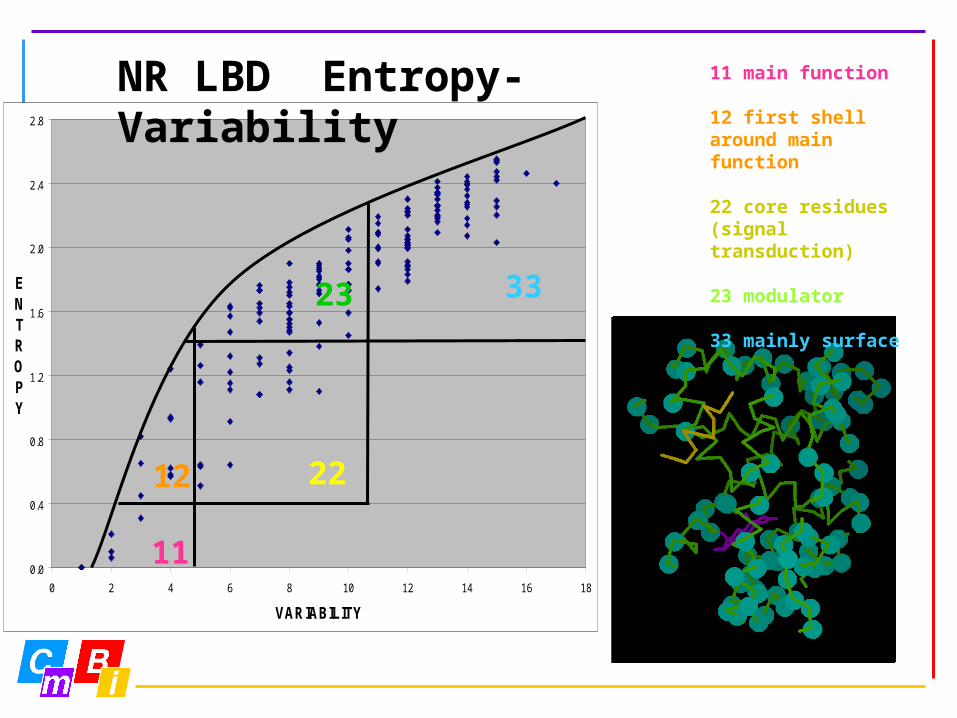
11 main function
12 first shell around main function
22 core residues (signal transduction)
23 modulator
33 mainly surface
NR LBD Entropy-Variability
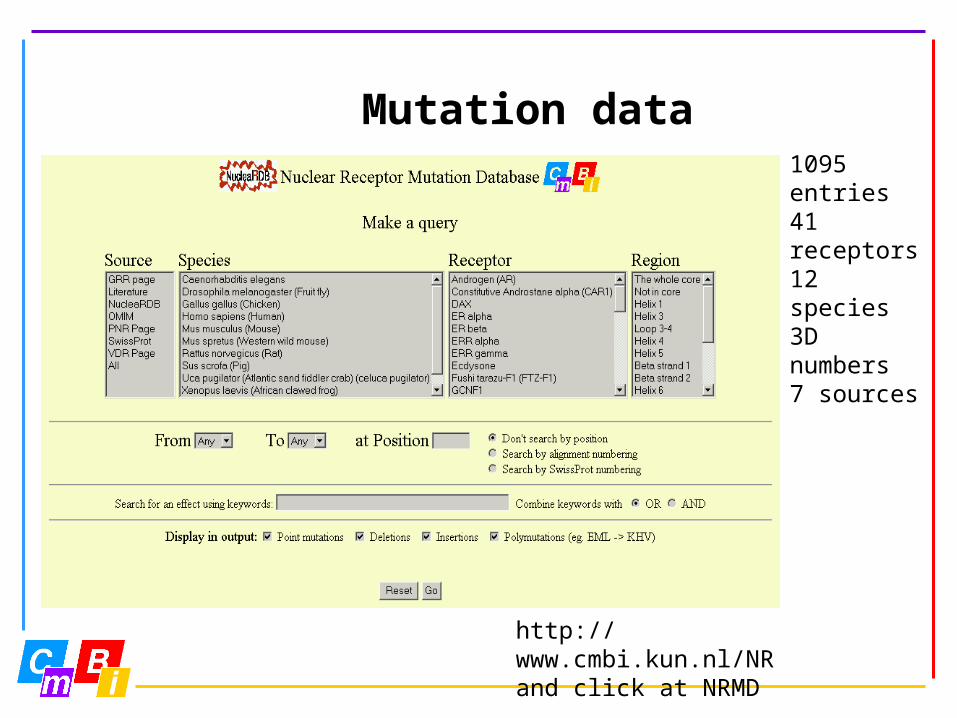
Mutation data
http://www.cmbi.kun.nl/NRand click at NRMD
1095 entries 41 receptors12 species3D numbers7 sources
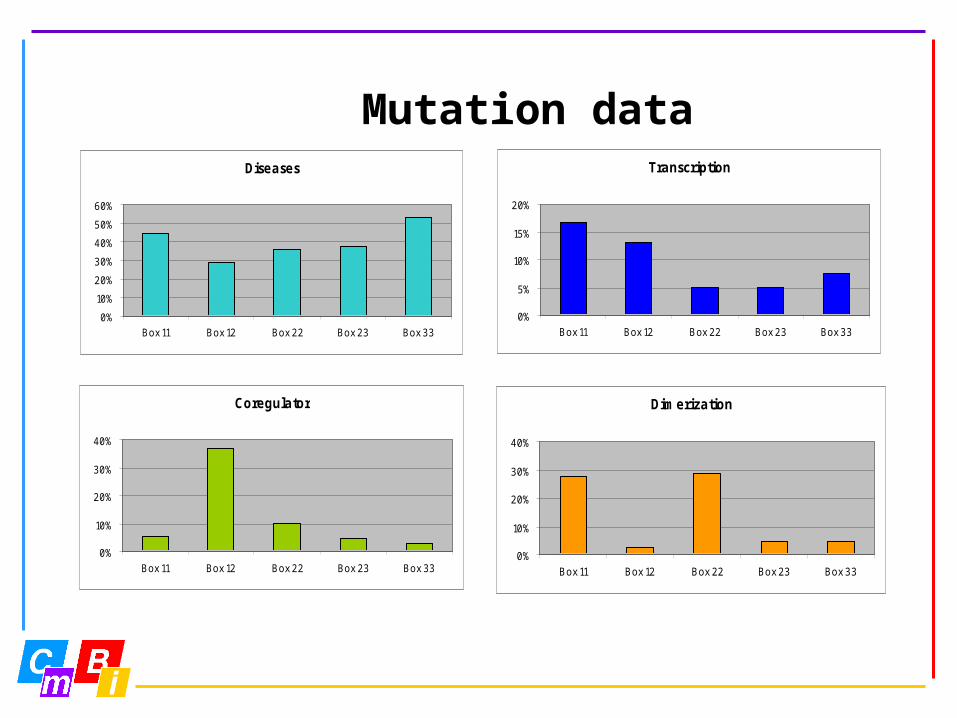
Mutation dataDiseases
0%
10%
20%
30%
40%
50%
60%
Box 11 Box 12 Box 22 Box 23 Box 33
Transcription
0%
5%
10%
15%
20%
Box 11 Box 12 Box 22 Box 23 Box 33
Coregulator
0%
10%
20%
30%
40%
Box 11 Box 12 Box 22 Box 23 Box 33
Dimerization
0%
10%
20%
30%
40%
Box 11 Box 12 Box 22 Box 23 Box 33
Mutation data
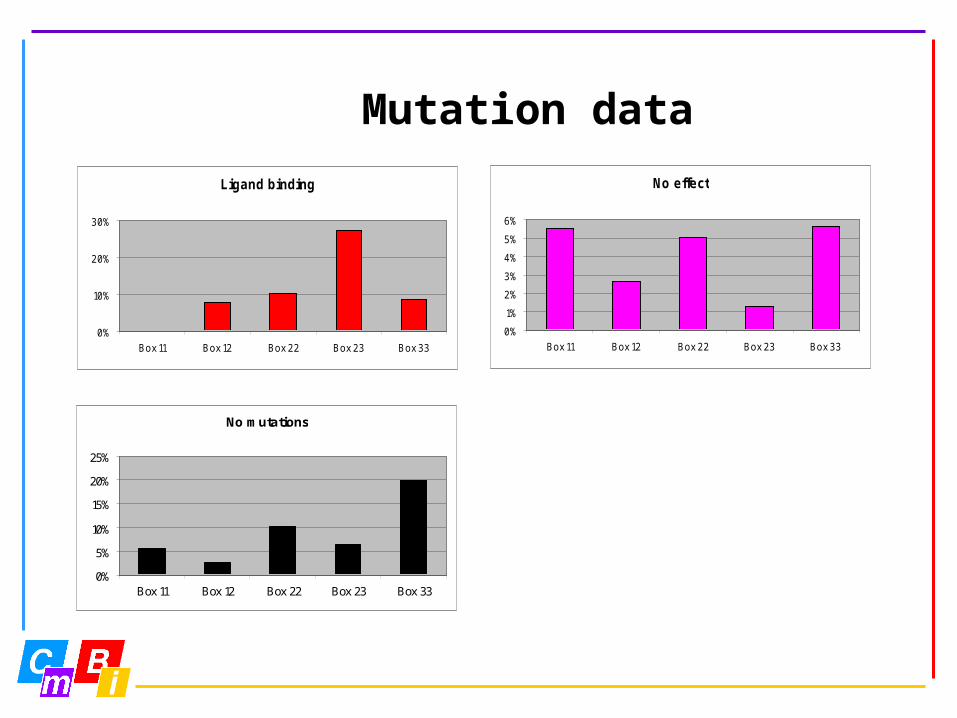
Ligand binding
0%
10%
20%
30%
Box 11 Box 12 Box 22 Box 23 Box 33
No effect
0%
1%
2%
3%
4%
5%
6%
Box 11 Box 12 Box 22 Box 23 Box 33
No mutations
0%
5%
10%
15%
20%
25%
Box 11 Box 12 Box 22 Box 23 Box 33
Ligand binding data
Ligand-binding positions extracted from PDB files (nomenclature)
Categorized in very frequent to not so frequent binder
Which type of ligand it binds (agonist/antagonist=inverse agonist…)
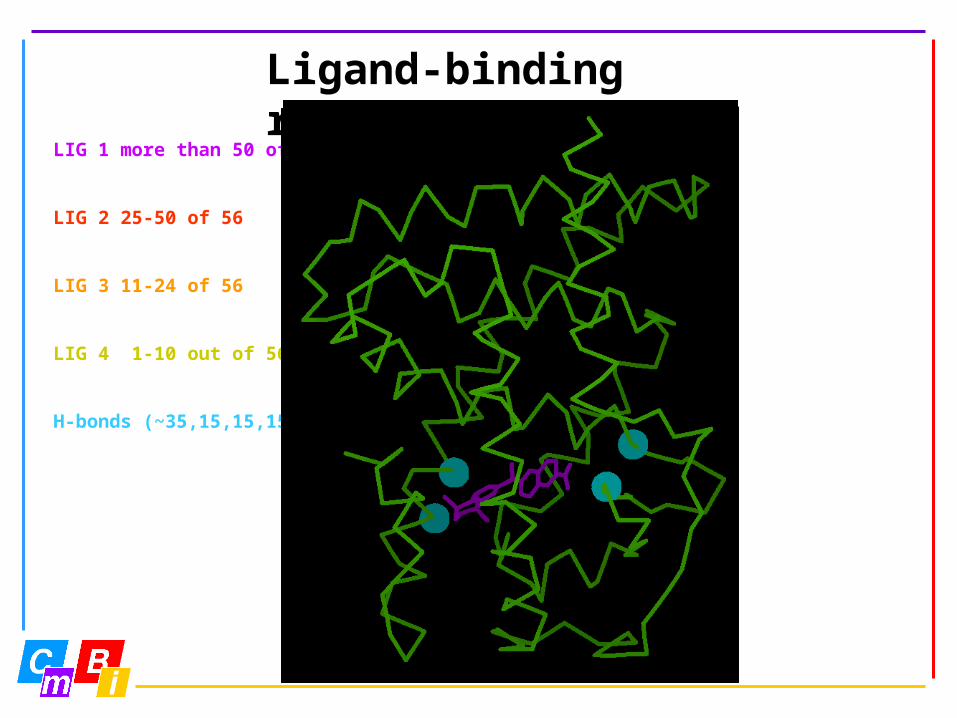
LIG 1 more than 50 of 56
LIG 2 25-50 of 56
LIG 3 11-24 of 56
LIG 4 1-10 out of 56
H-bonds (~35,15,15,15)
Ligand-binding residues
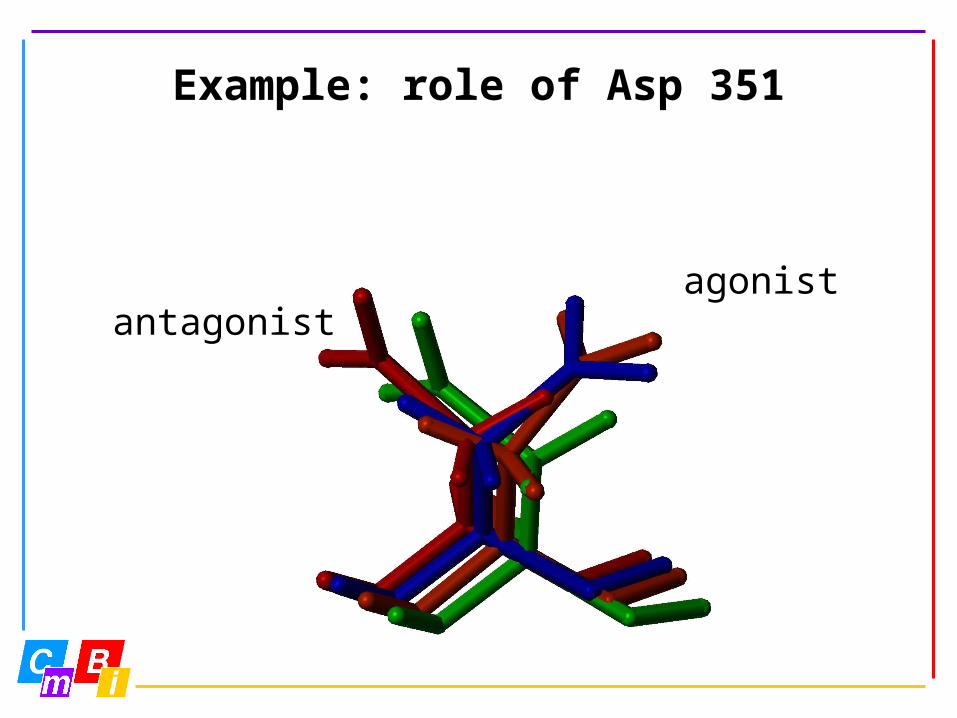
Example: role of Asp 351
antagonistagonist
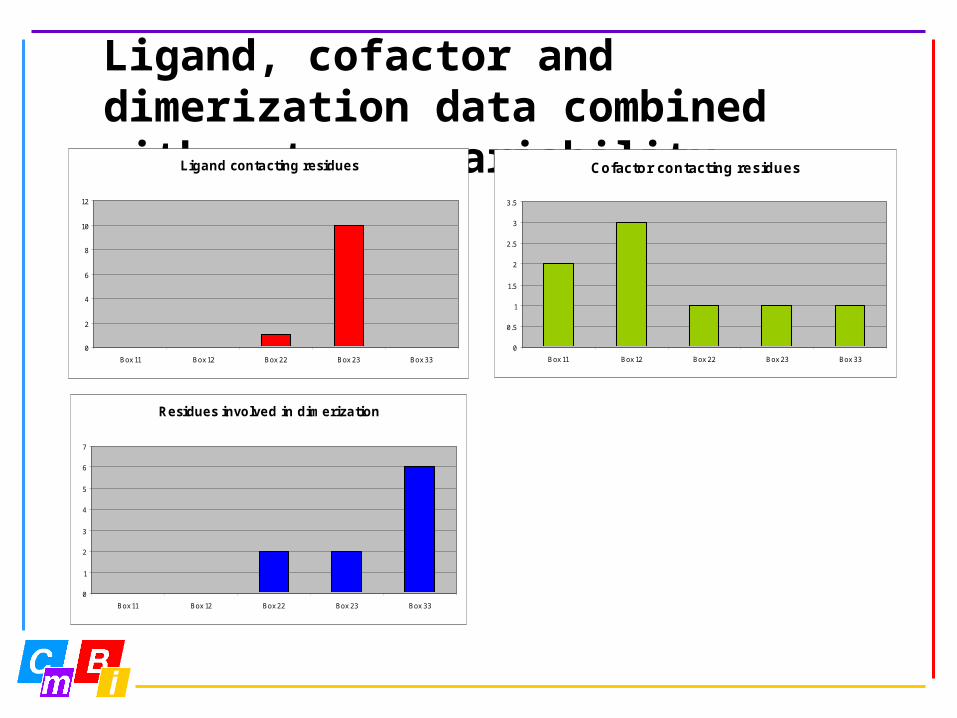
Ligand, cofactor and dimerization data combined with entropy-variability analysis
Ligand contacting residues
0
2
4
6
8
10
12
Box 11 Box 12 Box 22 Box 23 Box 33
Cofactor contacting residues
0
0.5
1
1.5
2
2.5
3
3.5
Box 11 Box 12 Box 22 Box 23 Box 33
Residues involved in dimerization
0
1
2
3
4
5
6
7
Box 11 Box 12 Box 22 Box 23 Box 33
Conclusions:
Data is difficult, but we need it (sic); life would be so nice if we could do without. PDB files are the worst.
Nomenclature is not homogeneous.
Much data has been carefully hidden in the literature where it can only be found back with great difficulty.
Residue numbering is difficult but very necessary.Variability-entropy analysis is powerful, but requires very 'good' alignments.
Acknowledgements:Organon CMBI Jacob de Vlieg Emmanuel BettlerJan Klomp Simon FolkertsmaPaula van Noort Henk-Jan JoostenScott Lusher Joost van Durme
Wilco FleurenUCSF Jeroen EitjesFlorence Horn Jeroen van Broekhuizen
Richard NotebaartRichard van HamerenRalph Brandt