Embed Size (px)
Citation preview

Nuclear Instruments and Methods in Physics Research B 99 (1995) 440-443
EISEVIER
Beam Interactions with Materials 8 Atoms
Nuciear reaction channeling
J.D. Meyer a, * , R.W. Michelmann a, F. Ditr6i b,l, K. Bethge a
a Institute for Nuclear Physics, J. W. Goethe Uniuersity, Frankfurt/M, Germany ’ institute of Nuclear Research of the Hung. Acad. of Sci., Debrecen, Hungary
Abstract
Nuclear reaction channeling (NRC) provides a tool for the investigation of concentration and lattice location of impurities in a crystal. In this work NRC is applied to the analysis of light element impurities (B, C, N, 0) in semiconductor materials
(GaAs, Si). Depending on the nuclear reaction used for the investigation, concentrations below 100 ppma are analysed. The channeling angular scans in different crystalline directions allow to specify the site of the impurities up to a range of the thermal vibration amplitude of the host crystal. These results are deduced from the MABIC simulation code.
1. Introduction
A quantitative analysis of impurities in Si and GaAs crystals is essential for a detailed understanding of materi-
als processing, since the incorporation of impurities in semiconducting materials may affect their electronic and structural properties. Especially the effects of light ele- ments, like boron, carbon, nitrogen and oxygen onto Si and GaAs are widely studied because of the great techno- logical importance of these impurities [l-3].
Nuclear analysis techniques, e.g. charged particle acti- vation analysis (CPAA) or nuclear reaction analysis (NRA) [4,5], have been applied as methods for the determination
of sub-ppm to ppm level traces of light elements in different materials. By using the channeling technique in
combination with these methods one obtains information about the lattice position [6,7] of the impurity and, in case of the NRA, its depth profile [&lo]. The advantage of the
high sensitivity of nuclear reaction channeling analysis to determine traces of selected impurities in a host matrix is in contrast to the difficulty of the interpretation of the resulting spectra. The energy dependence of the differen- tial cross sections in NRC experiments is very strong. Therefore, an exact knowledge of the energy of the prob- ing ions as a function of position and depth in the host
crystal is required. Without this knowledge the analysis of NRC spectra is only qualitative. Such a demand is much more relaxed in Rutherford backscattering spectrometry,
because of the relative weak energy dependence of the scattering cross section. For this reason a channeling simu- lation program (MABIC) [ 1 l] is developed, which is highly
* Corresponding author.
’ Humboldt Research Fellow in Frankfurt.
versatile with respect to crystal structure of the host ma- trix, to nuclear and electronic properties of the material
under investigation and which allows to build in the kinematic function and differential cross section of the
reaction under consideration. Using this code quantitative results for impurity sites and concentrations within a host crystal can be deduced from channeling angular scan experiments. This paper describes the analytical method.
2. Experiment
The channeling experiments are carried out at the 7.5 MeV Van de Graaff accelerator of the Institut for Nuclear
Physics, University of Frankfurt with a two axis goniome- ter. The detailed experimental setup is described in Ref. [9], where it is applied to investigate the thermally acti- vated motion of carbon within the lattice of GaAs. For this
purpose LEC grown (100) GaAs wafers are implanted under random direction with singly charged carbon ions of 2 MeV and a fluence of 2.6 X lOI cm-‘. The resulting
depth profile has a projected range of 2 IJ-m, with a range straggling of 0.3 pm. The fluence was chosen as a com-
promise between low concentration of the impurities (to be comparable with pure GaAs) and fair statistics for the channeling measurements. To study the thermally activated motion of carbon in GaAs the implanted samples were annealed at fixed temperatures from 400 to 600°C. The time scale for the annealing procedure varies between 10 to 40 min. In Ref. [9] was shown, that already annealing at 400°C under N, atmosphere for a time of 20 min removes nearly all lattice defects caused by the ion implantation. The NRC experiments are performed using the 12C(d, p)13C reaction with a deuteron energy of 1.4 MeV at a backscat- tering detection angle y of 156” for the ejected protons.
0168-583X/95/$09.50 0 1995 Elsevier Science B.V. All rights reserved
SSDI 0168-583X(95)00205-7
J.D. Meyer et al./ Nucl. Instr. and Meth. in Phys. Rex B 99 (1995) 440-443 441
1.5 -7
i
t=10 nun
e
B
21.0 8 8
& t=zo pl
%
2 .a0 @ (100) GaAs
z 0.5 t=30 g
T=500 T
eB o 0 measured
A :simulated
t=40
0.0 , I , , , 00 02 0.4 0.6 0.6
Tilt angle [degree]
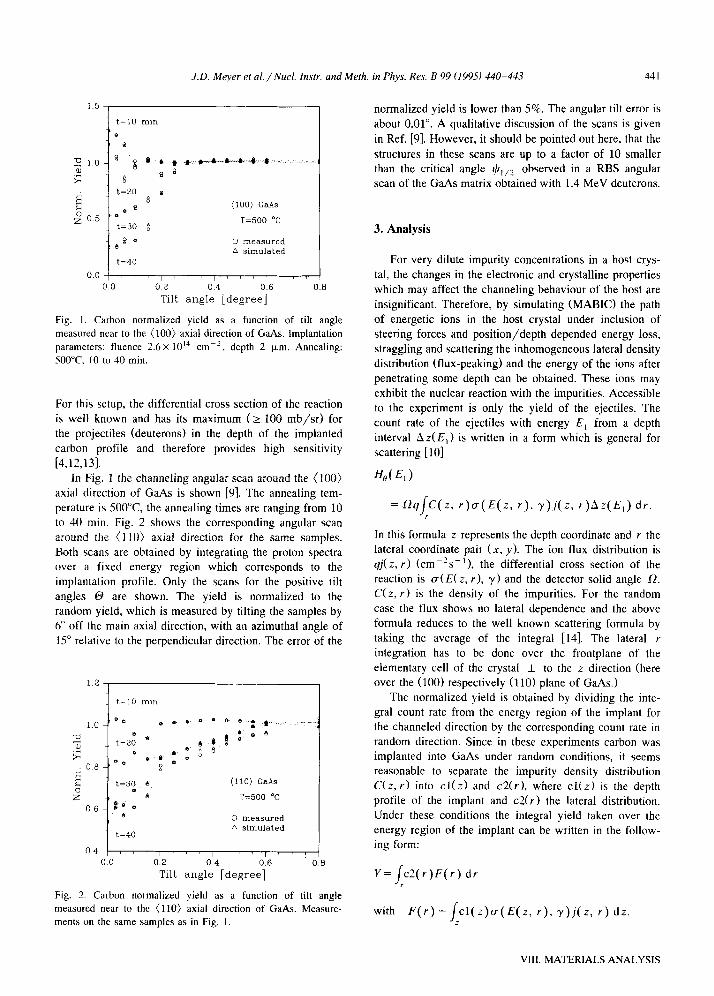
Fig. 1. Carbon normalized yield as a function of tilt angle
measured near to the (100) axial direction of GaAs. Implantation
parameters: fluence 2.6 x 10” cm-‘. depth 2 km. Annealing:
_SOO”C, IO to 40 min.
For this setup, the differential cross section of the reaction
is well known and has its maximum (2 100 mb/sr) for the projectiles (deuterons) in the depth of the implanted carbon profile and therefore provides high sensitivity
[4,12,13].
In Fig. I the channeling angular scan around the (100) axial direction of GaAs is shown [9]. The annealing tem- perature is 5OO”C, the annealing times are ranging from 10
to 40 min. Fig. 2 shows the corresponding angular scan around the (110) axial direction for the same samples. Both scans are obtained by integrating the proton spectra over a fixed energy region which corresponds to the implantation profile. Only the scans for the positive tilt
angles 8 are shown. The yield is normalized to the random yield, which is measured by tilting the samples by 6” off the main axial direction, with an azimuthal angle of
15” relative to the perpendicular direction. The error of the
1.2 -7 _I t=10 mln I
(11.0) &As
T=500 oc
0 measured a simulated
Tilt angle [degree]
Fig. 2. Carbon normalized yield as a function of tilt angle
measured near to the (110) axial direction of GaAs. Measure-
ments on the same samples as in Fig. 1.
normalized yield is lower than 5%. The angular tilt error is
about 0.01”. A qualitative discussion of the scans is given
in Ref. [9]. However, it should be pointed out here, that the
structures in these scans are up to a factor of 10 smaller than the critical angle ICI,,? observed in a RBS angular scan of the GaAs matrix obtained with 1.4 MeV deuterons.
3. Analysis
For very dilute impurity concentrations in a host crys-
tal, the changes in the electronic and crystalline properties which may affect the channeling behaviour of the host are
insignificant. Therefore, by simulating (MABIC) the path
of energetic ions in the host crystal under inclusion of steering forces and position/depth depended energy loss,
straggling and scattering the inhomogeneous lateral density distribution (flux-peaking) and the energy of the ions after penetrating some depth can be obtained. These ions may exhibit the nuclear reaction with the impurities. Accessible
to the experiment is only the yield of the ejectiles. The count rate of the ejectiles with energy E, from a depth
interval Az(E,) is written in a form which is general for
scattering [lo]
&(E,)
= QjC( Z, r)o(E(z, r), r)j(z, r)Az(E,) dr. i-
In this formula z represents the depth coordinate and r the lateral coordinate pair (x. y). The ion flux distribution is qj(z, r) (cmP’s-’ ), the differential cross section of the
reaction is u(E( Z, r), y ) and the detector solid angle 0. C(z, r) is the density of the impurities. For the random
case the flux shows no lateral dependence and the above
formula reduces to the well known scattering formula by taking the average of the integral [14]. The lateral r
integration has to be done over the frontplane of the elementary cell of the crystal I to the z direction (here over the (100) respectively (110) plane of GaAs.)
The normalized yield is obtained by dividing the inte- gral count rate from the energy region of the implant for the channeled direction by the corresponding count rate in
random direction. Since in these experiments carbon was implanted into GaAs under random conditions, it seems reasonable to separate the impurity density distribution
C(z, r) into cl(z) and c2(r), where cl(z) is the depth profile of the implant and c2(r) the lateral distribution. Under these conditions the integral yield taken over the energy region of the implant can be written in the follow- ing form:
Y= /
c2(r)F(r) dr r
with E(r)=/cl(z)o(E(z, r). r)j(z, r) dz. Z
VIII. MATERIALS ANALYSIS
442 J.D. Meyer Ed al. / Nucl. Instr. and Meth. in Phys. Rex B 99 (1995) 440-443
Tilt angle 1.4 MeV d (100) GaAs Area1 concentration
Annealing : T=500 “C2.0 min
0.8
2
.; 0.6
d 2 0.4
3600 3&o 31’00 31’50 Fig. 5. Simulated areal concentration of carbon in GaAs, in (100)
Proton energy [keV] direction. Annealing: 500°C for 30 min.
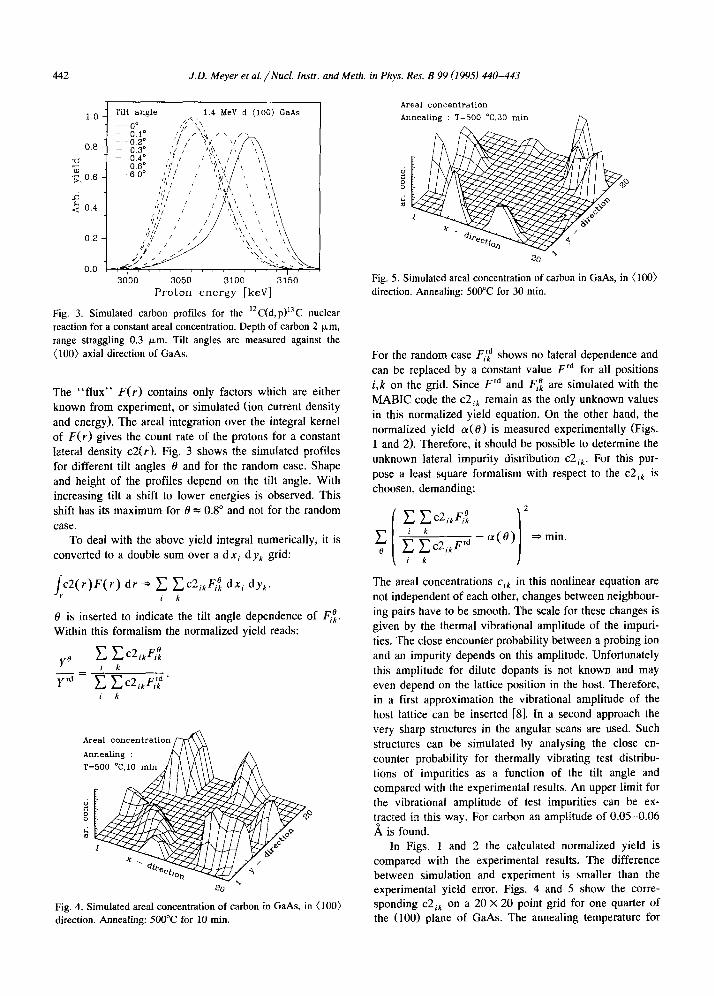
Fig. 3. Simulated carbon profiles for the “C(d,p)‘“C nuclear
reaction for a constant area1 concentration. Depth of carbon 2 pm,
range straggling 0.3 pm. Tilt angles are measured against the
(100) axial direction of GaAs.
The “flux” F(r) contains only factors which are either
known from experiment, or simulated (ion current density
and energy). The area1 integration over the integral kernel of F(r) gives the count rate of the protons for a constant lateral density c2(r). Fig. 3 shows the simulated profiles
for different tilt angles 0 and for the random case. Shape and height of the profiles depend on the tilt angle. With increasing tilt a shift to lower energies is observed. This
shift has its maximum for 19 = 0.8” and not for the random
case. To deal with the above yield integral numerically, it is
converted to a double sum over a dxj d y, grid:
(d(r)F(r) dr 9 c ~c2,,Fi~ dxi dy,. ‘r i k
0 is inserted to indicate the tilt angle dependence of Fiz.
Within this formalism the normalized yield reads:
yo c cc2ikFi! i I
Area1 concentration
Annealq : T=500 ‘C,lO min
Fig. 4. Simulated area1 concentration of carbon in GaAs, in (100)
direction. Annealing: 500°C for 10 min.
For the random case F,‘,d shows no lateral dependence and
can be replaced by a constant value Frd for all positions i,k on the grid. Since Frd and Fii are simulated with the
MABIC code the ~2~, remain as the only unknown values
in this normalized yield equation. On the other hand, the normalized yield ~(0) is measured experimentally (Figs. 1 and 2). Therefore, it should be possible to determine the unknown lateral impurity distribution c2;,. For this pur-
pose a least square formalism with respect to the c2,, is
choosen, demanding:
The area1 concentrations c,~ in this nonlinear equation are
not independent of each other, changes between neighbour- ing pairs have to be smooth. The scale for these changes is given by the thermal vibrational amplitude of the impuri-
ties. The close encounter probability between a probing ion and an impurity depends on this amplitude. Unfortunately
this amplitude for dilute dopants is not known and may even depend on the lattice position in the host. Therefore, in a first approximation the vibrational amplitude of the host lattice can be inserted [8]. In a second approach the very sharp structures in the angular scans are used. Such
structures can be simulated by analysing the close en- counter probability for thermally vibrating test distribu- tions of impurities as a function of the tilt angle and compared with the experimental results. An upper limit for the vibrational amplitude of test impurities can be ex- tracted in this way. For carbon an amplitude of 0.05-0.06
i is found. In Figs. 1 and 2 the calculated normalized yield is
compared with the experimental results. The difference between simulation and experiment is smaller than the experimental yield error. Figs. 4 and 5 show the corre- sponding ~2~~ on a 20 X 20 point grid for one quarter of the (100) plane of GaAs. The annealing temperature for
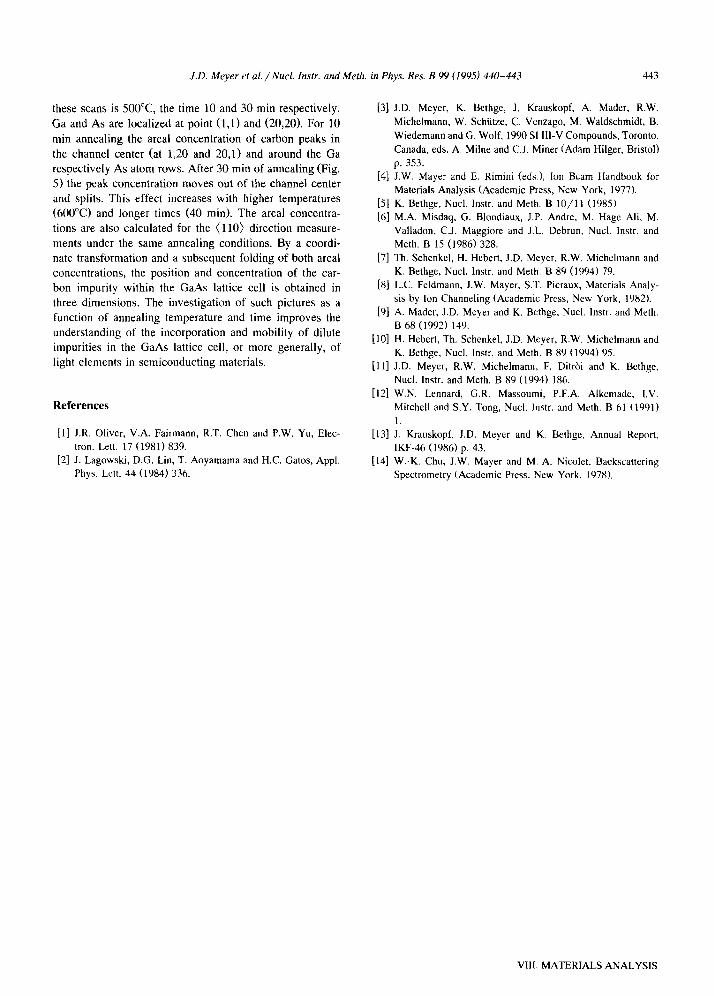
J.D. Meyer et al. /Nucl. Instr. and Meth. in Phys. Res. B 99 (19951 440-443 443
these scans is 5OO”C, the time 10 and 30 min respectively.
Ga and As are localized at point (1,l) and (20,20). For 10
min annealing the areal concentration of carbon peaks in
the channel center (at 1,20 and 20,l) and around the Ga respectively As atom rows. After 30 min of annealing (Fig.
5) the peak concentration moves out of the channel center and splits. This effect increases with higher temperatures (600°C) and longer times (40 min). The areal concentra-
tions are also calculated for the (110) direction measure- ments under the same annealing conditions. By a coordi-
nate transformation and a subsequent folding of both areal concentrations, the position and concentration of the car-
bon impurity within the GaAs lattice cell is obtained in
three dimensions. The investigation of such pictures as a function of annealing temperature and time improves the
understanding of the incorporation and mobility of dilute impurities in the GaAs lattice cell, or more generally, of
light elements in semiconducting materials.
References
[lo] H. Hebert, Th. Schenkel, J.D. Meyer, R.W. Michelmann and
K. Bethge, Nucl. Instr. and Meth. B 89 (1994) 95.
[l l] J.D. Meyer, R.W. Michelmann, F. Ditrbi and K. Bethge,
Nucl. Instr. and Meth. B 89 (1994) 186.
[12] W.N. Lennard, G.R. Massoumi, P.F.A. Alkemade, I.V.
Mitchell and S.Y. Tong, Nucl. Instr. and Meth. B 61 (1991)
I. [l] J.R. Oliver, V.A. Fairmann, R.T. Chen and P.W. Yu, Elec- [13] J. Krauskopf, J.D. Meyer and K. Bethge, Annual Report,
tron. Lett. 17 (1981) 839. IKF-46 (1986) p. 43. [2] .I. Lagowski, D.G. Lin, T. Aoyamama and H.C. Gatos, Appl.
Phys. Lctt. 44 (1984) 336. [14] W.-K. Chu, J.W. Mayer and M.-A. Nicolet, Backscattering
Spectrometry (Academic Press, New York. 1978).
[3] J.D. Meyer, K. Bethge, J. Krauskopf, A. Mader, R.W.
Michelmann, W. Schiitze, C. Vcnzago, M. Waldschmidt, B.
Wiedemann and G. Wolf, 1990 SI III-V Compounds, Toronto,
Canada, eds. A. Mime and C.J. Miner (Adam Hilger, Bristol)
p. 353.
]4] J.W. Mayer and E. Rimini (eds.), Ion Beam Handbook for
Materials Analysis (Academic Press, New York, 1977).
[S] K. Bethge, Nucl. Instr. and Meth. B IO/l 1 (1985)
[6] M.A. Misdaq, G. Blondiaux, J.P. Andre, M. Hage Ali, M.
Valladon. C.J. Maggiore and J.L. Debrun, Nucl. Instr. and
Meth. B 15 (1986) 328.
[7] Th. Schenkel, H. Hebert, J.D. Meyer, R.W. Michelmann and
K. Bethge, Nucl. Instr. and Meth. B 89 (1994) 79.
[8] L.C. Feldmann, J.W. Mayer, ST. Picraux, Materials Analy-
sis by Ion Channeling (Academic Press, New York, 1982).
[9] A. Mader, J.D. Meyer and K. Bethge, Nucl. Instr. and Meth.
B 68 (1992) 149.
VIII. MATERIALS ANALYSIS