Embed Size (px)
Citation preview

Nuclear Physics in Medicine
Chapter: Medical Imaging
Table of content
1 INTRODUCTION ........................................ 2
2 FROM NUCLEAR TO MOLECULAR IMAGING ............................................................. 3
2.1 NUCLEAR IMAGING TECHNIQUES .............. 3 2.1.1 POSITRON EMISSION TOMOGRAPHY ........ 3 2.1.2 PET COMBINED TO MAGNETIC
RESONANCE IMAGING ................................................ 3 2.1.3 SINGLE PHOTON COMPUTED
TOMOGRAPHY .............................................................. 3 2.2 PRECLINICAL IMAGING .............................. 5 2.2.1 PRESENT TECHNOLOGY FOR SMALL
ANIMAL PET IMAGING ............................................... 5 2.2.2 PRESENT TECHNOLOGY FOR SMALL-ANIMAL SPECT SYSTEMS ......................................... 7 2.2.3 SMALL-ANIMAL CT IMAGING .................... 9 2.2.4 MRI SMALL ANIMAL IMAGING .................. 9 2.2.5 MULTIMODALITY APPROACH .................. 10 2.2.6 CONCLUSIONS ............................................. 11
3 NEW CHALLENGES ................................ 12
3.1 DETECTOR DESIGN .................................. 12 3.1.1 SCINTILLATORS .......................................... 12 3.1.2 PHOTON DETECTORS ................................ 13 3.1.3 FRONT-END ELECTRONICS ...................... 15 3.1.4 MODULE LAYOUT ...................................... 15 3.2 SIMULATION AND RECONSTRUCTION .... 17 3.2.1 IMAGE RECONSTRUCTION ........................ 17 3.2.2 SIMULATIONS ............................................. 20 3.3 PHOTON COUNTING: TOWARDS SPECTRAL
CT 22 3.3.1 PHOTON COUNTING WITH HYBRID PIXELS
22 3.3.2 SPECTRAL X-RAY IMAGING ....................... 23 3.3.3 PROSPECTS ................................................. 25 3.3.4 CONCLUSION ............................................... 26
4 INTERFACES ............................................ 27
4.1 QUALITY CONTROL IN HADRONTHERAPY
27 4.1.1 POSITRON EMISSION TOMOGRAPHY IN
PARTICLE THERAPY ................................................. 27
4.1.2 PROMPT GAMMA RAY IMAGING .............. 29 4.1.3 CHARGED PARTICLE IMAGING.................. 29 4.1.4 ION RADIOGRAPHY AND TOMOGRAPHY .. 30 4.2 MASS SPECTROMETRY ............................ 31 4.2.1 BASIC CONCEPT .......................................... 31 4.2.2 PRESENT TECHNIQUES FOR BIO-CHEMICAL
AND MEDICAL APPLICATIONS .................................. 32 4.2.3 APPLICATIONS ............................................ 33 4.3 NUCLEAR MEDICAL IMAGING USING
+
COINCIDENCES: -PET ...................................... 36
5 CONCLUSIONS ......................................... 38
6 REFERENCES ........................................... 39
7 LIST OF CONTRIBUTORS .................... 50
1 Introduction
«A century ago, the living body, like most of
the material world, was opaque. Then Wilhelm
Roentgen captured an X-ray image of his
wife’s finger – her wedding ring “floating”
around a white bone – and our range of vision
changed for ever». From the words of
Bettyann Holtzmann Kelves up to now,
amazing progresses have been made in
medical imaging. One of the most impressive
achievements of the last fifteen years is
probably the emergence of molecular imaging.
A multidisciplinary discipline by definition,
physicists, biologists, physicians, chemists and
mathematicians bring their expertise to
observe, characterize and quantify biological
processes at the subcellular level in living
organisms. Molecular imaging originates from
nuclear medicine where single photon
emission tomography (SPECT) and positron
emission tomography (PET) imaging
techniques are used to observe complex
biological processes at the early stage of the
disease or for therapeutic follow-ups.
The use of radioactive tracers for medical
purposes began with Georges de Hevesy in the
1930s. The discovery of technetium at the
Berkeley cyclotron and the announcement of
the first SPECT machines in 1968 pushed the
discipline forward. SPECT rapidly became the
most frequently used emission-scanning
technology all over the world. The detectors
used in SPECT nowadays look quite similar to
the ones used at the beginning of this
technique. Sodium iodine inorganic crystal
coupled to a matrix of photomultiplier tubes
are well adapted to image 140 keV photons
generated by technetium-99m. The intrinsic
performance of most detectors does not impact
overall image quality in SPECT, which
essentially depends on the collimation stage.
PET began at the same period as SPECT and
has overlapped with the other imaging
modalities occasionally, but while anatomical
imaging modalities such as CT and MR moved
under spotlights of modern clinical practice,
PET remained in the shadow, until very
recently. The current success story for PET
imaging as an invaluable tool in clinical
routine is due to the combination of several
factors, of which the improvement in detector
performance played a rather minor role. The
need for a “technetium”-like isotope for PET
was mandatory. With a period of two hours
and ideal physical properties for PET imaging, 18
F rapidly became the isotope of choice.
However, it requires well-established network
of cyclotron facilities able of providing
radiolabelled compounds at the patient bed.
Finding the clinical niche in which PET does
not to compete but rather complement other
imaging modalities was also a determinant
factor for the success of PET. The combination
with CT promoted PET as a main tool in
oncology. Johannes Czernin from UCLA, at
the 2003 annual DGN meeting, commented
that “PET/CT is a technical evolution that has
led to a medical revolution.”
SPECT and PET imaging techniques enter a
new era where technical improvements will
play an increasingly important role. As an
example for SPECT, dedicated cardiac imagers
already take full advantage of solid-state
detectors. Time-of-flight PET and the
combination with MRI will continue to
challenge researchers: “PET/MRI is a medical
evolution based on a technical revolution.” As
mentioned by Thomas Beyer.
This chapter highlights state-of-the-art and
future prospects of medical imaging mostly in
the field of nuclear imaging. It focuses on new
developments and innovations brought by the
nuclear physics community. Different sections
cover hardware and software developments in
clinical and preclinical studies as well as
interface applications with other chapters of
this booklet.
2 From nuclear to molecular imaging
2.1 Nuclear imaging techniques
Molecular imaging using radioactive tracers
makes use of 2 distinct types of “camera”.
Tracers containing a radioactive isotope that
decays by the emission of a positron are
imaged by a positron-emission tomograph. In
tomography, a 3-dimensional image of an
object is obtained by combining 2-dimensional
images taken at different angles around the
object. Tracers emitting gamma rays are
imaged by the so-called gamma camera. It is
used to take 2-dimensional images and, when
positioned on a rotating gantry, allows
tomographic imaging (SPECT: single photon
emission computed tomography).
2.1.1 Positron Emission Tomography
A typical state-of-the-art commercial clinical
PET scanner contains a few ten thousand small
scintillation crystals that individually detect the
positron annihilation photons emitted by the
radiotracers in the patient body. The detection
times are measured very accurately, with a
precision of about half a billionth of a second.
Data rates are large: typically of the order of a
million events per second. Sophisticated
algorithms distil 3D images out of the huge
data set thus recorded. Images with a spatial
resolution of about 4 mm are obtained. A
whole body scan with the 18
FDG tracer, one of
the most common PET procedures, takes about
15 minutes.
The scanner bore of about 70 cm is determined
by patient size, the axial length of 20-25 cm is
a matter of limiting the costs. Nowadays, all
PET scanners are combined with a CT scanner
for a quick, easy and accurate determination of
the attenuation correction needed for
quantitative imaging. Scanners come with a
collection of sophisticated data and image
analysis options for specific scan procedures
and clinical investigations. Ease of use and
integration in the clinical workflow are well-
developed important features.
2.1.2 PET combined to Magnetic
Resonance Imaging
In recent years, commercial systems for
clinical use combining a PET and an MRI
(magnetic resonance imaging) scanner have
become available. First systems allowed the
integrated but sequential combination of PET
and MRI. The development of silicon-based
photosensors, which are insensitive to
magnetic fields, have made truly integrated
systems possible, first for head scans and most
recently for full-body scans. These systems
allow simultaneous PET and MRI without
quality loss in either imaging modality.
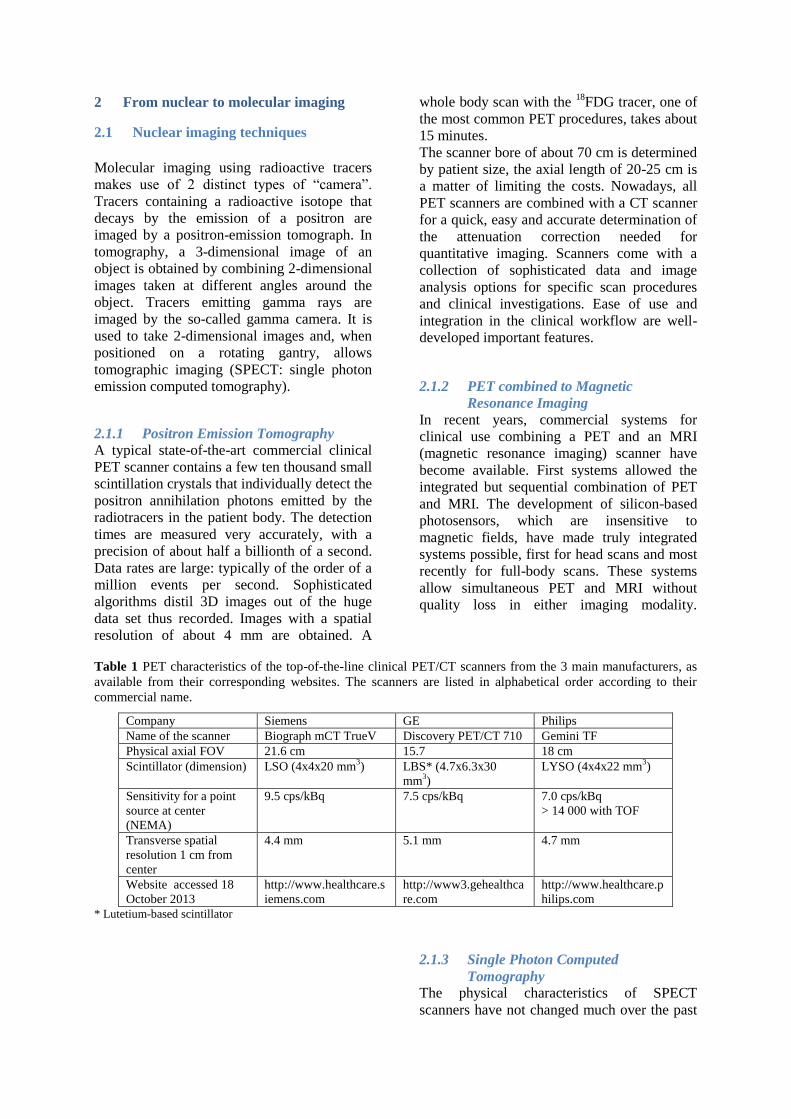
Table 1 PET characteristics of the top-of-the-line clinical PET/CT scanners from the 3 main manufacturers, as
available from their corresponding websites. The scanners are listed in alphabetical order according to their
commercial name.
Company Siemens GE Philips
Name of the scanner Biograph mCT TrueV Discovery PET/CT 710 Gemini TF
Physical axial FOV 21.6 cm 15.7 18 cm
Scintillator (dimension) LSO (4x4x20 mm3) LBS* (4.7x6.3x30
mm3)
LYSO (4x4x22 mm3)
Sensitivity for a point
source at center
(NEMA)
9.5 cps/kBq 7.5 cps/kBq 7.0 cps/kBq
> 14 000 with TOF
Transverse spatial
resolution 1 cm from
center
4.4 mm 5.1 mm 4.7 mm
Website accessed 18
October 2013
http://www.healthcare.s
iemens.com
http://www3.gehealthca
re.com
http://www.healthcare.p
hilips.com
* Lutetium-based scintillator
2.1.3 Single Photon Computed
Tomography
The physical characteristics of SPECT
scanners have not changed much over the past
few decades. The originally used scintillation
material, NaI, remains adequate for the task,
mainly because sensitivity and image
resolution are largely determined by the
collimator positioned in front of the detector.
Collimators are rather simple mechanical
devices that have been optimized quite a while
ago. Nevertheless, SPECT scanner developers
have made use of the rapid progress in
electronics and computation, improving e.g.
ease of use, stability and reliability.
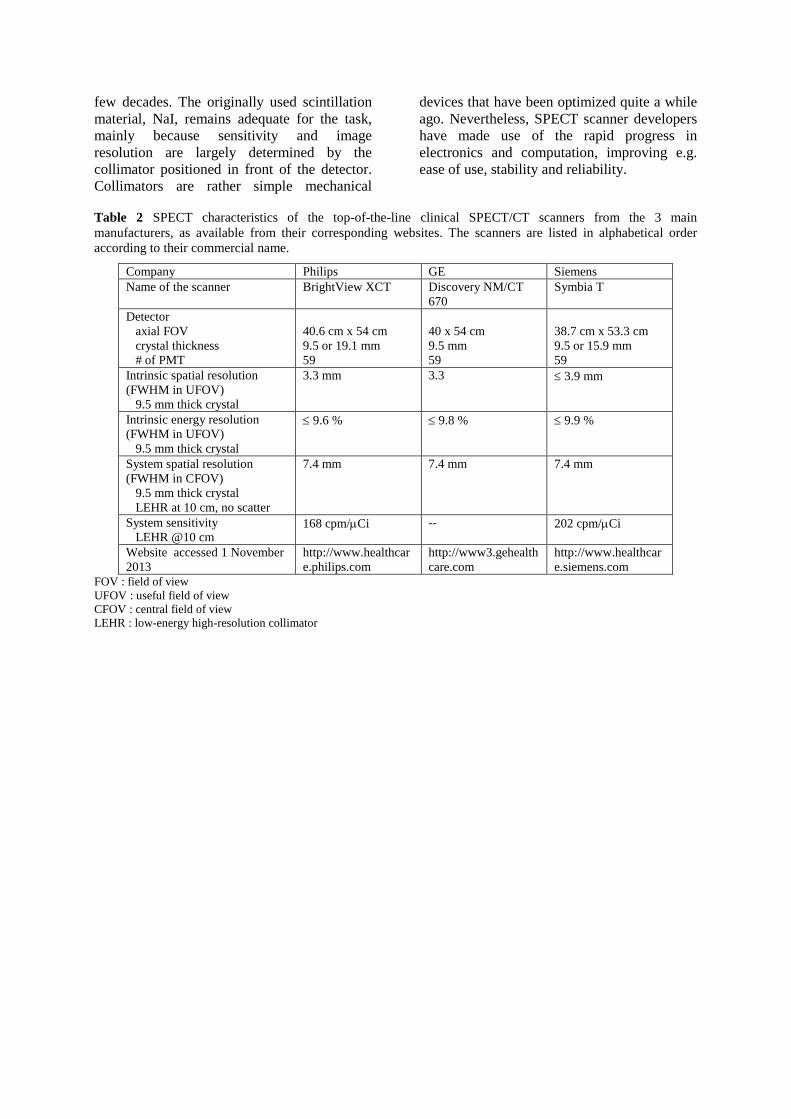
Table 2 SPECT characteristics of the top-of-the-line clinical SPECT/CT scanners from the 3 main
manufacturers, as available from their corresponding websites. The scanners are listed in alphabetical order
according to their commercial name.
Company Philips GE Siemens
Name of the scanner BrightView XCT Discovery NM/CT
670
Symbia T
Detector
axial FOV
crystal thickness
# of PMT
40.6 cm x 54 cm
9.5 or 19.1 mm
59
40 x 54 cm
9.5 mm
59
38.7 cm x 53.3 cm
9.5 or 15.9 mm
59
Intrinsic spatial resolution
(FWHM in UFOV)
9.5 mm thick crystal
3.3 mm 3.3 3.9 mm
Intrinsic energy resolution
(FWHM in UFOV)
9.5 mm thick crystal
9.6 % 9.8 % 9.9 %
System spatial resolution
(FWHM in CFOV)
9.5 mm thick crystal
LEHR at 10 cm, no scatter
7.4 mm 7.4 mm 7.4 mm
System sensitivity
LEHR @10 cm 168 cpm/Ci -- 202 cpm/Ci
Website accessed 1 November
2013
http://www.healthcar
e.philips.com
http://www3.gehealth
care.com
http://www.healthcar
e.siemens.com
FOV : field of view
UFOV : useful field of view
CFOV : central field of view
LEHR : low-energy high-resolution collimator
2.2 Preclinical Imaging
During the last decade there has been a
growing research interest in the field of
“Molecular imaging”. The necessity of
understanding the biochemical processes at
molecular level have stimulated a great
advance in technological instrumentation, both
in the hardware and software aspects,
especially as for in vivo studies on small
animal, e.g. rats and mice. This field of
research is often called “preclinical imaging”.
Major efforts are devoted to obtain higher
sensitivity, higher spatial resolution and
cheaper and easy to handle instrumentation.
This chapter gives a short overview of the
state-of-the-art technologies for the most
diffuse molecular imaging techniques, namely,
positron emission tomography (PET), single
photon emission computed tomography
(SPECT), x-ray computed tomography (CT)
and MRI (Magnetic Resonance Imaging), as
applied to small animal. Finally multimodality
techniques which allow the merging of
molecular information with anatomical details,
such as PET/CT; SPECT/CT and PET/MR will
be illustrated, These are the fields where the
technology is rapidly evolving these days.
2.2.1 Present Technology for Small Animal
PET Imaging
Functional Molecular imaging investigations
are performed on small animals, such as mice
and rats, down to cellular level, so as to obtain
results on simplified human models before the
direct study on patients [Massoud and
Ghambir, 2009]. The requirements on spatial
resolution are much higher than those for
clinical scanners because the dimensions of
rats and even more of mice are clearly much
smaller than the ones of human beings. For
example, imaging of the rat brain requires a
spatial resolution of less than 2 mm full width
at half maximum (FWHM). A resolution better
than 1 mm (FWHM) would be necessary for
the brain of the mouse, whereas state of the art
clinical scanner has a spatial resolution not
better than 4 mm (FWHM).
In addition, the available radioactive signal is
very weak. In fact, the injected activity in a
mouse for brain receptor investigation is
typically not greater than 5-10 MBq. Further
there are limitations on the maximum volume
of injected solution (10 % of the total blood
volume). As a consequence high-sensitivity
instrumentation is especially required when
fast dynamic processes are studied with
characteristic time of the same order of the
scanning time. All of the above has put
stringent requirements on PET scanners for
small animal and it has produced copious
research in this field.
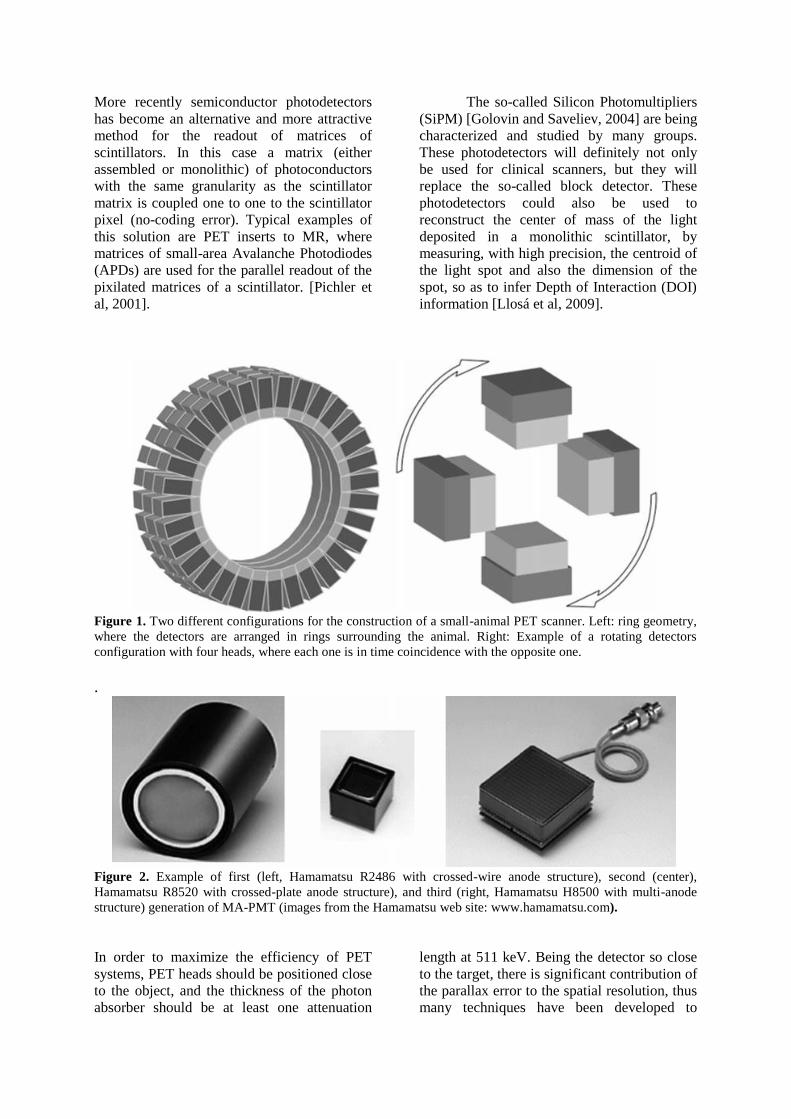
The design of most small-animal PET
instruments is usually based on a miniaturized
structure of a clinical scanner with small
detector elements surrounding the animal in a
small bore ring [Chatziioannou et al., 1999].
Other designs make use of rotating planar
detector pairs [Del Guerra et al., 1998] (see
Fig. 1). The latter configuration offers a better
sampling and image uniformity, but it has
severe limitations in terms of dynamic imaging
and if very fast throughput is desired.
High-resolution multi-anodes photomultipliers
tubes (MA-PMT) have been the photodetector
of choice for most preclinical scanners. In
most solutions the MA-PMT are coupled to
pixilated matrices of scintillator. In this case,
the coordinates of the photon interaction are
obtained via “light-sharing” technique, i.e., by
calculating the centroid of the light produced
by the crystal on the high-granularity position-
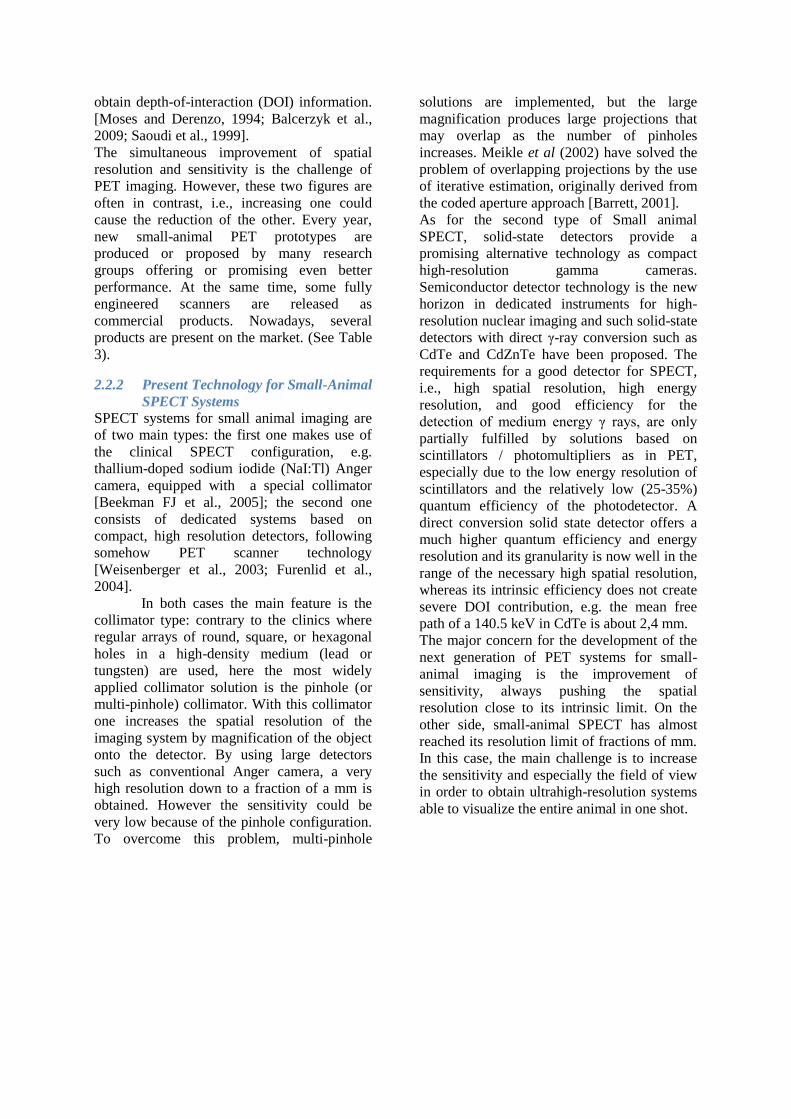
sensitive PMT. MA-PMTs have had a series of
improvements (see Fig. 2) over the last twenty
years, many of which have been partly
triggered by the molecular imaging community
needs: this led to the evolution from early MA-
PMTs based on a typical round shape, (up to
10 cm diameter, and a crossed wire anode
structure), to second generation (square-
shaped metal-channel dynode structure) with a
very fine anode granularity. And finally, with
the third generation there has been a great
improvement in the active area dimensions (up
to 5 cm in side) and especially in the active-to-
total area ratio (up to about 90%). These 5 cm
tubes are based on the metal-channel dynode
structure with an anode matrix of 16×16
elements on a 3 mm pitch.
The best readout method for modern MA-
PMTs would be independent single anode
read-out. To this aim dedicated ASICs have
been implemented and are currently used with
H8500 in High Energy Physics. However, in
order to limit the cost and complexity of the
readout, often the simpler method of resistive
chain for both X- and Y-coordinate is adopted
[Popov et al., 2001; Olcott et al., 2005], so as
to strongly reduce the number of output
channels.
More recently semiconductor photodetectors
has become an alternative and more attractive
method for the readout of matrices of
scintillators. In this case a matrix (either
assembled or monolithic) of photoconductors
with the same granularity as the scintillator
matrix is coupled one to one to the scintillator
pixel (no-coding error). Typical examples of
this solution are PET inserts to MR, where
matrices of small-area Avalanche Photodiodes
(APDs) are used for the parallel readout of the
pixilated matrices of a scintillator. [Pichler et
al, 2001].
The so-called Silicon Photomultipliers
(SiPM) [Golovin and Saveliev, 2004] are being
characterized and studied by many groups.
These photodetectors will definitely not only
be used for clinical scanners, but they will
replace the so-called block detector. These
photodetectors could also be used to
reconstruct the center of mass of the light
deposited in a monolithic scintillator, by
measuring, with high precision, the centroid of
the light spot and also the dimension of the
spot, so as to infer Depth of Interaction (DOI)
information [Llosá et al, 2009].
Figure 1. Two different configurations for the construction of a small-animal PET scanner. Left: ring geometry,
where the detectors are arranged in rings surrounding the animal. Right: Example of a rotating detectors
configuration with four heads, where each one is in time coincidence with the opposite one.
.
Figure 2. Example of first (left, Hamamatsu R2486 with crossed-wire anode structure), second (center),
Hamamatsu R8520 with crossed-plate anode structure), and third (right, Hamamatsu H8500 with multi-anode
structure) generation of MA-PMT (images from the Hamamatsu web site: www.hamamatsu.com).
In order to maximize the efficiency of PET
systems, PET heads should be positioned close
to the object, and the thickness of the photon
absorber should be at least one attenuation
length at 511 keV. Being the detector so close
to the target, there is significant contribution of
the parallax error to the spatial resolution, thus
many techniques have been developed to
obtain depth-of-interaction (DOI) information.
[Moses and Derenzo, 1994; Balcerzyk et al.,
2009; Saoudi et al., 1999].
The simultaneous improvement of spatial
resolution and sensitivity is the challenge of
PET imaging. However, these two figures are
often in contrast, i.e., increasing one could
cause the reduction of the other. Every year,
new small-animal PET prototypes are
produced or proposed by many research
groups offering or promising even better
performance. At the same time, some fully
engineered scanners are released as
commercial products. Nowadays, several
products are present on the market. (See Table
3).
2.2.2 Present Technology for Small-Animal
SPECT Systems
SPECT systems for small animal imaging are
of two main types: the first one makes use of
the clinical SPECT configuration, e.g.
thallium-doped sodium iodide (NaI:Tl) Anger
camera, equipped with a special collimator
[Beekman FJ et al., 2005]; the second one
consists of dedicated systems based on
compact, high resolution detectors, following
somehow PET scanner technology
[Weisenberger et al., 2003; Furenlid et al.,
2004].
In both cases the main feature is the
collimator type: contrary to the clinics where
regular arrays of round, square, or hexagonal
holes in a high-density medium (lead or
tungsten) are used, here the most widely
applied collimator solution is the pinhole (or
multi-pinhole) collimator. With this collimator
one increases the spatial resolution of the
imaging system by magnification of the object
onto the detector. By using large detectors
such as conventional Anger camera, a very
high resolution down to a fraction of a mm is
obtained. However the sensitivity could be
very low because of the pinhole configuration.
To overcome this problem, multi-pinhole
solutions are implemented, but the large
magnification produces large projections that
may overlap as the number of pinholes
increases. Meikle et al (2002) have solved the
problem of overlapping projections by the use
of iterative estimation, originally derived from
the coded aperture approach [Barrett, 2001].
As for the second type of Small animal
SPECT, solid-state detectors provide a
promising alternative technology as compact
high-resolution gamma cameras.
Semiconductor detector technology is the new
horizon in dedicated instruments for high-
resolution nuclear imaging and such solid-state
detectors with direct γ-ray conversion such as
CdTe and CdZnTe have been proposed. The
requirements for a good detector for SPECT,
i.e., high spatial resolution, high energy
resolution, and good efficiency for the
detection of medium energy γ rays, are only
partially fulfilled by solutions based on
scintillators / photomultipliers as in PET,
especially due to the low energy resolution of
scintillators and the relatively low (25-35%)
quantum efficiency of the photodetector. A
direct conversion solid state detector offers a
much higher quantum efficiency and energy
resolution and its granularity is now well in the
range of the necessary high spatial resolution,
whereas its intrinsic efficiency does not create
severe DOI contribution, e.g. the mean free
path of a 140.5 keV in CdTe is about 2,4 mm.
The major concern for the development of the
next generation of PET systems for small-
animal imaging is the improvement of
sensitivity, always pushing the spatial
resolution close to its intrinsic limit. On the
other side, small-animal SPECT has almost
reached its resolution limit of fractions of mm.
In this case, the main challenge is to increase
the sensitivity and especially the field of view
in order to obtain ultrahigh-resolution systems
able to visualize the entire animal in one shot.
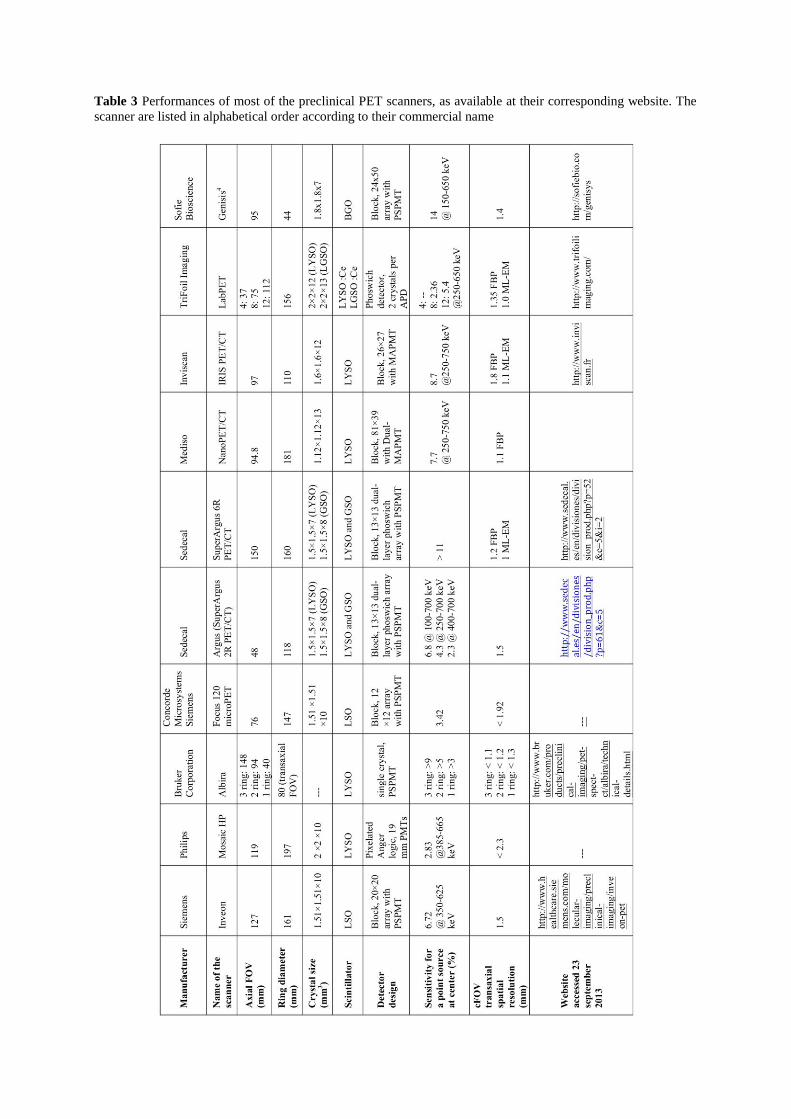
Table 3 Performances of most of the preclinical PET scanners, as available at their corresponding website. The
scanner are listed in alphabetical order according to their commercial name
2.2.3 Small-Animal CT Imaging
Computed Tomography (CT) is one of the
most used techniques of noninvasive
diagnosis, which provides a 3-D map of the
local X-ray attenuation properties of the
scanned patient. Dedicated scanners for small
animal have been built in the last decades
[Paulus et al., 2000; Stock, 2008], with the
main goal of obtaining a very high resolution,
down to tens of micron and a large field of
view so that a scan of the entire animal can be
performed in less than one minute. This is
obtained by using x-ray tubes with very small
tungsten anode focal spot (10 micron) and
low to medium x-ray energy (30-50 kVp). A
large detector, such as magnified CCDs or a
CMOS flat panel with a typical pixel size of 50
micron is used combined with high geometric
magnification. The entire system rotates
around the animal as in clinical CT in a cone-
geometry configuration. Spiral CTs are also
implemented. One critical issue for obtaining
the design performances is that misalignments
in the detectors are kept under strict control
during the construction and the use of the CT.
This can be done with various techniques, with
and without special phantoms [Panetta et
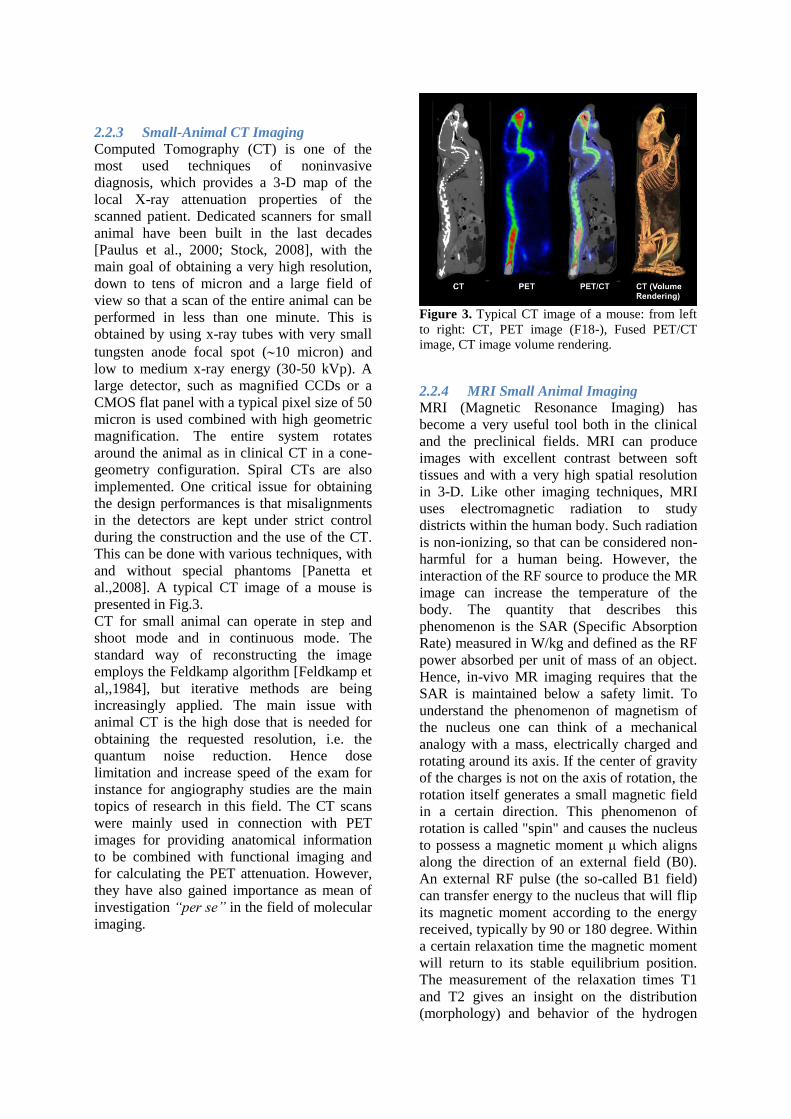
al.,2008]. A typical CT image of a mouse is
presented in Fig.3.
CT for small animal can operate in step and
shoot mode and in continuous mode. The
standard way of reconstructing the image
employs the Feldkamp algorithm [Feldkamp et
al,,1984], but iterative methods are being
increasingly applied. The main issue with
animal CT is the high dose that is needed for
obtaining the requested resolution, i.e. the
quantum noise reduction. Hence dose
limitation and increase speed of the exam for
instance for angiography studies are the main
topics of research in this field. The CT scans
were mainly used in connection with PET
images for providing anatomical information
to be combined with functional imaging and
for calculating the PET attenuation. However,
they have also gained importance as mean of
investigation “per se” in the field of molecular
imaging.
Figure 3. Typical CT image of a mouse: from left
to right: CT, PET image (F18-), Fused PET/CT
image, CT image volume rendering.
2.2.4 MRI Small Animal Imaging
MRI (Magnetic Resonance Imaging) has
become a very useful tool both in the clinical
and the preclinical fields. MRI can produce
images with excellent contrast between soft
tissues and with a very high spatial resolution
in 3-D. Like other imaging techniques, MRI
uses electromagnetic radiation to study
districts within the human body. Such radiation
is non-ionizing, so that can be considered non-
harmful for a human being. However, the
interaction of the RF source to produce the MR
image can increase the temperature of the
body. The quantity that describes this
phenomenon is the SAR (Specific Absorption
Rate) measured in W/kg and defined as the RF
power absorbed per unit of mass of an object.
Hence, in-vivo MR imaging requires that the
SAR is maintained below a safety limit. To
understand the phenomenon of magnetism of
the nucleus one can think of a mechanical
analogy with a mass, electrically charged and
rotating around its axis. If the center of gravity
of the charges is not on the axis of rotation, the
rotation itself generates a small magnetic field
in a certain direction. This phenomenon of
rotation is called "spin" and causes the nucleus
to possess a magnetic moment μ which aligns
along the direction of an external field (B0).
An external RF pulse (the so-called B1 field)
can transfer energy to the nucleus that will flip
its magnetic moment according to the energy
received, typically by 90 or 180 degree. Within
a certain relaxation time the magnetic moment
will return to its stable equilibrium position.
The measurement of the relaxation times T1
and T2 gives an insight on the distribution
(morphology) and behavior of the hydrogen
(i.e., of the water) in the body (physiology).
The phenomenon of magnetic resonance can
be investigated using different types of nuclei
(1-H, 13-C, 19-F, 23-Na, and 31-P) with
proper RF operating frequency to match the
Larmor frequency of the nucleus under study.
For small animal imaging MRI is a very
versatile technique, capable of providing a
very high spatial resolution (100 micron or
less) for rodents. The strength of the magnetic
field may vary from 0.5 to 9.4 T according to
the application and of course to the cost of the
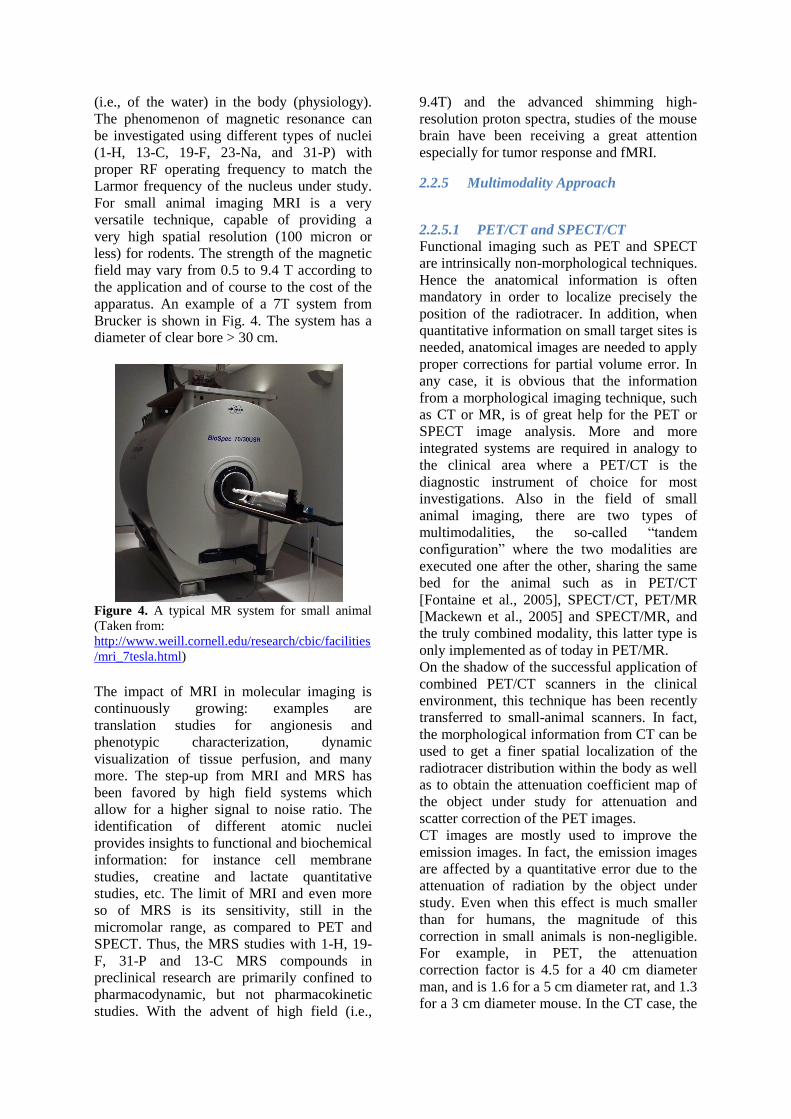
apparatus. An example of a 7T system from
Brucker is shown in Fig. 4. The system has a
diameter of clear bore > 30 cm.
Figure 4. A typical MR system for small animal
(Taken from:
http://www.weill.cornell.edu/research/cbic/facilities
/mri_7tesla.html)
The impact of MRI in molecular imaging is
continuously growing: examples are
translation studies for angionesis and
phenotypic characterization, dynamic
visualization of tissue perfusion, and many
more. The step-up from MRI and MRS has
been favored by high field systems which
allow for a higher signal to noise ratio. The
identification of different atomic nuclei
provides insights to functional and biochemical
information: for instance cell membrane
studies, creatine and lactate quantitative
studies, etc. The limit of MRI and even more
so of MRS is its sensitivity, still in the
micromolar range, as compared to PET and
SPECT. Thus, the MRS studies with 1-H, 19-
F, 31-P and 13-C MRS compounds in
preclinical research are primarily confined to
pharmacodynamic, but not pharmacokinetic
studies. With the advent of high field (i.e.,
9.4T) and the advanced shimming high-
resolution proton spectra, studies of the mouse
brain have been receiving a great attention
especially for tumor response and fMRI.
2.2.5 Multimodality Approach
2.2.5.1 PET/CT and SPECT/CT
Functional imaging such as PET and SPECT
are intrinsically non-morphological techniques.
Hence the anatomical information is often
mandatory in order to localize precisely the
position of the radiotracer. In addition, when
quantitative information on small target sites is
needed, anatomical images are needed to apply
proper corrections for partial volume error. In
any case, it is obvious that the information
from a morphological imaging technique, such
as CT or MR, is of great help for the PET or
SPECT image analysis. More and more
integrated systems are required in analogy to
the clinical area where a PET/CT is the
diagnostic instrument of choice for most
investigations. Also in the field of small
animal imaging, there are two types of
multimodalities, the so-called “tandem
configuration” where the two modalities are
executed one after the other, sharing the same
bed for the animal such as in PET/CT
[Fontaine et al., 2005], SPECT/CT, PET/MR
[Mackewn et al., 2005] and SPECT/MR, and
the truly combined modality, this latter type is
only implemented as of today in PET/MR.
On the shadow of the successful application of
combined PET/CT scanners in the clinical
environment, this technique has been recently
transferred to small-animal scanners. In fact,
the morphological information from CT can be
used to get a finer spatial localization of the
radiotracer distribution within the body as well
as to obtain the attenuation coefficient map of
the object under study for attenuation and
scatter correction of the PET images.
CT images are mostly used to improve the
emission images. In fact, the emission images
are affected by a quantitative error due to the
attenuation of radiation by the object under
study. Even when this effect is much smaller
than for humans, the magnitude of this
correction in small animals is non-negligible.
For example, in PET, the attenuation
correction factor is 4.5 for a 40 cm diameter
man, and is 1.6 for a 5 cm diameter rat, and 1.3
for a 3 cm diameter mouse. In the CT case, the
attenuation coefficients are measured with a
continuous x-ray spectrum, ranging from 10 to
70 keV. Hence the CT-energy linear
attenuation coefficient (μCT, X) has to be
scaled to the 140.5 keV value for SPECT by a
linear formula and to the 511 keV for PET, by
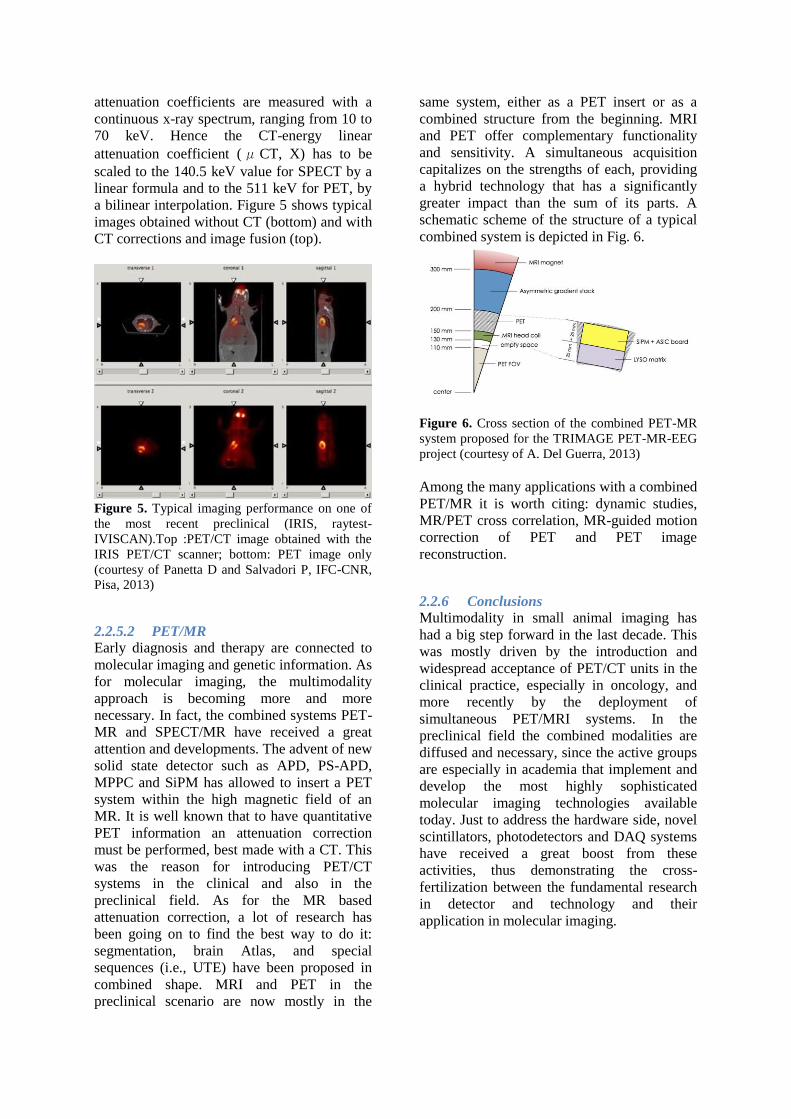
a bilinear interpolation. Figure 5 shows typical
images obtained without CT (bottom) and with
CT corrections and image fusion (top).
Figure 5. Typical imaging performance on one of
the most recent preclinical (IRIS, raytest-
IVISCAN).Top :PET/CT image obtained with the
IRIS PET/CT scanner; bottom: PET image only
(courtesy of Panetta D and Salvadori P, IFC-CNR,
Pisa, 2013)
2.2.5.2 PET/MR
Early diagnosis and therapy are connected to
molecular imaging and genetic information. As
for molecular imaging, the multimodality
approach is becoming more and more
necessary. In fact, the combined systems PET-
MR and SPECT/MR have received a great
attention and developments. The advent of new
solid state detector such as APD, PS-APD,
MPPC and SiPM has allowed to insert a PET
system within the high magnetic field of an
MR. It is well known that to have quantitative
PET information an attenuation correction
must be performed, best made with a CT. This
was the reason for introducing PET/CT
systems in the clinical and also in the
preclinical field. As for the MR based
attenuation correction, a lot of research has
been going on to find the best way to do it:
segmentation, brain Atlas, and special
sequences (i.e., UTE) have been proposed in
combined shape. MRI and PET in the
preclinical scenario are now mostly in the
same system, either as a PET insert or as a
combined structure from the beginning. MRI
and PET offer complementary functionality
and sensitivity. A simultaneous acquisition
capitalizes on the strengths of each, providing
a hybrid technology that has a significantly
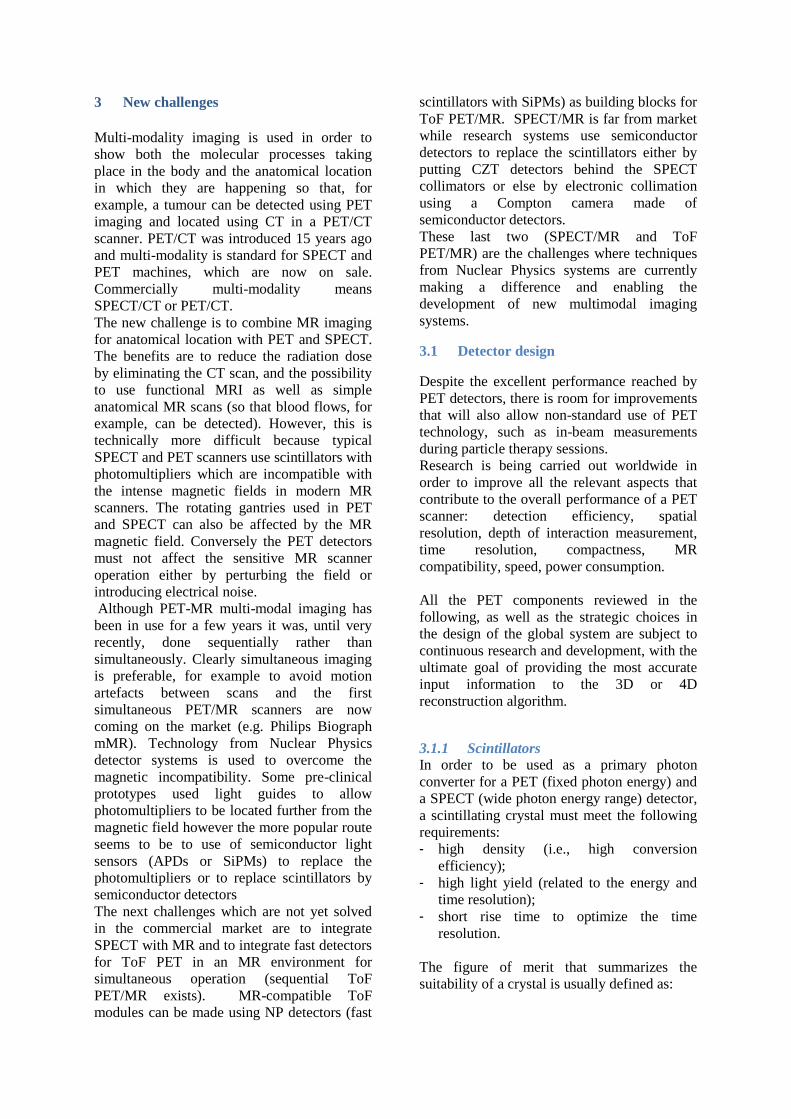
greater impact than the sum of its parts. A
schematic scheme of the structure of a typical
combined system is depicted in Fig. 6.
Figure 6. Cross section of the combined PET-MR
system proposed for the TRIMAGE PET-MR-EEG
project (courtesy of A. Del Guerra, 2013)
Among the many applications with a combined
PET/MR it is worth citing: dynamic studies,
MR/PET cross correlation, MR-guided motion
correction of PET and PET image
reconstruction.
2.2.6 Conclusions
Multimodality in small animal imaging has
had a big step forward in the last decade. This
was mostly driven by the introduction and
widespread acceptance of PET/CT units in the
clinical practice, especially in oncology, and
more recently by the deployment of
simultaneous PET/MRI systems. In the
preclinical field the combined modalities are
diffused and necessary, since the active groups
are especially in academia that implement and
develop the most highly sophisticated
molecular imaging technologies available
today. Just to address the hardware side, novel
scintillators, photodetectors and DAQ systems
have received a great boost from these
activities, thus demonstrating the cross-
fertilization between the fundamental research
in detector and technology and their
application in molecular imaging.
3 New challenges
Multi-modality imaging is used in order to
show both the molecular processes taking
place in the body and the anatomical location
in which they are happening so that, for
example, a tumour can be detected using PET
imaging and located using CT in a PET/CT
scanner. PET/CT was introduced 15 years ago
and multi-modality is standard for SPECT and
PET machines, which are now on sale.
Commercially multi-modality means
SPECT/CT or PET/CT.
The new challenge is to combine MR imaging
for anatomical location with PET and SPECT.
The benefits are to reduce the radiation dose
by eliminating the CT scan, and the possibility
to use functional MRI as well as simple
anatomical MR scans (so that blood flows, for
example, can be detected). However, this is
technically more difficult because typical
SPECT and PET scanners use scintillators with
photomultipliers which are incompatible with
the intense magnetic fields in modern MR
scanners. The rotating gantries used in PET
and SPECT can also be affected by the MR
magnetic field. Conversely the PET detectors
must not affect the sensitive MR scanner
operation either by perturbing the field or
introducing electrical noise.
Although PET-MR multi-modal imaging has
been in use for a few years it was, until very
recently, done sequentially rather than
simultaneously. Clearly simultaneous imaging
is preferable, for example to avoid motion
artefacts between scans and the first
simultaneous PET/MR scanners are now
coming on the market (e.g. Philips Biograph
mMR). Technology from Nuclear Physics
detector systems is used to overcome the
magnetic incompatibility. Some pre-clinical
prototypes used light guides to allow
photomultipliers to be located further from the
magnetic field however the more popular route
seems to be to use of semiconductor light
sensors (APDs or SiPMs) to replace the
photomultipliers or to replace scintillators by
semiconductor detectors
The next challenges which are not yet solved
in the commercial market are to integrate
SPECT with MR and to integrate fast detectors
for ToF PET in an MR environment for
simultaneous operation (sequential ToF
PET/MR exists). MR-compatible ToF
modules can be made using NP detectors (fast
scintillators with SiPMs) as building blocks for
ToF PET/MR. SPECT/MR is far from market
while research systems use semiconductor
detectors to replace the scintillators either by
putting CZT detectors behind the SPECT
collimators or else by electronic collimation
using a Compton camera made of
semiconductor detectors.
These last two (SPECT/MR and ToF
PET/MR) are the challenges where techniques
from Nuclear Physics systems are currently
making a difference and enabling the
development of new multimodal imaging
systems.
3.1 Detector design
Despite the excellent performance reached by
PET detectors, there is room for improvements
that will also allow non-standard use of PET
technology, such as in-beam measurements
during particle therapy sessions.
Research is being carried out worldwide in
order to improve all the relevant aspects that
contribute to the overall performance of a PET
scanner: detection efficiency, spatial
resolution, depth of interaction measurement,
time resolution, compactness, MR
compatibility, speed, power consumption.
All the PET components reviewed in the
following, as well as the strategic choices in
the design of the global system are subject to
continuous research and development, with the
ultimate goal of providing the most accurate
input information to the 3D or 4D
reconstruction algorithm.
3.1.1 Scintillators
In order to be used as a primary photon
converter for a PET (fixed photon energy) and
a SPECT (wide photon energy range) detector,
a scintillating crystal must meet the following
requirements:
- high density (i.e., high conversion
efficiency);
- high light yield (related to the energy and
time resolution);
- short rise time to optimize the time
resolution.
The figure of merit that summarizes the
suitability of a crystal is usually defined as:
η ~ ε2 √ N/τ
with ε, N, τ related to the crystal density, light
yield and decay time, respectively.
In addition, the technology must provide
uniform crystals at a low (acceptable) cost.
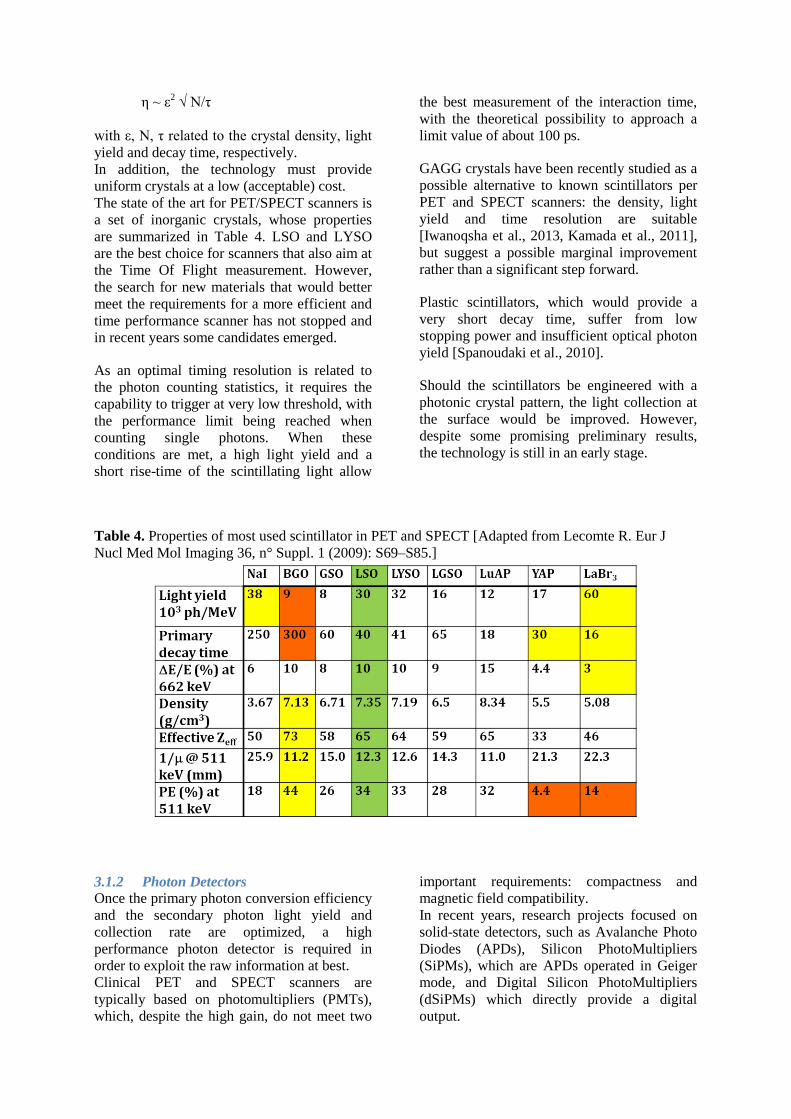
The state of the art for PET/SPECT scanners is
a set of inorganic crystals, whose properties
are summarized in Table 4. LSO and LYSO
are the best choice for scanners that also aim at
the Time Of Flight measurement. However,
the search for new materials that would better
meet the requirements for a more efficient and
time performance scanner has not stopped and
in recent years some candidates emerged.
As an optimal timing resolution is related to
the photon counting statistics, it requires the
capability to trigger at very low threshold, with
the performance limit being reached when
counting single photons. When these
conditions are met, a high light yield and a
short rise-time of the scintillating light allow
the best measurement of the interaction time,
with the theoretical possibility to approach a
limit value of about 100 ps.
GAGG crystals have been recently studied as a
possible alternative to known scintillators per
PET and SPECT scanners: the density, light
yield and time resolution are suitable
[Iwanoqsha et al., 2013, Kamada et al., 2011],
but suggest a possible marginal improvement
rather than a significant step forward.
Plastic scintillators, which would provide a
very short decay time, suffer from low
stopping power and insufficient optical photon
yield [Spanoudaki et al., 2010].
Should the scintillators be engineered with a
photonic crystal pattern, the light collection at
the surface would be improved. However,
despite some promising preliminary results,
the technology is still in an early stage.
Table 4. Properties of most used scintillator in PET and SPECT [Adapted from Lecomte R. Eur J
Nucl Med Mol Imaging 36, n° Suppl. 1 (2009): S69–S85.]
3.1.2 Photon Detectors
Once the primary photon conversion efficiency
and the secondary photon light yield and
collection rate are optimized, a high
performance photon detector is required in
order to exploit the raw information at best.
Clinical PET and SPECT scanners are
typically based on photomultipliers (PMTs),
which, despite the high gain, do not meet two
important requirements: compactness and
magnetic field compatibility.
In recent years, research projects focused on
solid-state detectors, such as Avalanche Photo
Diodes (APDs), Silicon PhotoMultipliers
(SiPMs), which are APDs operated in Geiger
mode, and Digital Silicon PhotoMultipliers
(dSiPMs) which directly provide a digital
output.
APDs, that are insensitive to magnetic fields,
were used for the first commercial PET/MR
scanner [Schmand et al., 2007]; however their
drawbacks (low gain and long rise time), make
them unsuitable for high performance TOF-
PET.
SiPMs, on the other hand, besides meeting the
requirements of compactness and magnetic
filed insensitivity, present very interesting
advantages: low bias voltage makes them even
more attractive than APDs for hybrid PET/MR
imaging, while high gain and short rise time
make them the best candidates for TOF-PET.
The short rise-time and the high level of
homogeneity of SiPM matrix components
should be compatible with a time resolution
that could approach the lower limit of 100 ps.
In addition, the high gain could allow single
photon counting, which, if the dark count rate
is kept under control with active cooling,
would make it possible to design a detector
that couples continous crystals to segmented
SiPM matrices.
dSiPMs, developed by Philips [Degenhardt et
al., 2009], [Degenhardt et al., 2010] [Frach et
al., 2009], are based on the integration within
the SiPM sensitive area of basic processing
electronics and eliminate the need for external
processing [Philips, 2010]. Each micro-cell of
the array is connected to an integrated counter
and an integrated TDC that provide the energy
and time information, respectively. dSiPM
coupled to LYSO crystals reach time
resolutions as low as 150 ps (FWHM). The
different performances are summarized in
Table 5.
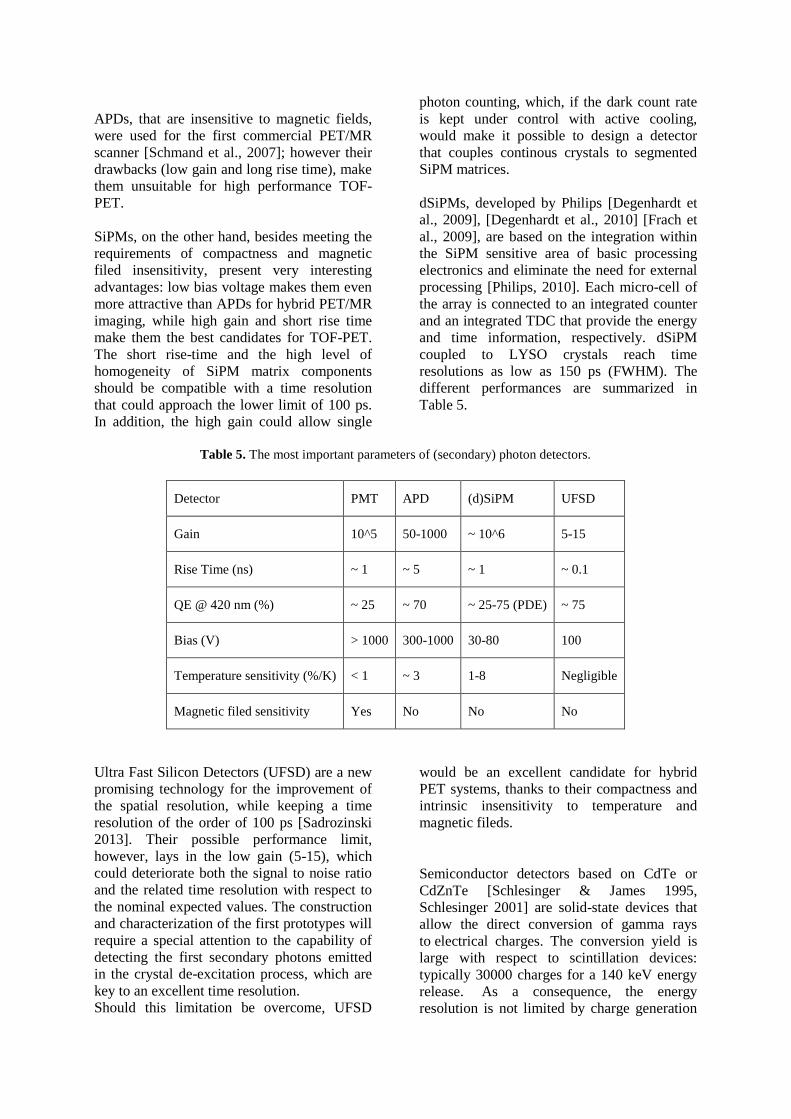
Table 5. The most important parameters of (secondary) photon detectors.
Detector PMT APD (d)SiPM UFSD
Gain 10^5 50-1000 ~ 10^6 5-15
Rise Time (ns) ~ 1 ~ 5 ~ 1 ~ 0.1
QE @ 420 nm (%) ~ 25 ~ 70 ~ 25-75 (PDE) ~ 75
Bias (V) > 1000 300-1000 30-80 100
Temperature sensitivity (%/K) < 1 ~ 3 1-8 Negligible
Magnetic filed sensitivity Yes No No No
Ultra Fast Silicon Detectors (UFSD) are a new
promising technology for the improvement of
the spatial resolution, while keeping a time
resolution of the order of 100 ps [Sadrozinski
2013]. Their possible performance limit,
however, lays in the low gain (5-15), which
could deteriorate both the signal to noise ratio
and the related time resolution with respect to
the nominal expected values. The construction
and characterization of the first prototypes will
require a special attention to the capability of
detecting the first secondary photons emitted
in the crystal de-excitation process, which are
key to an excellent time resolution.
Should this limitation be overcome, UFSD
would be an excellent candidate for hybrid
PET systems, thanks to their compactness and
intrinsic insensitivity to temperature and
magnetic fileds.
Semiconductor detectors based on CdTe or
CdZnTe [Schlesinger & James 1995,
Schlesinger 2001] are solid-state devices that
allow the direct conversion of gamma rays
to electrical charges. The conversion yield is
large with respect to scintillation devices:
typically 30000 charges for a 140 keV energy
release. As a consequence, the energy
resolution is not limited by charge generation
statistics but by other phenomena like
electrical noise or material uniformity. While
the best devices achieve less than 2% of
resolution at 140 keV thanks to an optimized
design, typical resolution values by standard
systems are close to 5% at 140 keV [Eisen
2004, Verger 2004, Meng 2009] a value that
can help the development of dual-isotope
imaging protocols [Ben-Haim 2010].
The spatial resolution of these semiconductor
detectors can be extremely good as it is not
limited by light spreading and photon statistics
but rather by the readout circuitry. A typical
device resolution is of the order of 2.5 mm, but
the use of high density readout [Meng 2009] or
sub-pixel positioning electronics [Montemont
2012] allows to obtain an intrinsic resolution
of few hundreds of micrometers (200-400µm).
CdTe or CdZnTe-based detectors are
integrated in small modules that couple the
semiconductor crystals and the readout
electronics on the same substrate. System
designers have taken profit of the compactness
of such modules to build innovative SPECT
tomographs [Bocher 2010, Erlandsson
2009,Ben-Haim 2010] that exploit the
modularity to enhance sensitivity and
resolution by focusing of a given region of
interest. Additionally, these systems also
avoid the motion of the camera head around
the patient.
3.1.3 Front-End Electronics
Front-end electronics is becoming a key
enabling technology (KET) for detectors due
to the increasing number of channels and the
high level of integration that allows to reduce
cost and dimensions. A general trend is to
integrate more and more functions in ASICs
(amplification, filtering, digitization, signal
processing) making them Systems on Chip
(SoC). These multi-channel ASICs also tend to
move closer or even onto the detectors,
minimizing the connections and improving
both performance and reliability. This
localization coupled to the increasing number
of channels requires in turn low-power design
so that the performance and compacity
obtained are not spoilt by large cooling
systems. The evolution of microelectronics
technologies allows this increase of
performance together with power reduction
and higher operating speeds, an important
feature for reducing the patients exposure
while maintaining high quality resolution.
Such a design is also useful from the point of
view of the system performance, since it
allows more accurate timing measurements
that improve the noise and background
reduction and therefore provide better quality
images with lower doses delivered to patients.
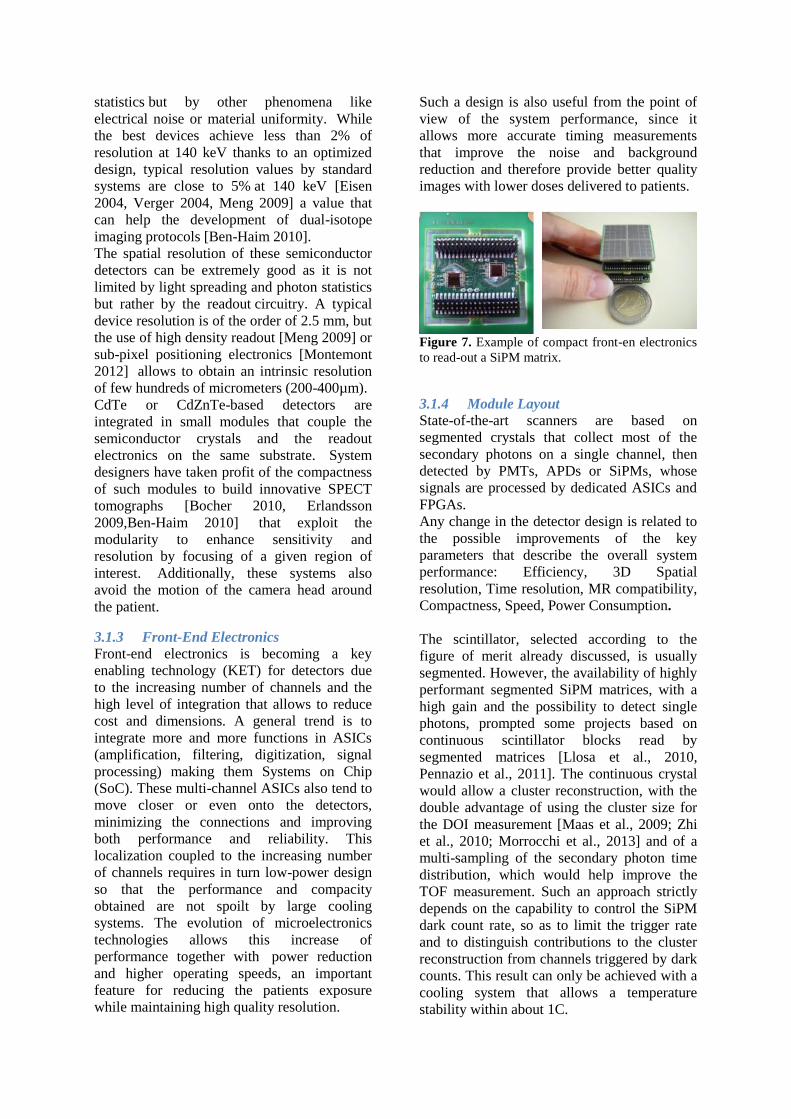
Figure 7. Example of compact front-en electronics
to read-out a SiPM matrix.
3.1.4 Module Layout
State-of-the-art scanners are based on
segmented crystals that collect most of the
secondary photons on a single channel, then
detected by PMTs, APDs or SiPMs, whose
signals are processed by dedicated ASICs and
FPGAs.
Any change in the detector design is related to
the possible improvements of the key
parameters that describe the overall system
performance: Efficiency, 3D Spatial
resolution, Time resolution, MR compatibility,
Compactness, Speed, Power Consumption.
The scintillator, selected according to the
figure of merit already discussed, is usually
segmented. However, the availability of highly
performant segmented SiPM matrices, with a
high gain and the possibility to detect single
photons, prompted some projects based on
continuous scintillator blocks read by
segmented matrices [Llosa et al., 2010,
Pennazio et al., 2011]. The continuous crystal
would allow a cluster reconstruction, with the
double advantage of using the cluster size for
the DOI measurement [Maas et al., 2009; Zhi
et al., 2010; Morrocchi et al., 2013] and of a
multi-sampling of the secondary photon time
distribution, which would help improve the
TOF measurement. Such an approach strictly
depends on the capability to control the SiPM
dark count rate, so as to limit the trigger rate
and to distinguish contributions to the cluster
reconstruction from channels triggered by dark
counts. This result can only be achieved with a
cooling system that allows a temperature
stability within about 1C.
SiPMs (analog or digital) are the photon
detector of choice for almost every ongoing
research project: they are efficient, with very
high gain, single photon counting capabilities,
very high spatial resolution, excellent time
resolution (with intrinsic resolution among the
different cell contributions to a matrix element
quite close to 100 ps). They are also compact,
compatible with operations in a magnetic field
and acceptably priced.
Custom front-end electronics developments
mostly focus on optimizing the TOF
measurement, so as to reach an overall
resolution below 200 ps. If the scintillator rise-
time and the photon detector signal formation
time are short enough and the detector
uniformity in the time response is good (as it is
for the latest SiPM matrices available on the
market), the front-end electronics contribution
can become the main source that contributes to
the system time resolution. Whether the crystal
is segmented or continuous, the key to
optimize the time resolution is the capability to
identify the first photon(s) from the crystal
deexcitation and to distinguish them from the
spurious dark count signals. With a segmented
crystal, the analysis of the rising signal shape
is the clue, while in the case of a continuous
crystal, where the threshold must be as low as
required to detect single photons, the cluster
analysis algorithm must be able to distinguish
true signals from dark count background
events.
The need of precise temperature control and
uniformity is also being addressed by
designing active cooling systems that are very
important to keep the system performance
constant.
System compactness and MR design
compatibility are also provided by the choice
of solid-state photon detectors such as SiPMs.
3.2 Simulation and reconstruction
Contrary to planar imaging, which includes
scintigraphy, or radiography, tomographic
images are not directly obtained from the
measurements, but are the result of the so-
called tomographic or image reconstruction
process. Classically, the goal of tomographic
reconstruction is to obtain the image of an
“object” from its “projections”, where the
object might be an attenuating medium (CT) or
a radioisotope distribution (PET, SPECT or
Compton cameras). Tomographic image
reconstruction is a process based on
mathematical algorithms which are
implemented in computers. Although a
mathematical solution for the problem of
tomographic reconstruction was first proposed
in 1917, the advent of modern computers made
CT a reality. Computers are also essential to
simulate the complex physical phenomena
which underlie the image formation process,
such as the behaviour of optical photons within
scintillation materials, the radioisotope decay
and subsequent radiation emission, etc. The
continuously increasing computing power has
allowed for the development of more
sophisticated image reconstruction algorithms,
and more detailed and accurate simulations of
tomographic systems. In this section, we will
present state-of-the-art research and most
recent advances in image reconstruction and
simulations.
3.2.1 Image Reconstruction
Traditionally, a tomographic image
corresponds to a plane section (2D image) of
the object under inspection. A volume (3D
image) was thus constructed by aligning
several reconstructed sections. Nowadays,
modern reconstruction techniques can directly
provide 3D images (fully 3D reconstruction)
and 4D images if time is also taken into
account. 4D image reconstruction is
particularly useful in cardiac PET and SPECT,
or to image regions affected by respiratory
motion, and it is essential in dynamic emission
tomography, whose goal is to study the
concentration of the injected tracer over time.
At present, there are several image
reconstruction algorithms, which can be
grossly divided into two categories: analytic
and iterative reconstruction methods. Analytic
reconstruction methods are based on a direct
mathematical solution, and are still widely
used for CT reconstruction. However, the
assumptions on which analytical methods are
based on, usually do not hold in emission
tomography.
Compared to analytical reconstruction, the
main advantage of iterative methods is their
ability to include a more accurate description
of the imaging process, which in turn, usually
leads to better images. This is specially the
case when the measurements are noisy, or
when the imaging device cannot provide
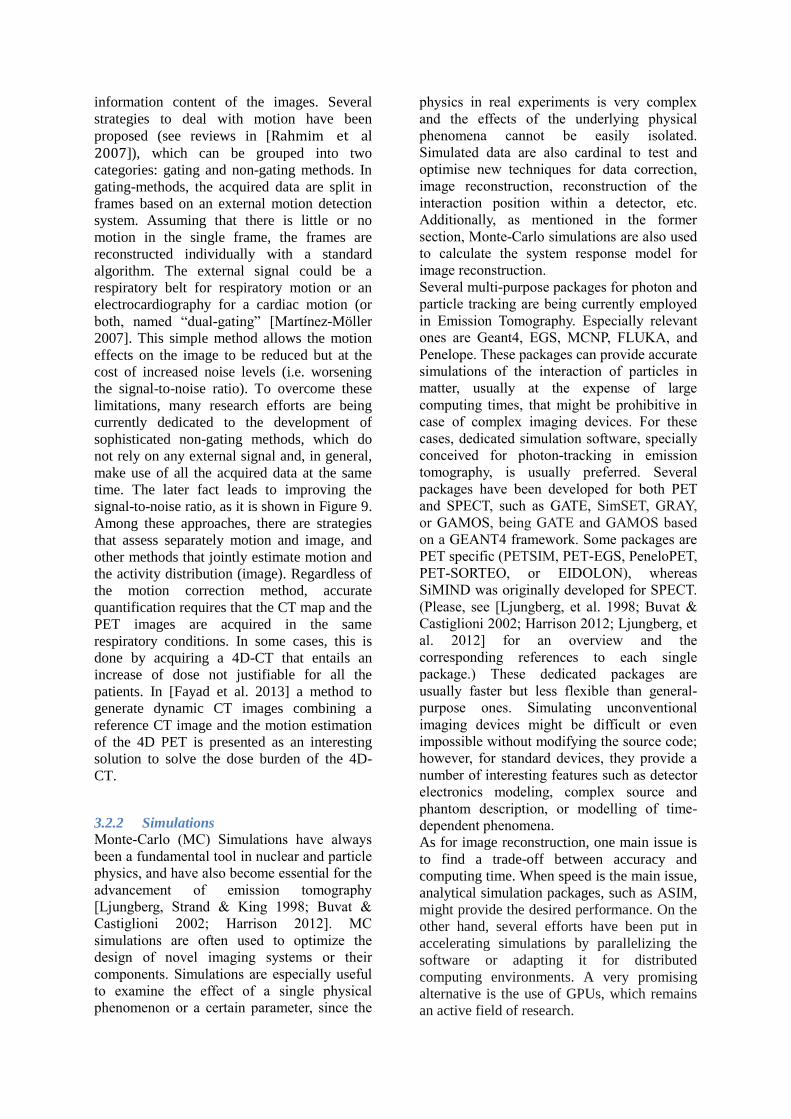
uniform or complete sampling (see Fig. 8).
Therefore, iterative reconstruction methods are
the preferred ones in Emission Tomography,
although analytical methods, such as Filtered
Backprojection (FBP) are still used for
quantitative image analysis in spite of their
limitations.
The goal of iterative reconstruction techniques
is to find an image estimate by successive
steps. In the last decades, a wide variety of
algorithms have been presented. We refer the
interested reader to some excellent reviews [Qi
& Leahy 1998; Bruyant 2002; Lewitt & Matej
2003; Defrise & Gullberg 2006].
Most iterative reconstruction techniques share
the same “ingredients”: models for the image,
the data and the imaging system, an objective
function, and an optimization algorithm. The
underlying physics of the image formation and
degradation phenomena can be taken into
account in the choice and description of the
models, as well as in the design of the cost
function, as will be described in the following
paragraphs.
3.2.1.1 Physics & Iterative Image
Reconstruction in Emission
Tomograhy
One of the main strengths of iterative
algorithms relies on their ability to include
accurate models of the underlying physics,
which include the statistical nature of
radioactive decay or radiation detection, and
the interaction of radiation in matter. The
statistical nature is contemplated within the
data model. Most commonly used
reconstruction techniques are based on a
Poisson model; this model naturally leads to
the Maximum-Likelihood (ML) criterion to
determine which image is the best estimate of
the true object.
The behaviour of the imaging device is
described within the so-called system response
model or system response matrix (SRM). In
PET or SPECT, the elements of the SRM
correspond to the detection probability of
gamma rays originating from a certain
location. In the first place, the effects of the
geometry and arrangement of the detector
elements on the detection (and the collimator
in SPECT) should be modeled. The system
model can also include a description of crystal
penetration effects, cross-talk, inter-crystal
scatter, etc. In principle, the more effects are
correctly modelled and included within the
SRM, the better the reconstructed image.
However, computing the SRM for a certain
device can be very challenging given the
dimensions of the matrix, which corresponds
to NxM, being N and M the number of data
and image elements, respectively. For a
conventional clinical PET scanner, N can be
larger than 108, and the image might be
composed by several millions of voxels. The
more physical effects are contemplated, the
less sparse the SRM becomes. Several
techniques have been proposed to compute and
handle the SRM. The factorization of the SRM
in several components makes it easier to
calculate and store the SRM, and to handle it
during the reconstruction [Qi & Leahy 1998].
Monte-Carlo simulations have been proved to
be a very useful tool to compute the whole
SRM or several of its components for PET
[Rafecas et al. 2004] and SPECT [Lazaro et al.
2005]. Approaches based on measurements can
provide very realistic models for the Point
Spread Function [Panin, et al. 2006].
Analytical models usually allow for faster but
less accurate alternatives [Aguiar et al. 2010];
Analytical comprehensive models have been
also proposed but its computational cost can be
prohibitive. In any case, since the factorisation
of the system matrix allows the contribution of
the various physical phenomena to be
calculated separately, different approaches can
be combined to calculate the various
components of the system response model.
Finding a balance between computation cost
and model accuracy is currently a very active
field of research.
Patient-dependent effects such as attenuation
or scatter can be also included within the
reconstruction process. Attenuation factors,
previously obtained from CT, MRI or
additional measurements, are built within the
SRM. Some attempts have been done to
include object scatter within the SRM, for
example using Monte-Carlo simulations
[Rehfeld & Alber 2007]; however, the most
common approach is to use the scatter estimate
within the comparison step of the iterative
algorithm. In this step, the measured data are
compared to the ideal data which would have
been measured for an object being described
by the last image estimate. For PET, the
contribution of accidental coincidences can be
also taken into account in the comparison step.
As mentioned above, the increasing number of
detection channels, and the subsequent need of
smaller image elements poses several
challenges in the computation and handling of
the SRM. Many efforts have been put in the
last years to optimise the balance between
accurate models and computational efficiency.
A way to avoid the storage of the SRM is to
calculate the system model on-the-fly. This
approach is usually the one chosen when
dealing with “list-mode data”, i.e., the
measured data are not compressed into
histograms (such as sinograms), but are stored
accorded to the registration time. List-mode
reconstruction [Barret et al. 1997] makes it
possible that the whole information contained
in the data is preserved and exploited. This is
done usually at the cost of simplified system
models, since the latter are calculated on the
fly; however, fast but accurate system models
for list-mode reconstruction, usually based on
analytical approaches, have been proposed
lately [Pratx & Levin 2011].
Time information is the key in Time-of-Flight
(ToF) PET, which requires dedicated
algorithms to exploit the location constraint for
the positron-electron annihilation provided by
the time difference in the arrival of the two
annihilation photons. This technology, already
proposed in the eighties has been recently
translated into clinical PET. In combination
with TOF dedicated algorithms, TOF PET
allows image quality (in terms of SNR and
lesion detectability) to be improved [Conti et
al. 2009]
Concerning the image model, rectangular
voxels are the preferred options. In the last
years, spherical based functions (“blobs”)
[Lewitt 1992] have deserved renewed attention
given their ability to reduce image noise, but
usually at the cost of higher computational
cost. Other potentially interesting alternatives
are polar pixels, which allow the symmetries
of the imaging device to be exploited [Israel-
Jost, et al. 2006] or those based on irregular
grids [Boutchko et al. 2013].
The cost function and its optimization are the
“core” of a reconstruction algorithm. Most
widely used techniques are based on the
optimization of the aforementioned ML
criterion, being the Maximum-Likelihood-
Expectation-Maximization algorithm (MLEM)
and its accelerated version Ordered-Subsets-
Expectation-Maximization algorithm (OSEM)
the most popular ones. However, the ML
estimation problem is ill-conditioned, which
translates that the unavoidable noise in the data
causes noisy images. Noise regularization is
thus needed, which can be achieved through
early stopping (before convergence), post-
reconstruction smoothing, or by adding a
penalty function in the objective function. The
latter approach can also be derived if the
problem is formulated in a Bayesian
framework (Maximum-A-Priori algorithm,
MAP). The penalty function (or prior) might
also include some anatomical information of
the patient obtained from a CT or MRI [Gindi
et al. 1993]. Compressed sensing (CS)
reconstruction approaches and CS-based Total-
variation (TV) regularization are earning much
interest in the community, especially for CT
[Tang et al. 2009]. TV priors offer a promising
alternative to compensate for missing data, as
those arising from gaps between detectors or
partial PET ring configurations.
3.2.1.2 Accelerating Iterative Image
Reconstruction
One of the main drawbacks of iterative image
reconstruction is its computational cost. Not
only the calculation of the system response
matrix might be computer expensive, but also
the image reconstruction process as such.
Therefore, much effort has been devoted to
accelerate the reconstruction process, which
remains an active field of research. Some of
the proposed approaches rely on parallel
computing using clusters, or multicore
architectures; the use of Graphical Processor
Units (GPUs) has earned much attention in the
last years, as a cost-effective alternative [Pratx,
& Xing 2011] especially useful for TOF PET.
A completely different approach is to
implement the reconstruction within a Field
Programmable Gate Array (FPGA).
3.2.1.3 Image quality, quantification and
compensation of degradation
phenomena in ET
Tomographic images can be employed for
different purposes. PET and SPECT are
commonly used for diagnostics and therapy
follow-up in clinical routine. More recently,
PET images are also used for tumour
delineation in radiotherapy planning. At the
same time, emission tomography of rodents
and larger animals (such as monkeys for
neurosciences and pigs for cardiology) is a
common tool in biomedical research, or
pharmacology. It is obvious that, for any of
these applications, the quality of the image
should be “as good as possible”. On the other
hand, the kind of information to be extracted
from a reconstructed image depends on the
final purpose: visual inspection, lesion
detection, quantification of certain
physiological parameters, etc. [Kupinski
2012]. In the end, this purpose will determine
which are the main properties or characteristics
that a “good image” should exhibit and which,
in turn, the reconstruction algorithms of choice
should be able to provide.
Quantitative image analysis (quantification)
consists in extracting certain parameters of
interest from an image, for example tracer
uptake. To obtain quantitative information, a
linear relationship is required between image
voxel values and activity concentration. For
this purpose, several effects need to be
accounted for; some of these effects are related
to the underlying physics and image formation
processes and are thus unavoidable, but can be
compensated for. This is the case of attenuation
and Compton scattering in the patient,
Compton scattering in the detectors, partial
volume effects, variable spatial resolution
across the Field-of-View. In PET, also
accidental coincidences might be a source of
inaccuracy. Truncation artefacts due to limited-
angle geometries, or ring artefacts also hinder
quantification. Motivated by the advancement
of novel technologies such as TOF-PET or
PET/MR, novel methods able to compensate
for attenuation by simultaneously estimating
the activity distribution and the attenuation
have been proposed [Salomon 2011].
One main source of image degradation is
patient and organ motion. Specially cardiac
and respiratory motion (in thorax or abdominal
examinations), and involuntary head motion in
brain studies might strongly distort the
information content of the images. Several
strategies to deal with motion have been
proposed (see reviews in [Rahmim et al 2007]), which can be grouped into two
categories: gating and non-gating methods. In
gating-methods, the acquired data are split in
frames based on an external motion detection
system. Assuming that there is little or no
motion in the single frame, the frames are
reconstructed individually with a standard
algorithm. The external signal could be a
respiratory belt for respiratory motion or an
electrocardiography for a cardiac motion (or
both, named “dual-gating” [Martínez-Möller
2007]. This simple method allows the motion
effects on the image to be reduced but at the
cost of increased noise levels (i.e. worsening
the signal-to-noise ratio). To overcome these
limitations, many research efforts are being
currently dedicated to the development of
sophisticated non-gating methods, which do
not rely on any external signal and, in general,
make use of all the acquired data at the same
time. The later fact leads to improving the
signal-to-noise ratio, as it is shown in Figure 9.
Among these approaches, there are strategies
that assess separately motion and image, and
other methods that jointly estimate motion and
the activity distribution (image). Regardless of
the motion correction method, accurate
quantification requires that the CT map and the
PET images are acquired in the same
respiratory conditions. In some cases, this is
done by acquiring a 4D-CT that entails an
increase of dose not justifiable for all the
patients. In [Fayad et al. 2013] a method to
generate dynamic CT images combining a
reference CT image and the motion estimation
of the 4D PET is presented as an interesting
solution to solve the dose burden of the 4D-
CT.
3.2.2 Simulations
Monte-Carlo (MC) Simulations have always
been a fundamental tool in nuclear and particle
physics, and have also become essential for the
advancement of emission tomography
[Ljungberg, Strand & King 1998; Buvat &
Castiglioni 2002; Harrison 2012]. MC
simulations are often used to optimize the
design of novel imaging systems or their
components. Simulations are especially useful
to examine the effect of a single physical
phenomenon or a certain parameter, since the
physics in real experiments is very complex
and the effects of the underlying physical
phenomena cannot be easily isolated.
Simulated data are also cardinal to test and
optimise new techniques for data correction,
image reconstruction, reconstruction of the
interaction position within a detector, etc.
Additionally, as mentioned in the former
section, Monte-Carlo simulations are also used
to calculate the system response model for
image reconstruction.
Several multi-purpose packages for photon and
particle tracking are being currently employed
in Emission Tomography. Especially relevant
ones are Geant4, EGS, MCNP, FLUKA, and
Penelope. These packages can provide accurate
simulations of the interaction of particles in
matter, usually at the expense of large
computing times, that might be prohibitive in
case of complex imaging devices. For these
cases, dedicated simulation software, specially
conceived for photon-tracking in emission
tomography, is usually preferred. Several
packages have been developed for both PET
and SPECT, such as GATE, SimSET, GRAY,
or GAMOS, being GATE and GAMOS based
on a GEANT4 framework. Some packages are
PET specific (PETSIM, PET-EGS, PeneloPET,
PET-SORTEO, or EIDOLON), whereas
SiMIND was originally developed for SPECT.
(Please, see [Ljungberg, et al. 1998; Buvat &
Castiglioni 2002; Harrison 2012; Ljungberg, et
al. 2012] for an overview and the
corresponding references to each single
package.) These dedicated packages are
usually faster but less flexible than general-
purpose ones. Simulating unconventional
imaging devices might be difficult or even
impossible without modifying the source code;
however, for standard devices, they provide a
number of interesting features such as detector
electronics modeling, complex source and
phantom description, or modelling of time-
dependent phenomena.
As for image reconstruction, one main issue is
to find a trade-off between accuracy and
computing time. When speed is the main issue,
analytical simulation packages, such as ASIM,
might provide the desired performance. On the
other hand, several efforts have been put in
accelerating simulations by parallelizing the
software or adapting it for distributed
computing environments. A very promising
alternative is the use of GPUs, which remains
an active field of research.
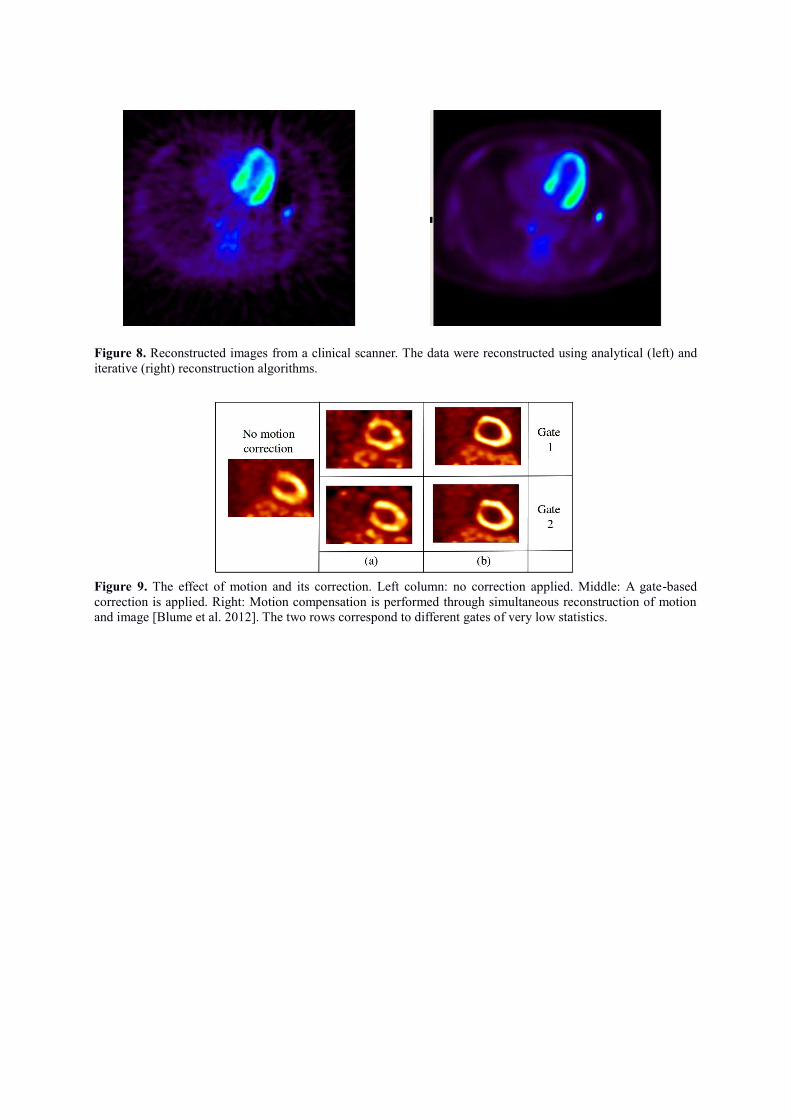
Figure 8. Reconstructed images from a clinical scanner. The data were reconstructed using analytical (left) and
iterative (right) reconstruction algorithms.
Figure 9. The effect of motion and its correction. Left column: no correction applied. Middle: A gate-based
correction is applied. Right: Motion compensation is performed through simultaneous reconstruction of motion
and image [Blume et al. 2012]. The two rows correspond to different gates of very low statistics.
3.3 Photon counting: towards spectral CT
Hybrid pixel arrays applied to X-ray detection
might provide a new generation of digital X-
ray photon counting cameras that can replace
conventional “charge integration” CMOS and
CCD cameras used in X-ray Computerized
Tomography (CT). Applied to the detection of
X-rays, this technological breakthrough, which
was originally developed for the construction
of vertex detectors used in high energy physics
experiments, can provide spectral information
on the X-rays transmitted through an object.
Thus, the current advent of X-ray photon
counting cameras enables the development of
spectral CT: a novel intrinsic anatomical and
functional imaging modality that will
hopefully open a new door in the field in
molecular imaging.
3.3.1 Photon counting with hybrid pixels
Hybrid pixel detectors [Wermes 2005] form a
new generation of digital X-ray cameras
working in photon counting mode that can
replace conventional “charge integration”
CMOS and CCD cameras used in X-ray
Computerized Tomography (CT). This novel
approach involves several advantages
[Yorkston 2007], such as the absence of dark
noise, a high dynamic range and photon energy
discrimination.
The development of hybrid pixels was initiated
for the construction of vertex detectors used in
particle physics experiments to observe
charged particle pathways with high timing
and spatial accuracies. Hybrid pixels detectors
have fulfilled these requirements quite
successfully in the experiments ATLAS
[Cristinziani et al 2007] and CMS [Kästli et al
2007] on the CERN Large Hadron Collider
(LHC) and brought decisive contributions to
the discovery of the Higgs boson.
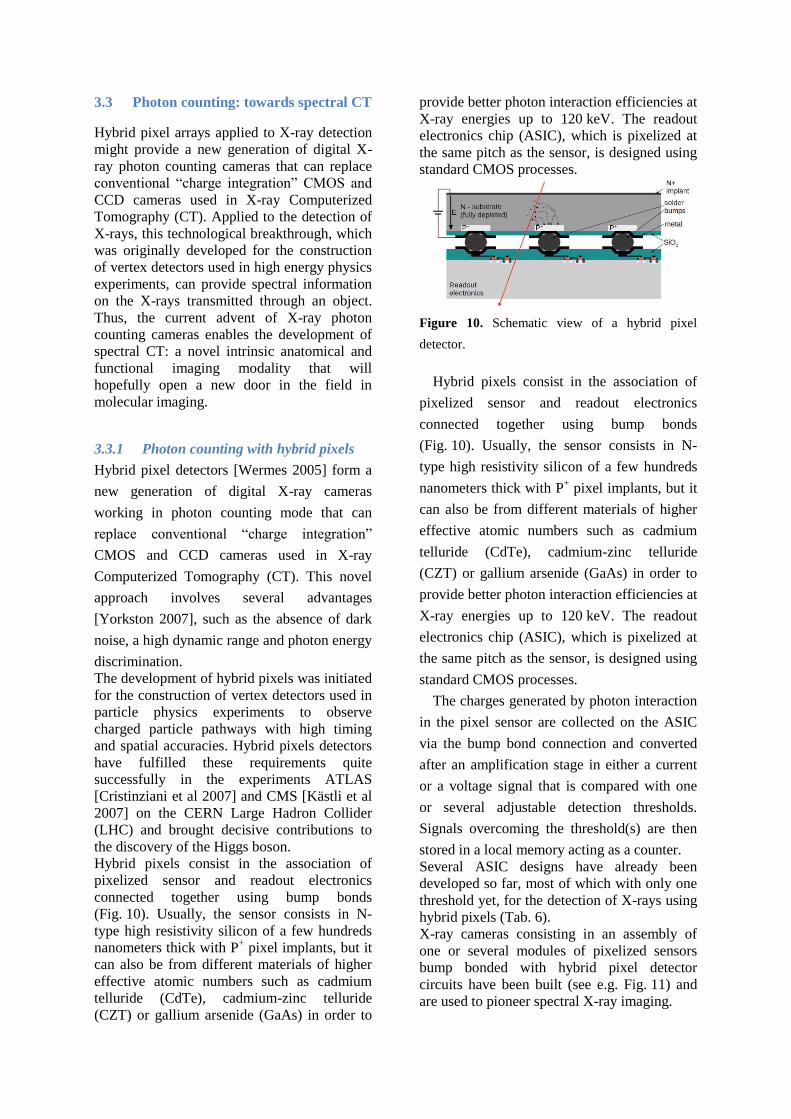
Hybrid pixels consist in the association of
pixelized sensor and readout electronics
connected together using bump bonds
(Fig. 10). Usually, the sensor consists in N-
type high resistivity silicon of a few hundreds
nanometers thick with P+ pixel implants, but it
can also be from different materials of higher
effective atomic numbers such as cadmium
telluride (CdTe), cadmium-zinc telluride
(CZT) or gallium arsenide (GaAs) in order to
provide better photon interaction efficiencies at
X-ray energies up to 120 keV. The readout
electronics chip (ASIC), which is pixelized at
the same pitch as the sensor, is designed using
standard CMOS processes.
Figure 10. Schematic view of a hybrid pixel
detector.
Hybrid pixels consist in the association of
pixelized sensor and readout electronics
connected together using bump bonds
(Fig. 10). Usually, the sensor consists in N-
type high resistivity silicon of a few hundreds
nanometers thick with P+ pixel implants, but it
can also be from different materials of higher
effective atomic numbers such as cadmium
telluride (CdTe), cadmium-zinc telluride
(CZT) or gallium arsenide (GaAs) in order to
provide better photon interaction efficiencies at
X-ray energies up to 120 keV. The readout
electronics chip (ASIC), which is pixelized at
the same pitch as the sensor, is designed using
standard CMOS processes.
The charges generated by photon interaction
in the pixel sensor are collected on the ASIC
via the bump bond connection and converted
after an amplification stage in either a current
or a voltage signal that is compared with one
or several adjustable detection thresholds.
Signals overcoming the threshold(s) are then
stored in a local memory acting as a counter.
Several ASIC designs have already been
developed so far, most of which with only one
threshold yet, for the detection of X-rays using
hybrid pixels (Tab. 6).
X-ray cameras consisting in an assembly of
one or several modules of pixelized sensors
bump bonded with hybrid pixel detector
circuits have been built (see e.g. Fig. 11) and
are used to pioneer spectral X-ray imaging.
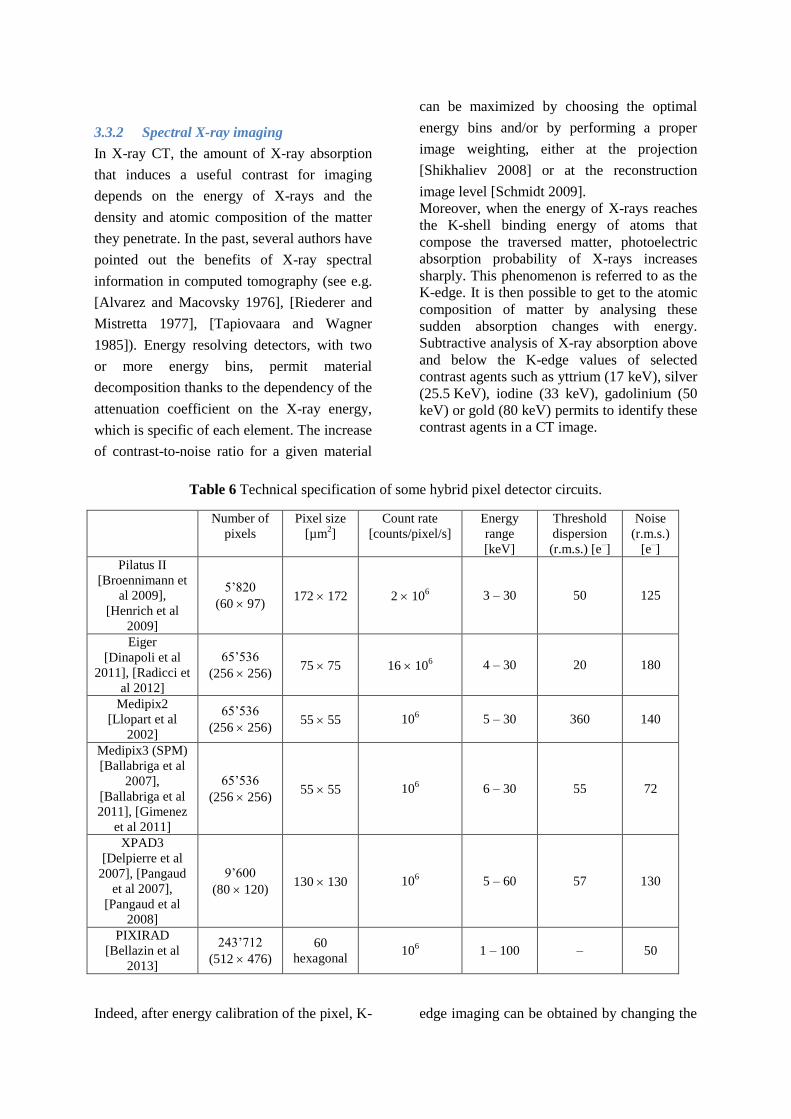
3.3.2 Spectral X-ray imaging
In X-ray CT, the amount of X-ray absorption
that induces a useful contrast for imaging
depends on the energy of X-rays and the
density and atomic composition of the matter
they penetrate. In the past, several authors have
pointed out the benefits of X-ray spectral
information in computed tomography (see e.g.
[Alvarez and Macovsky 1976], [Riederer and
Mistretta 1977], [Tapiovaara and Wagner
1985]). Energy resolving detectors, with two
or more energy bins, permit material
decomposition thanks to the dependency of the
attenuation coefficient on the X-ray energy,
which is specific of each element. The increase
of contrast-to-noise ratio for a given material
can be maximized by choosing the optimal
energy bins and/or by performing a proper
image weighting, either at the projection
[Shikhaliev 2008] or at the reconstruction
image level [Schmidt 2009].
Moreover, when the energy of X-rays reaches
the K-shell binding energy of atoms that
compose the traversed matter, photoelectric
absorption probability of X-rays increases
sharply. This phenomenon is referred to as the
K-edge. It is then possible to get to the atomic
composition of matter by analysing these
sudden absorption changes with energy.
Subtractive analysis of X-ray absorption above
and below the K-edge values of selected
contrast agents such as yttrium (17 keV), silver
(25.5 KeV), iodine (33 keV), gadolinium (50
keV) or gold (80 keV) permits to identify these
contrast agents in a CT image.
Table 6 Technical specification of some hybrid pixel detector circuits.
Number of
pixels
Pixel size
[µm2]
Count rate
[counts/pixel/s]
Energy
range
[keV]
Threshold
dispersion
(r.m.s.) [e–]
Noise
(r.m.s.)
[e–]
Pilatus II
[Broennimann et
al 2009],
[Henrich et al
2009]
5’820
(60 97) 172 172 2 10
6 3 – 30 50 125
Eiger
[Dinapoli et al
2011], [Radicci et
al 2012]
65’536
(256 256) 75 75 16 10
6 4 – 30 20 180
Medipix2
[Llopart et al
2002]
65’536
(256 256) 55 55 10
6 5 – 30 360 140
Medipix3 (SPM)
[Ballabriga et al
2007],
[Ballabriga et al
2011], [Gimenez
et al 2011]
65’536
(256 256) 55 55 10
6 6 – 30 55 72
XPAD3
[Delpierre et al
2007], [Pangaud
et al 2007],
[Pangaud et al
2008]
9’600
(80 120) 130 130 10
6 5 – 60 57 130
PIXIRAD
[Bellazin et al
2013]
243’712
(512 476)
60
hexagonal 10
6 1 – 100 – 50
Indeed, after energy calibration of the pixel, K- edge imaging can be obtained by changing the
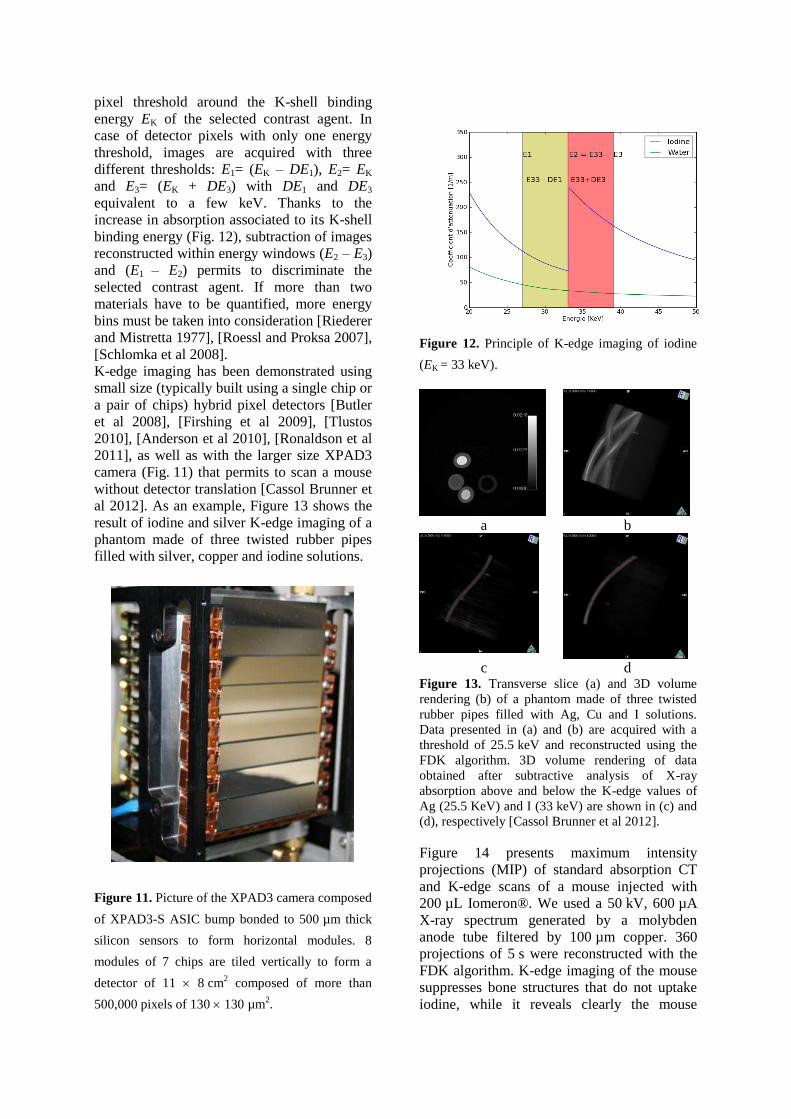
pixel threshold around the K-shell binding
energy EK of the selected contrast agent. In
case of detector pixels with only one energy
threshold, images are acquired with three
different thresholds: E1= (EK – DE1), E2= EK
and E3= (EK + DE3) with DE1 and DE3
equivalent to a few keV. Thanks to the
increase in absorption associated to its K-shell
binding energy (Fig. 12), subtraction of images
reconstructed within energy windows (E2 – E3)
and (E1 – E2) permits to discriminate the
selected contrast agent. If more than two
materials have to be quantified, more energy
bins must be taken into consideration [Riederer
and Mistretta 1977], [Roessl and Proksa 2007],
[Schlomka et al 2008].
K-edge imaging has been demonstrated using
small size (typically built using a single chip or
a pair of chips) hybrid pixel detectors [Butler
et al 2008], [Firshing et al 2009], [Tlustos
2010], [Anderson et al 2010], [Ronaldson et al
2011], as well as with the larger size XPAD3
camera (Fig. 11) that permits to scan a mouse
without detector translation [Cassol Brunner et
al 2012]. As an example, Figure 13 shows the
result of iodine and silver K-edge imaging of a
phantom made of three twisted rubber pipes
filled with silver, copper and iodine solutions.
Figure 11. Picture of the XPAD3 camera composed
of XPAD3-S ASIC bump bonded to 500 µm thick
silicon sensors to form horizontal modules. 8
modules of 7 chips are tiled vertically to form a
detector of 11 8 cm2 composed of more than
500,000 pixels of 130 130 µm2.
Figure 12. Principle of K-edge imaging of iodine
(EK = 33 keV).
a b
c d
Figure 13. Transverse slice (a) and 3D volume
rendering (b) of a phantom made of three twisted
rubber pipes filled with Ag, Cu and I solutions.
Data presented in (a) and (b) are acquired with a
threshold of 25.5 keV and reconstructed using the
FDK algorithm. 3D volume rendering of data
obtained after subtractive analysis of X-ray
absorption above and below the K-edge values of
Ag (25.5 KeV) and I (33 keV) are shown in (c) and
(d), respectively [Cassol Brunner et al 2012].
Figure 14 presents maximum intensity
projections (MIP) of standard absorption CT
and K-edge scans of a mouse injected with
200 µL Iomeron®. We used a 50 kV, 600 µA
X-ray spectrum generated by a molybden
anode tube filtered by 100 µm copper. 360
projections of 5 s were reconstructed with the
FDK algorithm. K-edge imaging of the mouse
suppresses bone structures that do not uptake
iodine, while it reveals clearly the mouse
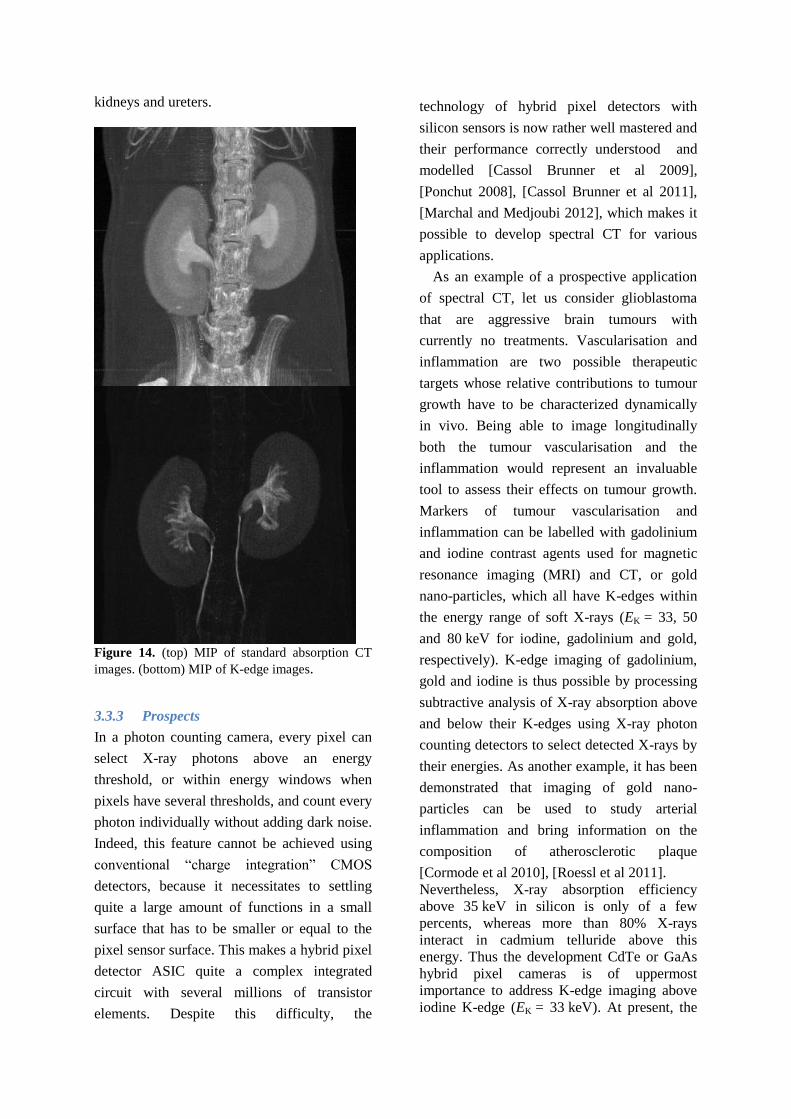
kidneys and ureters.
Figure 14. (top) MIP of standard absorption CT
images. (bottom) MIP of K-edge images.
3.3.3 Prospects
In a photon counting camera, every pixel can
select X-ray photons above an energy
threshold, or within energy windows when
pixels have several thresholds, and count every
photon individually without adding dark noise.
Indeed, this feature cannot be achieved using
conventional “charge integration” CMOS
detectors, because it necessitates to settling
quite a large amount of functions in a small
surface that has to be smaller or equal to the
pixel sensor surface. This makes a hybrid pixel
detector ASIC quite a complex integrated
circuit with several millions of transistor
elements. Despite this difficulty, the
technology of hybrid pixel detectors with
silicon sensors is now rather well mastered and
their performance correctly understood and
modelled [Cassol Brunner et al 2009],
[Ponchut 2008], [Cassol Brunner et al 2011],
[Marchal and Medjoubi 2012], which makes it
possible to develop spectral CT for various
applications.
As an example of a prospective application
of spectral CT, let us consider glioblastoma
that are aggressive brain tumours with
currently no treatments. Vascularisation and
inflammation are two possible therapeutic
targets whose relative contributions to tumour
growth have to be characterized dynamically
in vivo. Being able to image longitudinally
both the tumour vascularisation and the
inflammation would represent an invaluable
tool to assess their effects on tumour growth.
Markers of tumour vascularisation and
inflammation can be labelled with gadolinium
and iodine contrast agents used for magnetic
resonance imaging (MRI) and CT, or gold
nano-particles, which all have K-edges within
the energy range of soft X-rays (EK = 33, 50
and 80 keV for iodine, gadolinium and gold,
respectively). K-edge imaging of gadolinium,
gold and iodine is thus possible by processing
subtractive analysis of X-ray absorption above
and below their K-edges using X-ray photon
counting detectors to select detected X-rays by
their energies. As another example, it has been
demonstrated that imaging of gold nano-
particles can be used to study arterial
inflammation and bring information on the
composition of atherosclerotic plaque
[Cormode et al 2010], [Roessl et al 2011].
Nevertheless, X-ray absorption efficiency
above 35 keV in silicon is only of a few
percents, whereas more than 80% X-rays
interact in cadmium telluride above this
energy. Thus the development CdTe or GaAs
hybrid pixel cameras is of uppermost
importance to address K-edge imaging above
iodine K-edge (EK = 33 keV). At present, the
relatively small diameters of CdTe or GaAs
wafers do not permit to hybridize large
modules [Basolo et al 2008], [Steadman et al
2010], [Steadman et al 2011], [Koenig et al
2012], [Tlutos et al 2011], [Hamann et al
2013]. Furthermore, CdTe wafers are quite
brittle and can barely sustain mechanical
stress, e.g. due to different dilatation
coefficients of the CdTe sensor and the Si
integrated circuit. However, given the energy
range that is targeted by this new technology,
the methodology developed on preclinical
models, even using small size detectors, would
be easily if not directly transferable to human
clinics [Herrmann et al 2010], [Barber et al
2011].
3.3.4 Conclusion
The advent of X-ray spectral CT as a novel
intrinsic hybrid imaging modality able to
superimpose anatomy and function will
hopefully open a new door in molecular
imaging. Potentially, photon counting will
impact positively “black and white” or grey-
scale CT accuracy by improving image
contrast and signal-to-noise ratio [Shikhaliev
and Fritz 2011]. Indeed, with “charge
integration” X-ray cameras, the higher is the
energy of the detected X-ray, the more it will
contribute to the formation of the detected
signal, whereas with photon counting cameras,
every detected photon contributes evenly to the
Poisson statistics of the photon count. Hence,
image contrast, which results predominantly
from the detection of soft X-rays, tends to be
better with photon counting CT than with
“charge integration” CT [Ouamara et al 2012].
Furthermore, the rejection of low energy X-
rays by photon counting detectors suppresses
X-rays that are scattered with large angles and
thus also tends to improve image signal-to-
noise ratio.
More importantly, it is the ability of photon
counting detectors to get spectral information
on the detected X-rays that will bring a
paradigm shift from “black and white” to
“colour” CT. This will permit to identify
and/or discriminate multiple contrast agents
simultaneously, some of which being nano-
particles labelled with metallic elements
identified from by their K-edge signature, and
locate those within the anatomic grey-scale CT
image, thus providing as many different
functional information in vivo [Jorgensen et al
2011].
4 Interfaces
4.1 Quality control in hadrontherapy
Tumour treatment by means of charged
hadrons (i.e. protons or light ions) offers great
therapeutic potential in terms of improved
conformation of the dose to the tumour in
combination with dose reduction to normal
tissue due to the favourable physical and
biological properties of the impinging ions.
Primary particles are completely stopped in the
irradiated tissue and deliver most of their
energy at the end of their path. Thus, a steep
distal dose gradient can be achieved and
organs at risk distal to the tumour can be
spared. However, in order to fully profit from
the advantages of ion beams a monitoring of
the dose delivery is required. Since the range
of the particles and, thus, the spatial position of
the maximum dose delivery is very sensitive to
modifications in the irradiated tissue, already
minor changes in the tissue density as well as
inaccuracies in patient positioning can lead to
substantial deviations in dose distribution.
Several methods of medical imaging in ion
beam therapy are under investigation in order
to measure the range of the particles in the
tissue or even directly measure the applied
dose in vivo. Positron emission tomography
(PET) is currently the only clinically
investigated method for in vivo range
verification during or shortly after irradiation,
and its potential benefit for ion tumour
therapy has been proven [Enghardt 2004,
Nishio 2010, Parodi 2008, Bauer 2013].
Further treatment verification methods based
on the detection of secondary nuclear reaction
products are prompt gamma imaging and
charged particle imaging, which are currently
under investigation. Another promising
imaging tool in particle therapy is ion
radiography and tomography, which is
intended to be primarily used for position
verification and treatment planning, but also
can serve as a range verification method
[Schulte 2004]. In the following, all of these
imaging techniques are presented. They
require deep knowledge on nuclear processes
as well as substantial abilities in detector
design. Apart from challenging reconstruction
tasks, the development of such imaging
techniques also requires the simulation of the
expected distributions. Therefore, extensive
modelling of nuclear and electromagnetic
interactions is necessary.
4.1.1 Positron Emission Tomography in
Particle Therapy
Particles impinging on tissue induce among
others positron emitters due to nuclear
reactions with the atoms of the irradiated
tissue. These positron emitters undergo
radioactive decay according to their respective
half-life, and positrons are released. These
positrons annihilate with electrons of the tissue
under emission of two annihilation photons
with an energy of 511 keV each and an
emission angle of approximately 180° (Fig.
15). By means of a PET scanner these
annihilation photons can be detected in
coincidence. Reconstruction of the measured
events results in a 3D +-activity distribution.
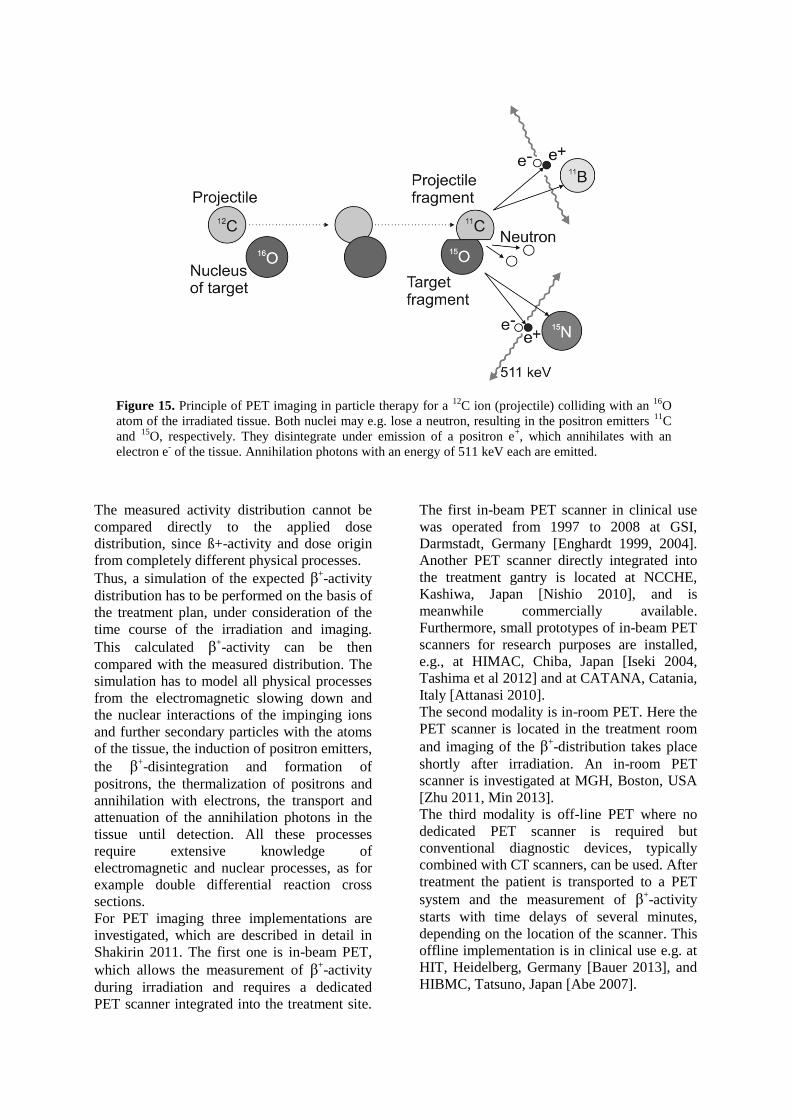
The measured activity distribution cannot be
compared directly to the applied dose
distribution, since ß+-activity and dose origin
from completely different physical processes.
Thus, a simulation of the expected β+-activity
distribution has to be performed on the basis of
the treatment plan, under consideration of the
time course of the irradiation and imaging.
This calculated β+-activity can be then
compared with the measured distribution. The
simulation has to model all physical processes
from the electromagnetic slowing down and
the nuclear interactions of the impinging ions
and further secondary particles with the atoms
of the tissue, the induction of positron emitters,
the β+-disintegration and formation of
positrons, the thermalization of positrons and
annihilation with electrons, the transport and
attenuation of the annihilation photons in the
tissue until detection. All these processes
require extensive knowledge of
electromagnetic and nuclear processes, as for
example double differential reaction cross
sections.
For PET imaging three implementations are
investigated, which are described in detail in
Shakirin 2011. The first one is in-beam PET,
which allows the measurement of β+-activity
during irradiation and requires a dedicated
PET scanner integrated into the treatment site.
The first in-beam PET scanner in clinical use
was operated from 1997 to 2008 at GSI,
Darmstadt, Germany [Enghardt 1999, 2004].
Another PET scanner directly integrated into
the treatment gantry is located at NCCHE,
Kashiwa, Japan [Nishio 2010], and is
meanwhile commercially available.
Furthermore, small prototypes of in-beam PET
scanners for research purposes are installed,
e.g., at HIMAC, Chiba, Japan [Iseki 2004,
Tashima et al 2012] and at CATANA, Catania,
Italy [Attanasi 2010].
The second modality is in-room PET. Here the
PET scanner is located in the treatment room
and imaging of the β+-distribution takes place
shortly after irradiation. An in-room PET
scanner is investigated at MGH, Boston, USA
[Zhu 2011, Min 2013].
The third modality is off-line PET where no
dedicated PET scanner is required but
conventional diagnostic devices, typically
combined with CT scanners, can be used. After
treatment the patient is transported to a PET
system and the measurement of β+-activity
starts with time delays of several minutes,
depending on the location of the scanner. This
offline implementation is in clinical use e.g. at
HIT, Heidelberg, Germany [Bauer 2013], and
HIBMC, Tatsuno, Japan [Abe 2007].
Figure 15. Principle of PET imaging in particle therapy for a 12
C ion (projectile) colliding with an 16
O
atom of the irradiated tissue. Both nuclei may e.g. lose a neutron, resulting in the positron emitters 11
C
and 15
O, respectively. They disintegrate under emission of a positron e+, which annihilates with an
electron e- of the tissue. Annihilation photons with an energy of 511 keV each are emitted.
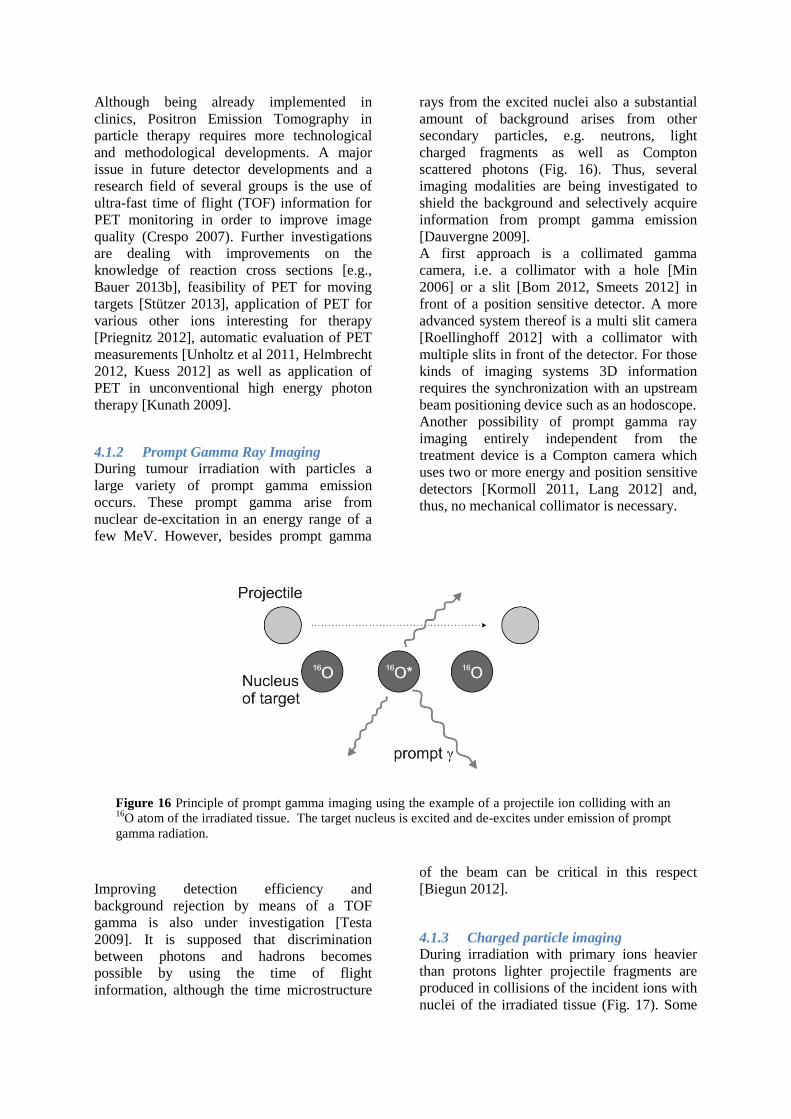
Although being already implemented in
clinics, Positron Emission Tomography in
particle therapy requires more technological
and methodological developments. A major
issue in future detector developments and a
research field of several groups is the use of
ultra-fast time of flight (TOF) information for
PET monitoring in order to improve image
quality (Crespo 2007). Further investigations
are dealing with improvements on the
knowledge of reaction cross sections [e.g.,
Bauer 2013b], feasibility of PET for moving
targets [Stützer 2013], application of PET for
various other ions interesting for therapy
[Priegnitz 2012], automatic evaluation of PET
measurements [Unholtz et al 2011, Helmbrecht
2012, Kuess 2012] as well as application of
PET in unconventional high energy photon
therapy [Kunath 2009].
4.1.2 Prompt Gamma Ray Imaging
During tumour irradiation with particles a
large variety of prompt gamma emission
occurs. These prompt gamma arise from
nuclear de-excitation in an energy range of a
few MeV. However, besides prompt gamma
rays from the excited nuclei also a substantial
amount of background arises from other
secondary particles, e.g. neutrons, light
charged fragments as well as Compton
scattered photons (Fig. 16). Thus, several
imaging modalities are being investigated to
shield the background and selectively acquire
information from prompt gamma emission
[Dauvergne 2009].
A first approach is a collimated gamma
camera, i.e. a collimator with a hole [Min
2006] or a slit [Bom 2012, Smeets 2012] in
front of a position sensitive detector. A more
advanced system thereof is a multi slit camera
[Roellinghoff 2012] with a collimator with
multiple slits in front of the detector. For those
kinds of imaging systems 3D information
requires the synchronization with an upstream
beam positioning device such as an hodoscope.
Another possibility of prompt gamma ray
imaging entirely independent from the
treatment device is a Compton camera which
uses two or more energy and position sensitive
detectors [Kormoll 2011, Lang 2012] and,
thus, no mechanical collimator is necessary.
Improving detection efficiency and
background rejection by means of a TOF
gamma is also under investigation [Testa
2009]. It is supposed that discrimination
between photons and hadrons becomes
possible by using the time of flight
information, although the time microstructure
of the beam can be critical in this respect
[Biegun 2012].
4.1.3 Charged particle imaging
During irradiation with primary ions heavier
than protons lighter projectile fragments are
produced in collisions of the incident ions with
nuclei of the irradiated tissue (Fig. 17). Some
Figure 16 Principle of prompt gamma imaging using the example of a projectile ion colliding with an 16
O atom of the irradiated tissue. The target nucleus is excited and de-excites under emission of prompt
gamma radiation.
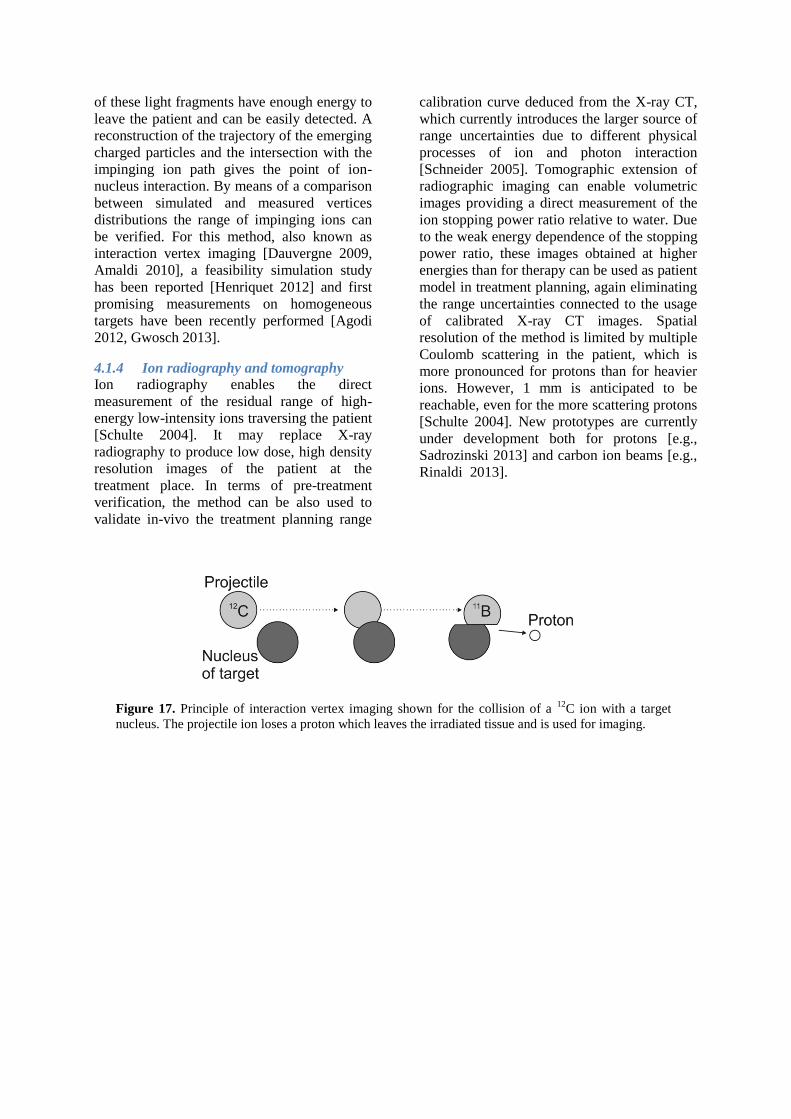
of these light fragments have enough energy to
leave the patient and can be easily detected. A
reconstruction of the trajectory of the emerging
charged particles and the intersection with the
impinging ion path gives the point of ion-
nucleus interaction. By means of a comparison
between simulated and measured vertices
distributions the range of impinging ions can
be verified. For this method, also known as
interaction vertex imaging [Dauvergne 2009,
Amaldi 2010], a feasibility simulation study
has been reported [Henriquet 2012] and first
promising measurements on homogeneous
targets have been recently performed [Agodi
2012, Gwosch 2013].
4.1.4 Ion radiography and tomography
Ion radiography enables the direct
measurement of the residual range of high-
energy low-intensity ions traversing the patient
[Schulte 2004]. It may replace X-ray
radiography to produce low dose, high density
resolution images of the patient at the
treatment place. In terms of pre-treatment
verification, the method can be also used to
validate in-vivo the treatment planning range
calibration curve deduced from the X-ray CT,
which currently introduces the larger source of
range uncertainties due to different physical
processes of ion and photon interaction
[Schneider 2005]. Tomographic extension of
radiographic imaging can enable volumetric
images providing a direct measurement of the
ion stopping power ratio relative to water. Due
to the weak energy dependence of the stopping
power ratio, these images obtained at higher
energies than for therapy can be used as patient
model in treatment planning, again eliminating
the range uncertainties connected to the usage
of calibrated X-ray CT images. Spatial
resolution of the method is limited by multiple
Coulomb scattering in the patient, which is
more pronounced for protons than for heavier
ions. However, 1 mm is anticipated to be
reachable, even for the more scattering protons
[Schulte 2004]. New prototypes are currently
under development both for protons [e.g.,
Sadrozinski 2013] and carbon ion beams [e.g.,
Rinaldi 2013].
Figure 17. Principle of interaction vertex imaging shown for the collision of a 12
C ion with a target
nucleus. The projectile ion loses a proton which leaves the irradiated tissue and is used for imaging.
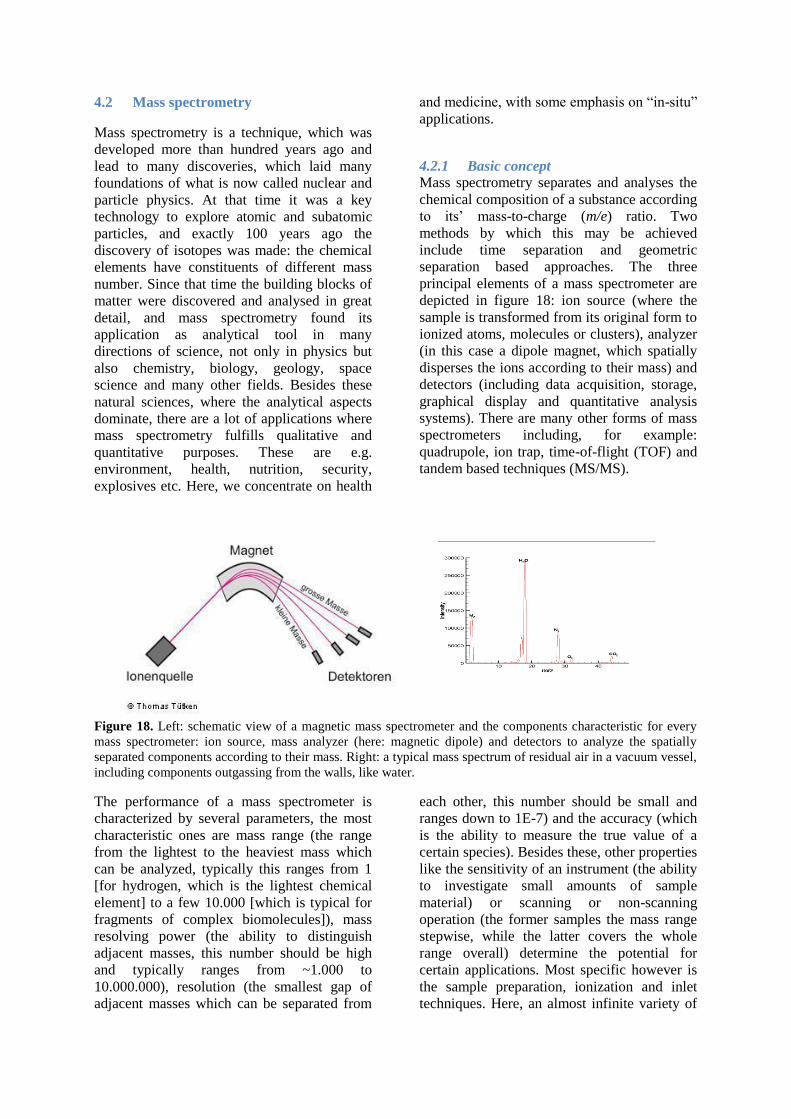
4.2 Mass spectrometry
Mass spectrometry is a technique, which was
developed more than hundred years ago and
lead to many discoveries, which laid many
foundations of what is now called nuclear and
particle physics. At that time it was a key
technology to explore atomic and subatomic
particles, and exactly 100 years ago the
discovery of isotopes was made: the chemical
elements have constituents of different mass
number. Since that time the building blocks of
matter were discovered and analysed in great
detail, and mass spectrometry found its
application as analytical tool in many
directions of science, not only in physics but
also chemistry, biology, geology, space
science and many other fields. Besides these
natural sciences, where the analytical aspects
dominate, there are a lot of applications where
mass spectrometry fulfills qualitative and
quantitative purposes. These are e.g.
environment, health, nutrition, security,
explosives etc. Here, we concentrate on health
and medicine, with some emphasis on “in-situ”
applications.
4.2.1 Basic concept
Mass spectrometry separates and analyses the
chemical composition of a substance according
to its’ mass-to-charge (m/e) ratio. Two
methods by which this may be achieved
include time separation and geometric
separation based approaches. The three
principal elements of a mass spectrometer are
depicted in figure 18: ion source (where the
sample is transformed from its original form to
ionized atoms, molecules or clusters), analyzer
(in this case a dipole magnet, which spatially
disperses the ions according to their mass) and
detectors (including data acquisition, storage,
graphical display and quantitative analysis
systems). There are many other forms of mass
spectrometers including, for example:
quadrupole, ion trap, time-of-flight (TOF) and
tandem based techniques (MS/MS).
Figure 18. Left: schematic view of a magnetic mass spectrometer and the components characteristic for every
mass spectrometer: ion source, mass analyzer (here: magnetic dipole) and detectors to analyze the spatially
separated components according to their mass. Right: a typical mass spectrum of residual air in a vacuum vessel,
including components outgassing from the walls, like water.
The performance of a mass spectrometer is
characterized by several parameters, the most
characteristic ones are mass range (the range
from the lightest to the heaviest mass which
can be analyzed, typically this ranges from 1
[for hydrogen, which is the lightest chemical
element] to a few 10.000 [which is typical for
fragments of complex biomolecules]), mass
resolving power (the ability to distinguish
adjacent masses, this number should be high
and typically ranges from ~1.000 to
10.000.000), resolution (the smallest gap of
adjacent masses which can be separated from
each other, this number should be small and
ranges down to 1E-7) and the accuracy (which
is the ability to measure the true value of a
certain species). Besides these, other properties
like the sensitivity of an instrument (the ability
to investigate small amounts of sample
material) or scanning or non-scanning
operation (the former samples the mass range
stepwise, while the latter covers the whole
range overall) determine the potential for
certain applications. Most specific however is
the sample preparation, ionization and inlet
techniques. Here, an almost infinite variety of
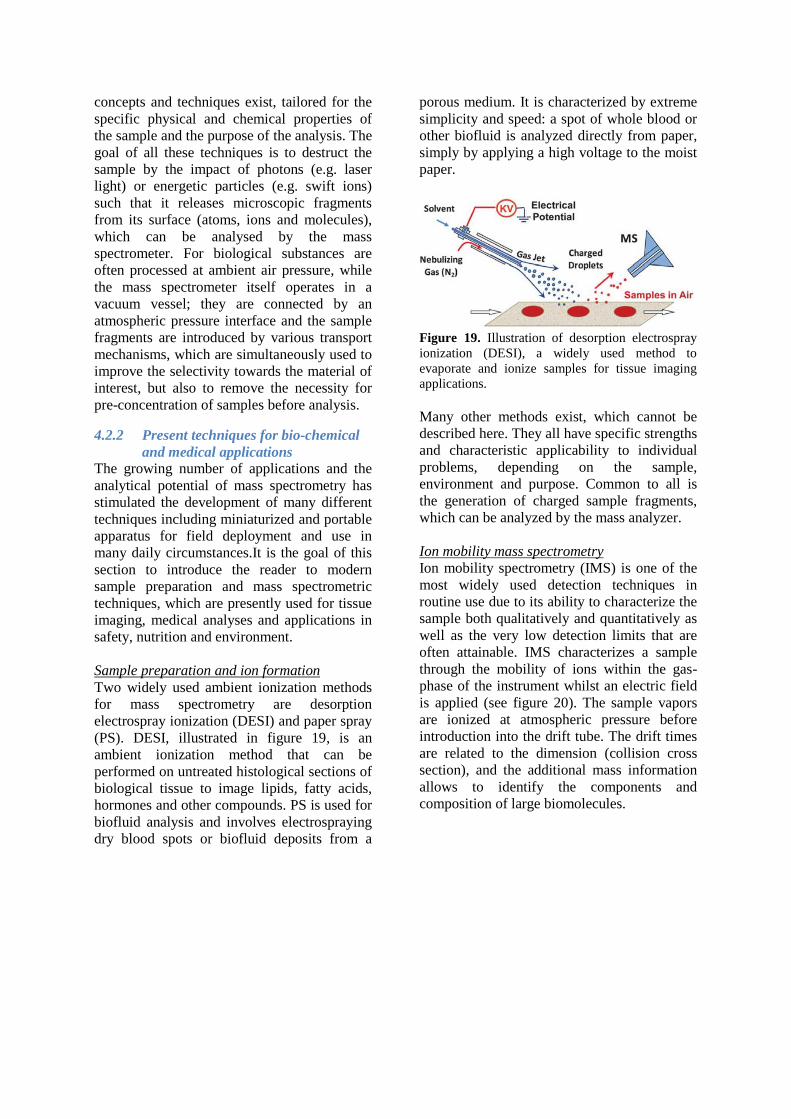
concepts and techniques exist, tailored for the
specific physical and chemical properties of
the sample and the purpose of the analysis. The
goal of all these techniques is to destruct the
sample by the impact of photons (e.g. laser
light) or energetic particles (e.g. swift ions)
such that it releases microscopic fragments
from its surface (atoms, ions and molecules),
which can be analysed by the mass
spectrometer. For biological substances are
often processed at ambient air pressure, while
the mass spectrometer itself operates in a
vacuum vessel; they are connected by an
atmospheric pressure interface and the sample
fragments are introduced by various transport
mechanisms, which are simultaneously used to
improve the selectivity towards the material of
interest, but also to remove the necessity for
pre-concentration of samples before analysis.
4.2.2 Present techniques for bio-chemical
and medical applications
The growing number of applications and the
analytical potential of mass spectrometry has
stimulated the development of many different
techniques including miniaturized and portable
apparatus for field deployment and use in
many daily circumstances.It is the goal of this
section to introduce the reader to modern
sample preparation and mass spectrometric
techniques, which are presently used for tissue
imaging, medical analyses and applications in
safety, nutrition and environment.
Sample preparation and ion formation
Two widely used ambient ionization methods
for mass spectrometry are desorption
electrospray ionization (DESI) and paper spray
(PS). DESI, illustrated in figure 19, is an
ambient ionization method that can be
performed on untreated histological sections of
biological tissue to image lipids, fatty acids,
hormones and other compounds. PS is used for
biofluid analysis and involves electrospraying
dry blood spots or biofluid deposits from a
porous medium. It is characterized by extreme
simplicity and speed: a spot of whole blood or
other biofluid is analyzed directly from paper,
simply by applying a high voltage to the moist
paper.
Figure 19. Illustration of desorption electrospray
ionization (DESI), a widely used method to
evaporate and ionize samples for tissue imaging
applications.
Many other methods exist, which cannot be
described here. They all have specific strengths
and characteristic applicability to individual
problems, depending on the sample,
environment and purpose. Common to all is
the generation of charged sample fragments,
which can be analyzed by the mass analyzer.
Ion mobility mass spectrometry
Ion mobility spectrometry (IMS) is one of the
most widely used detection techniques in
routine use due to its ability to characterize the
sample both qualitatively and quantitatively as
well as the very low detection limits that are
often attainable. IMS characterizes a sample
through the mobility of ions within the gas-
phase of the instrument whilst an electric field
is applied (see figure 20). The sample vapors
are ionized at atmospheric pressure before
introduction into the drift tube. The drift times
are related to the dimension (collision cross
section), and the additional mass information
allows to identify the components and
composition of large biomolecules.
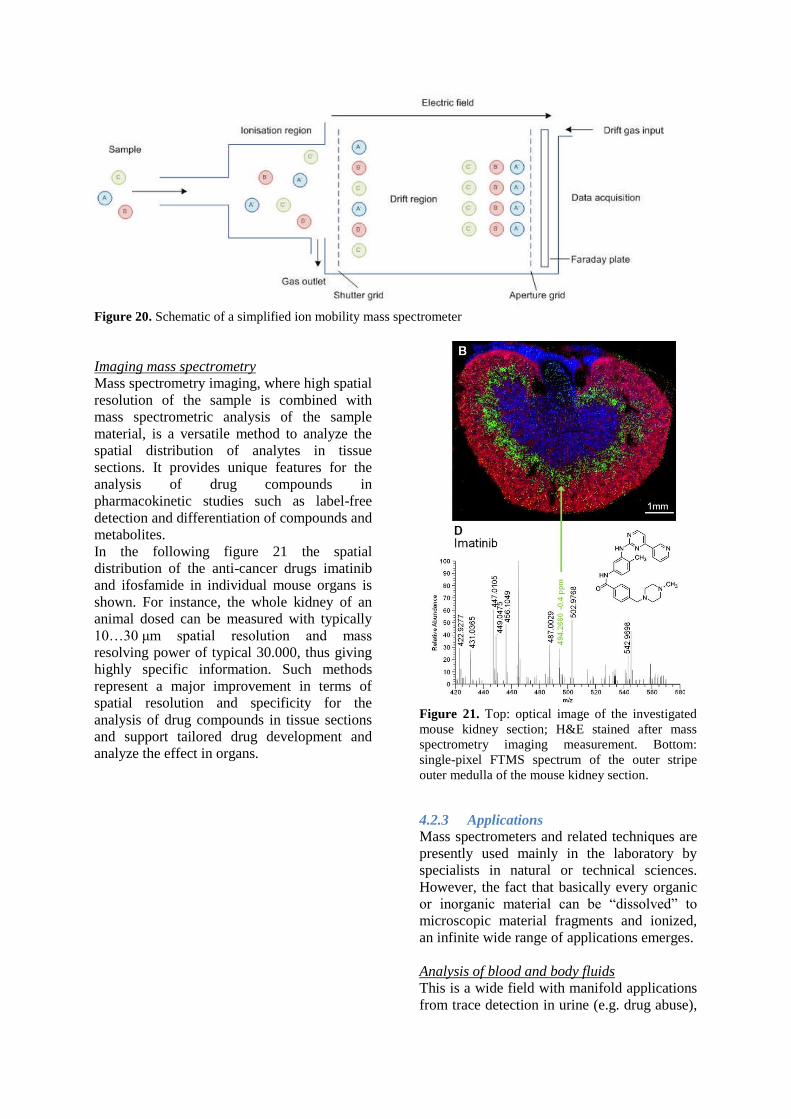
Figure 20. Schematic of a simplified ion mobility mass spectrometer
Imaging mass spectrometry
Mass spectrometry imaging, where high spatial
resolution of the sample is combined with
mass spectrometric analysis of the sample
material, is a versatile method to analyze the
spatial distribution of analytes in tissue
sections. It provides unique features for the
analysis of drug compounds in
pharmacokinetic studies such as label-free
detection and differentiation of compounds and
metabolites.
In the following figure 21 the spatial
distribution of the anti-cancer drugs imatinib
and ifosfamide in individual mouse organs is
shown. For instance, the whole kidney of an
animal dosed can be measured with typically
10…30 μm spatial resolution and mass
resolving power of typical 30.000, thus giving
highly specific information. Such methods
represent a major improvement in terms of
spatial resolution and specificity for the
analysis of drug compounds in tissue sections
and support tailored drug development and
analyze the effect in organs.
Figure 21. Top: optical image of the investigated
mouse kidney section; H&E stained after mass
spectrometry imaging measurement. Bottom:
single-pixel FTMS spectrum of the outer stripe
outer medulla of the mouse kidney section.
4.2.3 Applications
Mass spectrometers and related techniques are
presently used mainly in the laboratory by
specialists in natural or technical sciences.
However, the fact that basically every organic
or inorganic material can be “dissolved” to
microscopic material fragments and ionized,
an infinite wide range of applications emerges.
Analysis of blood and body fluids
This is a wide field with manifold applications
from trace detection in urine (e.g. drug abuse),
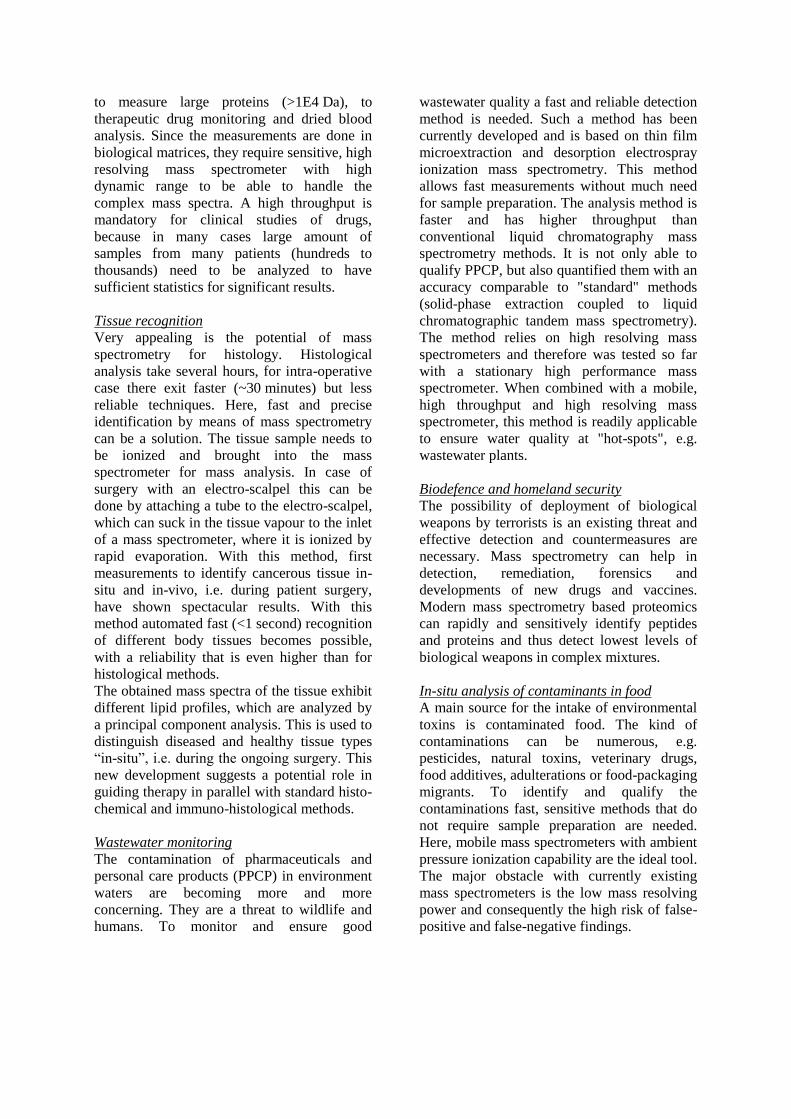
to measure large proteins (>1E4 Da), to
therapeutic drug monitoring and dried blood
analysis. Since the measurements are done in
biological matrices, they require sensitive, high
resolving mass spectrometer with high
dynamic range to be able to handle the
complex mass spectra. A high throughput is
mandatory for clinical studies of drugs,
because in many cases large amount of
samples from many patients (hundreds to
thousands) need to be analyzed to have
sufficient statistics for significant results.
Tissue recognition
Very appealing is the potential of mass
spectrometry for histology. Histological
analysis take several hours, for intra-operative
case there exit faster (~30 minutes) but less
reliable techniques. Here, fast and precise
identification by means of mass spectrometry
can be a solution. The tissue sample needs to
be ionized and brought into the mass
spectrometer for mass analysis. In case of
surgery with an electro-scalpel this can be
done by attaching a tube to the electro-scalpel,
which can suck in the tissue vapour to the inlet
of a mass spectrometer, where it is ionized by
rapid evaporation. With this method, first
measurements to identify cancerous tissue in-
situ and in-vivo, i.e. during patient surgery,
have shown spectacular results. With this
method automated fast (<1 second) recognition
of different body tissues becomes possible,
with a reliability that is even higher than for
histological methods.
The obtained mass spectra of the tissue exhibit
different lipid profiles, which are analyzed by
a principal component analysis. This is used to
distinguish diseased and healthy tissue types
“in-situ”, i.e. during the ongoing surgery. This
new development suggests a potential role in
guiding therapy in parallel with standard histo-
chemical and immuno-histological methods.
Wastewater monitoring
The contamination of pharmaceuticals and
personal care products (PPCP) in environment
waters are becoming more and more
concerning. They are a threat to wildlife and
humans. To monitor and ensure good
wastewater quality a fast and reliable detection
method is needed. Such a method has been
currently developed and is based on thin film
microextraction and desorption electrospray
ionization mass spectrometry. This method
allows fast measurements without much need
for sample preparation. The analysis method is
faster and has higher throughput than
conventional liquid chromatography mass
spectrometry methods. It is not only able to
qualify PPCP, but also quantified them with an
accuracy comparable to "standard" methods
(solid-phase extraction coupled to liquid
chromatographic tandem mass spectrometry).
The method relies on high resolving mass
spectrometers and therefore was tested so far
with a stationary high performance mass
spectrometer. When combined with a mobile,
high throughput and high resolving mass
spectrometer, this method is readily applicable
to ensure water quality at "hot-spots", e.g.
wastewater plants.
Biodefence and homeland security
The possibility of deployment of biological
weapons by terrorists is an existing threat and
effective detection and countermeasures are
necessary. Mass spectrometry can help in
detection, remediation, forensics and
developments of new drugs and vaccines.
Modern mass spectrometry based proteomics
can rapidly and sensitively identify peptides
and proteins and thus detect lowest levels of
biological weapons in complex mixtures.
In-situ analysis of contaminants in food
A main source for the intake of environmental
toxins is contaminated food. The kind of
contaminations can be numerous, e.g.
pesticides, natural toxins, veterinary drugs,
food additives, adulterations or food-packaging
migrants. To identify and qualify the
contaminations fast, sensitive methods that do
not require sample preparation are needed.
Here, mobile mass spectrometers with ambient
pressure ionization capability are the ideal tool.
The major obstacle with currently existing
mass spectrometers is the low mass resolving
power and consequently the high risk of false-
positive and false-negative findings.
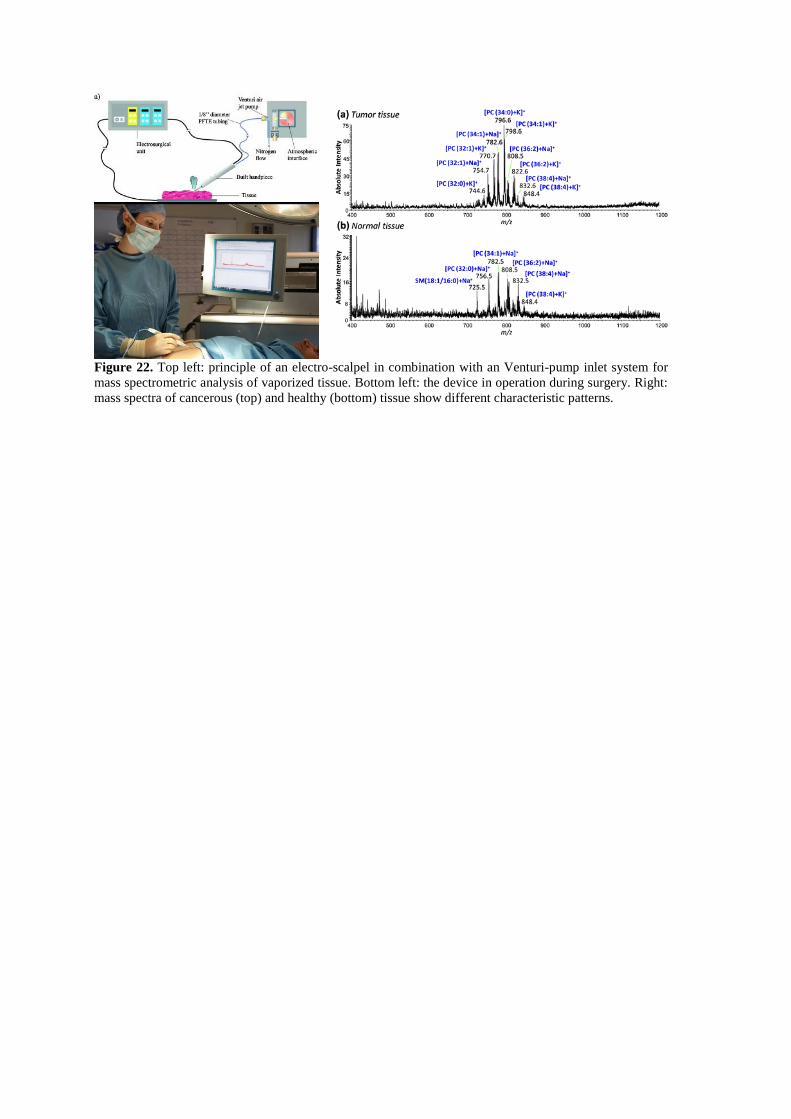
Figure 22. Top left: principle of an electro-scalpel in combination with an Venturi-pump inlet system for
mass spectrometric analysis of vaporized tissue. Bottom left: the device in operation during surgery. Right:
mass spectra of cancerous (top) and healthy (bottom) tissue show different characteristic patterns.
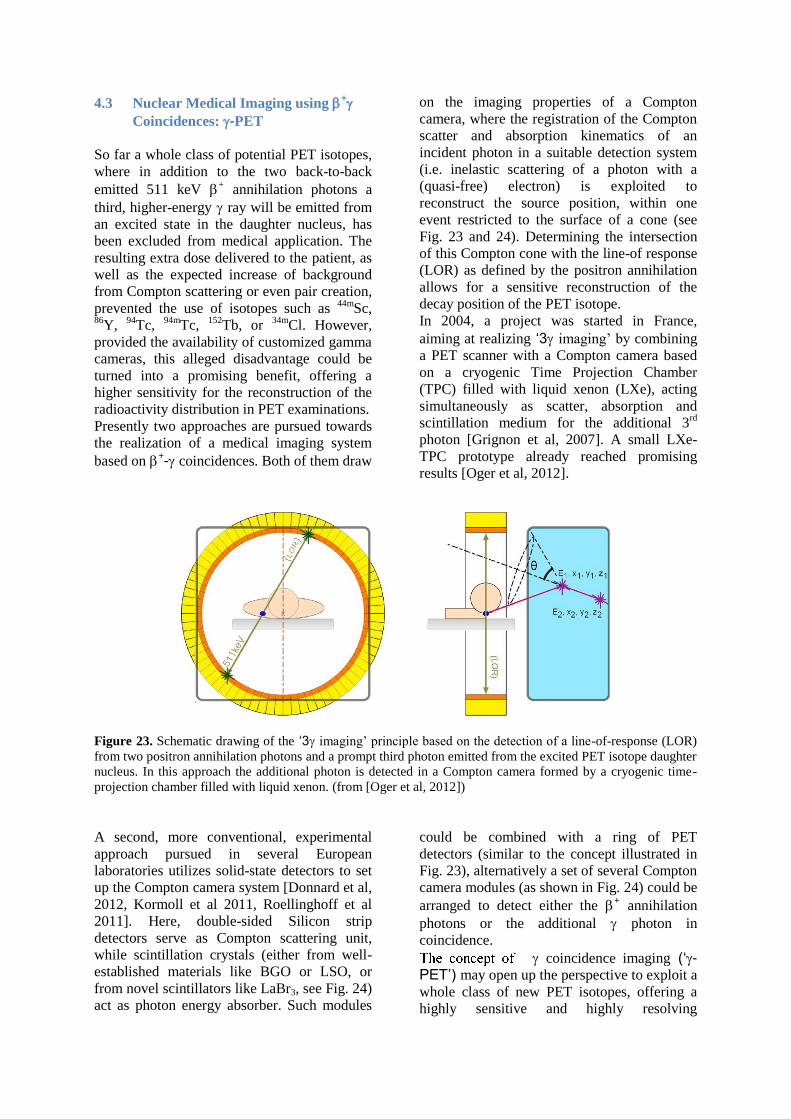
4.3 Nuclear Medical Imaging using +
Coincidences: -PET
So far a whole class of potential PET isotopes,
where in addition to the two back-to-back
emitted 511 keV + annihilation photons a
third, higher-energy ray will be emitted from
an excited state in the daughter nucleus, has
been excluded from medical application. The
resulting extra dose delivered to the patient, as
well as the expected increase of background
from Compton scattering or even pair creation,
prevented the use of isotopes such as 44m
Sc, 86
Y, 94
Tc, 94m
Tc, 152
Tb, or 34m
Cl. However,
provided the availability of customized gamma
cameras, this alleged disadvantage could be
turned into a promising benefit, offering a
higher sensitivity for the reconstruction of the
radioactivity distribution in PET examinations.
Presently two approaches are pursued towards
the realization of a medical imaging system
based on +- coincidences. Both of them draw
on the imaging properties of a Compton
camera, where the registration of the Compton
scatter and absorption kinematics of an
incident photon in a suitable detection system
(i.e. inelastic scattering of a photon with a
(quasi-free) electron) is exploited to
reconstruct the source position, within one
event restricted to the surface of a cone (see
Fig. 23 and 24). Determining the intersection
of this Compton cone with the line-of response
(LOR) as defined by the positron annihilation
allows for a sensitive reconstruction of the
decay position of the PET isotope.
In 2004, a project was started in France,
aiming at realizing ‘3 imaging’ by combining
a PET scanner with a Compton camera based
on a cryogenic Time Projection Chamber
(TPC) filled with liquid xenon (LXe), acting
simultaneously as scatter, absorption and
scintillation medium for the additional 3rd
photon [Grignon et al, 2007]. A small LXe-
TPC prototype already reached promising
results [Oger et al, 2012].
Figure 23. Schematic drawing of the ‘3 imaging’ principle based on the detection of a line-of-response (LOR)
from two positron annihilation photons and a prompt third photon emitted from the excited PET isotope daughter
nucleus. In this approach the additional photon is detected in a Compton camera formed by a cryogenic time-
projection chamber filled with liquid xenon. (from [Oger et al, 2012])
A second, more conventional, experimental
approach pursued in several European
laboratories utilizes solid-state detectors to set
up the Compton camera system [Donnard et al,
2012, Kormoll et al 2011, Roellinghoff et al
2011]. Here, double-sided Silicon strip
detectors serve as Compton scattering unit,
while scintillation crystals (either from well-
established materials like BGO or LSO, or
from novel scintillators like LaBr3, see Fig. 24)
act as photon energy absorber. Such modules
could be combined with a ring of PET
detectors (similar to the concept illustrated in
Fig. 23), alternatively a set of several Compton
camera modules (as shown in Fig. 24) could be
arranged to detect either the + annihilation
photons or the additional photon in
coincidence.
coincidence imaging (‘-PET’) may open up the perspective to exploit a
whole class of new PET isotopes, offering a
highly sensitive and highly resolving
localization of the photon source position. The
high sensitivity of -PET can be illustrated by
the setup shown in Fig. 24, where already a
few ten reconstructed intersections between the
LOR and the direction towards the 3rd
photon
are sufficient to localize the activity contained
in a voxel size of 2x2x2 mm3 [Lang et al,
2013]. In order to achieve
the same with a
conventional PET-based analysis, a few
thousand LOR’s would be needed to be
reconstructed. Outside Europe, also in the US
the topic of ‘unconventional’ PET isotopes is
studied [Gonzales et al 2011, Chinn et al
2011], however, so far no dedicated project to
develop a ‘-PET’ detection system has been
reported.
Figure 24. Arrangement of 3 Compton camera
modules to define the LOR from + annihilation in
coincidence with the detection of the 3rd
photon.
Each module consists of a double-sided silicon strip
detector (DSSSD) a scatterer and a LaBr3
scintillator as absorber.
5 Conclusions
Medical imaging in general and nuclear
medicine in particular, for which detection of
radiation emitted by the atomic nucleus is
involved, has experienced and continues to
exhibit evolution at exponential speeds. In the
past, this evolution has largely benefited from
technologies developed and tested in the
experimental nuclear physics battleground and
it seems that will do so even more in the
future. The maturity of the nuclear imaging
sector can be seen in the fact that, while in the
past most nuclear detector technologies
employed in the medical field, such as PMT
and scintillators, were borrowed from the
experimental nuclear physics knowledge base,
nowadays new technologies are being pursued
by the demanding medical industry, where the
rate of technological evolution has never been
so fast and new techniques are translated into
biomedical research and clinical use within the
year.
Nuclear physics groups were always aware
that their work in radiation detector,
simulations, electronics, and data processing,
may find application in nuclear medicine. But
today we realize that our activities in these two
fields are not only complementary and
synergetic, but that their pace of development
is very different. Nuclear physics experiments
may take several years to design, raise funding,
setup, run and analyze data. In the nuclear
imaging arena, though, trends and technologies
are being introduced, tested and dismissed at
high speeds. One can assess this by attending
the leading conferences in the nuclear imaging
instrumentation sector, such as the IEEE
Medical Imaging Conference, celebrated on a
yearly basis, and witnessing how the trends of
previous year have been given up an new ones
are on the spot.
The urge to evolve nuclear imaging detectors
is dynamizing the activity of nuclear physics
groups, while on the other hand, mid-term
stability in the scientific goals needed to face
multi-national nuclear physics experiments
makes it possible to train and shape the best
technicians, doctors, researchers and in general
experts in technology for nuclear detection.
There are many examples of researchers
trained in nuclear physics groups doing basic
research that have later pursued successful
careers in the medical imaging industry.
This chapter provided a glimpse on how
nuclear physics research has been involved in
the medical imaging advance and, more
interestingly, how our current efforts are
paving the way for the imaging technologies of
tomorrow. Spectral CT, PET/MRI scanners,
devices for quality control of hadrontherapy, to
name a few, will be commonplace in the most
up to date clinical practice in a few years. We
feel more than ever that it is our duty to help
and promote the translation of developments
from our nuclear physics labs and basic
nuclear science experiments into practical tools
for the clinical and preclinical environments.
This chapter reflects the fact that inside the
nuclear physics community, research and
development activities in medical imaging
detector development coexist, at times even in
the same group, with the preparation of nuclear
physics experiments. This makes it possible
that, even when from the outside basic nuclear
physics efforts look far from real world
application, actually it will continue to provide
the best ground field to test new technologies
in detector, electronics and processing and to
help obtaining critical mass to interface with
the medical imaging industry.
6 References
Preclinical Imaging section
Balcerzyk M, Kontaxakis G, Delgado M, Garcia-Garcia L, Correcher C, Gonzalez AJ, Gonzalez A,
Rubio JL, Benlloch JM, Pozo MA (2009) Initial performance evaluation of a high resolution Albira
small animal positron emission tomography scanner with monolithic crystals and depth of-interaction
encoding from a user’s perspective. Meas Sci Technol 20:104011.
Barrett HH (1972) Fresnel zone plate imaging innuclear medicine. J Nucl Med 13-382-385.
Beekman FJ, van der Have F, Vastenhouw B, van der Linden AJA, van Rijk PP, Burbach JPH,Smidt
MP (2005) U-SPECT-I: a novel system for submillimeter-resolution tomography with radiolabelled
molecules in mice. J Nucl Med 46:1194-1200.
Chatziioannou AF, Cherry SR, Shao Y, Silverman RW,Meadors K, Farquhar TH, Pedarsani M, Phelps
ME (1999). Performance evaluation of microPET: a high-resolution lutetium oxyorthosilicate PET
scanner for animal imaging. J Nucl Med 40: 1164-1175.
Del Guerra A, Di Domenico G, Scandola M, Zavattini G (1998) High spatial resolution small animal
YAP-PET. Nucl Instrum Meth A 409(1-3)537-541.
Feldkamp LA, Davis LC, Kress JW (1984) Practical cone-beam algorithm. J Opt Soc Am A 6:612-
619.
Fontaine R, Belanger F, Cadorette J, Leroux J-D,Martin J-P, Michaud J-B, Pratte J-F, RobertS,
Lecomte R (2005) Architecture of a dualmodality,high-resolution, fully digital positronemission
tomography/computed tomography(PET/CT) scanner for small animal imaging.IEEE Trans Nucl Sci
NS52:691-696
Furenlid LR,Wilson DW, Chen Y-C, Kim H, Pietraski PJ, Crawford MJ, Barrett HH (2004) Fast-
SPECT II: a second-generation high-resolution dynamic SPECT imager. IEEE Trans Nucl Sci
NS51:631-635.
Golovin V, Saveliev V (2004) Novel type of avalanche photodetector with Geiger mode operation.
Nucl Instrum Meth A 518:560-564.
Llosa G, Belcari N, Bisogni MG, Marcatili S, Collazuol, G, Piemonte C, Barrillon P, Bondil-Blin S,
De La Taille C, Del Guerra A, Lacasta C (2009) Monolithic 64-channel silicon photomultiplier
matrices for small animal PET. 2009 IEEE nuclear science symposium conference record, Orlando,
FL, 25-31 Oct 2009, CD ROM: M5-91.
Mackewn JE, Strul D, Hallett WA, Halsted P, Page RA, Keevil SF, Williams SCR, Cherry SR,
Marsden PK (2005) Design and development of an MR-compatible PET scanner for imaging small
animals. IEEE Trans Nucl Sci NS-52:1376.
Massoud TF, Gambhir SS (2003) Molecular imaging in living subjects: seeing fundamental biological
processes in a new light. Genes Dev 17:545.
Meikle SR, Kench P, Weisenberger AG, Wojcik R, Smith MF, Majewski S, Eberl S, Fulton RR,
Rosenfeld AB, Fulham MJ (2002) A prototype coded aperture detector for small animal SPECT. IEEE
Trans Nucl Sci NS-49:2167-2171.
Moses WW, Derenzo SE (1994) Design studies for a PET detector module using a PIN photodiode to
measure depth of interaction. IEEE Trans NuclSci NS-41:1441.
Olcott PD, Talcott JA, Levin CS, Habte F, Foudray AMK (2005) Compact readout electronics for
position sensitive photomultiplier tubes. IEEE Trans Nucl Sci NS-52:21-27.
Paulus MJ, Gleason SS, Kennel SJ, Hunsicker PR,Johnson DK (2000) High resolution X-ray
computed tomography: an emerging tool for small animal cancer research. Neoplasia 2(1-2):62-70.
Pichler BJ, Bernecker F, Boning G, Rafecas M, Pimpl W, Schwaiger M, Lorenz E, Ziegler SI (2001)
A 4×8 APD array, consisting of two monolithic silicon wafers, coupled to a 32-channel LSO matrix
for high-resolution PET. IEEE Trans Nucl Sci NS-48(4):1391-1396,
Popov V, Majewski S, Weisenberger AG, Wojcik R (2001) Analog readout system with charge
division type output. IEEE Nucl Sci Sym Conf Rec 4:1937.
Saoudi A, Pepin CM, Dion F, Bentourkia M, Lecomte R, Andreaco M, Casey M, Nutt R, Dautet H
(1999) Investigation of depth-of-interaction by pulse shape discrimination in multicrystal detectors
read out by avalanche photodiodes. IEEE Trans Nucl Sci NS-46(3):479-484.
Stock SR (2008) Micro computed tomography. CRC Press, Boca Raton
Weisenberger AG, Wojcik R, Bradley EL, Brewer P, Majewski S, Qian J, Ranck A, Saha MS, Smith
K, Smith MF, Welsh RE (2003) SPECT-CT system for small animal imaging. IEEE Trans Nucl Sci
NS-50:74-79.
Detector design section
Joanna Iwanowska et al., Performance of cerium-doped Gd3Al2Ga3O12 (GAGG:Ce) scintillator in
gamma-ray spectrometry, Nuclear Instruments and Methods in Physics Research A 712 (2013) 34–40
K. Kamada, et al., Journal of Physics D Applied Physics 44 (2011) 505104.
Kagawa S et al, Fully ion‐ implanted p+‐ n germanium avalanche photodiodes, Appl. Phys. Lett. 38,
429 (1981).
Leconte R et al, Performance Characteristics of BGO-Silicon Avalanche Photodiode Detectors for
PET, Nuclear Science, IEEE Transactions on (Volume:32 , Issue: 1 ) (1985) 482-486
Schmand M, Grazioso R, Nutt R, et al. Combined PET/MR imaging system and APD-based PET
detector for use in simultaneous PET/MR imaging. US20070102641, 2007.
Ronzhin A et al., Tests of timing properties of silicon photomultipliers, Nuclear Instruments and
Methods in Physics Research A 616 (2010) 38–44
Ronzhin A et al., A SiPM-based TOF-PET detector with high speed digital DRS4 readout, Nuclear
Instruments and Methods in Physics Research A 703, 1 March 2013, Pages 109–113
Otte A N et al, A test of silicon photomultipliers as readout for PET, Nuclear Instruments and Methods
in Physics Research A 545 (2005) 705–715
Pichler BJ et al, Lutetium oxyorthosilicate block detector readout by avalanche photodiode arrays for
high resolution animal PET, Phys. Med. Biol. 2004, 49 (18):4305-19.

Dokhale PA et al, Performance measurements of a depth-encoding PET detector module based on
position-sensitive avalanche photodiode read-out, Phys Med Biol. 2004, 49(18):4293-304.
Yang Y et al, Depth of interaction resolution measurements for a high resolution PET detector using
position sensitive avalanche photodiodes, Phys Med Biol. 2006 May 7;51(9):2131-42
Kataoka J et al, Development of an APD-Based PET Module
and Preliminary Resolution Performance of an
Experimental Prototype Gantry, IEEE TRANSACTIONS ON NUCLEAR SCIENCE, VOL. 57, NO. 5,
OCTOBER 2010
Britvitch I et al, Characterisation of Geiger-mode avalanche photodiodes for medical imaging
applications, Nuclear Instruments and Methods in Physics Research A 571 (2007) 308–311
Judenhofer MS et al, Simultaneous PET-MRI: a new approach for functional and morphological
imaging, Nature Medicine 14, 459 - 465 (2008)
Spanoudaki VC, Levin CS, Photo-Detectors for Time of Flight Positron Emission Tomography (ToF-
PET), Sensors 2010, 10(11), 10484-10505
van Dam HT et al, Sub-200 ps CRT in monolithic scintillator PET detectors using digital SiPM arrays
and maximum likelihood interaction time estimation, Phys Med Biol. 2013 May 21;58(10):3243-57
Seifert S et al, First characterization of a digital SiPM based time-of-flight PET detector with 1 mm
spatial resolution, Phys Med Biol. 2013 May 7;58(9):3061-74
Yamamoto S et al, Development of an ultrahigh-resolution Si-PM-based dual-head GAGG
coincidence imaging system, Nuclear Instruments and Methods in Physics Research A 703, 1 March
2013, Pages 183–189
US Patent 7,723,694 B2, Date of Patent: May 25,2010
Degenhardt, C. et al, The Digital Silicon Photomultiplier–A Novel sensor for the Detection of
Scintillation Light. In Proceedings of Nuclear Science Symposium Conference Record (NSS/MIC),
Orlando, FL, USA, October 24, 2009-November 1, 2009; pp. 2383–2386.
Frach, T. et al, The Digital Silicon Photomultiplier–Principle of Operation and Intrinsic Detector
Performance. In Proceedings of Nuclear Science Symposium Conference Record (NSS/MIC), Orlando,
FL, USA, October 24, 2009-November 1, 2009; pp. 1959–1965.
Degenhardt, C. Arrays of digital Silicon Photomultipliers — Intrinsic performance and application to
scintillator readout, Nuclear Science Symposium Conference Record (NSS/MIC), 2010 IEEE.
Llosa G. et al, Characterization of a PET detector head based on continuous LYSO crystals and
monolithic, 64-pixel silicon photomultiplier matrices, Phys. Med. Biol. 55 7299.
Pennazio, F. et al, Simulations of the 4DMPET SiPM-based PET module, Nuclear Science
Symposium and Medical Imaging Conference (NSS/MIC), 2011 IEEE, 2316 – 2320.
Maas MC. et al, Monolithic scintillator PET detectors with intrinsic depth-of-interaction correction,
Phys. Med. Biol. 54 1893
Zhi L. et al, Nonlinear least-squares modeling of 3D interaction position in a monolithic scintillator
block, Phys. Med. Biol. 55 6515
Morrocchi M. et al, DEVELOPMENT OF A PET DETECTOR MODULE WITH DEPTH OF
INTERACTION CAPABILITY, 13th Vienna Conference on Instrumentation
T.E. Schlesinger, R.B. James, "Semiconductors for Room Temperature Nuclear Detector
Applications," Semiconductors and Semimetals Vol. 43, Academic Press, 1995. T. E. Schlesinger, J. E. Toney, H. Yoon, E. Y. Lee, B. A. Brunett, L. Franks, and R. B. James,
“Cadmium zinc telluride and its use as a nuclear radiation detector material,” Materials Science and
Engineering: R: Reports, vol. 32, no. 4–5, pp. 103–189, Avril 2001. Y. Eisen,, A. Shor, and I. Mardor, “CdTe and CdZnTe X-Ray and Gamma-Ray Detectors for Imaging
Systems,” IEEE Transactions on Nuclear Science, vol. 51, no. 3, p. 1191, Jun. 2004. L. Verger, M. C. Gentet, L. Gerfault, R. Guillemaud, C. Mestais, O. Monnet, G. Montemont, G.
Petroz, J. P. Rostaing, and J. Rustique, “Performance and perspectives of a CdZnTe-based gamma
camera for medical imaging,” Nuclear Science, IEEE Transactions on, vol. 51, no. 6, pp. 3111–3117,
2004. L.-J. Meng, J. W. Tan, K. Spartiotis, and T. Schulman, “Preliminary evaluation of a novel energy-
resolved photon-counting gamma ray detector,” Nuclear Instruments and Methods in Physics
Research Section A: Accelerators, Spectrometers, Detectors and Associated Equipment, vol. 604, no.
3, pp. 548–554, Juin 2009. G. Montemont, S. Lux, O. Monnet, S. Stanchina, and L. Verger, “Evaluation of a CZT gamma-ray
detection module concept for SPECT,” in 2012 IEEE Nuclear Science Symposium and Medical
Imaging Conference (NSS/MIC), 2012, pp. 4091–4097. M. Bocher, I. M. Blevis, L. Tsukerman, Y. Shrem, G. Kovalski, and L. Volokh, “A fast cardiac
gamma camera with dynamic SPECT capabilities: design, system validation and future potential,” Eur
J Nucl Med Mol Imaging, Jun. 2010. K. Erlandsson, K. Kacperski, D. van Gramberg, and B. F. Hutton, “Performance evaluation of D-
SPECT: a novel SPECT system for nuclear cardiology,” Phys. Med. Biol., vol. 54, no. 9, pp. 2635–
2649, May 2009. S. Ben-Haim, K. Kacperski, S. Hain, D. Gramberg, B. F. Hutton, K. Erlandsson, T. Sharir, N. Roth,
W. A. Waddington, D. S. Berman, and P. J. Ell, “Simultaneous dual-radionuclide myocardial
perfusion imaging with a solid-state dedicated cardiac camera,” Eur J Nucl Med Mol Imaging, vol. 37,
no. 9, pp. 1710–1721, Apr. 2010.
Simulation and reconstruction section
Aguiar, P.; Rafecas, M.; Ortuño, J. E.; Kontaxakis, G.; Santos, A.; Pavía, J. & Ros, D. (2010).
Geometrical and Monte Carlo projectors in 3D PET reconstruction., Med Phys 37 : 5691-5702.
Barrett, H. H., White, T., & Parra, L. C. (1997). List-mode likelihood. JOSA A, 14(11), 2914-2923.
Blume, M; Navab, N; & Rafecas, M. (2012). Joint image and motion reconstruction for PET using a
B-spline motion model., Phys Med Biol 57: 8249–8270.
Boutchko, R.; Sitek, A. & Gullberg, G. T. (2013). Practical implementation of tetrahedral mesh
reconstruction in emission tomography., Phys Med Biol 58 : 3001-3022.
Bruyant, P. P. (2002). Analytic and iterative reconstruction algorithms in SPECT., J Nucl Med 43 :
1343-1358.
Buvat, I. & Castiglioni, I. (2002). Monte Carlo simulations in SPECT and PET, Quarterly Journal of
Nuclear Medicine 46 : 48-61.
Buvat, I.; Morel, C. & Visvikis, D. (2012). Hybrid GATE: A GPU/CPU implementation for imaging
and therapy applications, : 2247-2250.
Conti, M. (2011). Focus on time-of-flight PET: the benefits of improved time resolution. European
Journal of Nuclear Medicine and Molecular Imaging, 38(6), 1147-1157.
Defrise, M. & Gullberg, G. T. (2006). Image reconstruction., Phys Med Biol 51 : R139-R154.
Fayad, H.J.; Lamare, F.; Le Rest C.C.; Bettinardi, V.; & Visvikis, D. (2013). Generation of 4-
dimensional CT images based on 4-dimensional PET-derived motion fields., J Nucl Med 54(4): 631-8.
Goddard, I. & Trepanier, M. (2002). High-speed cone-beam reconstruction: an embedded systems
approach, : 483-491.
Harrison, R. (2012). . In: Grupen, C. & Buvat, I. (Ed.), Simulation of Medical Imaging Systems:
Emission and Transmission Tomography, Springer Berlin Heidelberg.
Israel-Jost, V.; Choquet, P.; Salmon, S.; Blondet, C.; Sonnendrücker, E. & Constantinesco, A. (2006).
Pinhole SPECT imaging: compact projection/backprojection operator for efficient algebraic
reconstruction., IEEE Trans Med Imaging 25 : 158-167.
Kupinski, M. (2012). Evaluation and Image Quality in Radiation-Based Medical Imaging. In: Grupen,
C. & Buvat, I. (Ed.), Handbook of Particle Detection and Imaging, Springer Berlin Heidelberg.
Lazaro, D.; El Bitar, Z.; Hill, V. B. D. & Buvat, I. (2005). Fully 3D Monte Carlo reconstruction in
SPECT: a feasibility study, Phys. Med. Biol. 50 : 3739-3754.
Lewitt, R. M. (1992). Alternatives to voxels for image representation in iterative reconstruction
algorithms. Physics in Medicine and Biology, 37(3), 705.
Lewitt, R. M. & Matej, S. (2003). Overview of Methods for Image Reconstruction From Projections in
Emission Computed Tomography, Proc of the IEEE 91 : 1558-1611.
Ljungberg, M.; Strand, S. & King, M., 1998. Monte Carlo Calculations in Nuclear Medicine:
Applications in Diagnostic Imaging. Inst. of Physics Publ., .
Panin, V. Y.; Kehren, F.; Michel, C. & Casey, M. (2006). Fully 3-D PET reconstruction with system
matrix derived from point source measurements., IEEE Trans Med Imaging 25 : 907-921.
Pratx, G. & Levin, C. (2011). Online detector response calculations for high-resolution PET image
reconstruction., Phys Med Biol 56 : 4023-4040.
Pratx, G., & Xing, L. (2011). GPU computing in medical physics: A review. Med Phys, 38, 2685.
Qi, J. Y. & Leahy, R. M. (1998). Iterative reconstruction techniques in emission computed
tomography, Phys. Med. Biol. 51 : R541-R578.
Rafecas, M.; Mosler, B.; Dietz, M.; Pogl, M.; Stamatakis, A.; McElroy, D. & Ziegler, S. (2004). Use of
a Monte Carlo-based probability matrix for 3-D iterative reconstruction of MADPET-II data, Nuclear
Science, IEEE Transactions on 51 : 2597-2605.
Rahmim, A., Rousset, O., & Zaidi, H. (2007). Strategies for motion tracking and correction in PET.
PET Clinics, 2(2), 251-266.
Rehfeld, N. & Alber, M. (2007). A parallelizable compression scheme for Monte Carlo scatter system
matrices in PET image reconstruction., Phys Med Biol 52 : 3421-3437.
Salomon, A., Goedicke, A., Schweizer, B., Aach, T., & Schulz, V. (2011). Simultaneous reconstruction
of activity and attenuation for PET/MR, IEEE Trans. Med. Imag. 30: 804–813
Tang, J.; Nett, B. E. & Chen, G.-H. (2009). Performance comparison between total variation (TV)-
based compressed sensing and statistical iterative reconstruction algorithms., Phys Med Biol 54 :
5781-5804.
Photon counting section
N. Wermes, “Pixel detectors for tracking and their spin-off in imaging applications,” Nucl. Instrum.
and Meth. A, vol. 541, pp. 150-165, 2005.
J. Yorkston, “Recent developments in digital radiography detectors,” Nucl. Instrum. and Meth., A vol.
580, pp. 974-985, 2007.
M. Cristinziani et al., “The ATLAS pixel detector,” Nucl. Instrum. and Meth. A, vol. 582, pp. 714-
718, 2007.
H.C. Kästli et al., “CMS barrel pixel detector overview,” Nucl. Instrum. and Meth. A, vol. 582, pp.
724-727, 2007.
C. Broennimann et al., “The PILATUS 1M detector,” J. Synchr. Rad., vol. 13, pp. 120-130, 2006.
B. Henrich et al., “PILATUS: A single photon counting detector for X-ray applications,” Nucl.
Instrum. and Meth. A, vol. 607, pp. 247-249, 2009.
R. Dinapoli et al., “EIGER: Next generation single photon counting detector for X-ray applications,”
Nucl. Instrum. and Meth. A, vol. 650, pp. 79-83, 2011.
V. Radicci et al., “EIGER: A new single photon counting detector for X-ray applications: performance
of the chip,” JINST, vol. 7, C02019, 2012.
X. Llopart et al., “MEDIPIX2: A 64-k pixel readout chip with 55 µm square elements working in
single photon counting mode,” IEEE Trans. Nucl. Sci., vol. 49, pp. 2279-2283, 2002.
R. Ballabriga et al., “The Medipix3 prototype, a pixel readout chip working in single photon counting
mode with improved spectrometric performance,” IEEE Trans. Nucl. Sci., vol. 54, pp. 1824-1829,
2007.
R. Ballabriga et al., “Medipix3: A 64k pixel detector readout chip working in single photon counting
mode with improved spectrometric performance,” Nucl. Instrum. and Meth. A, vol. 633, pp. S15-
S18, 2011.
E.N. Gimenez et al., “Characterization of Medipix3 with synchrotron radiation,” IEEE Trans. Nucl.
Sci., vol. 58, pp. 323-332, 2011.
P. Delpierre et al., “XPAD: A photon counting pixels detector for material sciences and small animal
imaging,” Nucl. Instrum. and Meth. A, vol. 572, pp. 250-254, 2007.
P. Pangaud et al., "XPAD3: a new photon counting chip for small animal imaging," Nucl. Instrum.
and Meth. A, vol. 571, pp. 321-324, 2007.
P. Pangaud et al., “XPAD3-S: a fast hybrid pixel readout chip for X-ray synchrotron facilities,” Nucl.
Instrum. and Meth. A, vol. 591, pp. 159-162, 2008.
R. Bellazzin et al., “Chromatic X-ray imaging with a fine pitch CdTe sensor coupled to a large area
photon counting pixel ASIC,” JINST, vol. 8, C02028, 2013.
R.E. Alvarez and A. Macovsky, “Energy-selective reconstruction in X-ray computerized
tomography,” Phys. Med. Biol., vol. 21, pp. 733-744, 1976.
S.J. Riederer and C.A. Mistretta, “Selective iodine imaging using K-edge energies in computerized X-
ray tomography,” Med. Phys., vol. 4, pp. 474-481, 1977.
M.J. Tapiovaara and R.F. Wagner, “SNR and DQE analysis of broad spectrum X-ray imaging,” Phys.
Med. Biol., vol. 30, pp. 519-529, 1985.
P.M. Shikhaliev, “Energy-resolved computed tomography: first experimental results,” Phys. Med.
Biol., vol. 53, pp. 5595-5613, 2008.
T.G. Schmidt, (2009) “Optimal “Imaged-based“ weighting for energy-resolved CT,” Med. Phys., vol.
36, pp. 3018-3027, 2009.
E. Roessl and R. Proksa, “K-edge imaging in X-ray computed tomography using multi-bin photon
counting detectors,” Phys. Med. Biol., vol. 52, pp. 4679-4696, 2007.
J.P. Schlomka et al., “Experimental feasibility of multi-energy photon-counting K-edge imaging in
pre-clinical computed tomography,” Phys. Med. Biol., vol. 53, pp. 4031-4047, 2008.
A.P.H. Butler et al., “Bio-medical X-ray imaging with spectroscopic pixel detectors,” Nucl. Instrum.
and Meth. A, vol. 591, pp. 141-146, 2008.
M. Firsching et al., “Contrast agent recognition in small animal CT using the Medipix2 detector,”
Nucl. Instrum. Meth. A, vol. 607, pp. 179-182, 2009.
L. Tlustos, “Spectroscopic X-ray imaging with photon counting pixel detectors,” Nucl. Instrum. and
Meth. A, vol. 623, pp. 823-828, 2010.
N.G. Anderson et al., “Spectroscopic (multi-energy) CT distinguishes iodine and barium contrast
material in Mice,” Eur Radiol., vol. 20, pp. 2126-2134, 2010.
J.P. Ronaldson et al., “The performance of MARS-CT using Medipix3 for spectral imaging of soft-
tissue,” in Proc. of the 2011 IEEE NSS/MIC, IEEE Press, pp. 4002-4008, 2011.
F. Cassol Brunner et al., “First K-edge imaging with a micro-CT based on the XPAD3 hybrid pixel
detector,” IEEE Trans. Nucl. Sci., vol. 60, pp. 103-108, 2012.
F. Cassol Brunner et al., "Imaging performance of hybrid pixel detectors XPAD3-S," Phys. Med.
Biol., vol. 54, pp. 1773-1789, 2009.
C. Ponchut, “Correction of the charge sharing in photon-counting pixel detector data,” Nucl. Instrum.
and Meth. A, vol. 591, pp. 311-313, 2008.
F. Cassol Brunner et al., “Study of the charge sharing effecting the photon-counting pixel detector
XPAD3-S,” Nucl. Instrum. and Meth. A, vol. 633, pp. S111-S113, 2011.
J. Marchal and K. Medjoubi, “Detective quantum efficiency model of single X-ray photon counting
hybrid pixel detectors,” JINST, vol. 7, P11028, 2012.
D.P. Cormode et al., “Atherosclerotic plaque composition: analysis with multicolour CT and targeted
gold nanoparticles,” Radiology, vol. 256, pp. 774-782, 2010.
E. Roessl et al., “Precinical spectral computed tomography of gold nano-particles,” Nucl. Instrum. and
Meth. A, vol. 648, pp. S259-S264, 2011.
S. Basolo et al., “A 20 kpixels CdTe photon-counting imager using XPAD chip,” Nucl. Instrum. and
Meth. A, vol. 589, pp. 268-274, 2008.
R. Steadman et al., “ChromAIX: a high-rate energy-resolving photon counting ASIC for spectral
computed tomography,” in Proc. of SPIE Medical Imaging Conference, vol. 7622, 762220, 2010.
R. Steadman et al., “ChromAIX: fast photon-counting ASIC for spectral computed tomography,”
Nucl. Instrum. and Meth. A, vol. 648, pp. S211-S215, 2011.
T. Koenig et al., “Imaging properties of small-pixel spectroscopic X-ray detectors based on cadmium
telluride sensors,” Phys. Med. Biol., vol. 57, pp. 6743-6759, 2012.
L. Tlustos, G. Shelkov and O.P. Tolbanov, “Characterisation of a GaAs(Cr) Medipix2 hybrid pixel
detector,” Nucl. Instrum. and Meth. A, vol. 633, pp. S103-S107, 2011.
E. Hamann et al., “Characterisation of photon counting pixel detectors based on semi-insulating GaAs
sensor material,” J. of Physics: Conf. Series, vol. 425, 062015, 2013.
C. Herrmann, R. Steadman and O. Mülhens, “ChromAIX: fast energy resolved photon-counting
readout electronics for future human computed tomography,” in Proc. of the 2010 IEEE NSS/MIC,
IEEE Press, pp. 1996-1999, 2010.
W.C. Barber et al., “Energy-resolved photon-counting X-ray imaging arrays for clinical K-edge CT,”
in Proc. of the 2011 IEEE NSS/MIC, IEEE Press, pp. 4441-4446, 2011.
P.M. Shikhaliev and S.G. Fritz, “Photon counting spectral CT versus conventional CT: comparative
evaluation fro breast imaging applications,” Phys. Med. Biol., vol. 56, pp. 1905-1930, 2011.
H. Ouamara et al., “Comparison of the performance of the photon counting hybrid pixel camera
XPAD3 versus the CCD camera DALSA XR-4 for cone-beam micro-CT,” in Proc. of the 2012
IEEE NSS/MIC, IEEE Press, pp. 3756-3759, 2012.
S.M. Jorgensen, D.R. Eaker and E.L. Ritman, “Biomedical spectral X-ray imaging; promises and
challenges,” in Medical Applications of Radiation Detectors, edited by H.B. Barber, H. Roehrig
and D.J. Wagenaar, Proc. of SPIE, vol. 8143, 814302, 2011.
Quality control in Hadrontherapy section Abe, M.: Charged particle radiotherapy at the Hyogo Ion Beam Medical Center: Characteristics,
technology and clinical results. Proc. Jpn. Acad., Ser. B 83, pp. 151-163, 2007.
Agodi et al Charged particle's flux measurement from PMMA irradiated by 80 MeV/u carbon ion
beam. Phys Med Biol. 2012 Sep 21;57(18):5667-78
Amaldi, U.; Hajdas, W.; Iliescu, S.; Malakhov, N.; Samarati, J.; Sauli, F. & Watts, D.: Advanced
Quality Assurance for CNAO. Nucl. Instr. Meth. A 617, pp. 248-249, 2010.
Attanasi, F.; Belcari, N.; Moehrs, S.; Rosso, V.; Vecchio, S.; Cirrone, G. A. P.; Cuttone, G.; Lojacono,
P.; Romano, F.; Lanconelli, N. & Del Guerra, A.: Characterization of an in-beam PET prototype for
proton therapy with different target compositions. IEEE Trans. Nucl. Sci. 57, pp. 1563-1569, 2010.
Bauer, J.; Unholtz, D.; Sommerer, F.; Kurz, C.; Haberer, T.; Herfarth, K.; Welzel, T.; Combs, S. E.;
Debus, J. & Parodi, K.: Implementation and initial clinical experience of offline PET/CT-based
verification of scanned carbon ion treatment. Radiother. Oncol., 2013 107(2):218-26
Bauer J, Unholtz D, Kurz C, Parodi K An experimental approach to improve the Monte Carlo
modelling of offline PET/CT-imaging of positron emitters induced by scanned proton beams. Phys
Med Biol. 2013b58(15):5193-213
Biegun et al Time-of-flight neutron rejection to improve prompt gamma imaging for proton range
verification: a simulation study. Phys Med Biol. 2012 Oct 21;57(20):6429-44
Bom, V.; Joulaeizadeh, L. & Beekman, F.: Real-time prompt gamma monitoring in spot-scanning
proton therapy using imaging through a knife-edge-shaped slit. Phys. Med. Biol. 57, pp. 297-308,
2012.
Crespo P, Shakirin G, Fiedler F, Enghardt W, Wagner A Direct time-of-flight for quantitative, real-
time in-beam PET: a concept and feasibility study Phys Med Biol. 2007 Dec 7;52(23):6795-811
Dauvergne, D.; Battaglia, M.; Montarou, G. & Testa, E.: New methods of real-time control imaging
for ion therapy. NIRS-ETOILE Joint Symposium on Carbon Ion Therapy, 2009, available at
http://hal.in2p3.fr/in2p3-00363382
Enghardt, W.; Debus, J.; Haberer, T.; Hasch, B.G.; Hinz, R.; Jäkel, O.; Krämer, M.; Lauckner, K. &
Pönisch, F.: Positron emission tomography for quality assurance of cancer therapy with light ion
beams. Nucl. Phys. A 654, pp. 1047c-1050c, 1999.
Enghardt, W.; Crespo, P.; Fiedler, F.; Hinz, R.; Parodi, K.; Pawelke, J. & Pönisch, F.: Charged hadron
tumour therapy monitoring by means of PET. Nucl. Instr. Meth. A 525, pp. 284-288, 2004.
Golnik, C.; Dersch, U.; Fiedler, F.; Kormoll, T.; Rohling, H. & Enghardt, W.: A pair production
upgrade for a compton imager for in-vivo dosimetry at therapeutic proton and ion beams. IEEE
NSS/MIC 23.-29.10.2011, Valencia, Spain, 2011.
Gwosch, K.; Hartmann, B.; Jakubek, J.; Granja, C.; Soukup, P.; Jäkel, O. & Martišíková, M.: Non-
invasive monitoring of therapeutic carbon ion beams in a homogeneous phantom by tracking of
secondary ions. Phys. Med. Biol. 58, pp. 3755-3773, 2013.
Helmbrecht, S.; Santiago, A.; Enghardt, W.; Kuess, P. & Fiedler, F.: On the feasibility of automatic
detection of range deviations from in-beam PET data. Phys. Med. Biol., 57, pp. 1387-1397, 2012.
Henriquet, P.; Testa, E.; Chevallier, M.; Dauvergne, D.; Dedes, G.; Freud, N.; Krimmer, J.; Létang,
J.M.; Ray, C.; Richard, M.H. & Sauli, F.: Interaction vertex imaging (IVI) for carbon ion therapy
monitoring: a feasibility study. Phys. Med. Biol. 57(14), pp. 4655-4669, 2012.
Iseki, Y.; Kanai, T.; Kanazawa, M.; Kitagawa, A.; Mizuno, H.; Tomitani, T.; Suda, M. & Urakabe, E.:
Range verification system using positron emitting beams for heavy-ion radiotherapy. Phys. Med. Biol.
49, pp. 3179-3195, 2004.
Kormoll, T.; Fiedler, F.; Schöne, S.; Wüstemann, J.; Zuber, K. & Enghardt, W.: A Compton imager
for in-vivo dosimetry of proton beams - A design study. Nucl. Instr. Meth. A 626-627, pp. 114-119,
2011.
Kuess, P.; Birkfellner, W.; Enghardt, W.; Helmbrecht, S.; Fiedler, F. & Georg, D.: Using statistical
measures for automated comparison of in-beam PET data. Med. Phys. 39, pp. 5874-5881, 2012.
Kunath, D.; Kluge, T.; Pawelke, J.; Priegnitz, M. & Enghardt, W.: In-beam and off-beam PET
measurements of target activation by megavolt x-ray beams. IEEE Trans. Nucl. Sci. 56, pp. 57-65,
2009.
Lang, C.; Habs, D.; Thirolf, P.G.; Zoglauer, A.: Submillimeter nuclear medical imaging with a
Compton Camera using triple coincidences of collinear +-annihilation photons and -rays. ICTR-
PHE, 27.02. – 02.03.2012, Geneva, Switzerland. arXiv:1202.0397 [physics.ins-det]
Min, C.; Kim, C.; Youn, M. & Kim, J.: Prompt gamma measurements for locating the dose falloff
region in the proton therapy. Appl. Phys. Lett. 89, p. 183517, 2006.
Min, C.; Zhu, X.; Winey, B.; Grogg, K.; Testa, M.; El Fakhri, G.; Bortfeld, T.; Paganetti, H. & Shih,
H.: Clinical application of in-room positron emission tomography for in vivo treatment monitoring in
proton radiation therapy. Int. J. Radiat. Oncol. Biol. Phys. 86, pp. 183–189, 2013.
Nishio, T.; Miyatake, A.; Ogino, T.; Nakagawa, K.; Saijo, N. & Esumi, H.: The development and
clinical use of a beam on-line PET system mounted on a rotating gantry port in proton therapy. Int. J.
Radiation Oncology Biol. Phys. 76, pp. 277-286, 2010.
Parodi, K.; Bortfeld, T.; Enghardt, W.; Fiedler, F.; Knopf, A.; Paganetti, H.; Pawelke, J.; Shakirin, G.
& Shih, H.: PET imaging for treatment verification of ion therapy: Implementation and experience at
GSI Darmstadt and MGH Boston. Nucl. Instrum. Meth. A 591, pp. 282-286, 2008.
Priegnitz, M.; Fiedler, F.; Kunath, D.; Laube, K. & Enghardt, W.: An experiment-based approach for
predicting positron emitter distributions produced during therapeutic ion irradiation. IEEE Trans.
Nucl. Sci. 59, pp. 77-87, 2012.
Rinaldi IBrons S, Gordon J, Panse R, Voss B, Jäkel O, Parodi K. Experimental characterization of a
prototype detector system for carbon ion radiography and tomography Phys Med
Phys Med Biol. 2013 Feb 7;58(3):413-27
Roellinghoff, F.: Real-time proton beam range monitoring by means of prompt-gamma detection with
a collimated camera. ICTR-PHE, 27.02. – 02.03.2012, Geneva, Switzerland.
Sadrozinski, H.F.; Johnson, R.P.; Macafee, S.; Plumb, A.; Steinberg, D.; Zatserklyaniy, A.; Hurley,
V.B. & Schulte, R.: Development of a Head Scanner for Proton CT. Nucl. Instrum. Meth. A 699, pp.
205-210, 2013.
Schneider U, Pemler P, Besserer J, Pedroni E, Lomax A, Kaser-Hotz Patient specific optimization of
the relation between CT-hounsfield units and proton stopping power with proton radiography. Med
Phys. 2005 Jan;32(1):195-9.
Schulte, R.; Bashkirov, V.; Li, T.; Liang, Z.; Mueller, K.; Heimann, J.; Johnson, L.; Keeney, B.;
Sadrozinski, H. F.-W.; Seiden, A.; Williams, D.; Zhang, L.; Li, Z.; Peggs, S.; Satogata, T. & Woody,
C.: Conceptual design of a proton computed tomography system for applications in proton radiation
therapy. IEEE Trans. Nucl. Sci. 51, pp. 866-872, 2004.
Smeets, J.; Roellinghoff, F.; Prieels, D.; Stichelbaut, F.; Benilov, A.; Busca, P.; Fiorini, C.; Peloso, R.;
Basilavecchia, M.; Frizzi, T.; Dehaes, J. & Dubus, A.: Prompt gamma imaging with a slit camera for
real-time range control in proton therapy. Phys. Med. Biol. 57, 3371-3405, 2012.
Stützer, K.; Bert, C.; Enghardt, W.; Helmbrecht, S.; Parodi, K.; Priegnitz, M.; Saito, N. & Fiedler, F.:
Experimental verification of a 4D MLEM reconstruction algorithm used for in-beam PET
measurements in particle therapy. Phys. Med. Biol. 58(15), pp. 5085-5111, 2013.
Tashima H, Yamaya T, Yoshida E, Kinouchi S, Watanabe M, Tanaka E. A single-ring OpenPET
enabling PET imaging during radiotherapy. Phys Med Biol. 2012 Jul 21;57(14):4705-18
Testa, E.; Bajard, M.; Chevallier, M.; Dauvergne, D.; Foulher, F. L.; Freud, N.; Létang, J.; Poizat, J.;
Ray, C. & Testa, M.: Dose profile monitoring with carbon ions by means of prompt-gamma
measurements. Nucl. Instr. Meth. B 267, pp. 993 – 996, 2009.
Unholtz D, Sommerer S, Bauer J, et al. Post-therapeutical +-activity measurements in comparison to
simulations towards in-vivo verification of ion beam therapy. In: conference record of the IEEE
nuclear science symposium and medical imaging conference in Valencia, Spain; 2011
Three gammas section C. Grignon et al., Nuclear medical imaging using
+ coincidences from
44Sc radio-nuclide with liquid
xenon as detection medium, Nucl. Instr. Meth. A 571 (2007) 142.
T. Oger et al., A liquid xenon TPC for a medical imaging Compton telescope, Nucl. Instr. Meth. A
695 (2012) 125.
J. Donnard et al., Compton imaging with liquid xenon and 44
Sc: recent progress toward 3 gamma
imaging, Nucl. Med. Rev. 15 (2012), Suppl. C: C64–C67.

T. Kormoll et al., A Compton imager for in-vivo dosimetry of proton beams - A design study, Nucl.
Instr. Meth. A 626-627 (2011) 114 and Radiother. Oncol. 102(1) (2012) s41.
F. Roellinghoff et al., Design of a Compton camera for 3D prompt- imaging during ion beam therapy,
Nucl. Instr. Meth. A 648 (s1) (2011) s20.
C. Lang et al., Sub-millimeter nuclear medical imaging with high sensitivity in positron emission
tomography using + coincidences, submitted to Journal of Instrumentation (2013).
E. Gonzalez et al., Methods for Increasing the Sensitivity of Simultaneous Multi-Isotope Positron
Emission Tomography, IEEE NSS-MIC Conf. Rec.(2011) 3597-3601.
G. Chinn and C.S. Levin, System and method for using multiple collimation data for tomography, US
patent 7,968,850 (2011).
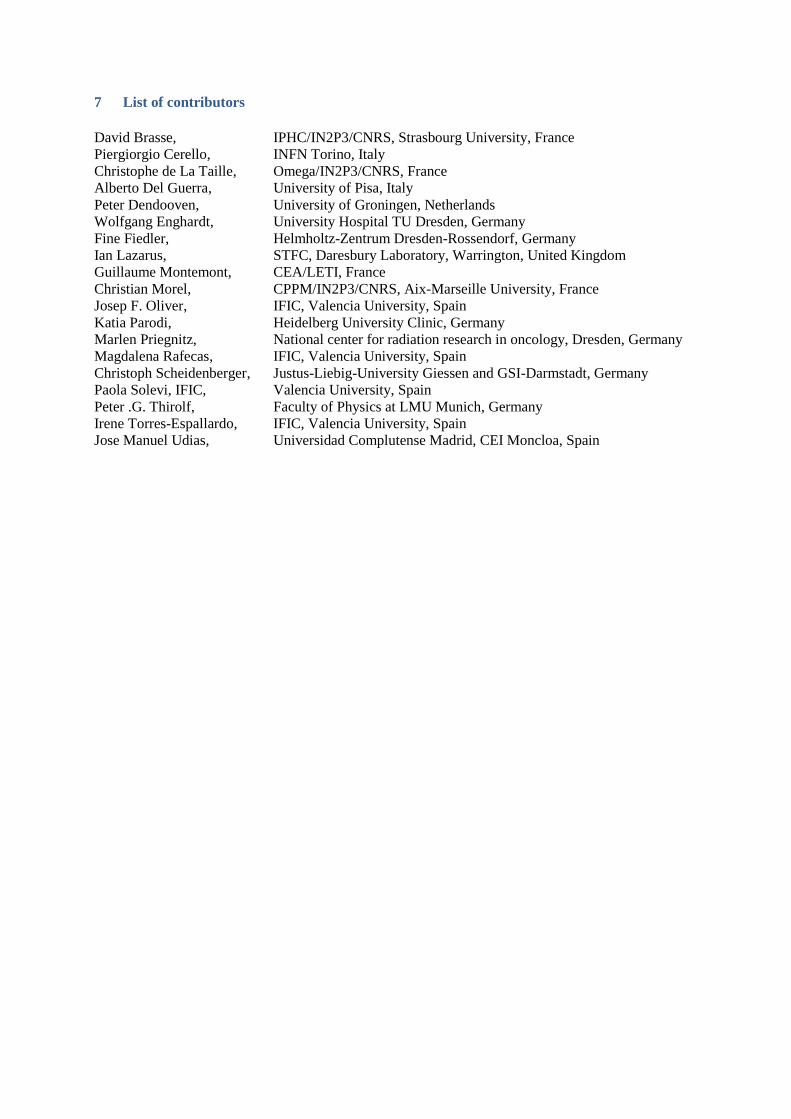
7 List of contributors
David Brasse, IPHC/IN2P3/CNRS, Strasbourg University, France
Piergiorgio Cerello, INFN Torino, Italy
Christophe de La Taille, Omega/IN2P3/CNRS, France
Alberto Del Guerra, University of Pisa, Italy
Peter Dendooven, University of Groningen, Netherlands
Wolfgang Enghardt, University Hospital TU Dresden, Germany
Fine Fiedler, Helmholtz-Zentrum Dresden-Rossendorf, Germany
Ian Lazarus, STFC, Daresbury Laboratory, Warrington, United Kingdom Guillaume Montemont, CEA/LETI, France
Christian Morel, CPPM/IN2P3/CNRS, Aix-Marseille University, France
Josep F. Oliver, IFIC, Valencia University, Spain
Katia Parodi, Heidelberg University Clinic, Germany
Marlen Priegnitz, National center for radiation research in oncology, Dresden, Germany
Magdalena Rafecas, IFIC, Valencia University, Spain
Christoph Scheidenberger, Justus-Liebig-University Giessen and GSI-Darmstadt, Germany
Paola Solevi, IFIC, Valencia University, Spain
Peter .G. Thirolf, Faculty of Physics at LMU Munich, Germany
Irene Torres-Espallardo, IFIC, Valencia University, Spain
Jose Manuel Udias, Universidad Complutense Madrid, CEI Moncloa, Spain


![Nuclear Physics in Medicine - · PDF fileNuclear Physics in Nuclear Physics in Medicine 2013 NuPECC medicine – Chapter 1 - Hadrontherapy [HADRONTHERAPY] Draft – for internal use](https://img.pdfslide.us/doc/110x75/5a802f987f8b9ada388c139d/nuclear-physics-in-medicine-physics-in-nuclear-physics-in-medicine-2013-nupecc.jpg)


![Nuclear Physics in Medicine 2013 [HADRONTHERAPY] - NuPECC](https://img.pdfslide.us/doc/110x75/613c57a3d5ddbd1b6607b8d8/nuclear-physics-in-medicine-2013-hadrontherapy-nupecc.jpg)