Embed Size (px)
Citation preview

Nuclear Gauge Certifi cation
2019-2020
CIT Program

Day 1
9:00 Class start time
9:00 to 9:10 Introduction and announcements
9:10 to 9:25 Standard count
9:25 to 9:40 Calibration and Validation
9:40 to 9:50 Break
9:50 to 10:40 KT-32 Asphalt
10:40 to 10:50 Break
10:50 to 11:15 KT-36 Bridge Deck Overlays
11:15 to 11:45 KT-38 Concrete Pavement
11:45 to 1:00 Lunch
1:00 to 1:50 KT-41 Aggregate Base
1:50 to 2:00 Break
2:00 to 2:45 KT-51 Soils
2:45 to 3:00 Break
3:00 to 5:00 Demonstration of performances and practice of performances
All times are dependent on class size, number of questions and comprehension of the class material.
Day 2
9:00 Instructions 9:15 Testing Begins
Nuclear Gauge Certifi cationClass Agenda

NUCLEAR GAUGE CERTIFICATION CIT PROGRAM
Written Test: Open book – 50 multiple choice questions
Grading: Must score at least 70% or better on the written exam. Failure on any part of the written exam requires retaking the entire exam.
Must pass all performance exam sections. Failure of three or less performance subtest requires retest on only the subtest(s) failed. Failure of four or more subtests of the performance exam requires retest on the entire performance exam.
Exam Results: Exams will be graded in two to three weeks. Exam results are mailed to the student. Exam results are not given over the phone.
Exam Re-takes: Students who need to re-take either the written and/or performance exam need to register to do so. The re-take registration form can be found on the CIT website at www.citksu.com.
To be certified: Students must successfully pass the written exam and the performance exam. The student will be mailed a certification card and letter.

Reasons for Certified Inspector Training (CIT) Training Program Overview
The Kansas Department of Transportation (KDOT) has established this training program to educate, test and certify those individuals responsible for performing inspection and testing functions on KDOT construction projects. KDOT’s Bureau of Construction and Materials has responsibility for the establishment and administration of the materials portion of the KDOT’s Quality Control/Quality Assurance (QC/QA) Program. The Bureau develops standards and specifications for materials, establishes sampling procedures and frequencies, and test procedures used in the laboratory and the field in order to assure compliance with specifications. It performs materials testing to assist each of the six KDOT districts in administering quality assurance functions of the QC/QA Program. Such testing includes tests on materials purchased by contractors or the State for use in maintenance or construction activities. The Bureau also conducts tests on soils, concrete, bituminous mixtures and numerous other specialized materials, the results of which are used by others for a variety of reasons. Quality control and quality assurance activities involve the routine sampling, testing and analysis of various materials to determine the quality of a given product and to attain a quality product. The goal of the Certified Inspection and Testing Training Program (CIT2) is to provide persons engaged in the inspection and/or testing of KDOT construction projects specific training in, but not limited to, soils, aggregates, and concrete and/or asphalt disciplines. Each student is required to demonstrate specific abilities as defined by the training modules described in the CIT2 manual. The manual can be found online at: http://www.ksdot.org/descons.asp#CIT. Federal Funding On projects involving federal funds, KDOT must certify to the Federal Highway Administration as to the quality of each type of material used on each project before the State is completely reimbursed by the federal government.
The certification and training requirements contained in this manual are intended to comply with the requirements of 23 CFR Part 637 which states, “After June 29, 2000, all sampling and testing data to be used in the acceptance decision or the IA (Independent Assurance) program shall be executed by qualified sampling and testing personnel.” Reasons for Quality Control/Quality Assurance
Inspectors fulfill a very important job on any project—they safeguard the public interest in a number of ways.

The primary reason for materials inspection, sampling and testing requirements is to verify that all materials incorporated into the work will meet the requirements of the contract documents, including the plans, specifications, and special provisions.
Plans and specifications are prepared to require the use of certain specific materials known or expected to perform satisfactorily with minimum maintenance throughout the life of the facility or infrastructure project. Any material that deviates appreciably from the specifications requirements will not perform as expected and, in all probability, will shorten the useful life of the facility or add unexpected costs in maintenance. Because there are limited dollars available for transportation infrastructure, the useful life and long-term maintenance costs of every project are critical considerations. Secondly, all contractors bidding or furnishing materials to a project should be treated equally. That is, the contract documents provide a fair and uniform basis for bidding because they define the requirements to be met--ideally with the least possible difference of interpretation. The contractor commits to furnish materials and complete work that will equal or exceed such requirements. For this reason it is essential that quality assurance be correctly understood and applied uniformly by engineers and inspectors from project-to-project so that all contractors and suppliers are treated alike. Thirdly, the expenditure of public funds must be documented to substantiate whether taxpayers actually received the quantity and quality of materials specified in exchange for tax dollars spent. Whether or not to pay the costs invoiced by contractors is a decision which relies heavily upon inspection reports and test results. In a fundamental way, inspectors play a key role in serving the public--to justify the expenditure of public monies and the acceptance of any contractor’s work. Through the work of knowledgeable, competent and skilled inspectors, KDOT can verify and confirm whether or not the contractor has fulfilled its obligations to build the project as intended. Finally, the specification requirements for materials are constantly evolving, based on new developments, past performance of material in the field, research and technological innovations. Accurate recordkeeping of materials and test results using consistent inspection practices provides a basis to compare results over time—an indispensable advantage for meaningful research. Data properly collected and recorded by inspectors can confirm whether or not changes in material specifications and testing requirements have, in fact, resulted in a better product, state-wide or in a particular location or application.
All inspectors should review the applicable clauses of the Standard Specifications at regular intervals to refresh their understanding of material and testing requirements.

No
perm
it re
quire
dN
o pe
rmit
requ
ired
Visi
tor
Met
ered
W, E
or V
WKK
TCa
mpu
s Pa
rkin
g Pe
rmit
Key
R Z SLC
M
O, W
, E, K
or V
R or
VA
ny K
-Sta
te P
erm
itSL
CM
Lots
enf
orce
d M
-F, 7
a.m
. - 5
p.m
. (R
lots
at a
ll tim
es).
Visi
t ww
w.k
-sta
te.e
du/p
arki
ng fo
r per
mit
purc
hasi
ng in
form
atio
n &
regu
latio
ns
Emer
genc
y Ph
one
Bicy
cle
Rack
Salin
a Ci
tyG
o® B
us S
top
Oth
er T
rans
port
atio
n
A-3
A-4
A-2
A-1
A-7
B-1
B-3
B-2
B-4N
B-4S
B-5
B-6
B-7
A-8
A-9
A-5
A-6
1 Ae
rona
utic
al W
est H
anga
r
2 Ae
rona
utic
al E
ast H
anga
r
3
Com
posi
te B
uild
ing
4 Av
iatio
n Ce
nter
/Ste
vens
Flig
ht C
ente
r
5 U
.A.S
. Lab
orat
ory
6 Te
chno
logy
Cen
ter
7 Te
chno
logy
Cen
ter W
est
8 Co
llege
Cen
ter
9 Sc
hilli
ng H
all
10
Tulli
s Bu
ildin
g
11
Wel
com
e Ce
nter
12
Out
reac
h Ce
nter
13
Scie
nce
Cent
er/K
-Sta
te R
esea
rch
Exte
nsio
n
14
Cons
truc
tion
Lab
15
Faci
litie
s M
aint
enan
ce -
Shop
s
16
Faci
litie
s M
aint
enan
ce -
Offi
ces
17
Har
bin
Hal
l
18
Thae
mer
t Par
k/Sp
orts
Fie
ld
19
Spor
ts S
uppo
rt F
acili
ty
20
Stud
ent L
ife C
ente
r
21
U.A
.S. F
light
Pav
ilion
DIR
ECTI
ON
S TO
CA
MPU
S
If you
are t
rave
ling e
ast o
r wes
t on I
-70,
stay o
n I-7
0 unt
il the
I-70
/I135
int
erch
ange
. Tra
vel s
outh
on I-
135 t
o the
Mag
nolia
St. e
xit (N
o. 90
).
Go w
est o
n Mag
nolia
to Ce
nten
nial R
d. Tu
rn rig
ht an
d pro
ceed
to Ka
nsas
St
ate U
niver
sity P
olyte
chnic
Cam
pus.
If you
are t
rave
ling n
orth
or so
uth o
n I-1
35, t
ake t
he M
agno
lia St
. exit
(N
o.90)
. Go w
est o
n Mag
nolia
to Ce
nten
nial R
d. Tu
rn rig
ht an
d pro
ceed
to
Kans
as St
ate U
niver
sity P
olyte
chnic
Cam
pus.
08/1
8
Nor
th
ww
w.p
olyt
echn
ic.k
-sta
te.e
du

1. Nuclear Gauge School
2. Daily Standard Counts
3. ASR Check for Gauges
4. KT 32 Density of Asphalt
5. KT 36 Bridge Deck Overlays
6. KT 38 Concrete Pavement
7. KT 41 Density of Bases
8. KT 51 Density of Soils

Disclaimers
1. Radiation Safety Training is a prerequisite for
this school.
2. This class predominantly demonstrates test
procedures using the Troxler Electronics
Laboratories, Inc. gauges. It is not the intent of
this class to preclude the use of nuclear gauges
from other manufacturers.
3. This class also addresses specific license
mandates that KDOT personnel much follow.
Correct safety precautions are always necessary
when dealing with nuclear gauges.
4. It is not the intent of this class to fully address
the test procedures and it is fully assumed that
proper training has already been established
prior to permitting operation of the gauge.

DAILY STANDARD COUNT
• Turn gauge on before leaving
for project.
• Gauge has time for self-test.
• Gauge has warm-up period.
• Standard count can be taken at
project without delay.
DAILY STANDARD COUNT
• Place standard block on flat
surface at least 3 m (10 ft.)
from any building/structure.
• Minimum of 10 m {30 ft.)
from any other radioactive
source.
DAILY STANDARD COUNT
• SURFACE
• Asphalt
• Concrete
• Compacted Aggregate
• Similar surface with density
of at least 1001b/ft3 (1600
kg/m3)
6/17/2015
1


Page 1/3 5.8.2 2016
Revised 2016
5.8.2. INDEPENDENT ASSURANCE REPLICATE (ASR) CHECK FOR NUCLEAR DENSITY
GAUGES
The following establishes a method for verifying whether a nuclear density gauge is properly operating as
established in Appendix C. It can also be a check to determine if the operator understands proper
procedures for running the nuclear gauge.
1. GENERAL OVERVIEW
Nuclear gauge operators are to demonstrate proficiency in operating the gauge at the project. This will
represent the Independent Assurance Witness (ASW) portion of the program. The focus of this section is
to determine if the nuclear gauge can function properly. If more than one type of nuclear gauge (different
series or manufacture) might be used during the course of the project, then each gauge is to be checked by
this procedure. Properly warm up the gauge and establish the standard count as outlined under Section 2.
NUCLEAR GAUGE. Turn off all offsets and correction factors (see Section 3. OPERATOR). Verify
the nuclear gauge by placing it on the KDOT District’s ValidatorTM
(or Validator IITM
when checking the
3450 or 4640 gauge) and establish the density of the block by taking 1 four-minute count.
If the gauge value is within the quantity established in Appendix C, when on the KDOT District’s
ValidatorTM
or Validator IITM
, then the gauge can be used on the project. If not, then run a stability and
drift test. If the gauge passes the stability and drift test, as outlined in Section 2. NUCLEAR GAUGE,
then the gauge can be used on the project. If not, the gauge cannot be used on a KDOT project until the
above requirements are met. Provide proof to the district representative that the problem has been
corrected (i.e. new calibration with appropriate papers).
2. NUCLEAR GAUGE
2.1. GENERAL.
The nuclear gauge is to receive a multi-block calibration and a verification annually. Present copies of the
previous two calibration papers to the district representative at the time of the Independent Assurance
Replicate (ASR) check. Calibration papers are to be checked at the start of a project. Include yearly
Calibration Papers in the QC/QA project’s Quality Manual when applicable.
2.2. CALIBRATION OF NUCLEAR GAUGE.
As a minimum, the nuclear gauge must be calibrated by a Qualified Service Center for a full multi-block
calibration on an annual basis. The technician performing the gauge calibration must have a current
certificate in moisture density gauge calibration from a gauge manufacturer. The gauge must be
disassembled, cleaned and lubricated prior to the calibration. Provide a copy of the gauge calibration
documents to the district representative at the time of the ASR check.
2.3. VERIFICATION OF NUCLEAR GAUGE.
At least once a year, the nuclear gauge must be verified by KDOT. Verify the nuclear gauge by placing it
on the KDOT District’s ValidatorTM
(or Validator IITM
when checking the 3450 or 4640 gauge). Follow
the procedures outlined in Section 1. GENERAL OVERVIEW. The ValidatorTM
and Validator IITM
blocks shall be calibrated at least once every five years. Maintain copies of the current ValidatorTM
and
Validator IITM
calibrations at the District Office.

Page 2/3 5.8.2 2016
Revised 2016
2.4. PROPER WARM-UP.
The gauge should be properly warmed up before starting any check. For the Troxler units, this means a
minimum of 10 minutes. This permits the electronics to warm up to operating temperatures. If this step is
not permitted the counts given can be significantly altered.
2.5. STABILITY AND DRIFT TEST.
Perform a stability and drift test on the gauge when the gauge fails the IA check. Any time the nuclear
gauge readings are “suspect”, perform the STAT TEST (or stability test) to validate the normal operation
of the gauge. The stability test requires the gauge to take 20 one-minute counts.
Perform the drift test 2 to 3 hours after the stability test to determine if the gauge reading “drifts” between
tests. The drift test consists of 5 four-minute counts. It is highly recommended that the gauge not be
moved from the block after taking the stability test and prior to taking the drift test.
Check the manufacturer’s manual for specifics on the results to be obtained. Contact the Materials Quality
Control Engineer at the Materials and Research Center for assistance. For Troxler gauges, use the
following table for acceptable limit results:
TROXLER GAUGE SERIES Stability (STAT) Test* Drift Test
3411-B and 3440 0.17 to 0.33 – acceptable
<0.12 or >0.40 - unacceptable
Density: <0.5%
Moisture: < 1.0%
4640-B 0.25 to 0.45 System 1 (Drift A): 0.50%
System 2 (Drift B): 0.80%
* For the 3411-B and 3440, the numbers falling between acceptable and unacceptable should be
considered carefully prior to acceptance/unacceptance. The 4640-B is considered to be unstable if the
ratios are outside these limits for two out of three stat tests.
2.6. STANDARD COUNTS.
Take a standard count on a surface with 100 lb/ft3 (1600 kg/m
3) or better. DO NOT perform the
standard count on the Validator. Perform the stability and drift test prior to taking the standard count.
2.7. PASS/FAIL OF STABILITY AND DRIFT.
If the gauge fails the stability and drift test as defined in the manufacturer’s manual, then see Section 1.
GENERAL OVERVIEW and consult the manufacturer (if KDOT gauge, call Materials Quality Control
Engineer). If the gauge passes the stability but fails the drift, one alternative is to have the operator take
new standard counts twice each day. Once when the operator begins in the morning and another in the
early afternoon. All standard counts are to be recorded and monitored. As always, pay attention to your
immediate surroundings when operating a nuclear gauge.

Page 3/3 5.8.2 2016
Revised 2016
3. OPERATOR
The operator is to demonstrate understanding of the gauge's fundamental operations, which include the
following:
1. Gauge turned on and permitted proper warm up time? ____
2. Set up, establish, and record a standard count? ____
3. Maintained a minimum of 3 ft (1 m) distance from gauge when in operation? ____
4. Verified all offsets and correction factors were turned off? ____
5. Properly seated gauge on concrete block? ____
6. Probe securely placed in the backscatter mode?
(verified the latch is properly seated in the notch) ____
7. Gauge permitted to determine density and results recorded? ____
8. Were there any vehicles within 10 ft (3 m)? YES / NO
9. Were there any nuclear gauges within 30 ft (10 m) YES / NO
10. What was the density determined? _________________ lb/ft3 or kg/m
3
DISTRICT 1 2 3 4 5 6
COMMENTS: ________________________________________________________________
___________________________________________________________________________
___________________________________________________________________________
OPERATOR'S NAME: _____________________________
WORKS FOR: _____________________________
DATE: _____________________________
The checklist represents the minimum an operator should know. A knowledgeable operator should
provide new operators guidance. New operators are encouraged to take the gauge out and record a
multitude of numbers in a single location with slight variations to the positioning of the base. This will
give the operator a better understanding of the gauges' precision and how to optimize seating the gauge to
the surface when such conditions apply.


Page 1/11 5.9.32 2016 Revised 2016 KT-32
5.9.32 METHOD OF TEST FOR DENSITY OF COMPACTED ASPHALT MIXTURES BY
NUCLEAR METHOD (Kansas Test Method KT-32)
1. SCOPE
This method of test covers the procedure for measuring the “in-place” density of compacted asphalt
materials by attenuation of gamma radiation. The intensity of the radiation detected is dependent in part
on the density of the material being tested. Gauge calibration shall follow Section 5.8.2. of this manual
INDEPENDENT ASSURANCE REPLICATE (ASR) CHECK FOR NUCLEAR DENSITY
GAUGES. KDOT gauges shall be calibrated annually.
The equipment utilizes radioactive materials which may be hazardous to the health of users unless
proper precautions are taken. (For KDOT field personnel only: Refer to Standard Operating
Manual No. 1.13.2.).
2. REFERENCED DOCUMENTS
2.1. KT-14; Marshall Test of Bituminous Mixes
2.2. KT-15; Bulk Specific Gravity and Unit Weight of Compacted Hot Mix Asphalt (HMA)
2.3. KT-39; Theoretical Maximum Specific Gravity of Asphalt Paving Mixtures
2.4. Section 5.2.2.2.; Random Sampling
3. APPARATUS
NOTE: Check gauge to verify it is in asphalt mode.
3.1. Nuclear density gauge with supporting equipment including reference standard, survey meter, and
instructional material.
3.2. Core drilling equipment capable of drilling a nominal 4 in (100 mm) diameter core.
3.3. Standardization.
3.3.1. Standardization of the nuclear gauge on a reference standard block is required at the start of each
day’s use and when test measurements are suspect.
3.3.2. Warm up the nuclear gauge in accordance with the manufacturer’s recommendations.
3.4. Properly seat the nuclear gauge on the standard block. Take a four minute reading on the reference
standard. The density standard should be within 1% of the density for the previous day’s reading. If not,

Page 2/11 5.9.32 2016 Revised 2016 KT-32
repeat the standard count. The two numbers should now be within 1% of each other and within 2% of the
density for the previous day’s reading. If not, check the machine for malfunction.
4. TEST SITE SELECTION AND PREPERATION
4.1. Location of the test site should be on a random basis as described in Section 5.2.2.2. RANDOM
SAMPLING of this manual. Regardless of the method of random selection chosen, it shall satisfy the
requirement that any area of the surface shall have an equal chance of being sampled, except sampling
shall not be conducted on sites closer than 1 ft (0.3 m) to an unconfined edge or vertical surface such as a
raised edge of curb and gutter, etc. When the randomized selection method indicates a site within 1 ft
(0.3 m) of an exposed edge or vertical surface, it is permissible to move the gauge transversely to clear
the 1 ft (0.3 m) restriction. It is also permissible to determine an alternate location using the tables again.
4.2. Since the measured values of density are affected by the surface texture of the material immediately
beneath the gauge, a flat surface should be tested for best results, both during calibration and density
testing. If the mix has a coarse surface, it is likely that the results will vary widely.
4.3. It may be necessary to use a leveling sand of minus No. 30 (600µm) material to obtain the best results
with the density gauge. The leveling sand, as defined for this test, is minus No. 30 (600 µm) with no
more than 20% represented by minus No. 100 (150 µm). It is recommended that the leveling sand
material be from the same source as one of the individual aggregates in the mixture.
4.4. For HMA mix designs designated as A mixes, no sand is required. All other mix designs should be
checked to determine if the leveling sand is needed before any field calibration of the nuclear density
gauge is attempted. This is accomplished by doing the following:
4.4.1. Sit the gauge on a smooth level location and mark location with lumber crayon.
4.4.1.1. For uniformity, the gauge operator shall position the source rod so it is closest to the laydown
machine (point the gauge towards the roller).
4.4.2. Take 5 one-minute readings with the density gauge, record wet density values, discard the single
highest and lowest values, average the three remaining values, and record the average value.
NOTE: Check tip of source rod to assure it is free of any foreign substance (i.e. grease, asphalt, concrete,
etc.).
4.4.3. Inside the location marked with the lumber crayon (test site) thinly spread a sufficient amount of
minus No. 30 (600 µm) material. Smooth and level the minus No. 30 (600 µm) material with the metal
plate or a straight edge.
4.4.4. Place the density gauge on the test site after the placement of minus No. 30 (600 µm) material and
take another density reading. Take care to use the same count time and location of source rod. Record
wet density information obtained. It is recommended that this process be completed at three locations.

Page 3/11 5.9.32 2016 Revised 2016 KT-32
4.4.5. After the information has been obtained, determine the need for the minus No. 30 (600 µm)
material leveling sand. Use the leveling sand if an increase of 1 lb/ft3 (16 kg/m
3) or more is noted. If the
leveling sand demonstrates a decrease in density, then the leveling sand is not beneficial and should not
be used. An example of this calculation is as follows:
TEST SITE
LOCATION
TEST SITE
DENSITY
lb/ft3 (kg/m
3)
TEST SITE DENSITY
WITH LEVELING SAND
lb/ft3
(kg/m3)
DIFFERENCE
lb/ft3 (kg/m
3)
1 138.45 (2215) 139.50 (2232) +1.05 (17)
2 140.35 (2246) 141.60 (2266) +1.25 (20)
3 141.95 (2271) 143.06 (2289) +1.12 (18)
NOTE: Density readings in above example are the average 3 one-minute readings (see Section 4.4.2. of
this test method).
The difference in the example shows an increase in the density of more than 1 lb/ft3 (16 kg/m
3) when the
leveling sand is used. If it is determined that leveling sand will be used during the calibration process of
the nuclear gauge then it is required that leveling sand be used during in-place density testing of the
compacted asphalt.
5. CALIBRATION CURVE ADJUSTMENT
5.1. The manufacturer’s calibration curve may require adjustment for chemical composition or density.
Examination to determine the need for such adjustment should be made whenever a change is made in
either the material to be tested or testing equipment. This test is generally conducted by comparing
nuclear gauge to core density values for four or more random locations. The difference between the two
average density values are used to determine the correction factor (db) in Section 7.6.1.1. of this test
method.
6. CALIBRATION LOCATIONS
6.1. For rural areas: Select locations starting after the second truck load. Each transverse and longitudinal
random location shall fall within every other truck load.
6.2. For urban areas: If the asphalt mix quantities are large enough, use the rural criteria. If not, then
decide if coring alone is a more feasible approach, or use best judgment to get a representative calibration
for the nuclear gauge.
7. CALIBRATION PROCEDURE
7.1. Select a minimum of five locations that are typical of the asphalt mix being produced.
Page 4/11 5.9.32 2016 Revised 2016 KT-32
7.1.1. For uniformity, the gauge operator shall position the source rod so it is closest to the laydown
machine (point the gauge towards the roller).
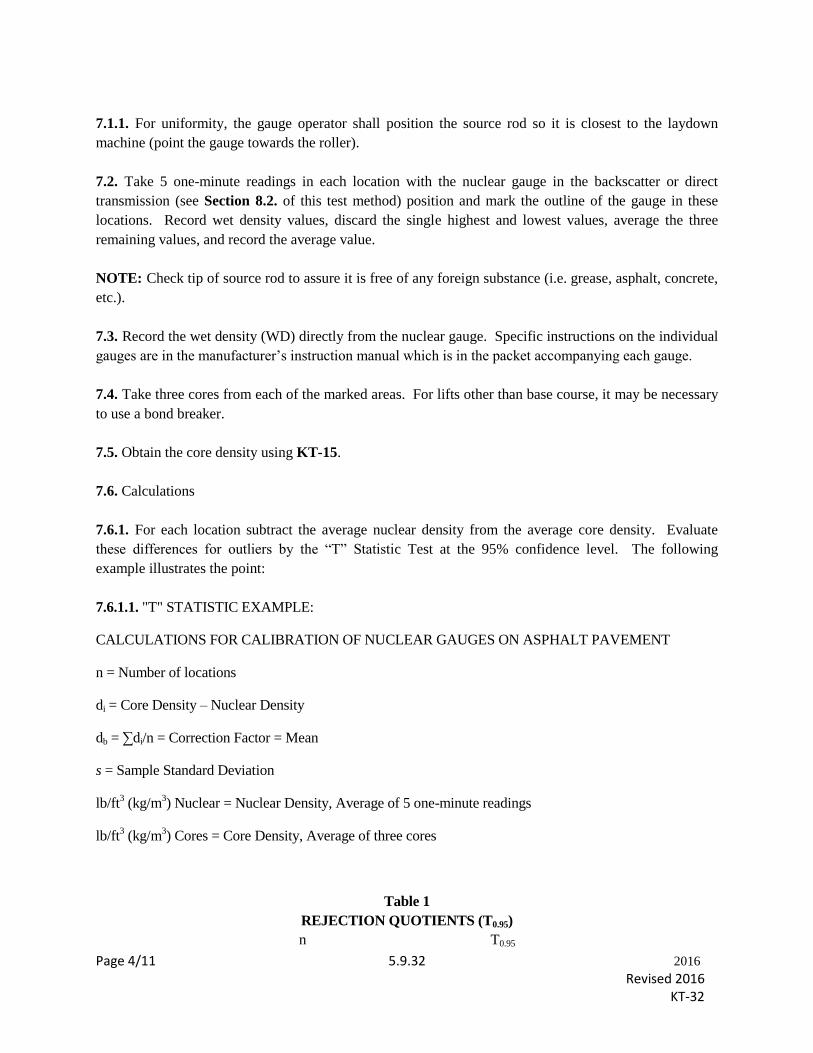
7.2. Take 5 one-minute readings in each location with the nuclear gauge in the backscatter or direct
transmission (see Section 8.2. of this test method) position and mark the outline of the gauge in these
locations. Record wet density values, discard the single highest and lowest values, average the three
remaining values, and record the average value.
NOTE: Check tip of source rod to assure it is free of any foreign substance (i.e. grease, asphalt, concrete,
etc.).
7.3. Record the wet density (WD) directly from the nuclear gauge. Specific instructions on the individual
gauges are in the manufacturer’s instruction manual which is in the packet accompanying each gauge.
7.4. Take three cores from each of the marked areas. For lifts other than base course, it may be necessary
to use a bond breaker.
7.5. Obtain the core density using KT-15.
7.6. Calculations
7.6.1. For each location subtract the average nuclear density from the average core density. Evaluate
these differences for outliers by the “T” Statistic Test at the 95% confidence level. The following
example illustrates the point:
7.6.1.1. "T" STATISTIC EXAMPLE:
CALCULATIONS FOR CALIBRATION OF NUCLEAR GAUGES ON ASPHALT PAVEMENT
n = Number of locations
di = Core Density – Nuclear Density
db = ∑di/n = Correction Factor = Mean
s = Sample Standard Deviation
lb/ft3 (kg/m
3) Nuclear = Nuclear Density, Average of 5 one-minute readings
lb/ft3 (kg/m
3) Cores = Core Density, Average of three cores
Table 1
REJECTION QUOTIENTS (T0.95)
n T0.95

Page 5/11 5.9.32 2016 Revised 2016 KT-32
2 ----
3 1.15
4 1.46
5 1.67
6 1.82
7 1.94
8 2.03
9 2.11
10 2.18
Assume cores and nuclear readings for the calibration are as follows. Calculate the difference (di) between
cores and nuclear gauge readings.
SI EXAMPLE:
Location Cores Nuclear Difference(di)
(kg/m3) (kg/m
3)
1 2176 2133 43
2 2187 2160 27
3 2176 2141 35
4 2197 2168 29
5 2185 2152 33
Total +167
Calculate the correction factor (db)
db = n
di =
5
671 = + 33.4
and standard deviation (s) between the cores and nuclear gauge readings as follows:
Cores Nuclear di di-db (di-db)2
1 2176 2133 +43 +9.6 92.16
2 2187 2160 +27 -6.4 40.96
3 2176 2141 +35 +1.6 2.56
4 2197 2168 +29 -4.4 19.36
5 2185 2152 +33 -0.4 0.16
Total +167 155.20
s =
1
2
n
dd bi =
4
155.20 = 6.23
ENGLISH EXAMPLE:
Location Cores Nuclear Difference(di)
(lb/ft3) (lb/ft
3)

Page 6/11 5.9.32 2016 Revised 2016 KT-32
1 136.0 133.3 2.7
2 136.7 135.0 1.7
3 136.0 133.8 2.2
4 137.3 135.5 1.8
5 136.4 134.4 2.0
Total 10.4
Calculate the correction factor (db)
db = n
di =
5
4.01 = + 2.1
and standard deviation (s) between the cores and nuclear gauge readings as follows:
Cores Nuclear di di-db (di-db)2
1 136.0 133.3 +2.7 +0.6 0.36
2 136.7 135.0 +1.7 -0.4 0.16
3 136.0 133.8 +2.2 +0.1 0.01
4 137.3 135.5 +1.8 -0.3 0.09
5 136.4 134.4 +2.0 -0.1 0.01
Total +10.4 0.63
s =
1
2
n
dd bi =
4
0.63 = 0.40
Application of the “T” test requires the following steps:
1. Arrange the deviations (di) in ascending order of magnitude.
(SI) (ENGLISH)
d1 = 27 1.7
d2 = 29 1.8
d3 = 33 2.0
d4 = 35 2.2
d5 = 43 2.7
2. Calculate the difference between the questionable measurement (d1 or dn) and the mean (db). Then divide
the deviation from the mean (db - d1 or dn - db) by the sample standard deviation (s), demonstrated by the
formula "T" (illustrated below). Thus, if the questionable measurement (the measurement demonstrating the
greatest variance from the other measurements) is the first measurement (d1) in the arranged set of results.
Page 7/11 5.9.32 2016 Revised 2016 KT-32
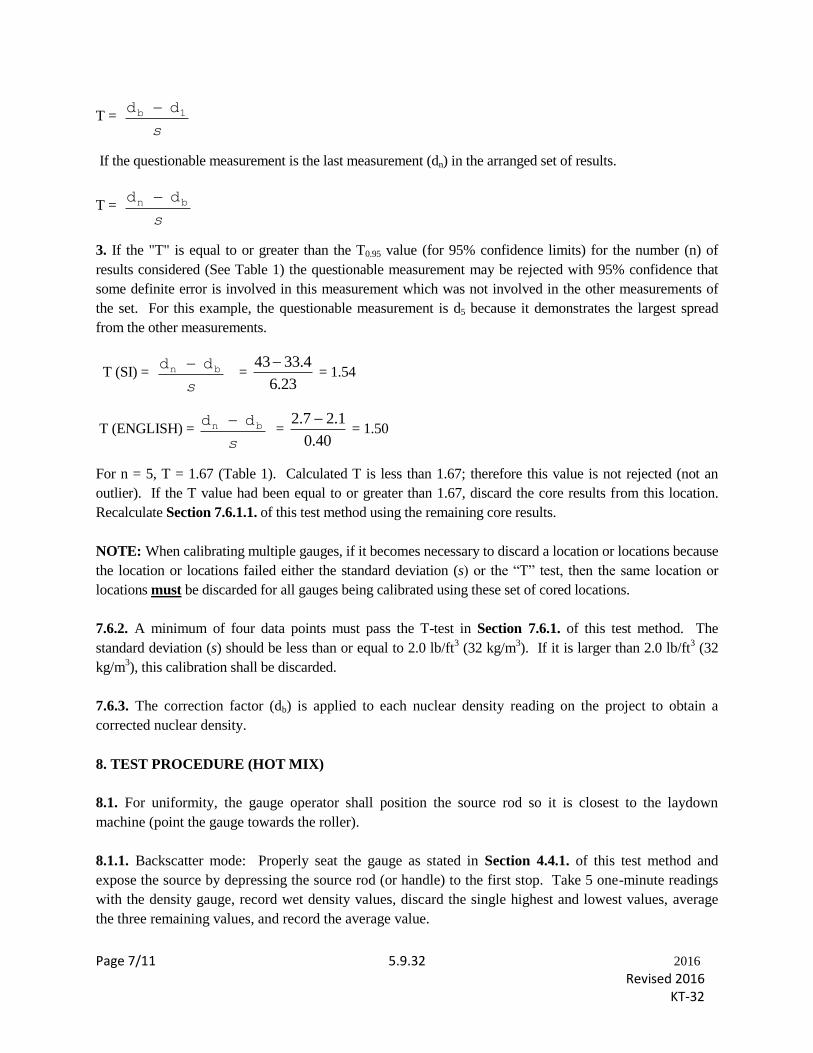
T = s
1b dd
If the questionable measurement is the last measurement (dn) in the arranged set of results.
T = s
bn dd
3. If the "T" is equal to or greater than the T0.95 value (for 95% confidence limits) for the number (n) of
results considered (See Table 1) the questionable measurement may be rejected with 95% confidence that
some definite error is involved in this measurement which was not involved in the other measurements of
the set. For this example, the questionable measurement is d5 because it demonstrates the largest spread
from the other measurements.
T (SI) = s
bn dd =
6.23
33.443 = 1.54
T (ENGLISH) = s
bn dd =
0.40
2.12.7 = 1.50
For n = 5, T = 1.67 (Table 1). Calculated T is less than 1.67; therefore this value is not rejected (not an
outlier). If the T value had been equal to or greater than 1.67, discard the core results from this location.
Recalculate Section 7.6.1.1. of this test method using the remaining core results.
NOTE: When calibrating multiple gauges, if it becomes necessary to discard a location or locations because
the location or locations failed either the standard deviation (s) or the “T” test, then the same location or
locations must be discarded for all gauges being calibrated using these set of cored locations.
7.6.2. A minimum of four data points must pass the T-test in Section 7.6.1. of this test method. The
standard deviation (s) should be less than or equal to 2.0 lb/ft3 (32 kg/m
3). If it is larger than 2.0 lb/ft
3 (32
kg/m3), this calibration shall be discarded.
7.6.3. The correction factor (db) is applied to each nuclear density reading on the project to obtain a
corrected nuclear density.
8. TEST PROCEDURE (HOT MIX)
8.1. For uniformity, the gauge operator shall position the source rod so it is closest to the laydown
machine (point the gauge towards the roller).
8.1.1. Backscatter mode: Properly seat the gauge as stated in Section 4.4.1. of this test method and
expose the source by depressing the source rod (or handle) to the first stop. Take 5 one-minute readings
with the density gauge, record wet density values, discard the single highest and lowest values, average
the three remaining values, and record the average value.

Page 8/11 5.9.32 2016 Revised 2016 KT-32
NOTE: Check tip of source rod to assure it is free of any foreign substance (i.e. grease, asphalt, concrete,
etc.).
8.2. For uniformity, the gauge operator shall position the source rod so it is closest to the laydown
machine (point the gauge towards the roller).
8.2.1. Direct transmission mode: Create a hole 2” (50 mm) deeper than the thickness of the material
being tested with the rod and hole forming device that is provided with the gauge. Lower the source rod
into the hole to the predetermined depth.
NOTE: Check tip of source rod to assure it is free of any foreign substance (i.e. grease, asphalt, concrete,
etc.).
NOTE: Always double check to make sure the probe is fully seated in the appropriate notch. This should
be confirmed in the safe, backscatter, or any direct transmission position.
9. TEST PROCEDURE (COLD RECYCLE)
9.1. Develop compaction growth curves (rolling sequence) for cold recycle material using the backscatter
position. Compaction growth curves will help to determine optimum density of material for a given
roller. Curves are developed by plotting the density of material against the accumulative roller passes
(D.O.T. FORM NO. 608 or 608M).
NOTE: In determining data for compaction growth curves, it is not necessary to calibrate the gauge to the
material. Also, a single one-minute count can be used to establish each point for the curve.
9.2. To determine in place density use either direct transmission or backscatter as approved by the district.
9.3. For uniformity, the gauge operator shall position the source rod so it is closest to the laydown
machine (point the gauge towards the roller).
9.3.1. Take 5 one-minute readings with the density gauge, record wet density values, discard the single
highest and lowest values, average the three remaining values, and record the average value.
NOTE: Check tip of source rod to assure it is free of any foreign substance (i.e. grease, asphalt, concrete,
etc.).

Page 9/11 5.9.32 2016 Revised 2016 KT-32
10. CALCULATIONS
10.1. Calculation methods applicable to the various gauge types are covered in the Manufacturer’s
Operating Manual which accompanies the gauge and are not reproduced in this procedure.
10.2. Wet density (WD) values, as determined by the method appropriate to the type of gauge and method
of calibration shall be compared to the “Density Standard” for determination of Percent of the Standard
and Percent of Voids.
10.3. Density Standards.
10.3.1. Density Standard for Nuclear Density shall be defined as the average value of the most recent
three laboratory density determinations (Field Mold Density) as determined by KT-14 and KT-15 for
Marshall mix designations. When fewer than three laboratory densities for the particular mix designation
or revised asphalt content are available, the “Density Standard” shall be the average of those
determinations made until a total of three may be averaged.
10.3.2. For Superpave mixes, the “Density Standard” is established with the use of the average daily
Gmmvalue (KT-39) as outlined in the specifications.
10.4. Calculate the Wet Density (WD) value from the following:
10.4.1. Wet Density (WD) = indicated lb/ft3 (kg/m
3) with the adjustment factor applied as determined in
Section 7. CALIBRATION PROCEDURE of this test method.
10.5. Calculate the percent of standard from the following formula:
Percent of Standard = StandardDensity
(WD) 100
10.6. Calculate the percent voids from the following formula:
Percent Voids = 100 -
mmGWaterofDensity
WD100d
Where: Gmm = Theoretical maximum specific gravity of the mixture (refer to KT-39).
NOTE: Density of water varies based on temperature. Determine the temperature and select the proper
density for water (see KT-15, Table 1).
11. REPORT AND RECORD
11.1. Report and record as 0.1 lb/ft3 (1 kg/m
3) or 0.01% of optimum density.

Page 10/11 5.9.32 2016 Revised 2016 KT-32

Page 11/11 5.9.32 2016 Revised 2016 KT-32


Page 1/5 5.9.36 2016
Revised 2016
KT-36
5.9.36 DENSITY OF FRESHLY MIXED CONCRETE IN BRIDGE DECK OVERLAYS BY
NUCLEAR GAUGE (Kansas Test Method KT-36)
1. SCOPE
This method of test covers the procedure for determining the in-place density of freshly mixed concrete in
bridge deck overlays using a nuclear density gauge. This method is applicable to all types of concrete.
Gauge calibration shall follow 5.8.2. of this manual INDEPENDENT ASSURANCE REPLICATE
(ASR) CHECK FOR NUCLEAR DENSITY GAUGES. KDOT gauges shall be calibrated annually.
The equipment utilizes radioactive materials which may be hazardous to the health of users unless
proper precautions are taken. (For KDOT field personnel only: Refer to Standard Operating
Manual No. 1.13.2.).
2. REFERENCED DOCUMENTS
2.1. KT-20; Weight Per Cubic Foot (Meter), Yield and Air Content (Gravimetric) of Freshly Mixed
Concrete
3. APPARATUS
NOTE: Check gauge to verify it is in asphalt mode.
3.1. Nuclear density gauge with supporting equipment including reference standard, survey meter, and
instructional material.
3.2. Frame to hold gauge at the concrete surface of the in-place material.
3.3. Shovel, trowels, wash bucket, tire brush, rags.
3.4. Tape measure.
3.5. Pachometer.
3.6. Depth Gauging Wire.
3.7. A supply of No. 30 (600 µm) sand screened from the fine aggregate in the mix or a pan and a No. 30
(600 µm) sieve.
3.8. Brush for cleaning up sand.
4. DAILY WARM UP AND CHECK
The nuclear gauge shall be turned on for warm-up and checked according to the manufacturer’s
instructions.
5. TEST PROCEDURE
Readings should be taken in a random manner unless there are sound reasons to relocate. Readings
should not be taken closer than 1 ft (0.3 m) to a vertical surface.

Page 2/5 5.9.36 2016
Revised 2016
KT-36
5.1. Direct Transmission Readings
5.1.1. For uniformity, the gauge operator shall position the source rod so it is closest to the finish machine
(point the gauge towards the placement of the concrete overlay).
5.1.2. Place the gauge on the surface and depress the probe to the appropriate depth, when exceeding 2 in
(50 mm). On very stiff mixes, it may be necessary to make a hole in the fresh concrete with the 5/8 in (15
mm) graduated pin and hole-forming device furnished with the gauge. The alignment of the hole and the
probe is greatly facilitated if the gauge is placed on the concrete surface first. The probe location will
show on the fresh concrete as will the outline of the gauge. Take 5 one-minute readings, record wet
density values, discard the single highest and lowest values, average the three remaining values, record
the average value, and divide this average by the three point moving average of unit weight of fresh
concrete.
NOTE: Check tip of source rod to assure it is free of any foreign substance (i.e. grease, asphalt, concrete,
etc.).
5.2. Backscatter Readings
5.2.1. Backscatter readings are required on overlays 2 in or less (50 mm or less) thick. In addition, the
effect of the underlying layer on the readings needs to be taken into account. This is done as follows:
5.2.1.1. Obtain a supply of minus No. 30 (600 µm) sand.
5.2.1.2. Mark the location of the top reinforcing steel using a pachometer in at least three relatively
smooth areas.
5.2.1.3. Place some sand in the area between the reinforcing steel and screed off the excess using a rule or
other straight edge. The area covered by the sand should be slightly larger than the bottom of the nuclear
gauge and should have all the surface voids filled with the fine sand. There should only be enough sand
to fill the voids. Excessive quantities can be counterproductive.
5.2.1.4. For uniformity, the gauge operator shall position the source rod so it is closest to the finish
machine (point the gauge towards the placement of the concrete overlay).
5.2.1.5. Place the gauge on the prepared area, lower the probe to the backscatter position, take 5 one-
minute readings, record wet density values, discard the single highest and lowest values, average the three
remaining values, record the average value.
NOTE: Check tip of source rod to assure it is free of any foreign substance (i.e. grease, asphalt, concrete,
etc.).
5.2.2. Repeat Section 5.2.1.5 of this test method in at least two other locations. Average all of these for an
average density of the underlying layer. Low readings originating from an air gap under the gauge should
not be included in the average.
5.2.3. The nuclear readings on the overlay are corrected by using the nomograph and the procedure in the
manufacturer’s manual, as follows:

Page 3/5 5.9.36 2016
Revised 2016
KT-36
**NOTICE**
This procedure and nomograph are applicable only to the 3400 series gauge. It is not valid for other
Troxler gauges or gauges from other manufacturers. The Troxler 3440 gauge contains software which
can make the corrections described above within itself. Refer to operators manual.
IN ENGLISH UNITS
In this example, the bottom layer density (left scale) is 130 lb/ft3 with a mat of 1.2 inches thick overlaying
it. A backscatter density test on the top of the mat (right scale) yielded a result of 138.5 lb/ft3. A line is
then drawn from 130 lb/ft3 on the left scale through the intersection of 1.2 inches (bottom) and 138.5 lb/ft
3
(right) and extended to the right. The correct density for the top layer is then read from the nomograph as
144.5 lb/ft3 on the right scale.
Page 4/5 5.9.36 2016
Revised 2016
KT-36
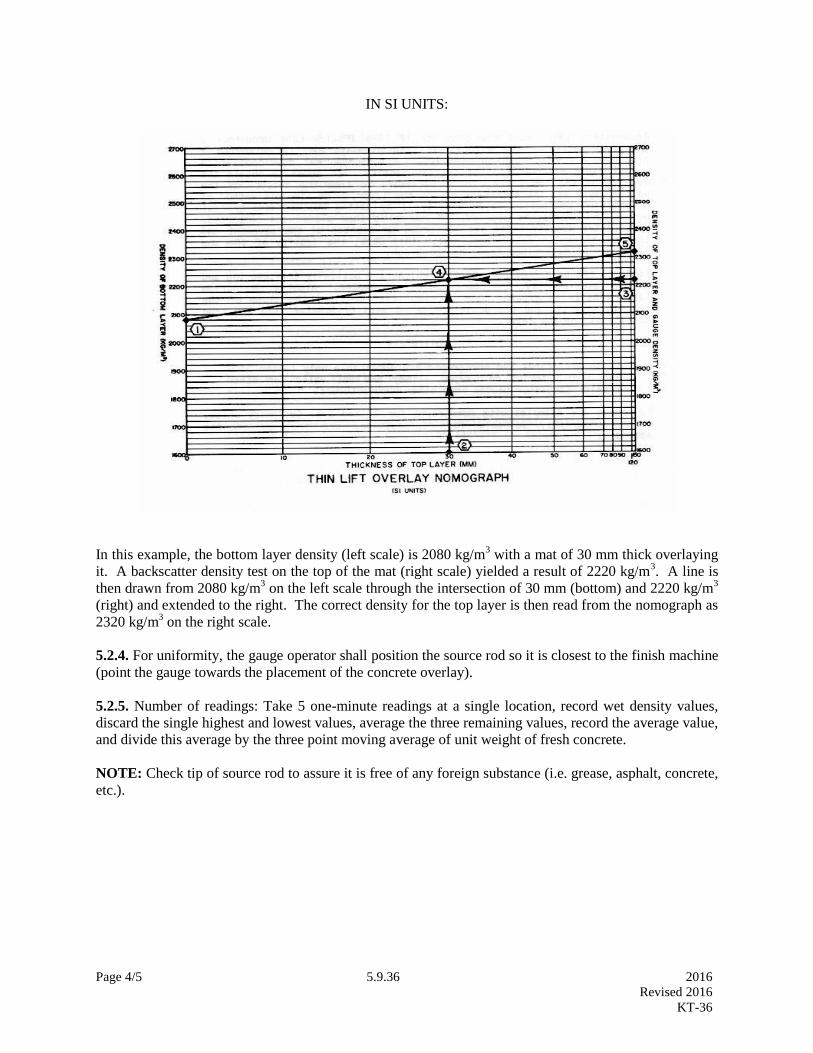
IN SI UNITS:
In this example, the bottom layer density (left scale) is 2080 kg/m3 with a mat of 30 mm thick overlaying
it. A backscatter density test on the top of the mat (right scale) yielded a result of 2220 kg/m3. A line is
then drawn from 2080 kg/m3 on the left scale through the intersection of 30 mm (bottom) and 2220 kg/m
3
(right) and extended to the right. The correct density for the top layer is then read from the nomograph as
2320 kg/m3 on the right scale.
5.2.4. For uniformity, the gauge operator shall position the source rod so it is closest to the finish machine
(point the gauge towards the placement of the concrete overlay).
5.2.5. Number of readings: Take 5 one-minute readings at a single location, record wet density values,
discard the single highest and lowest values, average the three remaining values, record the average value,
and divide this average by the three point moving average of unit weight of fresh concrete.
NOTE: Check tip of source rod to assure it is free of any foreign substance (i.e. grease, asphalt, concrete,
etc.).

Page 5/5 5.9.36 2016
Revised 2016
KT-36
6. CALCULATION
6.1. The average wet density reading is divided by the three point moving average of the unit weight of
concrete and multiplied by 100 to obtain a percent density. When fewer than three unit weights are
available, the “Density Standard” shall be the average of those determinations made until a total of three
may be averaged.
Percent of Standard = 100(WD)
Density Standard
7. REPORT AND RECORD
7.1. Report and record wet density values as 0.1 lb/ft3 (1 kg/m
3).
7.2. Report and record Percent of Standard Density to the nearest whole percent.


Page 1/2 5.9.38 2016
Revised 2016
KT-38
5.9.38 DENSITY OF FRESHLY MIXED CONCRETE IN PAVEMENT BY NUCLEAR METHOD
(Kansas Test Method KT-38)
1. SCOPE
This method of test covers the procedure for determining the in-place density of freshly mixed concrete in
pavements using nuclear density gauge. This method is applicable to all types of concrete. KT-38
reflects testing procedures found in AASHTO T 271. Gauge calibration shall follow 5.8.2.
INDEPENDENT ASSURANCE REPLICATE (ASR) CHECK FOR NUCLEAR DENSITY
GAUGES. KDOT gauges shall be calibrated annually.
The equipment utilizes radioactive materials which may be hazardous to the health of users unless
proper precautions are taken (For KDOT field personnel only: Refer to Standard Operating
Manual No. 1.13.2.).
2. REFERENCED DOCUMENTS
2.1. KT-20; Weight Per Cubic Foot (Meter), Yield and Air Content (Gravimetric) of Freshly Mixed
Concrete
2.2. AASHTO T 271; Density of Plastic and Hardened Portland Cement Concrete In Place by Nuclear
Methods
3. APPARATUS
NOTE: Check gauge to verify it is in asphalt mode.
3.1. Nuclear density gauge with supporting equipment including reference standard, survey meter, and
instructional material.
4. DAILY WARM-UP CHECK
The nuclear gauge shall be turned on for warm-up and checked according to the manufacturer’s
instructions.
5. TEST PROCEDURE
5.1. For uniformity, the gauge operator shall position source rod so it is closest to the paving machine
(point the gauge toward the concrete placement).
5.1.1. Transverse Profile of Densities: A transverse profile of wet densities shall be taken to evaluate the
effectiveness of the consolidation system. This profile is developed by taking a single one-minute density
reading in each vibrator path and in each gap between two vibrators across the entire placement width.
Although not all readings can be obtained at one station, an effort should be made to develop the profile
in as short a time as possible. A complete profile needs to be run each time a change is made in the
placement machine which could affect consolidation.
NOTE: Check tip of source rod to assure it is free of any foreign substance (i.e. grease, asphalt, concrete,
etc.).

Page 2/2 5.9.38 2016
Revised 2016
KT-38
5.2. For uniformity, the gauge operator shall position source rod so it is closest to the paving machine
(point the gauge toward the concrete placement).
5.2.1. In-Place Concrete Densities: The daily wet density readings should be taken in both the vibrator
paths and the gaps between vibrators to verify the density profile as well as document the percent of
required consolidation taking place. Take 5 one-minute readings, record wet density values, discard the
single highest and lowest values, average the three remaining values, and record the average value. These
readings should be taken no closer than 1 ft (0.3 m) to a vertical edge nor within 2 ft (0.6 m) of a dowel
basket assembly.
NOTE: Check tip of source rod to assure it is free of any foreign substance (i.e. grease, asphalt, concrete,
etc.).
5.3. Place the gauge on the surface and depress the probe to the appropriate depth, normally 8 in (200
mm). After the readings are taken, lift the gauge from the concrete by the case and clean the probe before
restoring the probe to its safe position.
6. CALCULATION
6.1. The wet density (WD) is divided by the three point moving average of the consolidated unit weight of
concrete, KT-20, and multiplied by 100 to obtain a percent density. When fewer than three consolidated
unit weights of concrete are available, the “standard density” shall be the average of those determinations
made until a total of three may be averaged.
Percent of Consolidation = 100(WD)
Density Standard
NOTE: For concrete, record the WD reading from the nuclear density gauge.
7. REPORT AND RECORD
7.1. Report and record as 0.1 lb/ft3 (1 kg/m
3).

Page 1/4 5.9.41 2016
Revised 2016
KT-41
5.9.41 DETERMINATION OF DENSITY AND MOISTURE CONTENT OF PORTLAND CEMENT
TREATED BASES, AGGREGATE BASES AND AGGREGATE SHOULDERS BY
NUCLEAR METHOD (Kansas test Method KT-41)
1. SCOPE
This method of test covers the procedure for calibrating the nuclear gauge and determining density and
moisture in Portland Cement treated bases, aggregate bases and aggregate shoulders. Gauge calibration
shall follow 5.8.2. INDEPENDENT ASSURANCE REPLICATE (ASR) CHECK FOR NUCLEAR
DENSITY GAUGES. KDOT gauges shall be calibrated annually.. KT-41 reflects procedures found in
AASHTO T 271.
The equipment utilizes radioactive materials which may be hazardous to the health of users unless
proper precautions are taken. (For KDOT field personnel only: Refer to Standard Operating
Manual No. 1.13.2.).
2. REFERENCED DOCUMENTS
2.1. Part V, 5.9.; Sampling and Test Methods Foreword
2.2. KT-11; Moisture Tests, Section 4. Constant Mass Method
2.3. KT-13; Field Density Tests of Soils, Treated Base Courses, and Water Bound Base Courses
2.4. KT-32; Method of Test for Density of Compacted Asphalt Mixtures by Nuclear Method
2.5. KT-43; Moisture Content of Asphalt Mixtures or Mineral Aggregates - Microwave Oven Method
2.6. AASHTO T 271; Density of Plastic and Hardened Portland Cement Concrete In-Place by Nuclear
Methods
3. APPARATUS
NOTE: Check gauge to verify it is in soil mode.
3.1. Nuclear moisture/density gauge with supporting equipment including reference standard, survey
meter, and instructional material.
3.2. KDOT Validator: Device to establish a wet density field correction factor for the nuclear gauge.
Each Validator has a certified block density.
3.3. A supply of minus No. 30 (600µm) sand with no more than 20% represented by minus No. 100 (150
µm).
3.4. Brush for cleaning up the fine sand.
3.5. The balance shall be readable to 0.01 lb (5 g) and sensitive to 0.005 lb (1 g) and conform to the
requirements of Part V, Section 5.9; Sampling and Test Methods Foreword of this manual for the
class of general purpose balance required for the principal sample mass of the sample being tested.
3.6. Shelter to protect the balance from wind currents and the sample from exposure to the sun or wind.

Page 2/4 5.9.41 2016
Revised 2016
KT-41
3.7. Oven capable of maintaining a constant temperature of approximately 230°F (110°C). If available, a
microwave oven as described in KT-43 may be used.
3.8. Miscellaneous equipment including standard drying pans, trowel, large spoon, hammer, square point
shovel, and air tight containers.
4. NUCLEAR GAUGE WARM UP AND CHECK
The nuclear gauge shall be turned on for warm-up and checked according to the manufacturer’s
instructions.
5. TEST SITE SELECTION AND PREPERATION
Test site shall be selected as outlined in KT-32, section 4.1. Leveling sand may be needed.
6. VALIDATOR CORRECTION FACTOR
6.1. Use the KDOT Validator to determine the wet density field correction factor for density in the
following manner:
6.1.1. Place the gauge on the Validator at the depth to be used on the project.
6.1.2. Take 5 one-minute readings, discard the single highest and lowest values, record the three
remaining wet density values.
NOTE: Check tip of source rod to assure it is free of any foreign substance (i.e. grease, asphalt, concrete,
etc.).
6.1.3. Determine the average difference (field density correction factor) using Section 9.1 of this test
method.
6.1.4. Use this correction factor to determine the final wet density reading for each test site.
7. PERCENT MOISTURE CORRECTION FACTOR
7.1. Use KT-11, Section 4, Constant Mass Method, to determine the percent moisture correction factor.
7.2. Conduct a minimum of seven tests. Compute the correction factor for each test. The sample standard
deviation (s) for the percent moisture content correction factors must be less than 1%. If the above
criteria is met, use the average correction factor computed. If the s criteria is not met, start over again
with seven new tests.
NOTE: When calibrating multiple gauges, if it becomes necessary to discard a location or locations
because the location or locations failed the standard deviation (s), then the same location or locations
must be discarded for all gauges being calibrated using these set of cored locations.

Page 3/4 5.9.41 2016
Revised 2016
KT-41
NOTE: A test represents 5 one-minute Wet Density (WD) and Percent Moisture (%M) readings from the
gauge. Record the lb/ft3 (kg/m
3) on Wet Density (WD) and Percent Moisture (%M) for each reading.
Discard the single highest and lowest wet density values along with their accompanying percent moisture
values, average the three remaining percent moisture values, and record the average value.
7.3. Dry the material removed from the test hole to a constant weight at approximately 230°F (110°C).
The material shall be dried the same day it is cored. Record the dry weight and calculate the percent
moisture.
8. TEST PROCEDURE
8.1. Location of the test site should be on a random basis. Any of several methods may be used, however,
the use of a set of Random Number Tables (see Section 5.2.2.2. Random Sampling of this manual) is
recommended. Regardless of the method selection chosen, it shall satisfy the requirement that any area of
the surface shall have an equal chance of being sampled. Sampling shall not be conducted on sites closer
than 1.0 ft (0.3 m) to an unconfined edge or vertical surface such as a raised edge of curb and gutter, etc.
When the randomized selection method indicates a site within 1 ft (0.3 m) of an exposed edge or vertical
surface, it is permissible to move the gauge transversely to clear the 1 ft (0.3 m) restriction. It is also
permissible to determine an alternate location using the table again.
8.2. Since the measured values of density are affected by the surface conformation of the material
immediately beneath the gauge, a flat surface should be tested for best results, both during calibration and
density testing. If the mix has a coarse surface, it is likely that the results will vary widely. Calibration
and testing should be done with leveling sand immediately beneath the gauge. Spread thinly a sufficient
amount of minus No. 30 (600 µm) sand on the test site and smooth with the metal plate or a straight edge
to obtain a suitable surface with a minimum amount of the sand.
8.3. For uniformity, the gauge operator shall position the source rod so it is closest to the laydown
machine (point the gauge towards the roller).
8.4. After the site selection has been made, a vertical hole is made 2 in (50 mm) deeper than the thickness
of the material with the rod and plate provided with the gauge. If the thickness of the material exceeds
the depth capability of the gauge, then a hole is made 2 in (50 mm) deeper than the gauge’s maximum
depth. The same hole depth used for calibration is to be used for normal testing. Set the probe to
maximum depth or at a depth equal to the plan thickness, whichever is less. Wet density and percent
moisture readings can now be taken using 5 one-minute counts, discard the single highest and lowest wet
density values along with their accompanying percent moisture values, average the three remaining wet
density values and record, and average the three remaining percent moisture values and record.
NOTE: Check tip of source rod to assure it is free of any foreign substance (i.e. grease, asphalt, concrete,
etc.).
9. CALCULATIONS
9.1. Compute Field Density Correction Factor and Corrected Wet Density.
Individual Correction Factor = Validator – Nuclear Gauge
Avg. Correction Factor = 3
3 FactorsCorrectionIndividual

Page 4/4 5.9.41 2016
Revised 2016
KT-41
WD = WDi + Avg. Correction Factor
Where: WDi = initial gauge reading at test site
Validator = certified block density
9.2. Compute Percent Moisture Content Correction Factor
9.2.1. Ui = (w – X)
Where: w = moisture content, percent (see KT-11, Section 5.1. for determination of w)
X = Nuclear Gauge moisture content, percent
Ui = Individual difference between w and X
9.2.2. Average percent moisture content correction factor (U).
U = n
Ui
9.3. Sample standard deviation (s) (see KT-32, Section 7.6.1.1. for more detail):
s =
1n
d2
bi
d
Where: di = Individual difference (Ui)
db = Average difference (U)
9.4. Corrected Percent Moisture Content, (%M)
%M = (X + U)
9.5. Dry Density, lb/ft3 (kg/m
3), (DD)
DD =
100
M%1
WD
Where: WD = Nuclear Gauge Wet Density, lb/ft3 (kg/m
3)
9.6. Percent of Proctor =100 (WD)
Standard Proctor or
100 (DD)
Standard Proctor
10. REPORT AND RECORD
10.1. Report and record as 0.1 lb/ft3 (1 kg/m
3) or 0.1% of optimum density.
Page 1/5 5.9.51 2016
Revised 2016
KT-51
5.9.51 FIELD DENSITY AND MOISTURE TESTS OF SOILS BY NUCLEAR GAUGE
(Kansas Test Method KT-51)
1. SCOPE
This method of test covers the procedure for measuring the “in-place” density and moisture of soils by the
attenuation of gamma and neutron radiation. The intensity of the radiation detected is dependent in part
on the density of the material being tested. It should be recognized that the density and moisture
determined by this method is not necessarily the average value within the measured volume at any one
location. Gauge calibration shall follow section 5.8.2 of test method, INDEPENDENT
ASSURANCE REPLICATE (ASR) CHECK FOR NUCLEAR DENSITY GAUGES. KDOT gauges
shall be calibrated annually. KT-51 reflects procedures found in AASHTO T 310.
The equipment utilizes radioactive materials which may be hazardous to the health of users unless
proper precautions are taken. (For KDOT field personnel only: Refer to Standard Operating
Manual No. 1.13.2.).
2. REFERENCED DOCUMENTS
2.1. KT-11; Moisture Tests
2.2. AASHTO T 310: In-Place Density and Moisture Content of Soil and Soil-Aggregate by Nuclear
Method (Shallow Depth)
3. APPARATUS
NOTE: Check gauge to verify it is in soil mode.
3.1. General.
3.1.1. Probe: Either the gamma source or the gamma detector shall be housed in a probe for insertion into
a preformed hole of the material to be tested. The probe shall be marked in increments of 2 in (50 mm)
for tests with probe depths from 2 in (50 mm) to a maximum of 12 in (300 mm). The probe shall be
mechanically held in place when it is manually moved to the desired depth.
3.1.2. Housing: The source, detector, readout device, probe, and power supply shall be in housings of
rugged construction that are moisture and dust proof.
3.1.3. Guide: A guide used for the hole forming device to make a hole, normal to the prepared surface.
3.1.4. Hole-forming Device: An auger, pin, or similar device for forming a hole in the soil to
accommodate the probe. The hole-forming device shall have a nominal diameter equal to or up to 1/8 in
(3 mm) greater than the probe diameter.
3.1.5. Extraction tool.
3.1.6. Miscellaneous equipment including shovel or auger, drying pans, and air tight containers.
3.2. Standardization.

Page 2/5 5.9.51 2016
Revised 2016
KT-51
3.2.1. Standardization of the nuclear gauge on a reference standard block is required at the start of each
day’s use and when test measurements are suspect.
3.2.2. Warm up the nuclear gauge in accordance with the manufacturer’s recommendations.
4. DETERMINING MOISTURE CORRECTION FACTOR USING THE NUCLEAR GAUGE
NOTE: If KT-11 is used for moisture determination instead of the nuclear gauge, then skip Section 4. of
this test method, Determining Moisture Correction Factor Using The Nuclear Gauge.
4.1. For uniformity, the gauge operator shall position the source rod so it is closest to the compaction
equipment (point the gauge towards the roller).
4.2. A Determination* by the nuclear method is to be compared with moisture quantities described under
KT-11, Section 4.0., CONSTANT MASS METHOD. Moisture samples shall be extracted from the
same location the nuclear gauge readings are taken. At least six separate locations are required. Discard
the location(s) with the greatest deviation to leave five pair of samples for analysis. Prepare the test site
and proceed as stated in Section 5. TEST PROCEDURE of this test method.
NOTE: Check tip of source rod to assure it is free of any foreign substance (i.e. grease, asphalt, concrete,
etc.).
A determination represents 5 one-minute Wet Density (WD) and Percent Moisture (%M) readings
from the gauge. Record the lb/ft3 (kg/m
3) on Wet Density (WD) and Percent Moisture (%M) for each
reading. Discard the single highest and lowest wet density values along with their accompanying
percent moisture values, average the three remaining percent moisture values, and record the average
value.
4.3. Compare the six or more sample pairs of oven dry and nuclear gauge results from the locations listed
above in Section 4.2 of this test method. Discard the sample pair(s) that deviate the greatest from the
remaining five. Oven dry samples are to be at least 1,000 g and are to be taken under the center of the
gauge to a depth of 6 to 8 in (150 to 200 mm). Nuclear tests are to be taken without any type of internally
applied corrections.
4.4. Prepare a chart of sample pairs as shown below:
Sample No. (%M OD) (%M) Moisture Difference
(NUCLEAR) (%M OD - %M NUCLEAR)
1 4.5 8.6 -4.1
2 4.0 5.9 -1.9
3 7.2 9.7 -2.5
4 6.7 8.6 -1.9
5 * 3.9 * 9.5 * -5.6 *
6
Average
4.7
5.4
8.6
8.3
-3.9
-2.9
NOTE: “*” represents the discarded sample pair.

Page 3/5 5.9.51 2016
Revised 2016
KT-51
NOTE: If the Average Moisture Difference exceeds ± 1%, a Moisture Correction Factor will be required
for that soil type.
4.5. To determine the correction factor, calculate the average moisture difference value and proceed as
follows:
4.5.1. Calculate the Moisture Correction Factor using the average difference values, as follows:
Moisture Corr. Factor =100 (Avg. Oven %M-Avg . %M Gauge)
100+Avg. %M Gauge
In the example above, the moisture correction would be as follows:
Moisture Corr. Factor =100 ( 5.4-8.3)
100+8.3 = -2.7
The correction is independent of dry density and adjusts the apparent moisture to true moisture regardless
of dry density. This value can be used for all future tests on the same soil type.
NOTE: Each soil type having an Average Moisture Difference exceeding ± 1 % will have a moisture
correction factor.
5. TEST PROCEDURE
5.1. Determine the number of soil types to be encountered on the project. If the number is substantial,
then use KT-11 MOISTURE TESTS to determine the correct moisture content of the soil instead of
calibrating the nuclear density gauge to moisture. KT-11, Section 9. TEST PROCEDURE FOR
SPEEDY METHOD can be used if the Speedy was calibrated within the last year.
5.2. Randomly select a test site where the gauge will be at least 12 in (300 mm) away from any slight
vertical projection. If the vertical projection is significant, then maintain a distance of 10 ft (3 m)
including all stationary vehicles and construction equipment. Vehicles and construction equipment in
motion should maintain a minimum distance of 3 to 4 ft (1 to 1.5 m) from the gauge.
5.3. Prepare the test site in the following manner:
5.3.1. Remove all loose and disturbed material, and remove additional material as necessary to expose the
top of the material to be tested.
5.3.2. Prepare a horizontal area, sufficient in size to accommodate the gauge by planing a level area to a
smooth condition. This will create a maximum contact surface between the nuclear gauge and material
being tested.
5.3.3. The maximum void beneath the gauge shall not exceed approximately 1/8 in (3 mm). Use native
soil or fine sand to fill the voids and smooth the surface with a rigid plate or other suitable tool. The
depth of the filler should not exceed approximately 1/8 in (3 mm).
5.3.4. Place the nuclear gauge on the test site and trace the outline of the gauge onto the test surface.
After the site selection has been made, a vertical hole is made 2 in (50 mm) deeper than the thickness of
the material, with the rod and plate provided with the gauge. If the thickness of the material exceeds the
depth capability of the gauge, then a hole is made 2 in (50 mm) deeper than the gauge’s maximum depth.

Page 4/5 5.9.51 2016
Revised 2016
KT-51
Set the probe to the maximum depth or at a depth equal to the project specification thickness, whichever
is less. Maintain alignment so the insertion of the probe will not cause the gauge to tilt from the plane of
the prepared area.
NOTE: Check tip of source rod to assure it is free of any foreign substance (i.e. grease, asphalt, concrete,
etc.).
5.4. Proceed with testing in the following manner:
5.4.1. Tilt the gauge and extend the probe to the position required for the desired depth of test.
5.4.2. For uniformity, the gauge operator shall position the source rod so it is closest to the compaction
equipment (point the gauge towards the roller).
5.4.3. Insert the probe in the hole.
5.4.4. Seat the gauge firmly by moving it about the probe with a back and forth motion.
5.4.5. Pull gently on the gauge in the direction that will bring the side of the probe which faces the center
of the gauge into intimate contact with the side of the hole.
5.4.6. Set the time for a one-minute reading interval. Initiate the gauge to take the readings.
5.5. Take Gauge Readings.
5.5.1. Take and record 5 one-minute readings. Record the lb/ft3 (kg/m
3) on Wet Density (WD) and
Percent Moisture (%M) for each reading. Discard the single highest and lowest wet density values along
with their accompanying percent moisture values, average the three remaining wet density values and
record, and average the three remaining percent moisture values and record.
NOTE: Check tip of source rod to assure it is free of any foreign substance (i.e. grease, asphalt, concrete,
etc.).
5.6. Determining Moisture Readings Using KT-11. Determine the moisture content of soil directly under
the gauge according to KT-11.
5.7. If the soil fails to meet the designated compaction at a single location, rotate the gauge 180° and take
new readings. If the soil compaction still fails, then the compaction is inadequate.
6. CALCULATIONS WHEN USING KT-11
6.1. Calculate the Moisture in lb/ft3
(kg/m3) and subtract that quantity from the Wet Density (WD)
determined by the gauge. This will yield the Dry Density (DD):
M =
%M + 100
%M WD
DD = M - WD

Page 5/5 5.9.51 2016
Revised 2016
KT-51
%PR =
SD
DD 100
Where: M = Moisture content in lb/ft
3 (kg/m
3)
DD = Dry Density in lb/ft3 (kg/m
3)
WD = Wet Density in lb/ft3 (kg/m
3)
%PR = Percent of Proctor Density (also referred to as the Percent of Standard Density)
SD = Standard Density (Proctor) lb/ft3 (kg/m
3)
7. SOIL IDENTIFICATION
7.1. Identification of the soil is required for several reasons. These include the comparison to the standards
for optimum moisture content and target density which are required in order to determine compliance with
the specifications, determining the proper moisture correction factors to be applied for the soil under the test,
and the reporting of the moisture and density tests results.
7.2. A selection of soil type is necessary in order to set the moisture correction factor for the gauge.
7.3. Nonhomogeneous soils may be encountered in which differences between gauges and oven are not
consistent between samples. In this case, the use of KT-11, MOISTURE TESTS is the proper method for
analyzing the moisture content of the soil.
8. TESTING
8.1. Wet density and moisture are the only items the density gauge is capable of reading. All other values
are calculated from wet density, moisture, and initialized information in the gauge.
9. REPORT AND RECORD
9.1. Report and record as 0.1 lb/ft3 (1 kg/m
3) or 0.1% of optimum density.

P a g e | 1 2018-2019
Nuclear Gauge Performance Test
Nuclear Gauge Test
Applicant:___________________________________ CIT #:__________________
Employer:_______________________________________________
TRIALS
First Second
1. Can the operator present the gauge calibration date? ________ ________
2. Was the gauge “warmed up” for a minimum of 10 minutes? ________ ________
3. Does the operator know how to take a standard count? ________ ________
4. Did the operator put the gauge on the block correctly? ________ ________
5. Was the gauge placed on 100 lb/ft3 of material for the purpose
of taking standard count? ________ ________
( Circle One)
Pass Fail
Pass Fail
ASPHALT TEST KT-32
1. This section of KT-32 is necessary for what mix design? A or B or T
(Circle One)
2. Did operator mark location with lumber crayon? ________ ________
3. Was initial test taken without sand? ________ ________
4. If sand was used, was excess scraped off? (Can you see the asphalt
after sand is applied?) ________ ________
5. Were 5 one-minute readings taken and averaged correctly? ________ ________
Reading W/O Sand Reading W/Sand
6. _____________________ _____________________
7. _____________________ _____________________
8. _____________________ _____________________ Is sand needed? YES or NO
9. _____________________ _____________________ ( Circle One)
10. _____________________ _____________________ Pass Fail

P a g e | 2 2018-2019
Avg. _____________________ Avg. _____________________ Pass Fail
Nuclear Gauge Performance Test
SOILS TEST KT-51 (4” DEPTH)
1. I would turn the gauge to soils mode. ________ ________
2. I would make sure that site was large enough for the gauge base. ________ ________
3. I would make the test hole perpendicular to the prepared surface using
the guide and hole forming device.. ________ ________
4. I would make the test 2” deeper than the thickness of the material
for direct transmission. ________ ________
5. I would seat the gauge in the test location. ________ ________
6. I would pull the gauge back to bring source rod into contact with
the side of the test hole. ________ ________
7. I would take 5 one-minute readings. ________ ________
8. I would record wet density and percent moisture of soils. ________ ________
Overall Score
Circle One
1st Test Re-Test
PASS PASS
FAIL FAIL
Witness Examiner:
(First Try) Signature Date
Witness Examiner:
(Re-Test) Signature Date