Embed Size (px)
Citation preview
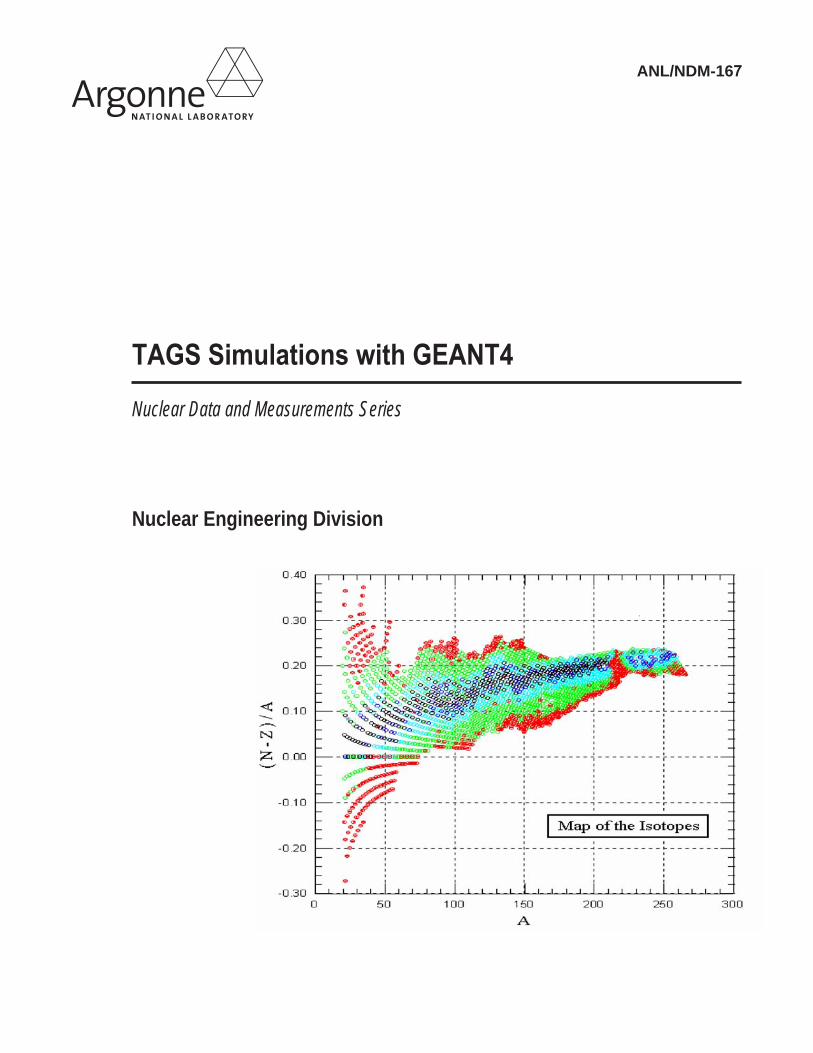
ANL/NDM-16
Nuclear Data and Measurements Series
Nuclear Engineering Division

Availability of This ReportThis report is available, at no cost, at http://www.osti.gov/bridge. It is also available on paper from the U.S. Department of Energy and its contractors, for a processing fee, from:
U.S. Department of Energy
P.O. Box 62
Oak Ridge, TN 37831-0062
phone (865) 576-8401
fax (865) 576-5728
Disclaimer
This report was prepared as an account of work sponsored by an agency of the United States Government. Neither the United States
or implied, or assumes any legal liability or responsibility for the accuracy, completeness, or usefulness of any information, apparatus,
commercial product, process, or service by trade name, trademark, manufacturer, or otherwise, does not necessarily constitute or imply
its endorsement, recommendation, or favoring by the United States Government or any agency thereof. The views and opinions of
Argonne National Laboratory, or UChicago Argonne, LLC.
About Argonne National Laboratory Argonne is a U.S. Department of Energy laboratory managed by UChicago Argonne, LLC under contract DE-AC02-06CH11357. The Laboratory’s main facility is outside Chicago, at 9700 South Cass Avenue, Argonne, Illinois 60439. For information about Argonne, see www.anl.gov.
A U.S. Department of Energy laboratory managed by UChicago Argonne, LLC
ANL/NDM-16
Nuclear Data and Measurements Series
by
Nuclear Engineering Division, Argonne National Laboratory

A U.S. Department of Energy laboratory managed by UChicago Argonne, LLC
Nuclear Engineering DivisionArgonne National Laboratory9700 South Cass Avenue, Bldg. 208 Argonne, IL 60439-4842
www.anl.gov
November 16, 2010
Total Absorption Gamma-ray Spectrometer (TAGS) Simulations
with GEANT4
Michael L. Smith
Department of Nuclear Physics, R.S.P.E.,
Australian National University, Canberra, ACT 0200, Australia and
Nuclear Engineering Division, Argonne National Laboratory, Argonne, Illinois 60439, USA
Abstract
This project aims to study the structure of neutron-rich fission products of importance to Ad-
vanced Fuel Cycle applications. The measurement of β-decay feeding intensities is made possible
through the use of the Total Absorption Gamma-ray Spectrometer (TAGS) method, utilising a
large NaI scintillator detector. The method relies heavily on the modelling of the detector re-
sponse using a Monte Carlo model. This report looks at the progress of developing such a model
(using Geant4) and the other considerations required to implement the TAGS method.
1
I. INTRODUCTION
The TAGS method is used to measure the β-decay branching ratios of neutron-rich fission
fragments and is largely dependent upon Monte-Carlo simulations for the interpretation of
experimental data.
This document outlines the development of a Monte-Carlo (MC) model to simulate the
response of a Total Absorption Gamma-ray Spectrometer (TAGS) using Geant4. In this
project, fission fragments will be supplied by the CAlifornium Rare Isotope Breeder Upgrade
(CARIBU), currently being developed at the Argonne Tandem Linac Accelerator System
(ATLAS) [Car]. The measurement of the neutron-rich fission products will provide data
for decay heat calculations used in the Advanced Fuel Cycle (AFC) project, information on
nuclei approaching the r-process for the astrophysics community and new nuclear structure
information for the basic nuclear physics community.
A. The Total Absorption Gamma Spectroscopy (TAGS) Method
Far from stability, where the Q value for β-decay is large, the daughter nuclei which follow
β-decay can be populated in regions of high level density and at high excitation energy. This
leads to a fragmented decay, with many weak β-decay branches and multiple gamma-ray
decay pathways from each of the high-lying daughter levels to the daughter ground state. The
identification of these many branches is almost impossible with conventional γ-spectroscopy,
as demonstrated by Hardy [Har77].
During the 1990s, a research group at the Idaho National Engineering Laboratory (INEL)
developed a Total Absorption Gamma-ray Spectrometer (TAGS) (FIG 1) and applied it to
the measurement of 45 fission products [Gre92a, Gre92b, Gre95, Gre97]. Their method
involved a large well-type sodium iodide (NaI(Tl)) detector that measured simultaneously
all of the γ-ray decays emitted into the detector-volume following a β-decay. This was made
possible by placing the source at the bottom of the well in the detector, so as to give close to
4π angular coverage. In this scenario it doesn’t matter how fragmented the decay pathway
might be, summing all the γ-rays gives you the same signal independent of the different
paths that are followed in the decay to the ground state. This provides a gamma signature
of the β-feeding to each level, enabling identification of the beta decay branching ratios.
2
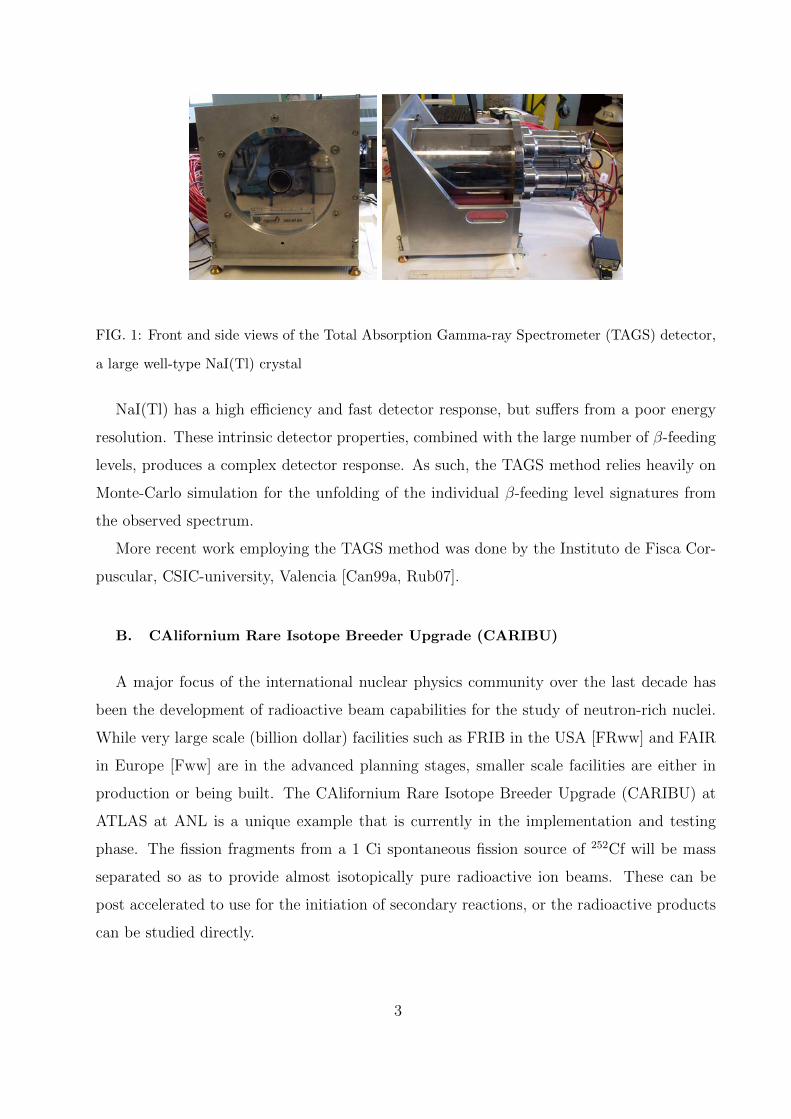
FIG. 1: Front and side views of the Total Absorption Gamma-ray Spectrometer (TAGS) detector,
a large well-type NaI(Tl) crystal
NaI(Tl) has a high efficiency and fast detector response, but suffers from a poor energy
resolution. These intrinsic detector properties, combined with the large number of β-feeding
levels, produces a complex detector response. As such, the TAGS method relies heavily on
Monte-Carlo simulation for the unfolding of the individual β-feeding level signatures from
the observed spectrum.
More recent work employing the TAGS method was done by the Instituto de Fisca Cor-
puscular, CSIC-university, Valencia [Can99a, Rub07].
B. CAlifornium Rare Isotope Breeder Upgrade (CARIBU)
A major focus of the international nuclear physics community over the last decade has
been the development of radioactive beam capabilities for the study of neutron-rich nuclei.
While very large scale (billion dollar) facilities such as FRIB in the USA [FRww] and FAIR
in Europe [Fww] are in the advanced planning stages, smaller scale facilities are either in
production or being built. The CAlifornium Rare Isotope Breeder Upgrade (CARIBU) at
ATLAS at ANL is a unique example that is currently in the implementation and testing
phase. The fission fragments from a 1 Ci spontaneous fission source of 252Cf will be mass
separated so as to provide almost isotopically pure radioactive ion beams. These can be
post accelerated to use for the initiation of secondary reactions, or the radioactive products
can be studied directly.
3
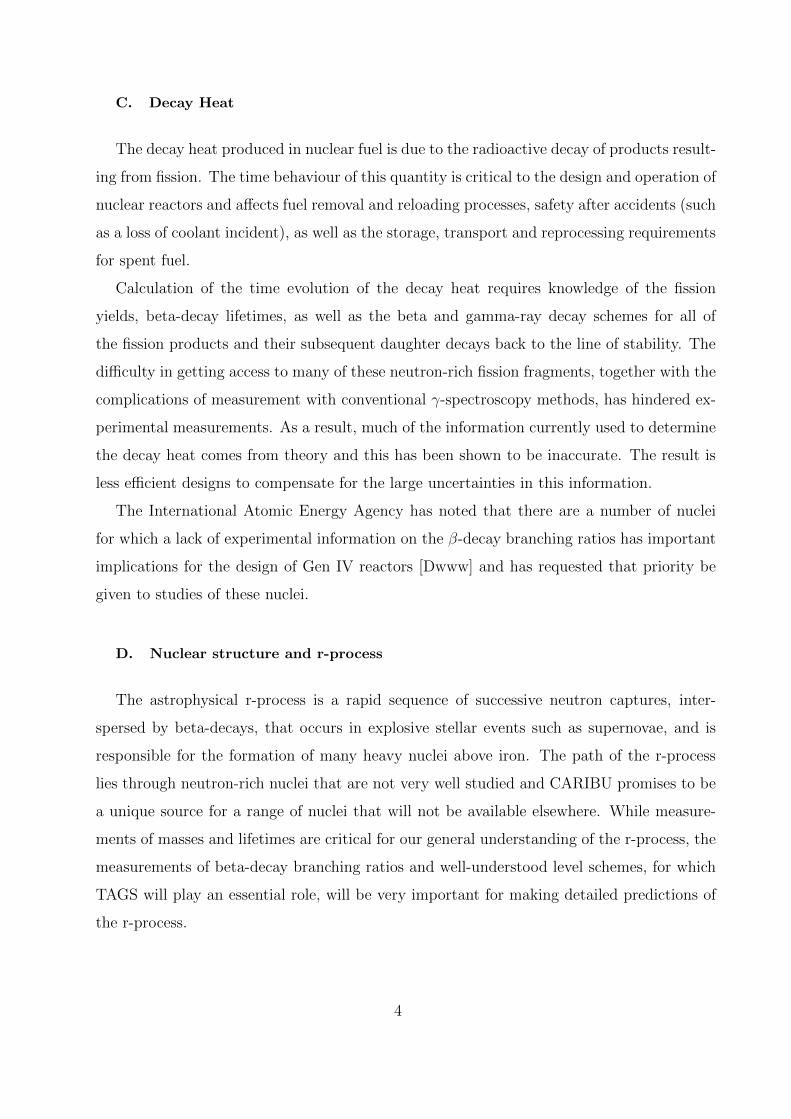
C. Decay Heat
The decay heat produced in nuclear fuel is due to the radioactive decay of products result-
ing from fission. The time behaviour of this quantity is critical to the design and operation of
nuclear reactors and affects fuel removal and reloading processes, safety after accidents (such
as a loss of coolant incident), as well as the storage, transport and reprocessing requirements
for spent fuel.
Calculation of the time evolution of the decay heat requires knowledge of the fission
yields, beta-decay lifetimes, as well as the beta and gamma-ray decay schemes for all of
the fission products and their subsequent daughter decays back to the line of stability. The
difficulty in getting access to many of these neutron-rich fission fragments, together with the
complications of measurement with conventional γ-spectroscopy methods, has hindered ex-
perimental measurements. As a result, much of the information currently used to determine
the decay heat comes from theory and this has been shown to be inaccurate. The result is
less efficient designs to compensate for the large uncertainties in this information.
The International Atomic Energy Agency has noted that there are a number of nuclei
for which a lack of experimental information on the β-decay branching ratios has important
implications for the design of Gen IV reactors [Dwww] and has requested that priority be
given to studies of these nuclei.
D. Nuclear structure and r-process
The astrophysical r-process is a rapid sequence of successive neutron captures, inter-
spersed by beta-decays, that occurs in explosive stellar events such as supernovae, and is
responsible for the formation of many heavy nuclei above iron. The path of the r-process
lies through neutron-rich nuclei that are not very well studied and CARIBU promises to be
a unique source for a range of nuclei that will not be available elsewhere. While measure-
ments of masses and lifetimes are critical for our general understanding of the r-process, the
measurements of beta-decay branching ratios and well-understood level schemes, for which
TAGS will play an essential role, will be very important for making detailed predictions of
the r-process.
4

II. INTRODUCTION TO GEANT4
Monte-Carlo (MC) simulations are commonly used in many areas of physics research.
Developed around 1930, they were first used to model the transport of nuclear particles and
radiation through matter [Met49]. A MC model is essentially a random number generator
providing bounded variable inputs to a physics based model. For example, modelling the
path of a γ-ray in a detector would use a random number as input to the calculation of the
mean free path in the first step. Individually, these steps do not provide much information
nor does the single whole scattering path, but looking at the statistical distribution of many
paths can provide a good basis for comparison with experiment.
GEometry ANd Tracking 4 (GEANT4) is a MC transportation code that was developed in
the late 1990’s as a CERN collaboration [Agn03]. Based on object oriented C++, GEANT4
is a re-write of the fortran based GEANT3 and was developed initially by the high energy
physics community. GEANT4 allows for a generic framework within which a number of
models covering a range of energies, can be applied to many areas including high energy and
medical physics.
GEANT4 was chosen for the modelling of the TAGS detector due to the flexibility of
the code and the suitability of the physics classes that it employs [Gww]. Many other
projects involving the modelling of γ-ray intensities in detectors have used Geant including
AGATA [Aww], GRETA [GRww] and other TAGS type detectors [Can99a].
5
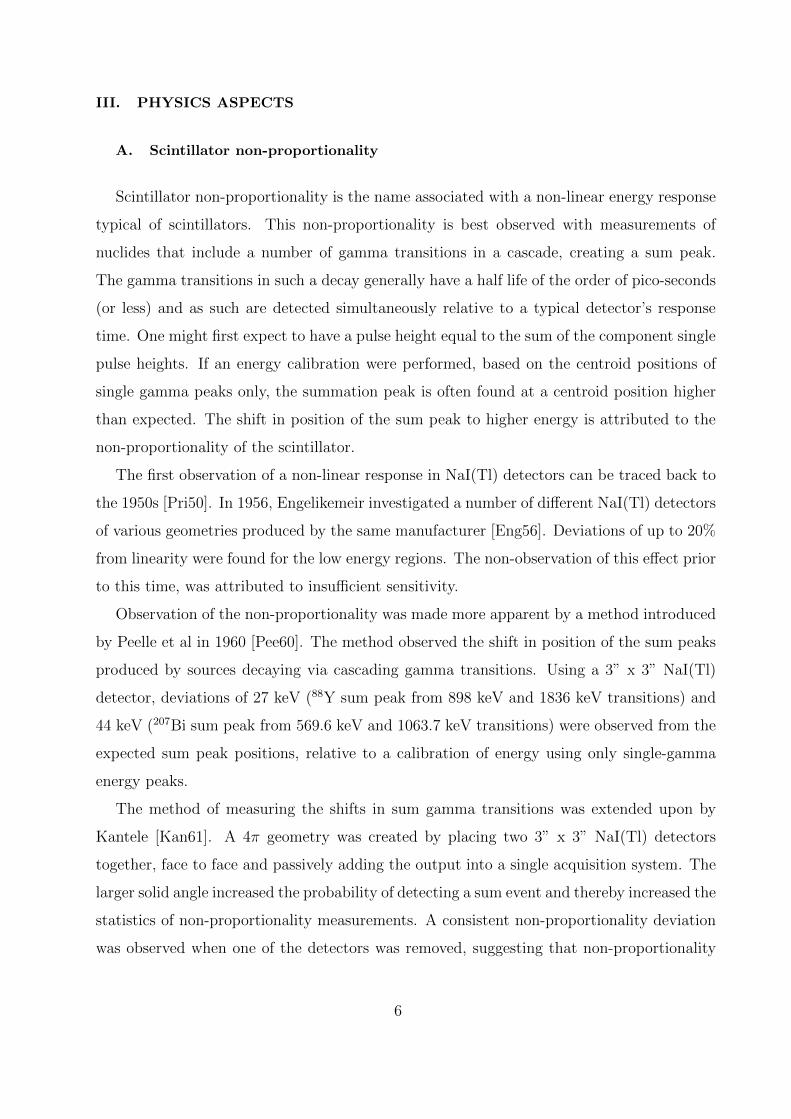
III. PHYSICS ASPECTS
A. Scintillator non-proportionality
Scintillator non-proportionality is the name associated with a non-linear energy response
typical of scintillators. This non-proportionality is best observed with measurements of
nuclides that include a number of gamma transitions in a cascade, creating a sum peak.
The gamma transitions in such a decay generally have a half life of the order of pico-seconds
(or less) and as such are detected simultaneously relative to a typical detector’s response
time. One might first expect to have a pulse height equal to the sum of the component single
pulse heights. If an energy calibration were performed, based on the centroid positions of
single gamma peaks only, the summation peak is often found at a centroid position higher
than expected. The shift in position of the sum peak to higher energy is attributed to the
non-proportionality of the scintillator.
The first observation of a non-linear response in NaI(Tl) detectors can be traced back to
the 1950s [Pri50]. In 1956, Engelikemeir investigated a number of different NaI(Tl) detectors
of various geometries produced by the same manufacturer [Eng56]. Deviations of up to 20%
from linearity were found for the low energy regions. The non-observation of this effect prior
to this time, was attributed to insufficient sensitivity.
Observation of the non-proportionality was made more apparent by a method introduced
by Peelle et al in 1960 [Pee60]. The method observed the shift in position of the sum peaks
produced by sources decaying via cascading gamma transitions. Using a 3” x 3” NaI(Tl)
detector, deviations of 27 keV (88Y sum peak from 898 keV and 1836 keV transitions) and
44 keV (207Bi sum peak from 569.6 keV and 1063.7 keV transitions) were observed from the
expected sum peak positions, relative to a calibration of energy using only single-gamma
energy peaks.
The method of measuring the shifts in sum gamma transitions was extended upon by
Kantele [Kan61]. A 4π geometry was created by placing two 3” x 3” NaI(Tl) detectors
together, face to face and passively adding the output into a single acquisition system. The
larger solid angle increased the probability of detecting a sum event and thereby increased the
statistics of non-proportionality measurements. A consistent non-proportionality deviation
was observed when one of the detectors was removed, suggesting that non-proportionality
6
is geometry independent.
In 1961, Zerby et al created a Monte Carlo model of a 2.5” x 2” NaI(Tl) scintillator
by looking at the specific interaction processes in the crystal and not simply the energy
deposition [Zer61]. They modelled the non-proportionality in the gamma response L(Eγ)/Eγ,
where L(Eγ) is the light response from the scintillator due to a gamma event of energy Eγ.
They concluded that the non-proportionality effects are not exclusive of the gamma processes
but are also caused by electron processes. Using this model and a measured gamma response,
they deduced the non-proportional response for different energy electrons.
A direct measurement of the electron response is difficult due to the attenuation of beta
particles by the glass envelope encasing the hygroscopic NaI(Tl) as well as the light-tight
aluminium can. An indirect method is made possible by use of the Compton Coincidence
Technique (CCT).
The CCT method uses a collimated beam of mono-energetic gammas that illuminate the
scintillator. Mono-energetic gamma-rays can undergo Compton scattering in the scintillator,
producing a Compton electron and a scattered gamma-ray. In the event that the scattered
gamma-ray exits the scintillator without any further interactions, the Compton scattered
electron is the only event that deposits energy in the scintillator. By use of an external
collimated detector, (usually HPGe), the scattered gamma-ray can be detected and used as
a trigger for the Compton electron event in the scintillator.
Although there has been much research into this phenomenon [Mos08], the origins of non-
proportionality are still largely unknown. There has been a renewed interest into the cause
of non-proportionality in recent years, with the prospect of improving the overall energy
resolution of scintillator detectors.
B. Pile-up
Pile-up effects are an inherit problem of the finite processing times of electronic acquisition
systems and ultimately, the rate of the events in a detector [Ten84]. To retrieve information
from the collected charge, preamplifiers integrate this charge, then are reset (more commonly
by means of resistive feedback). The result is a sharp rising function followed by a long tail,
known as a tail pulse. Amplifiers then integrate and differentiate this signal to produce a
Gaussian like function whose pulse height is proportional to the collected charge of the tail
7
pulse.
If events are occurring at great frequency in the detector, there is an increased probability
of another pulse arriving whilst the first event is being processed. If the event arrival is close
enough in time, the peaks will ride on top of each other. This is seen by the acquisition
system as one pulse that has an amplitude that is the sum of the two individual pulse
component heights. If the two events occur such that the second event arrives on the tail
of the first (before this can be fully reset), then the result is a slightly reduced or increased
second pulse.
The motivation for understanding and accounting for the effects introduced by pile-up, is
to accurately model all aspects of the detector in order to understand the complex number
of processes and interactions that will be measured by TAGS. Pile-up effects are a significant
component of the detector response, producing tails on peaks or shifting peak positions in
the spectrum. This is particularly important when dealing with large count rate, as will
be the case with the large volume, high-efficiency TAGS. Monte Carlo simulations typically
work on an event by event basis, and produce only discrete data for each separate event. In
the present case, G4 does not directly model pile-up so that the effects must be taken into
account outside of G4.
8

IV. EXPERIMENTAL ASPECTS
The main detector that we are concerned with in this project is the Total Absorption
Gamma-ray Spectrometer (TAGS) detector (FIG 1). This is a 20 cm (diameter) by 20 cm
(length) well-type thallium doped NaI detector, that covers approximately 99% of 4π solid
angle for a source located in the bottom of the well [Gre92a].
The TAGS detector was acquired from INEL in 2007, after the retirement of key per-
sonnel. The past performance of the detector can be seen from publications of the former
owners [Gre92a]. However, since receiving the detector, it has not operated in a predictable
fashion and seems to have a degraded energy resolution compared to these earlier published
results.
A. Count Rate and Non-proportionality
The high solid angle coverage required for the TAGS method can be a disadvantage
since even a weak source can result in a large detector count rate causing pile-up effects.
The contribution of background is also significant, with many cosmic pulses saturating
the preamplifier. Shielding the detector is important when the detector is placed at an
experimental station for use.
The effect of count rate on the TAGS detector can be seen by measuring the central PMT
response to a 60Co source as a function of source position along the central axis (FIG 2).
The 1173 keV and 1332 keV lines form a single un-resolved peak. For the higher count rates,
there is a notable broadening and shift of the first peak position. The response of the central
tube is believed to resemble a 60Co spectrum with poor resolution due to incomplete light
collection. The peak located at channel 300 is the summing peak, this is identified by its
decrease in magnitude as the source is removed from the well.
In addition to measurements undertaken with TAGS, several other NaI(Tl) detectors were
used to measure properties of basic crystals before moving to the more complex TAGS geom-
etry. These detectors included a 3” x 3” cylindrical detector located at Argonne (ANL3x3),
a 5” x 5” cylindrical detector from the Australian National University (ANU5x5) and a
6” x 5” well type cylindrical detector from the Australian Nuclear Science and Technology
Organisation (ANSTOwell).
9

FIG. 2: Count rate effects observed in the TAGS central PMT in response to a 60Co source placed
at various points along the detector axis, background spectrum shown at bottom
Using the ANL3x3 detector, three 60Co sources of decreasing activities were measured
with the source placed against the detector face (FIG 3). There is a significant shift in
the peak positions with a change in count rate, the background spectrum is shown at the
10

FIG. 3: ANL3x3 measurement of three 60Co sources with different activities, placed against the
detector face
bottom for comparison.
The sum peak is also visible in each case. As mentioned previously, one method employed
to measure the non-proportional response of scintillators is to calibrate the spectrum to the
singles peaks alone, then measure the displacement of the sum peak position from the
expected value. Using this method, very little non-proportional effects are seen for this
detector.
A count rate dependent shift is seen for the ANU5x5 detector, this time from the same
60Co source at varying distances from the detector (FIG 4). In the case of this detector,
calibration using the singles peaks gives a non-proportional deviation of up to 45 keV for
the sum peak.
A similar energy shift with count rate is seen for two different activity 137Cs sources at a
distance of 10 cm from the detector (FIG 5).
Moving to the slightly larger ANSTOwell detector, measurements were made with a
different set of sources placed at the bottom of the well and at the top of the well for 60Co
(FIG 6) and 137Cs (FIG 7). These spectra show the expected increase in intensity in the
2505 keV sum peak with the increase in detection geometry resulting from the source lying
in the well. The non-proportional shifts here are around 10 keV.
What is interesting is the shape change in all of the peaks with different count rates. It
is not clear what causes this shape and position shifting of the measured spectra with count
rate, however the effect is significant. It is present in the individual PMT response (FIG 2)
11

1000 2000 3000 4000
1500
3500
04-Aug-10 22:41:01 Co60_bot
1000 2000 3000 4000
1500
3500
04-Aug-10 22:41:28 Co60_Flu
FIG. 6: ANSTOwell detector with 60Co source placed at the top of the well (blue) and at the
bottom of the well (red)
1000 2000 3000 4000
30000
70000
110000
04-Aug-10 23:10:03 Cs137_Fl
1000 2000 3000 4000
30000
70000
110000
04-Aug-10 23:10:30 Cs137_bo
FIG. 7: ANSTOwell detector with 137Cs source placed at top of the well (blue) and at the bottom
of the well (red)
B. General check of TAGS performance
The measurements of single and double line γ-sources using TAGS, indicated a poor
energy resolution.
The PMTs of TAGS were removed to visually inspect both the scintillator and tubes.
The scintillator was found to be transparent and showed no fractures or dislocations from
its glass envelope (FIG 8 (a)). The PMT photocathodes are clearly intact and show no signs
of stripping or damage (FIG 8 (b)).
The optical coupling had dried up, requiring application of optical grease to all of the
13

(a) (b)
FIG. 8: TAGS with PMTs removed showing (a) no major problems visually with the crystal and
(b) the photocathode coating of one of the removed tubes
tubes. However, there was no significant improvement in the resolution of TAGS after the
optical coupling was replaced and the detector re-assembled.
C. PMT gain matching
An added complication with large scintillator crystals is the large light collection area
required. Increasing the size of a PMT is an option, however the response properties of a large
single tube can be degraded and the tube itself would be fragile. As a result, multiple smaller
PMTs are required to cover the window and maximise the collection of light. Figure 9 is a
picture of the TAGS tubes and the adopted name for each tube position. To get a uniform
response across the scintillator window, ideally, tubes that are manufactured in the same
batch are employed.
The response of a PMT is strongly dependent on the applied bias. For a detector em-
ploying a single PMT, this is less of an issue. However, for large detectors comprising of
multiple PMTs, the final signal is the summed response of the individual tubes. Therefore,
if one tube has a higher gain than the rest, the measured total response will result in a
poor resolution or, in the extreme case, an unrecognisable spectrum. As such, an important
issue with the operation of these detectors is the gain matching of the PMTs. The voltage
dividers provided for this application have an additional bias adjustment potentiometer to
offset the main bias for this purpose.
Using a mono-energetic γ-ray source such as 137Cs, a method to gain match the tubes
would be to align the single peak positions for a fixed bias. This assumes that the response is
14
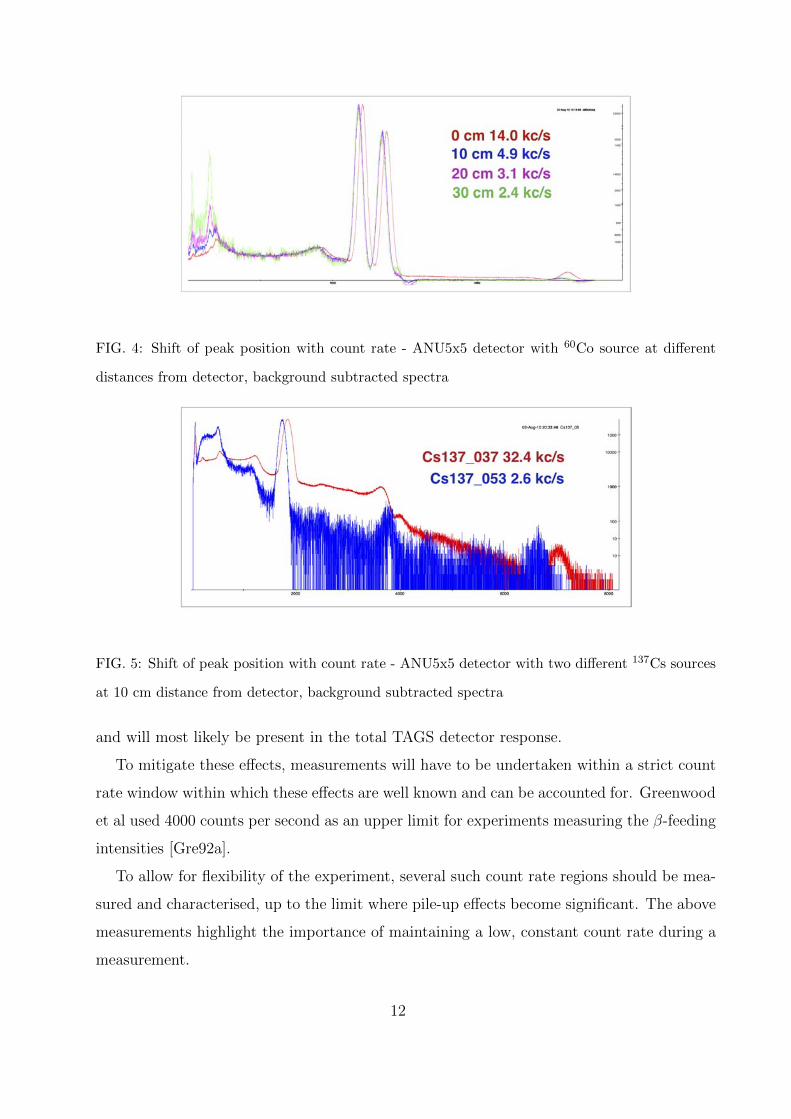
FIG. 4: Shift of peak position with count rate - ANU5x5 detector with 60Co source at different
distances from detector, background subtracted spectra
FIG. 5: Shift of peak position with count rate - ANU5x5 detector with two different 137Cs sources
at 10 cm distance from detector, background subtracted spectra
and will most likely be present in the total TAGS detector response.
To mitigate these effects, measurements will have to be undertaken within a strict count
rate window within which these effects are well known and can be accounted for. Greenwood
et al used 4000 counts per second as an upper limit for experiments measuring the β-feeding
intensities [Gre92a].
To allow for flexibility of the experiment, several such count rate regions should be mea-
sured and characterised, up to the limit where pile-up effects become significant. The above
measurements highlight the importance of maintaining a low, constant count rate during a
measurement.
12
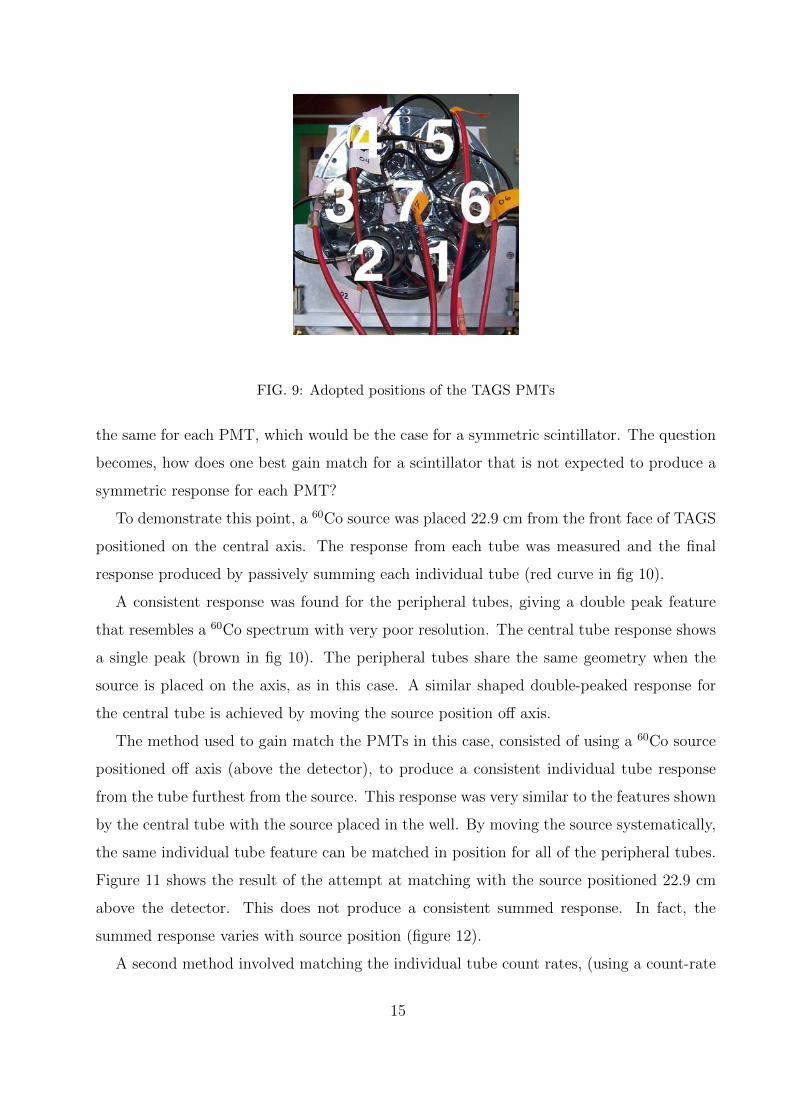
FIG. 9: Adopted positions of the TAGS PMTs
the same for each PMT, which would be the case for a symmetric scintillator. The question
becomes, how does one best gain match for a scintillator that is not expected to produce a
symmetric response for each PMT?
To demonstrate this point, a 60Co source was placed 22.9 cm from the front face of TAGS
positioned on the central axis. The response from each tube was measured and the final
response produced by passively summing each individual tube (red curve in fig 10).
A consistent response was found for the peripheral tubes, giving a double peak feature
that resembles a 60Co spectrum with very poor resolution. The central tube response shows
a single peak (brown in fig 10). The peripheral tubes share the same geometry when the
source is placed on the axis, as in this case. A similar shaped double-peaked response for
the central tube is achieved by moving the source position off axis.
The method used to gain match the PMTs in this case, consisted of using a 60Co source
positioned off axis (above the detector), to produce a consistent individual tube response
from the tube furthest from the source. This response was very similar to the features shown
by the central tube with the source placed in the well. By moving the source systematically,
the same individual tube feature can be matched in position for all of the peripheral tubes.
Figure 11 shows the result of the attempt at matching with the source positioned 22.9 cm
above the detector. This does not produce a consistent summed response. In fact, the
summed response varies with source position (figure 12).
A second method involved matching the individual tube count rates, (using a count-rate
15

(a)
(b)
FIG. 10: Measurement of 60Co at 22.9 cm distance from the front face of TAGS (a) individual
tubes shown with the passively summed result in red (b) expanded view of PMT components;
1-blue, 2- pink, 3- dark blue, 4- orange, 5- dark green, 6- light green, 7- brown
meter), for a source placed in a fixed axial position. The central tube was then adjusted
to minimise the summed-response resolution. The final technique used in the attempt to
improve the gain matching, consisted of using a common voltage divider and systematically
matching the main peak feature positions for the peripheral tubes. The best resolution
achieved using any of these techniques was 15 - 20 % for the 1173 keV 60Co γ-ray. The
detectors response in 1992 [Gre92a] was reported to be 5.95 %, and measured from figure 3
of this reference to be 8 %.
Similar attempts at gain matching were made with a lower activity source, but no im-
provements in the resolution resulted. From this information and other measurements, it
is believed that the currently used PMTs are damaged and will be replaced by modern
equivalent tubes manufactured by Hamamatsu.
16

(a)
(b)
FIG. 11: Measurement of 60Co at 22.9 cm distance above long axis in the centre of the detector
(a) individual tubes shown with the passively summed result in red (b) expanded view of PMT
components; 1-blue, 2- pink, 3- dark blue, 4- orange, 5- dark green, 6- light green, 7- brown
FIG. 12: Passively summed response of TAGS to a 60Co source as a function of source position
17

A more consistent method of gain matching that has been used elsewhere, involves the
use of a single reference light pulsar, at a frequency suitable for the photocathode, carried
to each of a detector’s PMTs by means of fibre optic cables. The single peak produced is
used for gain matching and this can often be done automatically by computer controlled
adjustment of each tube bias [Kar97].
18

V. GEANT4 MODEL OF ARGONNE TAGS DETECTOR
The main purpose of this project is to model the response of the TAGS detector using
GEANT4. This model will be used to interpret the experimental data, so that it needs
to be accurate and reproduce as many features as possible. Many versions of the TAGS
simulation have been developed over the course of this project with increasing complexity
as more physical properties are included. The development of the model is anticipated to
continue beyond the work described in this report.
This section is intended as a brief overview of the most recent model features. Further
general information about GEANT4 can be found in reference [Gww]. The simulation code
is written in C++ and the components described below are generally C++ classes.
A. DetectorConstruction
DetectorConstruction is the class where the elements and materials used in the simulation
are described and are built. Starting from elements such as Na and I, the materials or com-
pounds in the detector are described (NaI). The materials are then assigned to make up the
logical volumes of objects that are constructed using various built-in shapes. These objects
are then placed in the “World” volume. In this way, complex geometries and materials can
be produced from basic shapes and elements.
A common problem with building models of detectors is the inability to measure internal
dimensions of components, particularly when there is no documentation. In the case of
TAGS, all of the dimensions have been taken from reference [Gre92a].
The NaI material in the present model makes up the bulk of the detector volume. A
future improvement would be the addition of the thallium doping. The NaI is enclosed in
an aluminium can on three sides and a glass SiO2 window on the rear of the detector. A
silicon detector is placed in the well while a section of aluminium plate placed adjacent
to the SiO2 window acts as a simulated photocathode. The DetectorConstruction is also
the place where the active detector volumes (SensitiveDetectors) are defined, (see section D
below). The OpenGL rendering of this constructed detector is shown in figure 13.
The most recent model includes the possibility to directly simulate the optical photons
from scintillation light. To accommodate this, additional properties such as the refractive
19

FIG. 13: OpenGL rendering of the TAGS geometry showing the outer aluminium casing
index as a function of the photon energy are manually defined for each material and boundary
interface.
B. PhysicsList and PrimaryGeneratorAction
The PrimaryGeneratorAction is a mandatory class defining the method by which particles
are generated. The base class is a gun that fires mono-energetic particles in a defined
direction. The current model utilises the General Particle Source (GPS) class that allows
the user to fully define the energy and direction of the emitted particles.
The PhysicsList class allows the user to define the properties and behaviour of the parti-
cles or photons that will be used in the simulation. For example, an electron is first defined
using either the provided particle details or a modified version, then the physical behaviour
of this particle is associated to physics modules, for example multiple scattering.
There are a wide variety of physics modules available, usually written by groups that focus
on a particular energy range. For the current model, the low energy Penelope physics module
is employed. Also implemented in the PhysicsList is the Radioactive Decay Module (RDM).
This is a module that allows the creation of a radioactive ion as the source of particles, it
uses input files to define the decay paths and intensities and an additional file to handle
the subsequent transition(s). The data contained in the RDM input files are sourced from
the Brookhaven National Laboratories’ Evaluated Nuclear Structure Data Format (ENSDF)
database. The advantage of using the RDM, is that the total response to a decay is treated
20

in a single “event” (see EventAction and SteppingAction for the description of a “event”),
with all of the particles emitted in the decay (γ’s, β’s, IC e−’s etc) handled without the need
for them to be defined explicitly.
C. SensitiveDetector
A SensitiveDetector is a specified material or volume in the geometry that is of particular
interest. For example, the NaI volume would be defined as a SensitiveDetector allowing
information on the interactions and processes occurring in that volume to be extracted. It is
first defined in the DetectorConstruction and usually follows a particular logical volume, such
as the silicon detector. When a particle or photon interacts with this volume, the associated
SensitiveDetector class will be called. In this class, information about the interaction or hit
(for example, energy deposition) can be accumulated.
The TAGS model contains sensitive volumes for the NaI, the silicon detector and the
aluminium plate that acts as a simulated PMT. The NaI SensitiveDetector uses an energy
deposited method from the step class (see below) to determine the detector response to a
particle interacting within it.
D. EventAction and SteppingAction
A“step” in the simulation is a single transport of a particle or photon followed by an
interaction. An event consists of the variable number of steps that result from the initial
particles or photons. For example, if we take the case of a γ-ray of initial energy E0, then
the first step may involve Compton scattering and the production of a Compton electron
together with the scattered γ-ray. The following step could consist of another Compton
scatter or a photoelectric absorption and so on until there are no more interactions. The
simulation will then back track and pick up the first Compton electron and systematically
follow this through all of its steps. The resultant total steps from the initial and secondary
particles are defined as an event.
The EventAction and SteppingAction classes are user classes that are called after each
event and step respectively. They allow for the addition or extraction of information at
these levels. In the case of the TAGS model, information that is produced by the RDM is
21

[Decay Index] (0-Other, 1-β-, 2-β+, 3- e−-capture, 4-α, 9- Error)
[Feeding Energy from RDM]
[γ1 from RDM]
[γ2 from RDM]
[γ3 from RDM]
[TAGS energy deposited]
[Si detector energy deposited]
[spare data field]
[PMT1 light counted] double
[PMT2 light counted] double
[PMT3 light counted] double
[PMT4 light counted] double
[PMT5 light counted] double
[PMT6 light counted] double
[PMT7 light counted] double
FIG. 14: Event Data structure, all values are unsigned short except the PMT values
extracted at the step level and passed to the EventAction. The EventAction accumulates
all of the relevant information from the SensitiveDetector classes and the SteppingAction,
and passes this bundle to the RunAction where it can be written to file.
E. RunAction and Output
RunAction is the final user action class called in this model. Its main purpose is to collate
the data and write the results to an output file. Information is written in binary format to
minimise the size of the output file.
The output consists of a header for the file, this names the data and gives the number of
events that were simulated. The rest of the information is given on an event by event basis
like experimentally obtained data. The structure of the data is shown in figure 14.
The RDM does not have direct access to the events that it is producing. Some extra code
has been put in place to draw out this information. The first field in the data structure is a
22

decay index, indicating the type of decay that the RDM has selected from the decay input
file. Next is the energy of the emitted decay. The following three fields give the individual
γ-transitions that have been emitted by the RDM.
The TAGS and Silicon detector energy deposited fields are the accumulated energy de-
posited in the respective sensitive detectors (in units of keV). The PMT light counted fields
give the number of photons that hit the individual pseudo photocathodes. These fields are
used for the light activated version of the simulation.
23

VI. TAGS SIMULATIONS
A. Detector Efficiency
Using an earlier version of the TAGS simulation, the total and Full Energy Peak (FEP)
efficiencies were determined by simulation. This was undertaken as a test of the basic
functioning of the model and to establish the best source position (in terms of efficiency),
along the axis from the bottom of the well. The total (a) and FEP (b) efficiencies are shown
in figure 15. The results confirm that the optimum position for a source is 2.5 cm from the
bottom of the well and that a maximum total efficiency of 99% for an energy of 200 keV
can be achieved, in agreement with reference [Gre92a].
B. Resolution
The resolution of a detector is composed of contributions from many physical factors, for
example noise in the analogue electronics. Many of these physical processes are not modelled
in the simulation, the most significant of these is from the data acquisition system. The G4
simulation produces discrete data that models only the most significant physical properties
of a detector. In place of modelling all processes and extending simulation run times, some
of the more dominant properties can be added post-simulation.
One such property is the detector resolution. A gaussian broadening is applied to the
simulation results, where the properties of the broadening can be determined from experi-
ment.
C. Non-proportionality of light
The problem of non-proportionality is treated in recent TAGS work undertaken by the
Valencia group [Can99a]. They use a collection of NaI(Tl) data from various references,
under the assumption that the data is applicable, and use this to derive an expression for
the detector response to electrons. This expression is then utilised in the simulation to
determine the overall non-proportional shift from an interaction in the detector.
A method of dealing with and modelling the non-proportional response has not been
implemented in the model. This is being investigated and is the subject of future work.
24

(a)
(b)
FIG. 15: Simulation of (a) the TAGS total efficiency and (b) the TAGS Full Energy Peak efficiency
as a function of source position from the bottom of the well, z
25

(a) (b)
FIG. 16: OpenGL rendering of TAGS geometry showing (a) a 250 eV electron deposited in the
sensitive detector (indicated by the red circle) and the resulting optical photons hitting a single
large pseudo PMT (b) update of model to include individual PMT sensitive detectors
D. Simulation of Light
To investigate the fundamental reason for non-proportionality, some different approaches
were used with varying complexity in the level of modelling. The first approach taken was the
energy deposited method, that records the interactions of electrons for the TAGS sensitive
detector.
An alternative method employs the scintillation module in G4. The model follows the
light produced in the scintillator crystal and tracks the photons until they hit the aluminium
PMT pseudo-cathode. Figure 16 (a) shows an OpenGL rendering of light produced from
a 250 eV electron deposited in the TAGS volume. The pseudo PMT is simply used as a
sensitive region to count the amount of light (number of photons) that reach the material,
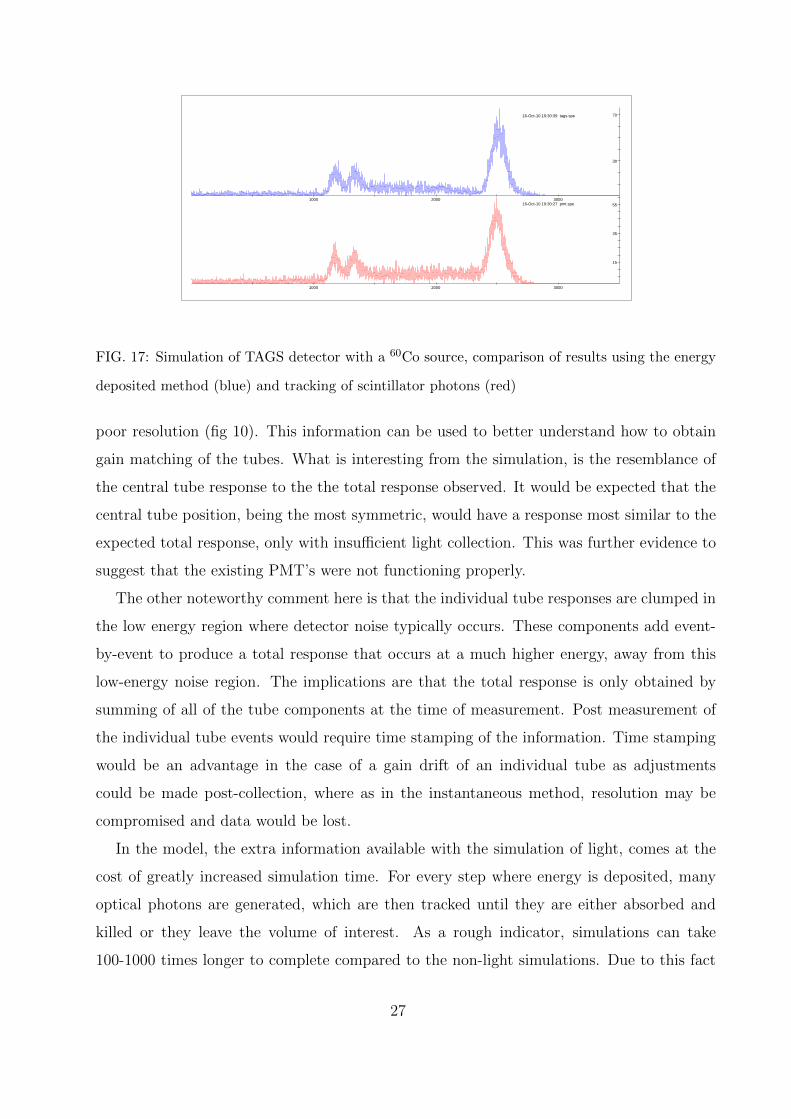
so there is no reflection at that boundary. Figure 17 shows a comparison of simulated data
with and without simulation of the optical photons.
An update to the model was the separation of the single pseudo PMT into seven PMTs
positioned in the same arrangement as the TAGS PMTs. This separation can be seen in
figure 16 (b). What is of interest is the individual tube response to light, as measured in
the section ”PMT gain matching”. The simulated individual tube response to a 60Co source
(fig 18) gives the same general trends as the measured individual responses, though with very
26
1000 2000 3000
15
35
5516-Oct-10 19:30:27 pmt.spe1000 2000 3000
30
7016-Oct-10 19:30:39 tags.spe
FIG. 17: Simulation of TAGS detector with a 60Co source, comparison of results using the energy
deposited method (blue) and tracking of scintillator photons (red)
poor resolution (fig 10). This information can be used to better understand how to obtain
gain matching of the tubes. What is interesting from the simulation, is the resemblance of
the central tube response to the the total response observed. It would be expected that the
central tube position, being the most symmetric, would have a response most similar to the
expected total response, only with insufficient light collection. This was further evidence to
suggest that the existing PMT’s were not functioning properly.
The other noteworthy comment here is that the individual tube responses are clumped in
the low energy region where detector noise typically occurs. These components add event-
by-event to produce a total response that occurs at a much higher energy, away from this
low-energy noise region. The implications are that the total response is only obtained by
summing of all of the tube components at the time of measurement. Post measurement of
the individual tube events would require time stamping of the information. Time stamping
would be an advantage in the case of a gain drift of an individual tube as adjustments
could be made post-collection, where as in the instantaneous method, resolution may be
compromised and data would be lost.
In the model, the extra information available with the simulation of light, comes at the
cost of greatly increased simulation time. For every step where energy is deposited, many
optical photons are generated, which are then tracked until they are either absorbed and
killed or they leave the volume of interest. As a rough indicator, simulations can take
100-1000 times longer to complete compared to the non-light simulations. Due to this fact
27

PMT7Entries 24748Mean 311.8RMS 108.3
0 500 1000 1500 2000 2500 30000
50
100
150
200
250
300
350
PMT7Entries 24748Mean 311.8RMS 108.3
PMT7
(a) components
PMT7Entries 24748Mean 311.5RMS 107.8
0 100 200 300 400 500 6000
50
100
150
200
250
300
350
PMT7Entries 24748Mean 311.5RMS 107.8
PMT7
(b) zoom on components
FIG. 18: TAGS simulation of 60Co showing (a) the individual PMT components with the summed
result (b) zoom in on individual components
alone, the selection of this option for simulations is not a favourable one for general purposes
although it holds promise for a more fundamental understanding of how the TAGS detector
works.
28

600 1000 1400 1800 2200 2600 3000
600
1400
16-Aug-10 20:47:07 5b2a_Co6
600 1000 1400 1800 2200 2600 3000
60
140
220
16-Aug-10 20:47:07 Co60c_d0
600 1000 1400 1800 2200 2600 3000
60
140
220
16-Aug-10 20:47:07 Co60c_d0
FIG. 19: ANL3x3 detector with 60Co source placed against face of detector. Simulation (blue)
Experiment (red)
E. Basic simulation comparisons
The basic energy summing model was tested against three NaI(Tl) detectors, a 3” x 3”
cylindrical detector (ANL3x3), a 5” x 5” cylindrical detector (ANU5x5) and a 6” x 5” well
type detector (ANSTOwell). The dimensions of the simulation were altered from the basic
model in order to verify the functioning of the model components. In increasing the size
and complexity of the detectors being modelled, the progress of the model at handling the
properties found in a large well type TAGS detector can be evaluated.
A 60Co source was placed against the face of the ANL3x3 detector and measured, the
setup was then simulated. Figure 19 shows a comparison of the experimental results (red)
to the simulation result (blue). Good agreement is found with the main spectral features
with the exception of the 60Co sum-peak positions. The slight differences here are due to
light non-proportionality not being implemented in the basic simulation model.
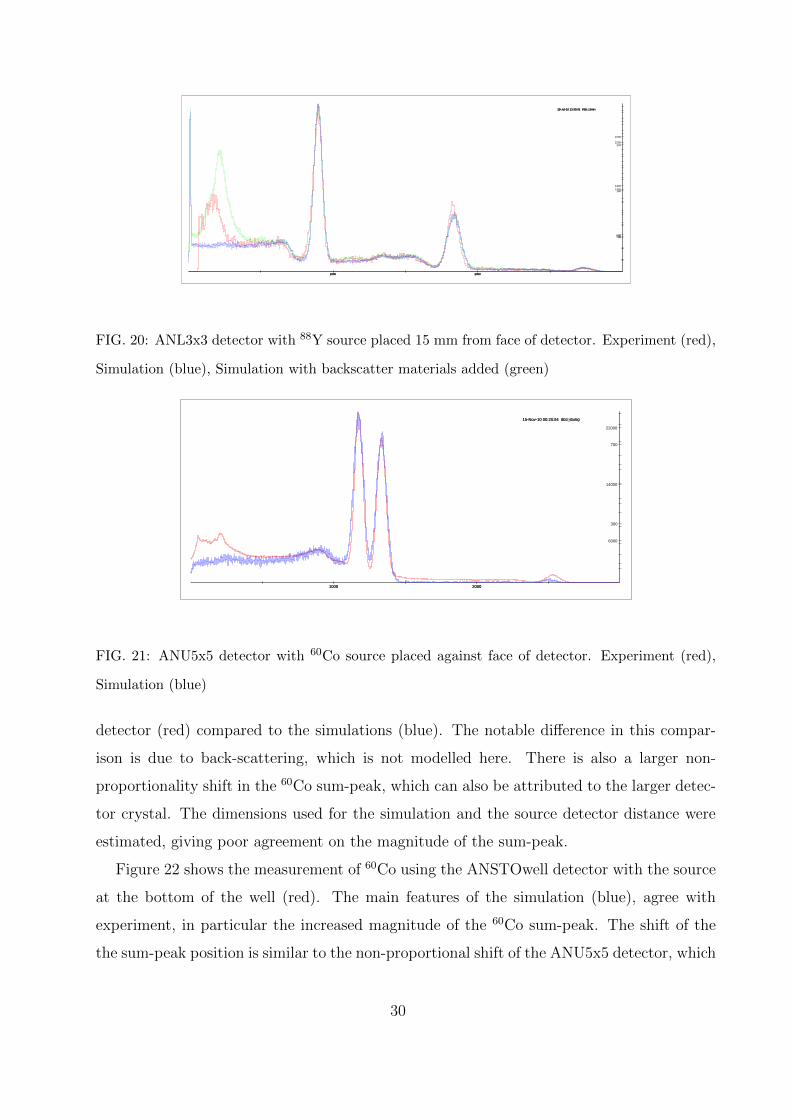
A similar comparison was undertaken using 88Y (fig 20), with a source detector distance
of 15 mm. The experimental result (red), is compared to the basic simulation (blue) and
also a version of the simulation incorporating background materials in order to reproduce
the backscatter feature (green). Once again the overall trend is modelled well. The largest
discrepancy is the backscatter peak. Improvement is likely to be possible by more accurately
modelling the materials surrounding the detector in the experiment.
Figure 21 shows the measurement of a 60Co source placed against the face of the ANU5x5
29
1000 2000
600
1400
2200
28-Jul-10 13:39:21 5b2b_Y88
1000 2000
60
140
220
28-Jul-10 13:39:44 Y88_15mm
1000 2000
600
1400
2200
28-Jul-10 13:40:02 Y88_15mm
FIG. 20: ANL3x3 detector with 88Y source placed 15 mm from face of detector. Experiment (red),
Simulation (blue), Simulation with backscatter materials added (green)
1000 2000
6000
14000
22000
15-Nov-10 00:24:34 d0cmbckg
1000 2000
300
700
15-Nov-10 00:25:04 5b2_Co60
FIG. 21: ANU5x5 detector with 60Co source placed against face of detector. Experiment (red),
Simulation (blue)
detector (red) compared to the simulations (blue). The notable difference in this compar-
ison is due to back-scattering, which is not modelled here. There is also a larger non-
proportionality shift in the 60Co sum-peak, which can also be attributed to the larger detec-
tor crystal. The dimensions used for the simulation and the source detector distance were
estimated, giving poor agreement on the magnitude of the sum-peak.
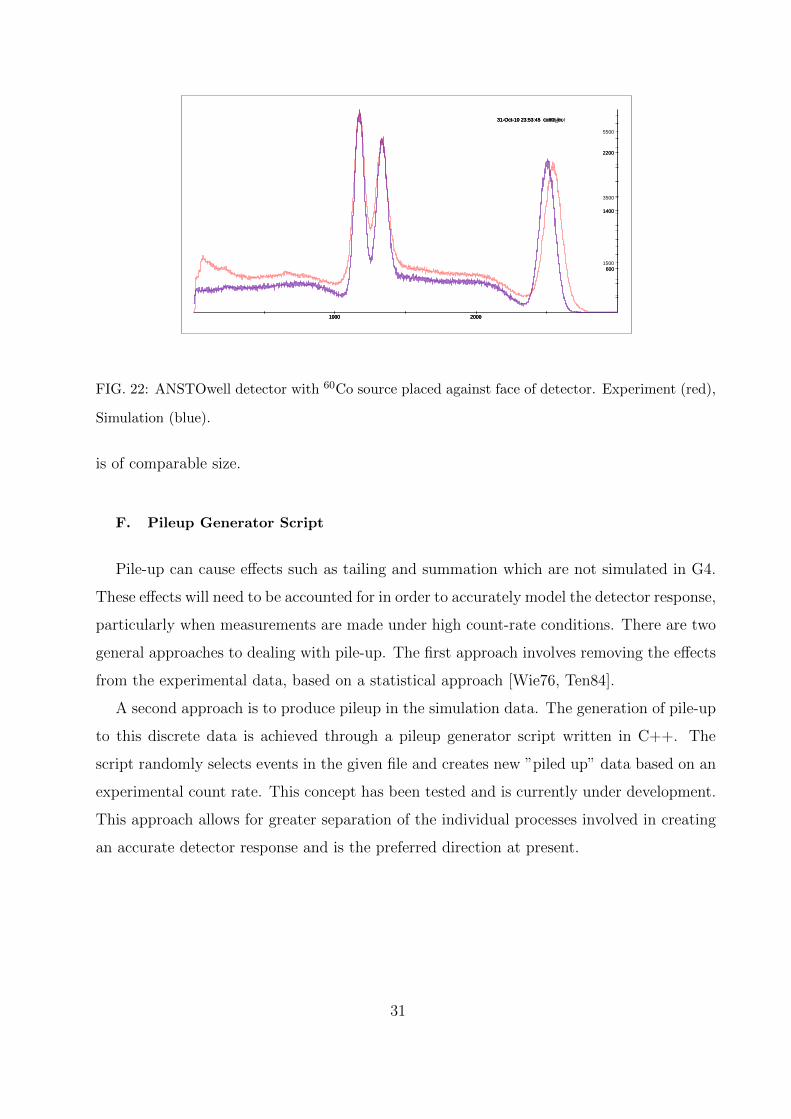
Figure 22 shows the measurement of 60Co using the ANSTOwell detector with the source
at the bottom of the well (red). The main features of the simulation (blue), agree with
experiment, in particular the increased magnitude of the 60Co sum-peak. The shift of the
the sum-peak position is similar to the non-proportional shift of the ANU5x5 detector, which
30
1000 2000
1500
3500
5500
31-Oct-10 23:53:45 Co60_bot
1000 2000
600
1400
2200
31-Oct-10 23:53:45 co60sim.
1000 2000
600
1400
2200
31-Oct-10 23:53:45 co60sim.
FIG. 22: ANSTOwell detector with 60Co source placed against face of detector. Experiment (red),
Simulation (blue).
is of comparable size.
F. Pileup Generator Script
Pile-up can cause effects such as tailing and summation which are not simulated in G4.
These effects will need to be accounted for in order to accurately model the detector response,
particularly when measurements are made under high count-rate conditions. There are two
general approaches to dealing with pile-up. The first approach involves removing the effects
from the experimental data, based on a statistical approach [Wie76, Ten84].
A second approach is to produce pileup in the simulation data. The generation of pile-up
to this discrete data is achieved through a pileup generator script written in C++. The
script randomly selects events in the given file and creates new ”piled up” data based on an
experimental count rate. This concept has been tested and is currently under development.
This approach allows for greater separation of the individual processes involved in creating
an accurate detector response and is the preferred direction at present.
31
G. TAGS response generation: RDM vs GPS vs Mixing script
To unfold TAGS experimental data requires a simulated detector response using the
proposed decay scheme as input. If the measurement and simulation agree, then it is possible
that the decay scheme proposed is the correct one. If they do not agree, then the decay
scheme is changed by adjusting existing β-decay feeding intensities or through the addition
of new β-levels. A simulation response based on the new decay scheme would then need to
be generated and the process repeated until agreement is found.
The most efficient process for achieving agreement has not been finalised. Several alter-
native methods are being considered, involving (i) the use of the Radioactive Decay Module
(RDM), (ii) the General Particle Source (GPS), or (iii) a mixing script.
1. Radioactive Decay Module (RDM)
As previously mentioned (PhysicsList and PrimaryGeneratorAction), the RDM is treated
as an ion that undergoes radioactive decay determined by input from two text files. The
first text file contains the decay information for the specified species, the second file contains
information about the transitions that result and is used as input by a photon-evaporation
module. The standard input files come as a package with GEANT4 and are sourced originally
from ENSDF data.
The control of the RDM is via command line at the user interface or macro file for
batch mode. The advantage of using the RDM, is that all of the response for a particular
β-feeding level is given in a single event, which takes care of summing of γ-transitions in
cascade. Furthermore, these files can be modified to suit any changes required and could
possibly be done using a conversion script to pull information from a more standard format
such as an ENSDF file.
Some disadvantages are the requirement of a specific file name for the input files, (eg
z27.a60 for 60Co), resulting in the constant writing over of the one file which could lead
to mistakes. The RDM creates a single response for a complete decay to the ground state,
separation of the components for analysis is not a straight-forward task. Iteration of the level
scheme, eg adding a β-level, may require the time consuming re-running of the simulation.
32
2. General Particle source (GPS)
A similar approach is possible through the use of the GPS module. In this case, the
total response can be produced by means of a multiple vertex option that allows several
mono-energetic particles or photons to be defined and emitted in a single event. The advan-
tage is the flexibility of being able to get a single total response for the defined β-feeding
branch including cascade summing effects, while retaining the ability to simply separate the
components for analysis.
This approach has the requirement to define all of the transitions in macro input-files
which could be tedious, but has the advantage of being more flexible than the RDM. The
value of this method is currently being investigated.
3. Folding script
In the approach reported by the Valencia group [Can99a], all mono-energetic γ-transitions
for the decay scheme are modelled individually. The detector response to a β-feeding level
is determined by folding these individual γ-transitions.
A stand-alone script has been written in C++ to fold γ-responses by randomly selecting
components from two individual γ-response input files. This is done in a way so as to
maintain the geometry properties (detection efficiency) of the detector responses. Figure 23
(a) shows an example of a 60Co source simulated using the RDM (main β-branch), compared
to the mono-energetically produced components. These components are folded using the
script and compared to the RDM produced result in figure 23 (b). The slight discrepancy
is due to not including the bremsstrahlung or direct observation of β.
The advantage of this method, is the one time use of the simulation code to produce all
of the required β and γ transitions. If a β-level is added, only this added level is required to
be simulated. Any gain of time in not re-doing simulations may be taken up with the time
to run the mixing code for each convolution, although this is quicker.
33

1000 2000 3000
15000
3500001-Nov-10 00:32:34 1173.spe
1000 2000 3000
15000
3500001-Nov-10 00:32:49 1173.spe
1000 2000 3000
15000
01-Nov-10 00:32:58 1332.spe
1000 2000 3000
3000
7000
11000
01-Nov-10 00:33:33 5b_Co60.
(a)
1000 2000 3000
3000
7000
11000
24-Jul-10 22:19:21 5b_Co60.
1000 2000 3000
6000
14000
24-Jul-10 22:19:31 EA3_gam.
(b)
FIG. 23: Folding script used to fold individually simulated responses. (a) 60Co main β-branch
simulated using RDM (red) compared to the individual components (b) individual components
folded (blue)
34
VII. CONCLUSION
This work has resulted in a basic working model of the TAGS detector at Argonne,
written using Geant4. Future work will be to model and better understand the detectors’
non-proportional response to light, test and benchmark the pile-up generator script against
a working TAGS detector, and to fine tune to accommodate the analysis method for TAGS
data.
Step-by-step instructions on how to operate the current version of the model are given in
an appendix that is separate to this report.
35
[Agn03] S. Agostinelli et al, Geant4-a simulation toolkit, Nuclear Instruments and Methods in
Physics Research Section A: Accelerators, Spectrometers, Detectors and Associated Equip-
ment 506 (2003), no. 3, 250 – 303.
[Aww] Advanced Gamma Tracking Array (AGATA) instrument (see http://www-
win.gsi.de/agata)
[Can99a] D. Cano-Ott, J. L. Tain, A. Gadea, B. Rubio, L. Batist, M. Karny, and E. Roeckl, Monte
carlo simulation of the response of a large nai(tl)total absorption spectrometer for [beta]-
decay studies, Nuclear Instruments and Methods in Physics Research Section A: Accelerators,
Spectrometers, Detectors and Associated Equipment 430 (1999), no. 2-3, 333 – 347.
[Car] Proposal for the 252Cf source upgrade to the ATLAS facility (see
http://www/phy.anl/gov/atlas/caribu/)
[Dwww] Assessment of fission product decay data for decay heat calculations (see report at
http://www.nea.fr/science/wpec)
[Eng56] D. Engelkemeir, Nonlinear response of NaI(Tl) to photons, Review of Scientific Instru-
ments 27 (1956), no. 8, 589–591.
[Fww] FAIR - Facility for Antiproton and Ion Research (European facility, see
http://www.gsi.de/fair/index e.html)
[FRww] FRIB - Facility for Rare Isotope Beam (US facility, see http://www.frib.msu.edu)
[Gww] GEANT4 webpage (http://geant4.cern.ch/)
[GRww] Gamma-Ray Energy Tracking Array (GRETA) (see http://grfs1.lbl.gov)
[Gre92a] R. C. Greenwood, R. G. Helmer, M. A. Lee, M. H. Putnam, M. A. Oates, D. A.
Struttmann, and K. D. Watts, Total absorption gamma-ray spectrometer for measurement
of beta-decay intensity distributions for fission product radionuclides, Nuclear Instruments
and Methods in Physics Research Section A: Accelerators, Spectrometers, Detectors and As-
sociated Equipment 314 (1992), no. 3, 514 – 540.
[Gre92b] R. C. Greenwood, D. A. Struttmann, and K. D. Watts, Use of a total absorption gamma-
ray spectrometer to measure ground-state [beta]–branching intensities, Nuclear Instruments
and Methods in Physics Research Section A: Accelerators, Spectrometers, Detectors and As-
sociated Equipment 317 (1992), no. 1-2, 175 – 184.
36

[Gre95] R. C. Greenwood, M. H. Putnam, and K. D. Watts, Measurement of ground-state [beta]–
branching intensities of deformed rare-earth nuclides using a total absorption [gamma]-ray
spectrometer, Nuclear Instruments and Methods in Physics Research Section A: Accelerators,
Spectrometers, Detectors and Associated Equipment 356 (1995), no. 2-3, 385 – 389.
[Gre97] R.C. Greenwood, R.G. Helmer, M.H. Putnam, and K.D. Watts, Measurement of [beta]–
decay intensity distributions of several fission-product isotopes using a total absorption
[gamma]-ray spectrometer, Nuclear Instruments and Methods in Physics Research Section
A: Accelerators, Spectrometers, Detectors and Associated Equipment 390 (1997), no. 1-2, 95
– 154.
[Har77] J. C. Hardy, L. C. Carraz, B. Jonson, and P. G. Hansen, The essential decay of pandemo-
nium: A demonstration of errors in complex beta-decay schemes, Physics Letters B 71 (1977),
no. 2, 307 – 310.
[Kan61] J. Kantele and R.W. Fink, Coincidence summing and non-linearity studies with a two-
crystal scintillation gamma spectrometer, Nuclear Instruments and Methods 13 (1961), 141 –
146.
[Kar97] M. Karny, J.M. Nitschke et al, Coupling a total absorption spectrometer to the gsi on-
line mass separator, Nuclear Instruments and Methods in Physics Research Section B: Beam
Interactions with Materials and Atoms 126 (1997), no. 1-4, 411 – 415.
[Met49] Nicholas Metropolis and S. Ulam, The monte carlo method, Journal of the American
Statistical Association 44 (1949), no. 247, 335 – 341.
[Mos08] W.W. Moses, S.A. Payne, W.-S. Choong, G. Hull, and B.W. Reutter, Scintillator non-
proportionality: Present understanding and future challenges, Nuclear Science, IEEE Trans-
actions on 55 (2008), no. 3, 1049 –1053.
[Pee60] R. W. Peelle and T. A. Love, Method for detecting nonproportionality of response for
gamma-ray scintillators, Review of Scientific Instruments 31 (1960), no. 2, 205–206.
[Pri50] R. W. Pringle and S. Standil, The gamma-rays from neutron-activated gold, Phys. Rev. 80
(1950), no. 4, 762–763.
[Rub07] W. Gelletly B. Rubio, Total absorption spectroscopy, Romanian Reports in Physics 59
(2007), no. 2, 635 – 654.
[Ten84] Fred H. Tenney, Idealized pulse pileup effects on energy spectra, Nuclear Instruments and
Methods in Physics Research 219 (1984), no. 1, 165 – 172.
37

[Wie76] Lucian Wielopolski and Robin P. Gardner, Prediction of the pulse-height spectral distortion
caused by the peak pile-up effect, Nuclear Instruments and Methods 133 (1976), no. 2, 303 –
309.
[Zer61] C.D. Zerby, A. Meyer, and R.B. Murray, Intrinsic line broadening in nai(tl) gamma-ray
spectrometers, Nuclear Instruments and Methods 12 (1961), 115 – 123.
38