Embed Size (px)
Citation preview

1
Nuclear Chemistry: An Application of the National Science Education Standards
Timothy Styranec Ursuline High School
750 Wick Avenue Youngstown, OH
(330)744-4563 [email protected]
Report Submitted for: Chemistry 6973
Summer 2004
Keywords: Introductory/High School Chemistry,
General Chemistry, Nuclear/Radiochemistry

2
Abstract
Nuclear chemistry is a topic that most high school science teachers do not get to teach that often. As a result, they have not developed many activities designed to teach nuclear chemistry. This portfolio provides references to various labs and activities that can be used to teach nuclear chemistry as inquiry. The Physical Science Standard PS 1d from the National Science Education Standards provides the focus of this project.
3
Benchmarks
The National Science Education Standards (NSES) have dramatically altered how
educators believe science should be taught14. Since these Standards have come about
college professors and high school science educators have been trying to develop
activities and methods of assessment to correspond to the guidelines and benchmarks. In
addition, state standards and the standards of counties and some school districts have
written their own standards to coincide to the national standards. This paper discusses
the application of such activities in a high school chemistry class to a certain benchmark.
The NSES Physical Science Standard that will be focused upon in this study will
be PS 1c under the PHYSICAL SCIENCE—STRUCTURE OF ATOMS. The standard
reads:
PS 1c The nuclear forces that hold the nucleus of an atom together, at nuclear distances, are usually stronger than the electric forces that would make it fly
apart. Nuclear reactions convert a fraction of the mass of interacting particles into energy, and they can release much greater amounts of energy than atomic
interactions. Fission is the splitting of a large nucleus into smaller pieces. Fusion is the joining of two nuclei at extremely high temperature and pressure, and is the
process responsible for the energy of the sun and other stars.
Other physical standards under the structure of atoms related to this one include:
PS 1d Radioactive isotopes are unstable and undergo spontaneous nuclear reactions, emitting particles and/or wavelike radiation. The decay of any one nucleus cannot be predicted, but a large group of identical nuclei decay at a predictable rate. This predictability can be used to estimate the age of materials that contain radioactive
isotopes.
Another standard directly related to the above standards, but listed under the Physical
science standards under the conservation of energy and increase in disorder.
PS 5a The total energy of the universe is constant. Energy can be transferred by collisions in chemical and nuclear reactions, by light waves and other radiations, and in many other ways. However, it can never be destroyed. As these transfers
occur, the matter involved becomes steadily less ordered.
4
The Ohio Academic Content Standards20 correspondingly deals with the
benchmark PS 1 listed above. The Ohio standards are composed of six main areas
including Earth and Space Science, Life Science, Physical Science, Science and
Technology, Scientific Inquiry, and Scientific Ways of Knowing. Within the physical
science benchmarks, the following exert was taken from the eleven to twelve program.
Students must recognize that some atomic nuclei are unstable and will spontaneously
break down.
Also, this topic is seen in the Ohio standards concerning the nature of energy. The
standard states that students should be able to:
Summarize how nuclear reactions convert a small amount of matter into a large amount of energy.(Fission involves the splitting of a large nucleus
into smaller nuclear fusion is the joining of two small nuclei into a larger nucleus at extremely high energies.)
This benchmark and standard provide a link to the Ohio standards, but it is not as
descriptive as the NSES. Nevertheless, it is a guide to what students should know by the
end of grade eleven. The Ohio standards and the NSES together provide a decent
framework of what science students need to understand and be able to do.
Not only is nuclear decay is related to the physical science standards, it is also
related to the other areas of science, as seen in the standards. Extensions can be made to
each. In terms of earth and space science, an extension can be made to the sun because
the sun provides the light and heat necessary to maintain the temperature of the earth.
This energy comes from nuclear fusion reactions within the sun. Radiactive decay also
provides the heat to warm the earth itself with the core of the earth being molten metal.

5
This heat comes from the natural radioactive decay of the atoms contained within the
earth.
In regards to the Science and Technology section of NSES4, students can
determine the difference between manmade radiation and natural. Both forms are present
and both forms provide useful and negative affects upon our lives. In terms of the
Science in Personal and Social Perspectives, nuclear chemistry can be discussed in
personal health, types of resources, and science and technology in local challenges.
Nuclear power, nuclear weapons, nuclear medicine, and the other uses of radiation has a
profound effect of the lives of human beings. Finally, nuclear power is a human
endeavor that has spanned the last one-hundred years. From these connections, it is
obvious that the subject of nuclear decay presents a great connection between the
different categories of standards. This paper presents various ways the teachers of
science can implement nuclear decay into their classrooms.
In addition to the physical science standards, the following Unifying Concepts
and Processes are also covered in this portfolio.
UCP 1 Systems, order, and organization
UCP 3 Change, constancy, and measurement
UCP 5 Form and function
The standard UCP 3 Change, constancy, and measurements are seen throughout
this topic. Nuclear chemistry involves changes because energy is released. Energy can
be transferred and matter can be changed. But, the sum of energy and matter in systems
remains the same. These changes can also be quantified and characterized through

6
measurement. This extension to mathematics is evident in the determination of half-life
and the use of logarithms.
Prior Knowledge
The prior knowledge students should have includes the structure of the atom .
They should understand that atoms are composed of a nucleus and the electron cloud.
The nucleus contains the protons and neutrons, and the electrons spin around the nucleus
distinct energy levels. The students should know how to use the periodic table by finding
the atomic mass (number of protons) and the atomic mass. They need to know that the
mass number is the sum of the protons and neutrons. This should be the only prior
knowledge that the students should need to understand nuclear chemistry. An review
activity has been provided in the Appendix for isotopes (nuclides).
Moreover many students have misconceptions associated with chemistry12,13 and ,
more specifically, the current subject of nuclear chemistry. When revealing the
misconceptions associated with studying nuclear chemistry it seems that many people
believe that all radiation is harmful18. But, in moderate amounts, radiation can actually
be beneficial. Sources of radiation are available even in our everyday lives. A high
altitude flight exposes an airline passenger to cosmic radiation, and radio waves pass
through our bodies constantly. Ultraviolet radiation causes our bodies to manufacture
vitamin D, but large doses of UV light can be hazardous, to the point of even causing
disease. It is important that students understand that radiation can provide useful benefits
including energy, medicine for disease, and the ability to tell the age of artifacts.
Radiation can be used to give a longer shell life to food, but the food itself does not
become radioactive. The irradiation process involves passing food through an
7
irradiation field. While in the irradiation field, the food itself never contacts a radioactive
substance. In addition, the ionizing radiation used by irradiators is not of sufficient
energy to disintegrate the nucleus of even one atom of a food molecule.
Another misconception9 is students are often left with the impression that as
radioisotopes decay they disappear. This, of course, is not true, and students need to
understand that the atoms become something different. For example, when a carbon-14
nuclide decays, it becomes a nitrogen-14 atom by releasing electrons. This idea goes
back to the conservation of matter and energy. Subsequently, matter in the universe
cannot be lost or gained.
Objectives
There are many objectives of this portfolio. The goals are that students be able to
describe to predict the particles and electromagnetic waves produced by different types of
radioactive decay, and write equations for nuclear decays, identify examples of nuclear
fission, and describe potential benefits and hazards of its use. Finally the students should
be able to describe nuclear fusion and its potential as an energy source. The students
should use reasoning to determine the potential pros and cons of nuclear power.
The students must understand that atomic nuclei undergo a variety of nuclear
reactions including alpha emission( in which a helium nucleus is emitted), beta emission (
in which an electron is emitted), and gamma emission (in which a gamma ray is given
off). These reactions are caused due to the instability in the nucleus of the atom, because
of the presence of too many or too few neutrons. The time it takes for fifty percent of the
nuclei in a sample to undergo nuclear decay is called the half-life. Teaching nuclear
decay can be a rather dull subject, but the applications of nuclear chemistry11 (nuclear
8
war, radiation, etc.) can stimulate student interest. For example, the nuclear bomb can be
used to distinguish the difference between fission and fusion.
Additionally, scientists do not really understand fully why some nuclei decay,
and our students need to understand this. Most of what we know is based upon empirical
or experimental evidence. The students need to be aware of this because many times
students believe that we, as teachers of science, are lying to them. It is apparent that most
nuclei with ninety-one protons usually are radioactive. This is probably because ninety-
one positive charges can’t be packed into a small space with neutrons and expect it to
hold together. This ratio of protons to neutron has everything to do with radioactive
decay. This is what the students need to understand. However, when you get to heavier
elements, the ration of neutron to protons leans toward the ration of three to two. This is
not theoretical data; it is an observation that seems to fit most of the time.
Fission is a nuclear reaction in which a very heavy nucleus is split into two
approximately equal fragments. This process, known as a chain reaction, releases several
neutrons which in turn split more nuclei. If it is not controlled, a nuclear explosion can
occur. Fusion is a nuclear reaction in which two or more small nuclei are forced together
to form one larger nucleus. The energy released during a fusion reaction is much greater
than in a fission reaction.
Inquiry
Inquiry is an important goal of both this portfolio and the NSES standards4. The
opening activity of the lesson takes a student into a discrepant event. Most people
believe that radiation is harmful and that they are not exposed to it. However, the
beginning activity shows that radiation is actually everywhere, even in everyday lives.

9
The students will work on this in groups of two or three, and then they will discuss their
results within the group. The class as a whole will then share their results. This will be
done as a group activity with the teacher guiding the students through the activity.
Another aspect of inquiry is the use of the “Radioactive Cookie” activity. The
students will have to distinguish between the different forms of radiation by determining
how to dispose of the cookies. Should they eat the cookie or store it in a vault for
eternity. This is inquiry because it allows the students to work at their own pace in
groups. The teacher is there to provide support and guidance, not the right answers. The
result of the activity is not a write or wrong answer, but an explanation of why. They
must justify their chose of disposal methods.
The topic of nuclear chemistry will not be taught through lecture. Instead, a
Webpage will be provided to give the students examples and work through the nuclear
reactions. Other activities, described below, allow the students to work through the
material on their own, individually or in groups with teacher guidance. Some activities
have no right or wrong answers. Those that do have right answers focus on the reasoning
behind the answers. The labs contain questions that require deeper though and
reasoning, utilizing Bloom’s Taxonomy. And, the directions for the lab leave much of
the technique up to student design. The culminating activity provides a way for the
students to utilize the scientific method and their research skills. It also allows them to
share their results with the rest of the class emphasizing science in its purest form. This
paper cannot stress the importance of students being able to explain their answers. Past
research has shown that most students can give correct responses to the questions of
10
teachers, but many of these students cannot give the appropriate reasoning behind their
choices.
The assessment will be more conceptual, as it will coincide with the teaching
methods. At the end of the unit, students will give a presentation to assess their
understanding of the reasoning behind the concepts. They will also be given a short quiz
with the conceptual question format given in Barouch’s book3.
Activities
There are eleven activities that can help the students understand nuclear decay by
applying the National Science Education Standards. These are listed below and will be
described in detail in the Appendix. There are also two very effective demonstrations
that demonstrate the two of the principles of nuclear chemistry. Safety is a major concern
with any lab, but be extra cautious with the nuclear experiments. The students should not
eat in the lab. They should not touch the radioactive sources and then touch their faces or
each other. The sources used in the experiment are not dangerous, but there is serious
connotation associated with radiation. The barium waste can go down the drain with a
copious amount of water.
1. Estimate Your Personal Radiation Dose (Discrepant Event)
2. Webpage-Day One Introduction
3. Review of Isotopes Worksheet
4. www.chemthink.com
5. Radioactive Cookies
6. The Chart of the Nuclides
7. Half Life Simulation with Pennies or Half Life Simulation with M&M’s

11
8. Lifetime Measurement – Half-Life Determination
9. Nuclear Radiation
10. Culminating Activity: Nuclear Chemistry Webquest
11. Voyages in conceptual chemistry individual project(Assessment)
Demonstrations
1. Chain Reaction
2. Cloud Chamber
Activity One-Day One
This activity introduces students to the idea of nuclear decay. Most students
believe that radiation does not affect them unless they live near a nuclear power plant or
are in a nuclear explosion. However, radiation is all around us. The students pair up into
groups of two or three. They each complete a questionnaire1 provided by the American
Nuclear Society and share this information with the students in their group. The students
will then average their results and place it on the board. We will then discuss as a class
what surprises then and discuss where the radiation comes from, distinguishing between
natural and artificial sources. The teacher should try to determine what surprises the
students and what does not? These are some things that can perhaps be written on the
board. The activity as well as the directions is included in the Appendix. The time
period for the activity should be about thirty minutes.
In the last twenty minutes, a suggested activity is using a modified webpage10
obtained from Howe High School. This activity introduced students to nuclear chemistry
by browsing a few web pages. The students do need access to the internet for this

12
activity. The site opens the students’ eyes to the very real nature of nuclear chemistry.
It is also appropriate that demonstration two be used on day one.
Activity Two- Day Two
The second activity is a short review of nuclides. The students should work on
this activity in groups or individually, depending on your preferences as a teacher. The
activity is very short (Since it should be review) with the students completing the
handout. The teacher should provide help but not answer the students’ questions. Guide
them through the activity. The activity should lead them into the idea that radioactivity
depends upon the ratio of protons to neutrons (eg., a high ratio causes the atom to be
unstable.) After the students are done with this activity, try to get this out of them in
discussion. If you feel that more practice is needed concerning isotopes
www.chemthink.com. This website provides good interactive practice and a quiz to
ensure that the students understand. They must understand isotopes before the teacher
can continue in the nuclear chemistry.
Activity Three- Day Three-Four
The students will be given a handout discussing the various types of decay( alpha,
beta, and gamma). They will use this to complete the activity4 “Radioactive Cookies.”
In the activity the groups of students are handed four cookies and are told that each of the
cookies emits radiation (this is a simulation). They must then decide what to do with
each. They can eat the cookies (if they are daring.) They can dispose of the cookies at an
appropriate site or they can put the cookies in their pocket or hold it in their hands. They
are told what type of emitter each cookie is and they must decide what to do and give the
reasoning behind their decisions. Credit will be given for the reasoning behind their

13
decision. The activity should take about thirty minutes. Again the teacher should
provide help but not the answers. In the last twenty minutes of class, the teacher should
discuss the solution, not the answers, with the students.
One the second day, the teacher should provide the students access to the internet.
This interactive exercise will guide the students through balancing different types of
nuclear reactions. The assignment should be collected and checked by the teacher. At
the end of the fourth day the students should have the concepts of nuclear decay
understood. It is also appropriate that demonstration one be used on day three.
Concluding the class the teacher should ensure that students understand the
different types of decay by using the Chart of the Nuclides. This chart provides a vast
amount of information in determining the different types of decay. The teacher should
discuss the basics of the chart in preparation for the next day’s activities.
Activity – Day Five
The Chart of the Nuclides is a reference for nuclear chemistry that includes all of
the nuclides (isotopes). It provides information that can be found in the periodic but goes
into greater detail and also provides information about nuclear decay.
There are two activities that can be used for this assignment. There is a lab
entitled “Chart of the Nuclides” available from the Westminster College Science in
motion program4. This is a very good lab, but it is a little too complicated for a high
school chemistry class. The suggested activity8 to use is a worksheet that utilizes the
Chart of the Nuclides. The activity takes the students on a tour of the chart. It requires
them to be able to analyze the chart and use. This activity and the answer sheet are
included in the Appendix. When students are completing this assignment, provide
14
guidance, but not the answers. Stress the importance of the chart and its significance in
nuclear chemistry and make comparisons between the table of the elements. The activity
should take about forty-five minutes.
Activity – Day Six
How long does it take for an atom to decay? Scientists are not really sure about
this. But, when we talk about how long it takes for half of a radioactive sample to decay,
the answer is one half-life. How is the half-life determined? The answer is through
measurements. Half life is not a statistical value, nor is it an absolute value.
Furthermore, half-lives are appropriate when determining the age of a substance.
In this activity the students will do a lab entitled “Half Life Simulation with
Pennies.” The lab was obtained from the SIM Program at Westminster College5. The
lab simulates radioactive decay and determines the half-life. The only materials needed
are two-hundred and fifty pennies and a jar or can. The lab is provided in the Appendix.
This lab can also be simulated with M&M’s.
Activity – Day Seven
In this lab, the students will use a radioactive source to find the half-life. This is
an extension of the previous lab. This laboratory is a little cookbook, but the topic itself
is more complex. The previous inquiry activities have led into this one. The lab requires
the use of the Texas Instruments Calculus Bases Laboratory apparatus and a Geiger
Counter. A list of these supplies is in the Appendix. The directions are descriptive, but
it allows the students some freedom to make choices regarding the method. In addition,
the prelab questions and the postlab questions require a higher level of thought to answer
15
them. The lab and the teacher guide are in the Appendix. The laboratory was obtained
from the Westminster College Science In Motion program5
Activity – Day Seven
This is the last lab of the portfolio. It basically requires students to create a model
of the three types of radiation, to test it experimentally, and to analyze the resulting data
and compare it to the model. This is the culminating laboratory, not activity because it
requires the students to apply everything that they have learned in the class. This is a
pure form of inquiry. The lab and the teacher guide are in the Appendix. The laboratory
was obtained from the Westminster College Science in Motion program5.
Activity – Day Eight and Nine
This is the culminating activity of the portfolio. It is a nuclear chemistry
Webquest. The author adapted it from several sources7. The activity directions are as
follows:
“You are Science reporters for the Ursuline High School paper. In the current world there is danger of nuclear attack not from the old Soviet Union but from terrorists or
North Korea. You must try to explain, to your peers and your family, what this means. It is your job to describe what nuclear chemistry is, including weapons used, and the effects of radiation, given off by these weapons, on the environment and its people. Also include any good effects that radiation may have. You can include the ideas of food irradiation,
nuclear power, and nuclear medicine. Other appropriate topics can be included. You will have to create a Newsletter on the topic of Nuclear Chemistry.
1. Scientifically define and describe the topic.
2. Gather evidence for the topic using sources from class, books, or the internet 3. Include and explain the effects of Nuclear Chemistry
Before you create your newsletter, you must research your topic. Follow the links below and answer questions on a separate piece of paper. All answers are to be handed in.”
16
The webquest is in the Appendix and is available on disk. The students will be graded
based upon their defense of their viewpoint and the use of scientific knowledge to do that.
The rubric6 is included in the Appendix of this paper. The webquest is an independent
study project that exemplifies the National Education Science Standards14.
Assessment
The students will be assessed by the teacher as the unit progresses. The emphasis
will be placed upon the students explaining their answers, not the answers themselves.
The final assessment is to be done individually. It is adapted from Barouch’s book3 and
provides a conceptual framework to analyze the students’ learning. The portfolio
presents each activity as inquiry activity, and this is the way the unit will be assess.
Formative assessment will, of course, take place as the lesson progresses. The final,
summative assessment on day ten will ensure that the students have learned the material,
not just memorized it.
Conclusion
This portfolio has attempted to exemplify the five E’s. The first topic was meant
to engage or hook the students’ interest. The activity shocks the students into realizing
radiation does affect their lives. The students then explore the concepts through the
interactive WebPages and “Radioactive Cookies” activity. The students then try to
explain the various behaviors by using labs and the chart of the nuclides. Then they
extend these ideas and apply them in the culminating activity, the Nuclear Chemistry.
And, finally the students are assessed through a conceptual method.

17
In regards to the changing emphases of the NSES, this portfolio continually
creates opportunities that challenge students and promotes inquiry by asking questions.
The portfolio reaches across the boundary of each specific science discipline and allows
the student to learn science. The portfolio incorporates various aspects of each science,
including applications to biology, chemistry, physics, and earth science. It encourages
students to learn by inquiry.
18
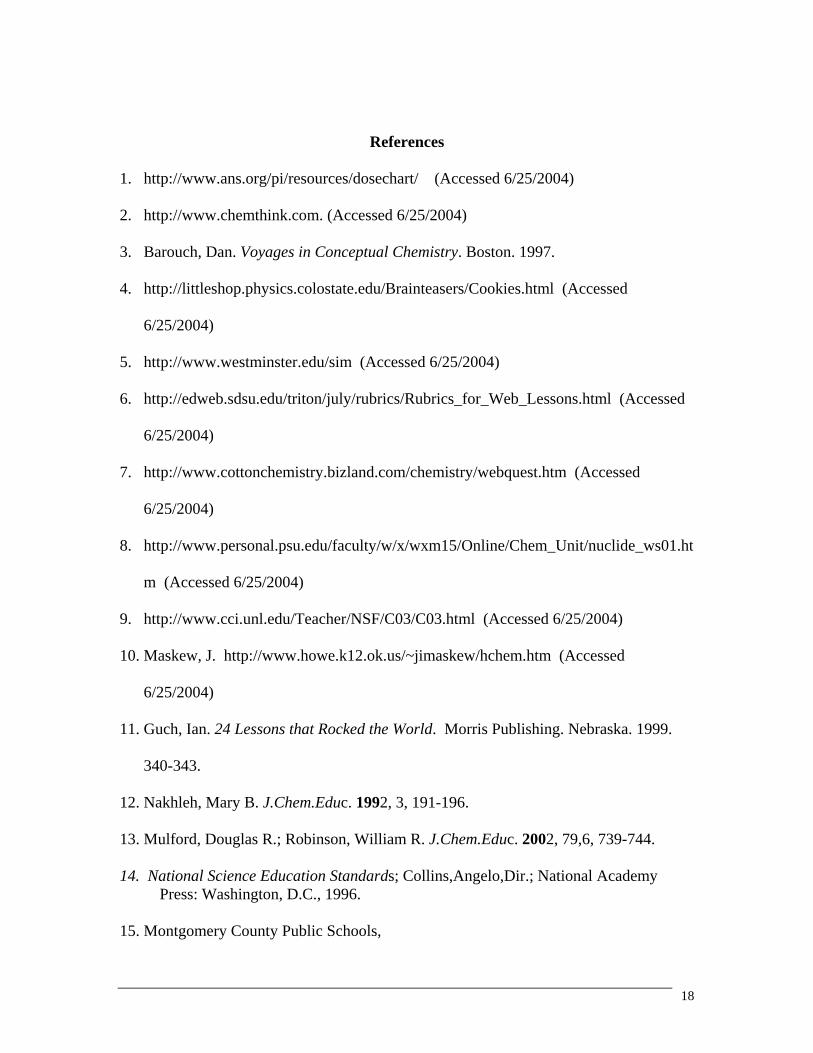
References
1. http://www.ans.org/pi/resources/dosechart/ (Accessed 6/25/2004)
2. http://www.chemthink.com. (Accessed 6/25/2004)
3. Barouch, Dan. Voyages in Conceptual Chemistry. Boston. 1997.
4. http://littleshop.physics.colostate.edu/Brainteasers/Cookies.html (Accessed
6/25/2004)
5. http://www.westminster.edu/sim (Accessed 6/25/2004)
6. http://edweb.sdsu.edu/triton/july/rubrics/Rubrics_for_Web_Lessons.html (Accessed
6/25/2004)
7. http://www.cottonchemistry.bizland.com/chemistry/webquest.htm (Accessed
6/25/2004)
8. http://www.personal.psu.edu/faculty/w/x/wxm15/Online/Chem_Unit/nuclide_ws01.ht
m (Accessed 6/25/2004)
9. http://www.cci.unl.edu/Teacher/NSF/C03/C03.html (Accessed 6/25/2004)
10. Maskew, J. http://www.howe.k12.ok.us/~jimaskew/hchem.htm (Accessed
6/25/2004)
11. Guch, Ian. 24 Lessons that Rocked the World. Morris Publishing. Nebraska. 1999.
340-343.
12. Nakhleh, Mary B. J.Chem.Educ. 1992, 3, 191-196.
13. Mulford, Douglas R.; Robinson, William R. J.Chem.Educ. 2002, 79,6, 739-744.
14. National Science Education Standards; Collins,Angelo,Dir.; National Academy Press: Washington, D.C., 1996.
15. Montgomery County Public Schools,
19
http://www.mcps.k12.md.us/curriculum/science/instr/teaching5Es.htm. (accessed June 29, 2004).
16. Tinnesand, Michael J. In Chemistry in the National Science Education Standards; American Chemical Society: Washington, D.C., 1996; p 15.
17. Myers, R. Thomas; Oldham, Keith B.; Tocci, Salvatore. Chemistry. Austin, TX,
Holt, Rinehart and Winston.2004
18. Smoot, Richard C.; Smith, Richard G..; Price, Jack. Chemistry. New York.
McGraw Hill. 1998.
19. http://www.lbl.gov/abc/experiments/Experiment9.html (Accessed 6/25/2004)
20. The Ohio Academic Content Standards. State of Ohio
http://www.ode.state.oh.us/academic_content_standards/ (Accessed 6/25/2004)

20
Appendix 1
Supplies needed for the experiments (Page 23)
Review of Isotopes Worksheet (Page 24)
Radioactive Cookies (Page 25-26)
The Chart of the Nuclides (Page 27-30)
Half Life Simulation with Pennies (Page 31-35)
Lifetime Measurement – Half-Life Determination (Page 36-47)
Nuclear Radiation (Page 48-52)
Voyages in conceptual chemistry individual project (Part One and Two)
(Assessment) (Page 53-54)
Rubric – Nuclear Chemistry Webquest (Page 55)
Demonstrations
Chain Reaction (Page 56)
Cloud Chamber (Page 57)

21
Appendix 2
Estimate Your Personal Radiation Dose (Discrepant Event)(PDF File – Included as
hard copy)
Webpage-Day One (Introduction)(HTML File – Included as hard copy)
Webpage – Day Two (Nuclear Reactions Inquiry) (HTML File – Included as hard
copy)
Culminating Activity: Nuclear Chemistry Webquest(HTML File – Included as hard
copy)
Help Sheet for day three activities (HTML File – Included as hard copy)
Farside – Nuclear Meltdown (HTML File – Included as hard copy)

22
Appendix One
23
Supplies Needed for Nuclear Chemistry Portfolio
♦ The Chart of Nuclides(www.chartofthenuclides.com) ♦ Cesium/Barium Isogenerator(www.pasco.com) ♦ CBL(Supplied by myself) with program ♦ TI Graphing Calculator ♦ Vernier Radiation Monitor(www.vernier.com) ♦ LabPro (www.vernier.com) ♦ Strontium-90 beta source(www.pasco.com) ♦ Co-60 0.1 mC gamma source(www.pasco.com) ♦ Ten 10 cm X 10 cm identical cardboard squares ♦ Other metal squares same dimensions as above(lead and
aluminum) (www.pasco.com) ♦ Masking tape ♦ Pennies (About 250) ♦ Plastic Sandwich bags ♦ M & M’s ♦ Graph paper ♦ Poster board ♦ Dominoes ♦ Twenty books of matches ♦ Geiger Meter(www.ans.org)

24
Nuclide Activity
Directions: Finish the table and answer the questions in your cooperative learning group.
Isotope Symbol Number
of Protons
Number of
Neutrons
Number of Electrons
Mass Number
Carbon-14
Lithium-7
Tin-119
Radon-222
Cerium-60
Thorium-232
Seoborgium-
106
Americium-97
Uranium-235
1. Compare the number of protons and neutrons in each isotope?
2. Which isotopes have a large number of neutrons? 3. How do you think this relates to radioactivity?
25
Radioactive Cookies Protecting yourself from different types of radiation
You are handed four cookies. Each one of the cookies emits radiation. As a Health Physicist, you must decide what to do with each one of the four cookies. The decisions that you make must minimize the danger of radioactive exposure to yourself. Here are the restrictions on what you can do with the cookies. 1.) You must eat one of the cookies. 2.) You must dispose of one of the cookies at a state-of-the-art radioactive waste storage facility called WIPP (you can do this for free since no one else is ever going to use WIPP). Choosing this option removes the danger of this cookie entirely. 3.) You must put one of the cookies in your pocket. 4.) You must hold one of the cookies in your hand. A radiation survey is done on the cookies and you find out that: -Cookie 1 is an alpha emitter. -Cookie 2 is a beta emitter. -Cookie 3 is a weak gamma emitter. -Cookie 4 is a strong gamma emitter. Make your decisions on what to do with the cookies!

26
Teacher Guide-Radioactive Cookies The key to correctly deciding what to do with each cookie is to know something about the penetrating abilities of the four types of radiation. Alpha particles are the nucleus of a helium atom. They are big and heavy containing two protons and two neutrons each. Their penetrating ability however is very small. They can only penetrate about 0.0066 cm of tissue. The second big hint for alpha particles is for you to find out on your own how thick the dead skin layer around your body is. Beta particles are electrons. Electrons are very light, for instance they are about 8000 times lighter than an alpha particle. Even very high energy beta particles can only penetrate between 0.5 cm and 1 cm of material. Gamma rays are high energy photons emitted from the nucleus of an atom. They have energies in the MeV range (that stands for millions of electron volts). Gamma rays do not have a charge, and this helps them to penetrate matter extremely well. The gamma rays from this cookie could probably be detected outside the room that it is placed in. While gamma rays are high energy with high penetrating ability, they have no mass. Neutron radiation is nasty stuff. A neutron is a heavy particle, weighing in at 1/4 the mass of the alpha particle. The unique thing about the neutron is that while it is heavy, it has no charge (it is neutral). This lack of charge gives it the ability to penetrate matter without interacting as quickly as the beta particles or alpha particles. Then after penetrating the material, when the neutron does interact it behaves like a bowling ball thrown into a room full of Ping-Pong balls.

27
Nuclide Worksheet
Name(s) _____________________________________ Date __________________________ Period______________ Objectives Learn about nuclides (isotopes) Identify symbols for various radiation Differentiate between stable and unstable nuclides Locate facts on a nuclide table Skills
Chart Reading Directions
Refer to a Chart of the Nuclides and answer the following questions: 1. What is the Z number? _______________________________________________________ 2. What is the N number? _______________________________________________________ 3. What is the A number? _______________________________________________________ 4. Find the Z number for oxygen on the chart. Now find the N number 8. Place a finger on each number. Move the finger on the Z number to the right and the finger on the N number upward until they meet. What is the A number for this nuclide?_______ 5. How many nuclides (isotopes) are there for oxygen? _______ 6. There are over 1300 nuclides on the chart. How many elements are listed? _______ 7. What element has the most nuclides (isotopes) and how many are there? _______ 8. Can an element have more than one A number? _______ 9. Can an element have more than one N number? _______ 10. Can an element have more than one Z number? _______ 11. - 13 Some nuclides are unstable. That is to say they spontaneously break down into other isotopes. These nuclides are radioisotopes.
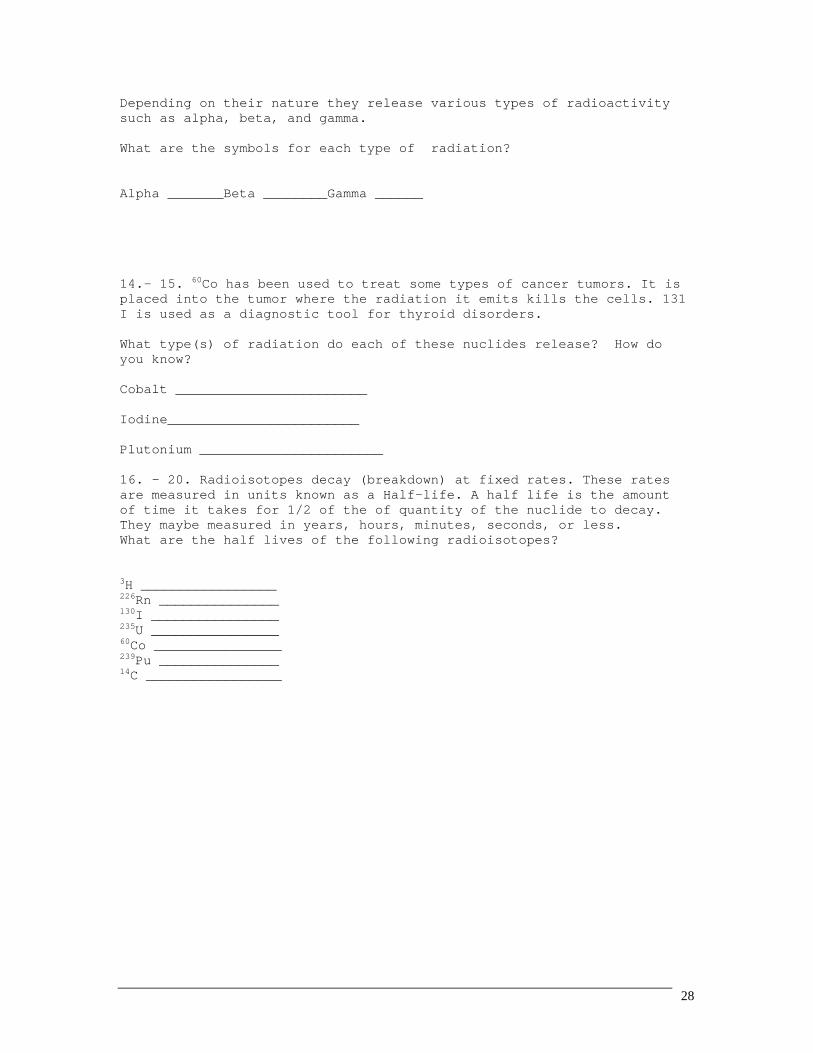
28
Depending on their nature they release various types of radioactivity such as alpha, beta, and gamma. What are the symbols for each type of radiation? Alpha _______Beta ________Gamma ______ 14.- 15. 60Co has been used to treat some types of cancer tumors. It is placed into the tumor where the radiation it emits kills the cells. 131 I is used as a diagnostic tool for thyroid disorders. What type(s) of radiation do each of these nuclides release? How do you know? Cobalt ________________________ Iodine________________________ Plutonium _______________________ 16. - 20. Radioisotopes decay (breakdown) at fixed rates. These rates are measured in units known as a Half-life. A half life is the amount of time it takes for 1/2 of the of quantity of the nuclide to decay. They maybe measured in years, hours, minutes, seconds, or less. What are the half lives of the following radioisotopes? 3H _________________ 226Rn _______________ 130I ________________ 235U ________________ 60Co ________________ 239Pu _______________ 14C _________________
29
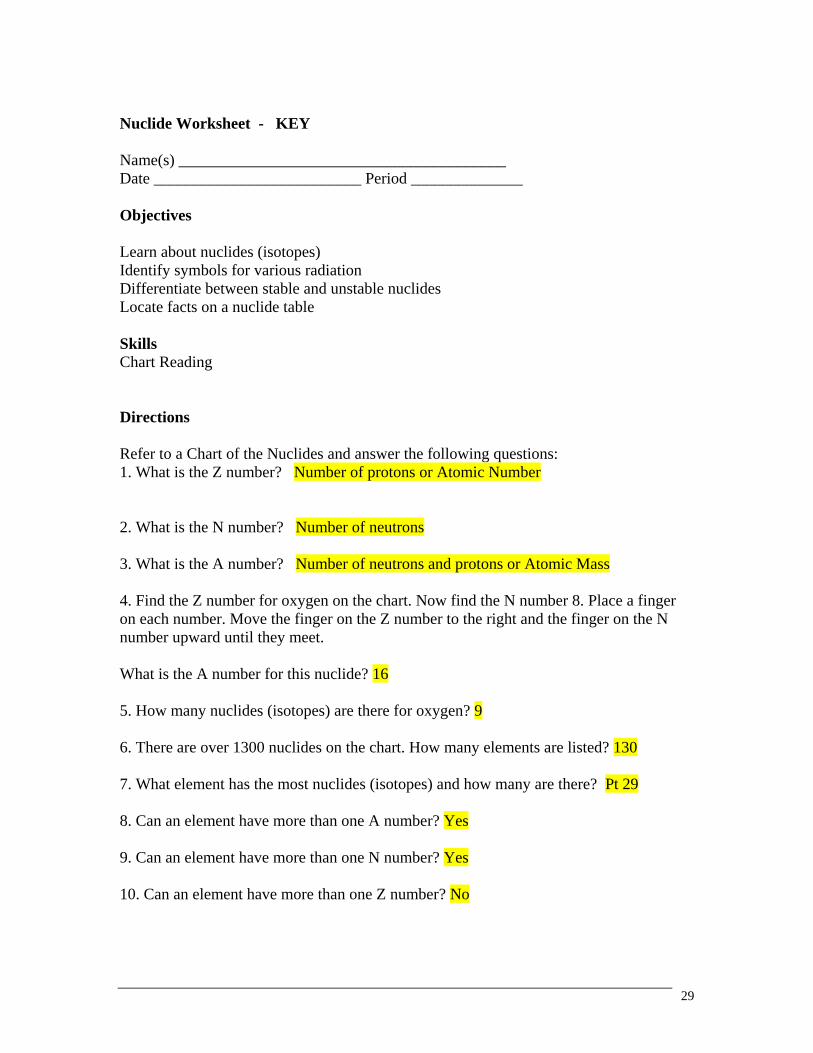
Nuclide Worksheet - KEY
Name(s) _________________________________________ Date __________________________ Period ______________ Objectives
Learn about nuclides (isotopes) Identify symbols for various radiation Differentiate between stable and unstable nuclides Locate facts on a nuclide table Skills Chart Reading Directions
Refer to a Chart of the Nuclides and answer the following questions: 1. What is the Z number? Number of protons or Atomic Number 2. What is the N number? Number of neutrons 3. What is the A number? Number of neutrons and protons or Atomic Mass 4. Find the Z number for oxygen on the chart. Now find the N number 8. Place a finger on each number. Move the finger on the Z number to the right and the finger on the N number upward until they meet. What is the A number for this nuclide? 16 5. How many nuclides (isotopes) are there for oxygen? 9 6. There are over 1300 nuclides on the chart. How many elements are listed? 130 7. What element has the most nuclides (isotopes) and how many are there? Pt 29 8. Can an element have more than one A number? Yes 9. Can an element have more than one N number? Yes 10. Can an element have more than one Z number? No

30
11.- 13 Some nuclides are unstable. That is to say they spontaneously break down into other isotopes. These nuclides are radioisotopes. Depending on their nature they release various types of radioactivity such as alpha, beta, and gamma. What are the symbols for these radiation? Alpha _______ Beta ________ Gamma ______ 14.- 15. 60Co has been used to treat some types of cancer tumors. It is placed into the tumor where the radiation it emits kills the cells. 131 I is used as a diagnostic tool for thyroid disorders. What type(s) of radiation do each of these nuclides release? Cobalt ________________________ Iodine________________________ Plutonium ____________ 16. - 20. Radioisotopes decay (breakdown) at fixed rates. These rates are measured in units known as a Half-life. A half life is the amount of time it takes for 1/2 of the of quantity of the nuclide to decay. They maybe measured in years, hours, minutes, seconds, or less. What are the half lives of the following radioisotopes? ............................................. 3H ____12.26 years 222Rn ____3.823 days 130 I ____9.2 months 235U ___26.2 months 60Co ____10.5 months / 5.24 years 239 Pu ___24,360 years 14C ___5730 years
31
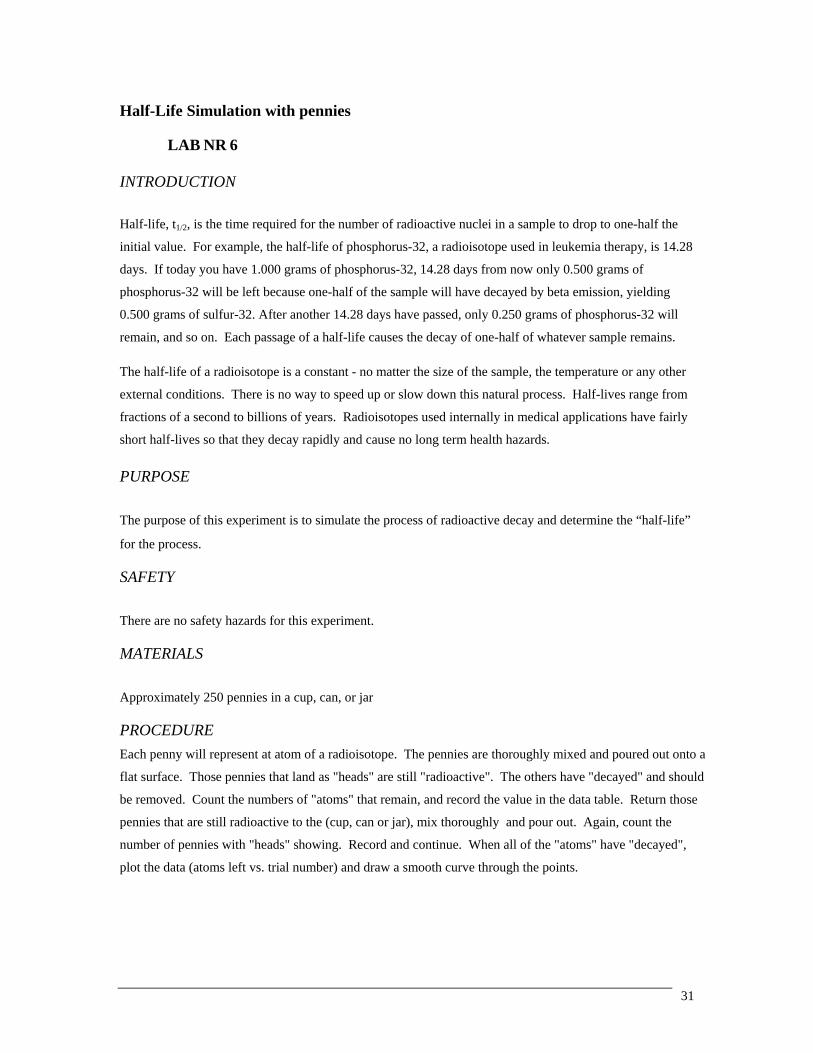
Half-Life Simulation with pennies
LAB NR 6
INTRODUCTION
Half-life, t1/2, is the time required for the number of radioactive nuclei in a sample to drop to one-half the
initial value. For example, the half-life of phosphorus-32, a radioisotope used in leukemia therapy, is 14.28
days. If today you have 1.000 grams of phosphorus-32, 14.28 days from now only 0.500 grams of
phosphorus-32 will be left because one-half of the sample will have decayed by beta emission, yielding
0.500 grams of sulfur-32. After another 14.28 days have passed, only 0.250 grams of phosphorus-32 will
remain, and so on. Each passage of a half-life causes the decay of one-half of whatever sample remains.
The half-life of a radioisotope is a constant - no matter the size of the sample, the temperature or any other
external conditions. There is no way to speed up or slow down this natural process. Half-lives range from
fractions of a second to billions of years. Radioisotopes used internally in medical applications have fairly
short half-lives so that they decay rapidly and cause no long term health hazards.
PURPOSE
The purpose of this experiment is to simulate the process of radioactive decay and determine the “half-life”
for the process.
SAFETY
There are no safety hazards for this experiment.
MATERIALS
Approximately 250 pennies in a cup, can, or jar
PROCEDURE Each penny will represent at atom of a radioisotope. The pennies are thoroughly mixed and poured out onto a
flat surface. Those pennies that land as "heads" are still "radioactive". The others have "decayed" and should
be removed. Count the numbers of "atoms" that remain, and record the value in the data table. Return those
pennies that are still radioactive to the (cup, can or jar), mix thoroughly and pour out. Again, count the
number of pennies with "heads" showing. Record and continue. When all of the "atoms" have "decayed",
plot the data (atoms left vs. trial number) and draw a smooth curve through the points.
32
DATA SHEET Name ________________________ Name ________________________
Period _______ Class ___________
Date ___________
HALF-LIFE SIMULATION WITH PENNIES
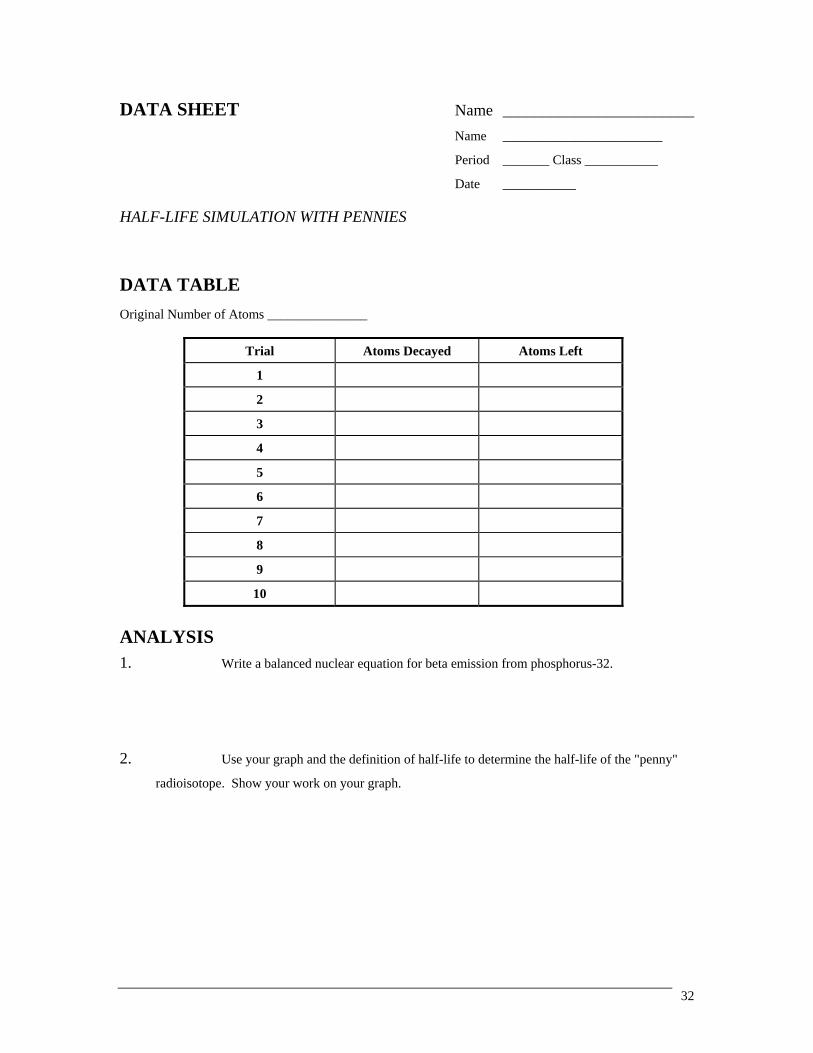
DATA TABLE Original Number of Atoms _______________
Trial Atoms Decayed Atoms Left
1
2
3
4
5
6
7
8
9
10
ANALYSIS 1. Write a balanced nuclear equation for beta emission from phosphorus-32.
2. Use your graph and the definition of half-life to determine the half-life of the "penny"
radioisotope. Show your work on your graph.

33
3. The decay constant, k, for a radioisotope is related to its half-life: k = 0.693 / t1/2 Use this relationship to determine the decay constant for the pennies. 4. The equation in question 2 can be obtained from the integrated rate law
ln (N/N0) = -kt where N0 is the number of radioactive nuclei originally present in the sample and N is the number
remaining at time t. Show how this is done. 5. How long (many turns) would it take to comlete this simulation - until 1 penny remains - if you had
started with $100 worth of pennies? Show your work.
CONCLUSION (2-3 sentences)
Include in your discuss why a you think a radioactive sample does not decay all at once.
34
TEACHER NOTES
LAB NR 6
RELATED TOPICS Atomic structure Radioactive decay Exponential functions and graphs
STANDARDS ADDRESSED
Science and Technology3.1.10, 3.1.12
3.2.10,3.2.12 3.4.10, 3.4.12
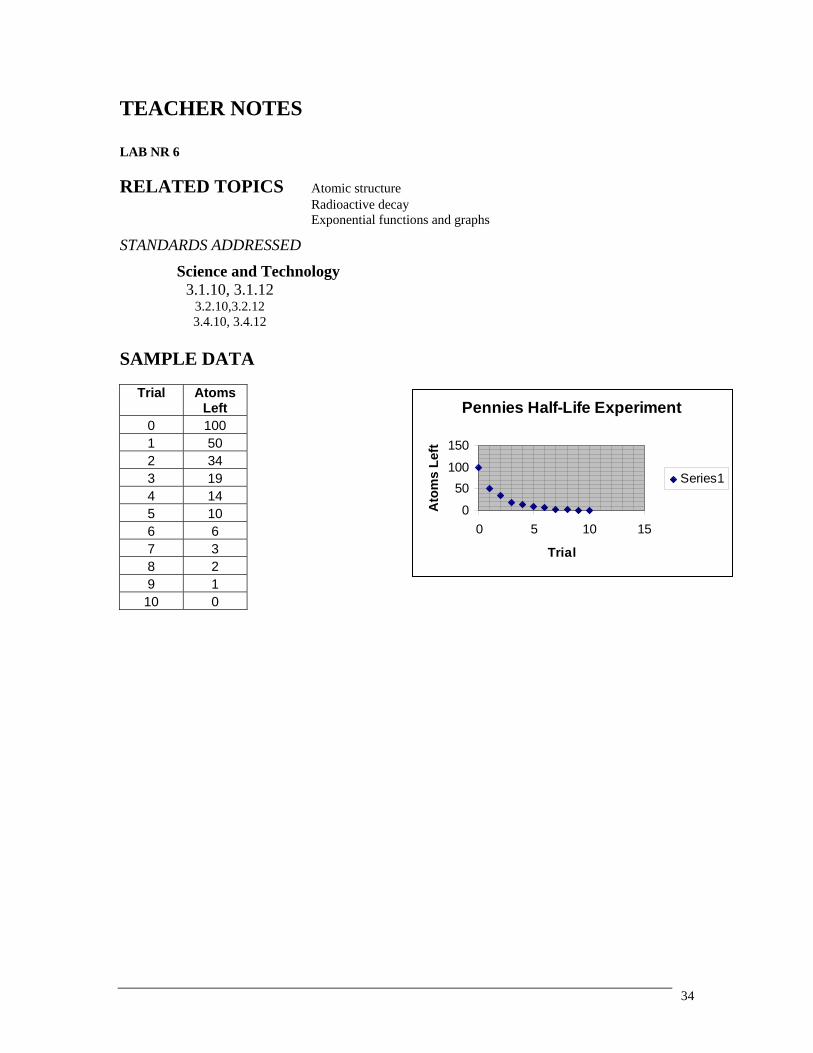
SAMPLE DATA
Trial
Atoms Left
0 100 1 50 2 34 3 19 4 14 5 10 6 6 7 3 8 2 9 1 10 0
Pennies Half-Life Experiment
0
50100
150
0 5 10 15
Trial
Ato
ms
Left
Series1
35
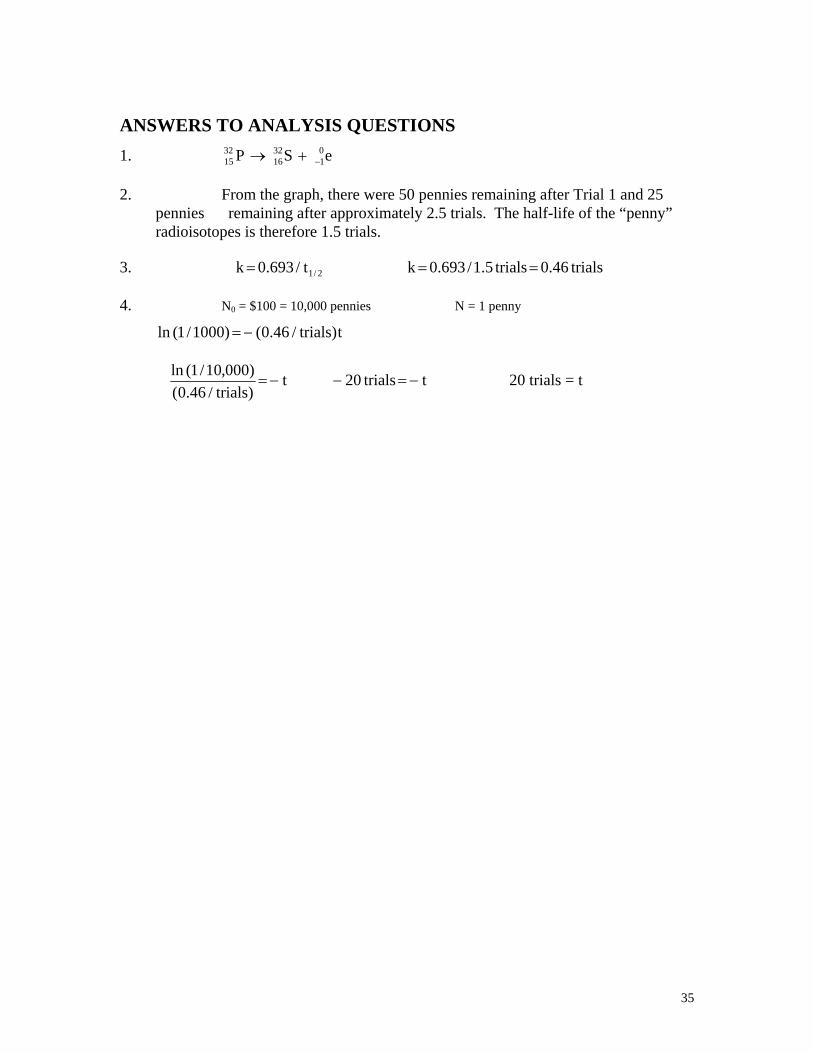
ANSWERS TO ANALYSIS QUESTIONS 1. eSP 0
13216
3215 −+→
2. From the graph, there were 50 pennies remaining after Trial 1 and 25 pennies remaining after approximately 2.5 trials. The half-life of the “penny” radioisotopes is therefore 1.5 trials.
3. 2/1t/693.0k = trials46.0trials5.1/693.0k == 4. N0 = $100 = 10,000 pennies N = 1 penny
t)trials/46.0()1000/1(ln −=
ttrials20t)trials/46.0()000,10/1(ln
−=−−= 20 trials = t

36
LIFETIME MEASUREMENT- Measurement of Half-Life
LAB NR 9.CALC From Nuclear Radiation with Computers and Calculators, Vernier Software & Technology, 2001.
INTRODUCTION The activity (in decays per second) of some radioactive samples varies in time in a particularly simple way. If the activity (R) in decays per second of a sample is proportional to the amount of radioactive material (R ∝ N, where N is the number of radioactive nuclei), then the activity must decrease in time exponentially:
R t R e t( ) = −0
λ
In this equation λ is the decay constant, commonly measured in s–1 or min–1. R0 is the activity at t = 0. The SI unit of activity is the becquerel (Bq), defined as one decay per second.
You will use a source called an isogenerator to produce a sample of radioactive barium. The isogenerator contains cesium-137, which decays to barium-137. The newly made barium nucleus is initially in a long-lived excited state, which eventually decays by emitting a gamma photon. The barium nucleus is then stable, and does not emit further radiation. Using a chemical separation process, the isogenerator allows you to remove a sample of barium from the cesium-barium mixture. Some of the barium you remove will still be in the excited state and will subsequently decay. It is the activity and lifetime of the excited barium you will measure.
While the decay constant λ is a measure of how rapidly a sample of radioactive nuclei will decay, the half-life of a radioactive species is also used to indicate the rate at which a sample will decay. A half-life is the time it takes for half of a sample to decay. That is equivalent to the time it takes for the activity to drop by one-half. Note that the half-life (often written as t1/2) is not the same as the decay constant λ, but they can be determined from one another.
Follow all local procedures for handling radioactive materials. Follow any special use instructions included with your isogenerator.
PURPOSE The purpose of this experiment is to use a radiation counter to measure the decay constant and half-life of barium-137.
EQUIPMENT/MATERIALS
37
TI-83 Graphing Calculator Cesium/Barium-137 Isogenerator CBL System cut-off paper cup for Barium solution RADIATIN Vernier Radiation Monitor
SAFETY • Always wear an apron and goggles in the lab.
• Follow all local procedures for handling radioactive materials. Follow any special use instructions included with your isogenerator.
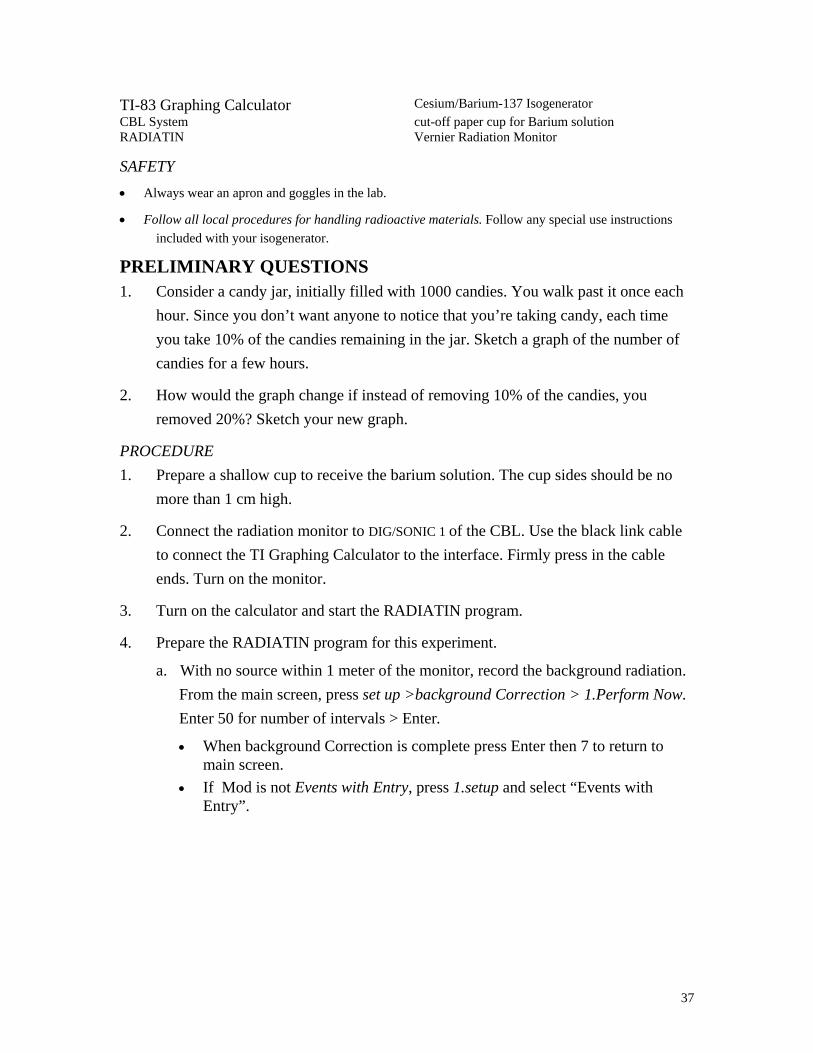
PRELIMINARY QUESTIONS 1. Consider a candy jar, initially filled with 1000 candies. You walk past it once each
hour. Since you don’t want anyone to notice that you’re taking candy, each time you take 10% of the candies remaining in the jar. Sketch a graph of the number of candies for a few hours.
2. How would the graph change if instead of removing 10% of the candies, you removed 20%? Sketch your new graph.
PROCEDURE 1. Prepare a shallow cup to receive the barium solution. The cup sides should be no
more than 1 cm high.
2. Connect the radiation monitor to DIG/SONIC 1 of the CBL. Use the black link cable to connect the TI Graphing Calculator to the interface. Firmly press in the cable ends. Turn on the monitor.
3. Turn on the calculator and start the RADIATIN program.
4. Prepare the RADIATIN program for this experiment.
a. With no source within 1 meter of the monitor, record the background radiation. From the main screen, press set up >background Correction > 1.Perform Now. Enter 50 for number of intervals > Enter.
• When background Correction is complete press Enter then 7 to return to main screen.
• If Mod is not Events with Entry, press 1.setup and select “Events with Entry”.

38
b. Select TIME GRAPH from the SETUP MENU. c. Select CHANGE TIME SETTINGS from the TIME GRAPH SETTINGS screen. d. Enter “15” as the count time interval in seconds. Always complete number
entries with ENTER . e. Enter “60” as the number of samples. This setting will give you a 60*15=900
second (15 minute) data collection time. f. Select OK from the TIME GRAPH SETTINGS screen.
5. Prepare your isogenerator for use as directed by the manufacturer. Extract the barium solution into the prepared cup. Work quickly between the time of solution extraction and the start of data collection in step 6, for the barium begins to decay immediately.
6. Place the radiation monitor on top of or adjacent to the cup so that the rate of flashing of the red LED is maximized. Take care not to spill the solution.
7. Select START from the main screen to begin collecting data. The calculator will begin counting the number of gamma photons that strike the detector during each 15-second count interval. Data collection will continue for 15 minutes. Do not move the detector or the barium cup during data collection.
8. As data collection continues a graph will be updated. When collection is complete, a final graph of count rate vs. time will appear. Set the radiation monitor aside, and dispose of the barium solution and cup as directed by your instructor.
39
DATA SHEET Name ________________________ Name ________________________
Period _______ Class ___________
Date ___________
LIFETIME MEASUREMENT
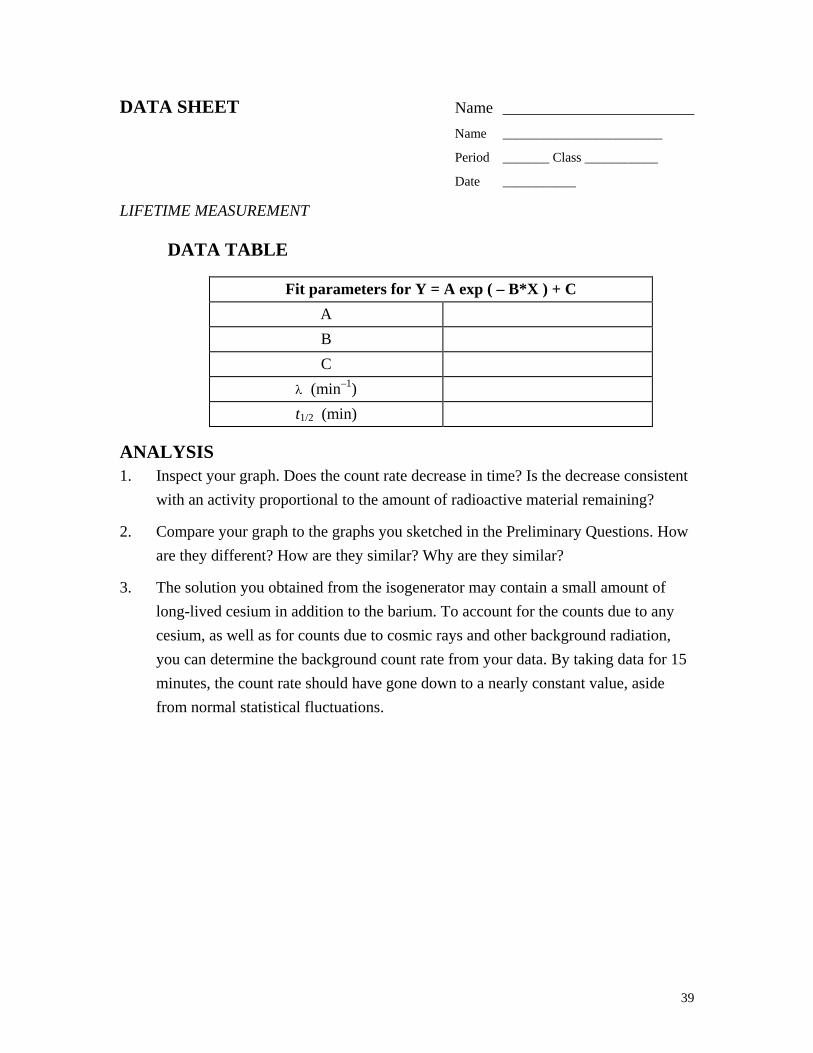
DATA TABLE
Fit parameters for Y = A exp ( – B*X ) + C A
B
C
λ (min–1)
t1/2 (min)
ANALYSIS 1. Inspect your graph. Does the count rate decrease in time? Is the decrease consistent
with an activity proportional to the amount of radioactive material remaining?
2. Compare your graph to the graphs you sketched in the Preliminary Questions. How are they different? How are they similar? Why are they similar?
3. The solution you obtained from the isogenerator may contain a small amount of long-lived cesium in addition to the barium. To account for the counts due to any cesium, as well as for counts due to cosmic rays and other background radiation, you can determine the background count rate from your data. By taking data for 15 minutes, the count rate should have gone down to a nearly constant value, aside from normal statistical fluctuations.

40
4. Now you can fit an exponential function to your data. a. Select ANALYZE from the main screen. b. Select SELECT REGION from the ANALYZE OPTIONS screen. c. Leave the left bound cursor at the extreme left side of the graph. Press ENTER to
mark this bound of the selection. d. Use the key to move the cursor to the 15-minute point (900 seconds). e. Press ENTER to mark this position as the right bound of your selection. The
calculator will display a graph showing only the first fifteen minutes of data. Press ENTER again to return to the ANALYZE OPTIONS screen.
f. Select EXPONENT CURVE FIT from the CURVE FITS screen. g. Record the fit parameters A and B in your data table. h. Press ENTER to see your graph with the fitted line.
5. Print or sketch your graph.
6. Press ENTER , select RETURN TO MAIN SCREEN, and then choose QUIT to leave the DataRad program.
7. From the definition of half-life, determine the relationship between half-life (t1/2, measured in minutes) and decay constant (λ, measured in min-1). Hint: After a time of one half-life has elapsed, the activity of a sample is one-half of the original activity.
8. From the fit parameters, determine the decay constant λ and then the half-life t1/2.
9. Is your value of t1/2 consistent with the accepted value for the half-life of barium-137? (Ask your teacher for this value.)
10. What fraction of the initial activity of your barium sample would remain after 25 minutes? Was it a good assumption that the counts in the right side of the graph would be due entirely to non-barium sources?

41
EXTENSIONS 1. How would a graph of the log of the count rate vs. time appear? Using your
calculator, Graphical Analysis, or a spreadsheet, make such a graph. Interpret the slope of the line if the data follow a line. Will correcting for the background count rate affect your graph?
2. Repeat your experiment several times to estimate an uncertainty to your decay constant measurement.
3. How long would you have to wait until the activity of your barium sample is the same as the average background radiation? You will need to measure the background count rate carefully to answer this question.
42
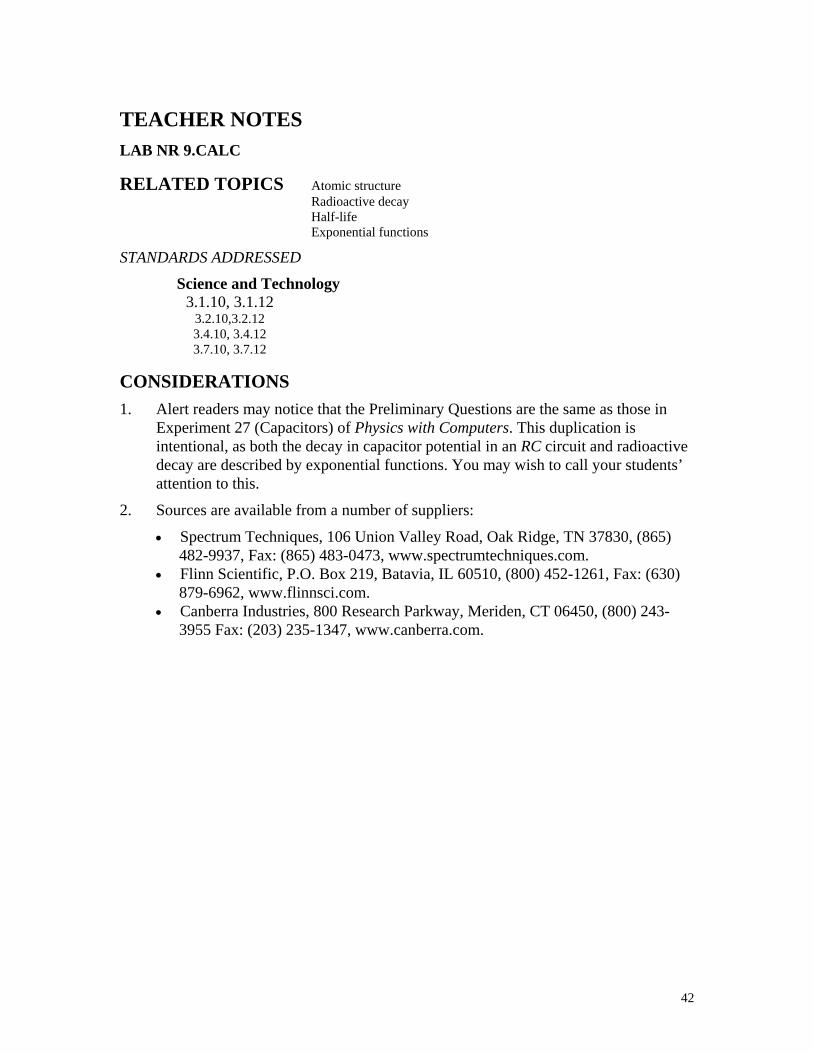
TEACHER NOTES LAB NR 9.CALC
RELATED TOPICS Atomic structure Radioactive decay Half-life Exponential functions
STANDARDS ADDRESSED
Science and Technology3.1.10, 3.1.12
3.2.10,3.2.12 3.4.10, 3.4.12 3.7.10, 3.7.12
CONSIDERATIONS 1. Alert readers may notice that the Preliminary Questions are the same as those in
Experiment 27 (Capacitors) of Physics with Computers. This duplication is intentional, as both the decay in capacitor potential in an RC circuit and radioactive decay are described by exponential functions. You may wish to call your students’ attention to this.
2. Sources are available from a number of suppliers:
• Spectrum Techniques, 106 Union Valley Road, Oak Ridge, TN 37830, (865) 482-9937, Fax: (865) 483-0473, www.spectrumtechniques.com.
• Flinn Scientific, P.O. Box 219, Batavia, IL 60510, (800) 452-1261, Fax: (630) 879-6962, www.flinnsci.com.
• Canberra Industries, 800 Research Parkway, Meriden, CT 06450, (800) 243-3955 Fax: (203) 235-1347, www.canberra.com.

43
3. Students often confuse the decay constant parameter λ with the half-life t1/2. The decay constant λ is larger for more rapidly decaying elements and has dimensions of time–1, while the half-life has dimensions of time, and is smaller for more rapidly decaying elements. The decay constant λ is equal to the fit parameter C in the Natural Exponential fit of Logger Pro. The two parameters can be related in the following manner. After one half-life has elapsed, half of the radioactive nuclei have decayed, and so the activity is also cut in half. From the rate equation, we can relate the decay constant to the half-life.
λ
λ
λ
λ
λ
2ln2ln
sides,both of log theTaking . 21
21
that know weat ;
2/1
2/1
00
021
2/10
2/1
2/1
=
−=−
=
=
===
−
−
−
t
t
e
eRR
RRtteRR
t
t
t
here is sufficient information in the student guide to perform this conversion, although some students with weak algebra skills may have difficulty with it. You may choose to work through this step with your students.
4. The cesium-137 in the isogenerator decays to a metastable state of barium. The metastable barium decays with a half-life of 2.552 minutes by gamma emission, making this system an ideal one for studying in the classroom. A 15-minute experimental run covers almost six half-lives.
5. The lifetime obtained depends strongly on the correct subtraction of background (in this case, non-barium) counts. As written, the activity instructions call for a 30-minute data collection period. If time permits, use a 45- or 60-minute period, and measure the count rate for the final 10 or 15 minutes. A longer experiment will ensure that essentially all the barium will have decayed. The sample data shown here yield a lifetime of 2.50 minutes, but if the background value obtained during the last 10 minutes of a 60-minute run is used, the lifetime changes to 2.57 minutes.
6. Many isogenerators allow some cesium to leak through into the barium extract solution. The cesium results in a nearly constant background activity. This background count is often much larger than the environmental background, and the analysis must take account for it. Although the experiment is written to run for 15 minutes, if you have an isogenerator that leaks significant amounts of cesium, you may want to lengthen the experiment to thirty minutes.
7. Note that the calculator and computer versions of the activity use different notation for the fitted equation. Unlike Logger Pro, the calculator program DataRad uses seconds as the x-axis time unit, so that the exponential fit parameter must be converted from s-1 to min-1 (s-1
= 60 min-1) to obtain a lifetime in min-1.

44
PREPARATIONS 1. Detailed directions for preparing the isogenerator are not given because the method
varies with manufacturer. You may want to insert the instructions appropriate to your isogenerator at step two of the Procedure.
SAMPLE RESULTS
Raw data from calculator and background subtraction step.
Exponential fit to the first 15 minutes of data after background subtraction.
45
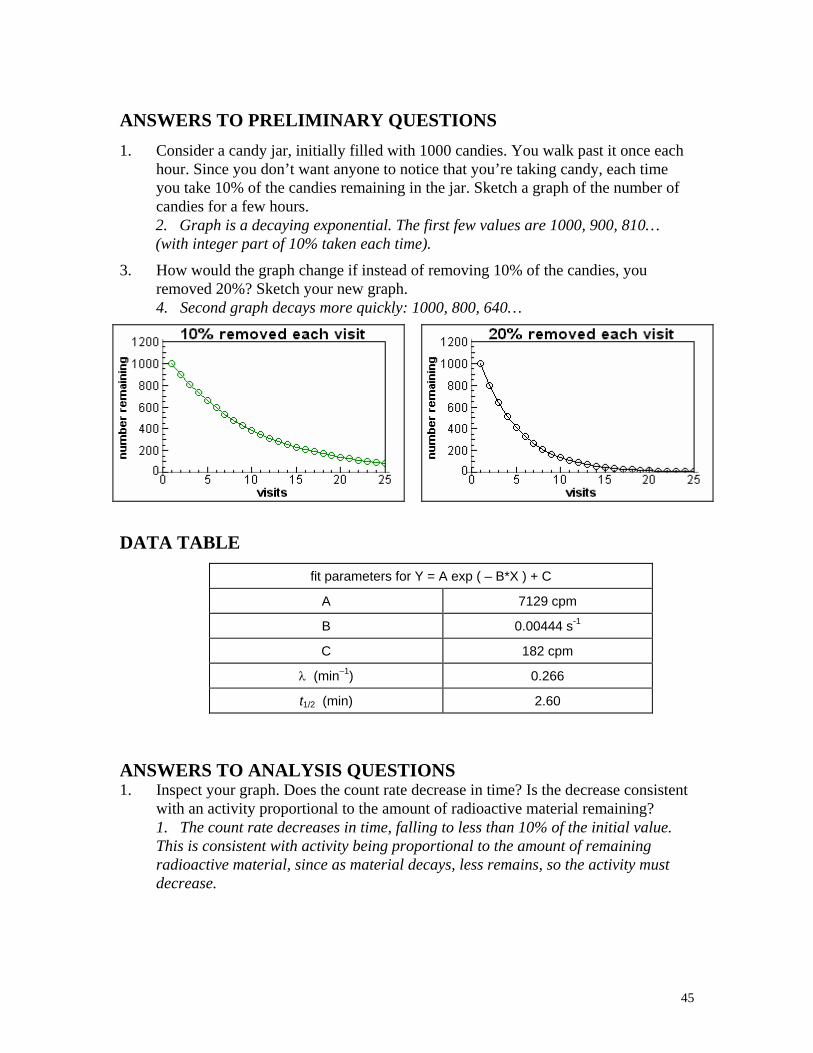
ANSWERS TO PRELIMINARY QUESTIONS 1. Consider a candy jar, initially filled with 1000 candies. You walk past it once each
hour. Since you don’t want anyone to notice that you’re taking candy, each time you take 10% of the candies remaining in the jar. Sketch a graph of the number of candies for a few hours. 2. Graph is a decaying exponential. The first few values are 1000, 900, 810… (with integer part of 10% taken each time).
3. How would the graph change if instead of removing 10% of the candies, you removed 20%? Sketch your new graph. 4. Second graph decays more quickly: 1000, 800, 640…
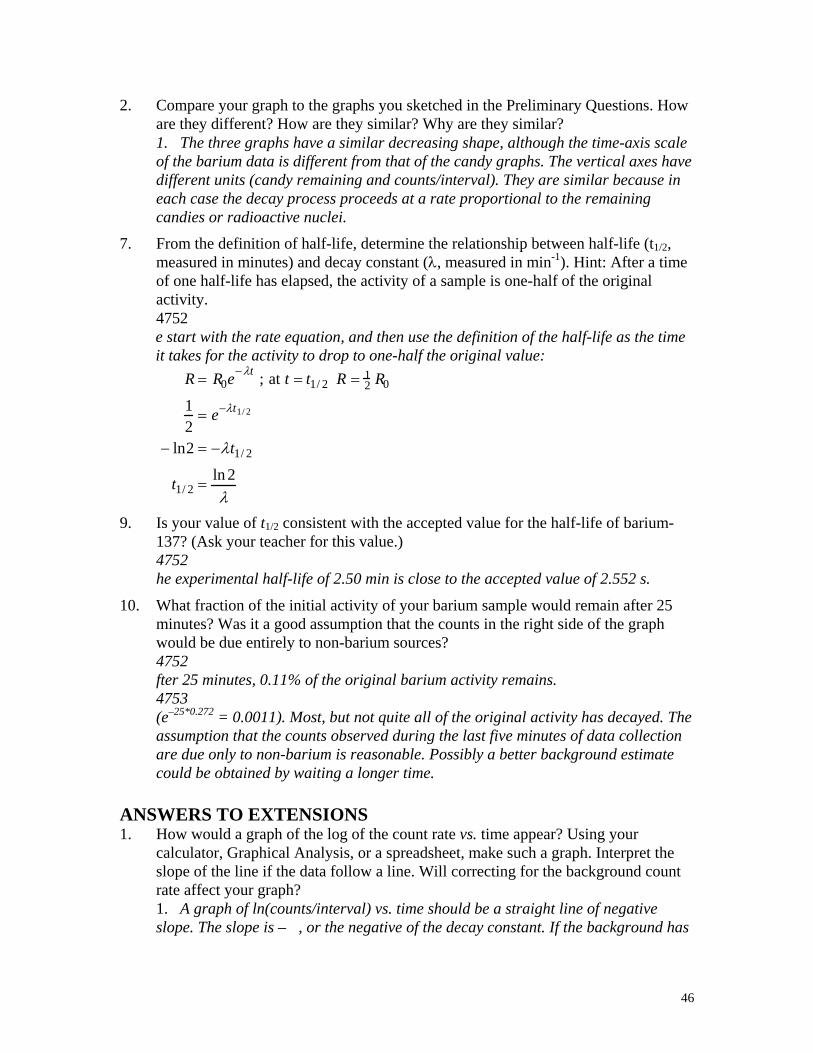
DATA TABLE
fit parameters for Y = A exp ( – B*X ) + C
A 7129 cpm
B 0.00444 s-1
C 182 cpm
λ (min–1) 0.266
t1/2 (min) 2.60
ANSWERS TO ANALYSIS QUESTIONS 1. Inspect your graph. Does the count rate decrease in time? Is the decrease consistent
with an activity proportional to the amount of radioactive material remaining? 1. The count rate decreases in time, falling to less than 10% of the initial value. This is consistent with activity being proportional to the amount of remaining radioactive material, since as material decays, less remains, so the activity must decrease.
46
2. Compare your graph to the graphs you sketched in the Preliminary Questions. How are they different? How are they similar? Why are they similar? 1. The three graphs have a similar decreasing shape, although the time-axis scale of the barium data is different from that of the candy graphs. The vertical axes have different units (candy remaining and counts/interval). They are similar because in each case the decay process proceeds at a rate proportional to the remaining candies or radioactive nuclei.
7. From the definition of half-life, determine the relationship between half-life (t1/2, measured in minutes) and decay constant (λ, measured in min-1). Hint: After a time of one half-life has elapsed, the activity of a sample is one-half of the original activity. 4752 e start with the rate equation, and then use the definition of the half-life as the time it takes for the activity to drop to one-half the original value:
R = R0e−λt ; at t = t1/ 2 R = 12 R0
12
= e−λt1/ 2
− ln2 = −λt1/ 2
t1/ 2 = ln 2λ
9. Is your value of t1/2 consistent with the accepted value for the half-life of barium-137? (Ask your teacher for this value.) 4752 he experimental half-life of 2.50 min is close to the accepted value of 2.552 s.
10. What fraction of the initial activity of your barium sample would remain after 25 minutes? Was it a good assumption that the counts in the right side of the graph would be due entirely to non-barium sources? 4752 fter 25 minutes, 0.11% of the original barium activity remains. 4753 (e–25*0.272 = 0.0011). Most, but not quite all of the original activity has decayed. The assumption that the counts observed during the last five minutes of data collection are due only to non-barium is reasonable. Possibly a better background estimate could be obtained by waiting a longer time.
ANSWERS TO EXTENSIONS 1. How would a graph of the log of the count rate vs. time appear? Using your
calculator, Graphical Analysis, or a spreadsheet, make such a graph. Interpret the slope of the line if the data follow a line. Will correcting for the background count rate affect your graph? 1. A graph of ln(counts/interval) vs. time should be a straight line of negative slope. The slope is –�, or the negative of the decay constant. If the background has

47
been subtracted, the graph should be nearly linear. Without background subtraction, the graph will be curved.
2. Repeat your experiment several times to estimate an uncertainty to your decay constant measurement.
3. Results will vary. A collection of lifetime measurements will allow the student to determine a range of values; the extent of that range is a measure of the uncertainty of the measurement. The range of data selected will also influence the measurement, as will the value used for the additive parameter B in the exponential curve fit.
4. How long would you have to wait until the activity of your barium sample is the same as the average background radiation? You will need to measure the background count rate carefully to answer this question.
3. Results will depend on the background radiation level. Experiments done at high altitude will experience larger background count rates due to reduced attenuation of cosmic rays by the atmosphere. To measure the background rate, set up Logger Pro to count with no source present. Note that the solution obtained from the isogenerator will contain some cesium, raising the count rate further above background from environmental radiation.

48
NUCLEAR RADIATION
LAB NR 2 From Nuclear Radiation with Computers and Calculators, Vernier Software & Technology, 2001.
INTRODUCTION Nuclear radiation can be broadly classified into three categories. These three categories are labeled with the first three letters of the Greek alphabet: α (alpha), β (beta) and γ (gamma). Alpha radiation consists of a stream of fast-moving helium nuclei (two protons and two neutrons). As such, an alpha particle is relatively heavy and carries two positive electrical charges. Beta radiation consists of fast-moving electrons or positrons (an antimatter electron). A beta particle is much lighter than an alpha, and carries one unit of charge. Gamma radiation consists of photons, which are without mass and carry no charge. X-rays are also photons, but carry less energy than gammas.
After being emitted from a decaying nucleus, the alpha, beta or gamma radiation may pass through matter, or it may be absorbed by the matter. You will arrange for the three classes of radiation to pass through nothing but a thin layer of air, a sheet of paper, and an aluminum sheet. Will the different types of radiation be absorbed differently by the air, paper and aluminum? The question can be answered by considering which radiation type will interact more strongly with matter, and then tested by experiment.
In this experiment, you will use small sources of alpha, beta, and gamma radiation. Follow all local procedures for handling radioactive materials.
PURPOSE The purpose of this experiment is to develop a model for the relative absorption of radiation by matter, to test it experimentally, and to analyze the resulting data to test for consistency with the model.
MATERIALS Laptop computer Polonium-210 0.1µC alpha source LabPro Strontium-90 0.1µC beta source Logger Pro, version 2.1.1 Cobalt-60 1µC gamma source Vernier Radiation Monitor paper sheet aluminum sheet, about 2 mm thick
49
SAFETY • Always wear goggles and an apron in the lab.
• Follow all local procedures for handling radioactive materials.
PRELAB QUESTIONS 1. Most nuclear radiation carries energy in the range of a few million electron volts, or
MeV (1 MeV = 106 eV = 1.6 × 10⁻¹³ J), regardless of its type (alpha, beta, or gamma). This means that particles that are more massive generally travel more slowly than light particles. Make a preliminary guess as to which radiation type will in general interact most strongly with matter, and therefore would be most strongly absorbed as it passes through matter. Consider electrical charge, mass and speed. Explain your reasons.
2. Which radiation type do you predict would interact, in general, least strongly with matter, and so be less absorbed than others? Why?
3. Which radiation type do you predict would have an intermediate level of interaction with matter? Why?
4. You will be using paper and aluminum sheet metal as absorbers for the radiation. Which material has the greatest density per unit area (which could be measured in g/cm2), and so would present more matter to the passing radiation? Which material would have less?
5. Is your radiation monitor sensitive to all three types of radiation? How can you tell? Devise a test and carry it out. If your radiation monitor does not detect one form of radiation, then you will be able to compare the absorption of the remaining two types.

50
PROCEDURE 1. Connect the radiation monitor to DIG/SONIC 1 of the LabPro.
2. Prepare the computer for data collection by opening “Exp 01 Alpha Beta Gamma” from the Nuclear Radiation w Computers experiment files of Logger Pro. One Meter Window and one data table are displayed. They will show the number of counts detected in one 50-second count interval.
3. Place the source near the metal screen of the Radiation Monitor, and when using an absorber, place the absorber between the source and the screen, Use approximately the same position for the sources each time, with and without an absorber. The sources are usually mounted in small plastic discs, with the most radiation emitted from the underside of the disc.
Begin with no source, to determine the background count rate. Move all sources away from the monitor. Click to begin collecting data. Wait for Logger Pro to complete data collection. Record the number of counts in the no-source row of the data table, no shielding.
4. Using no absorber, place the beta source near the metal screen of the Radiation Monitor, with the underside of the disc facing the monitor. Click to begin collecting data. Wait for Logger Pro to complete data collection. Record the number of counts in the beta row of the data table, no shielding.
5. Place a single sheet of paper between the beta source and the monitor, and measure the counts as before. Take care to keep the source in the same position with respect to the radiation monitor. Record the count rate in the appropriate place.
6. In a similar manner, record the counts for the following used as absorbers for each of the three sources:
a. a single sheet of paper
b. a single sheet of aluminum
7. Record each count in your data table.
51
DATA SHEET Name ___________________________
Name ___________________________
Period _____ Class _______________
Date ______________
NUCLEAR RADIATION
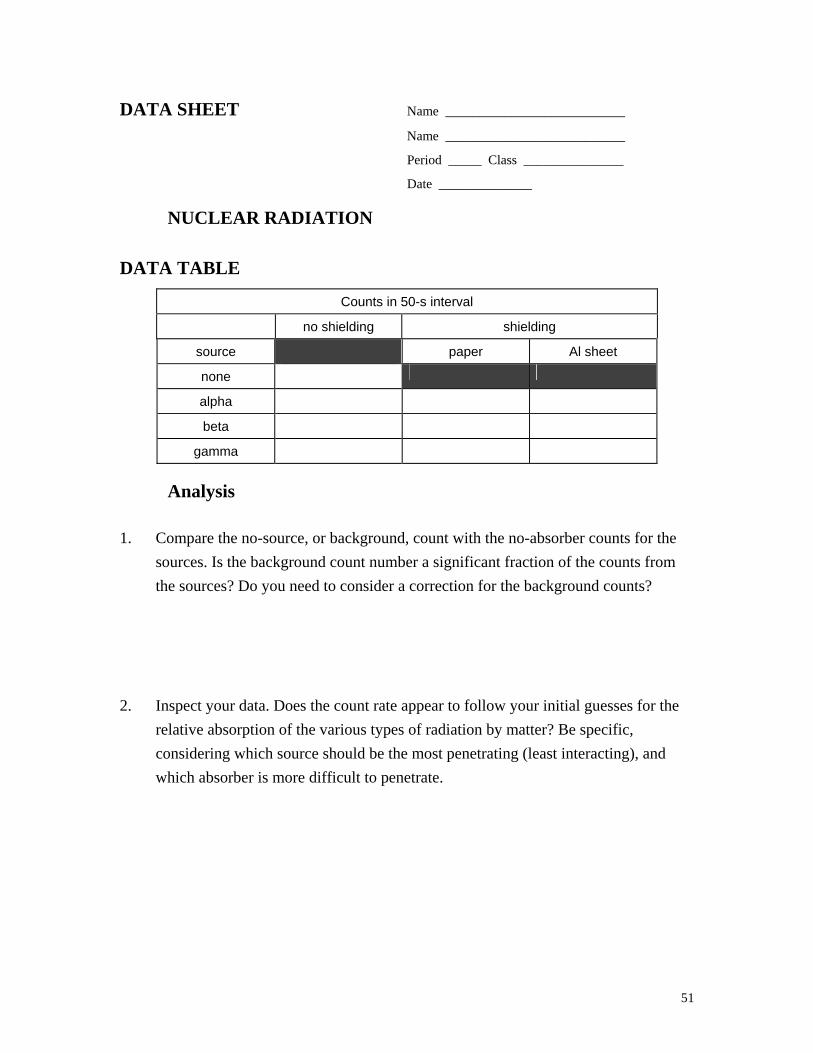
DATA TABLE
Counts in 50-s interval
no shielding shielding
source paper Al sheet
none
alpha
beta
gamma
Analysis
1. Compare the no-source, or background, count with the no-absorber counts for the sources. Is the background count number a significant fraction of the counts from the sources? Do you need to consider a correction for the background counts?
2. Inspect your data. Does the count rate appear to follow your initial guesses for the relative absorption of the various types of radiation by matter? Be specific, considering which source should be the most penetrating (least interacting), and which absorber is more difficult to penetrate.
52
3. X-rays are photons, just like gamma rays. X-rays carry lower energy, however, and so historically received a different name. If you have had an X-ray film picture of your teeth taken by a dentist, the dentist probably placed a lead-lined apron on your chest and lap before making the X-ray. What is the function of the lead apron? Support any assertion you make from your experimental data.
EXTENSIONS
1. If you were presented with a safe, but unknown, radiation source, and if it emitted only one type of radiation, devise a test that would allow you to tentatively identify the type of radiation as primarily alpha, beta, or gamma. Write instructions for another student to follow in performing the test.
2. Your monitor detected some radiation even without a source present. Devise a method to correct for this background radiation. Do the corrected data still agree with your prediction?

53
Day Ten Assessment – Nuclear Chemistry-Part 1 (Source: Barouch, Voyages in Conceptual Chemistry)
Directions: Complete the question on a separate sheet of paper. Your answers will be graded based upon your thought process, not your answers. Transformation For each of the following, state whether the element’s identity will change and if so, by how much the atomic number will increase or decrease:
Release of an alpha particle
Release of a negative beta particle
Release of a gamma ray
Nuclear fission
Loss of an electron (ionization), and
Change in energy level of an electron

54
Day Ten Assessment – Nuclear Chemistry-Part 2
(Source: Guch: 24 Lessons That Rocked the World)) Directions: Complete the following questions providing the reasons behind the answers. 1.) Explain why some atoms are stable and others are not. 2.) What are the three main types of radioactive decay? What particles are given off
during these processes? Explain. 3.) What is half-life? 4.) A compound contained 1000 grams of element X when it was buried. Element X is
radioactive (half-life = 200 years). If this compound is dug up in 1200 years, how much element X would you expect to find?
5.) What element is produced when the following reactions occur? Show your work in
an equation below each problem.
a.) 135Xe undergoes alpha decay?______________
b.) 135Xe undergoes beta decay?_______________
c.) 135Xe undergoes gamma decay?_____________ 6.) Are the people who had the atomic bomb dropped on them in Hiroshima radioactive?
Explain you answer. 7.) If the half-life of 95Rh is 5.0 minutes, how long will it take for 15/16 of it to decay?
55
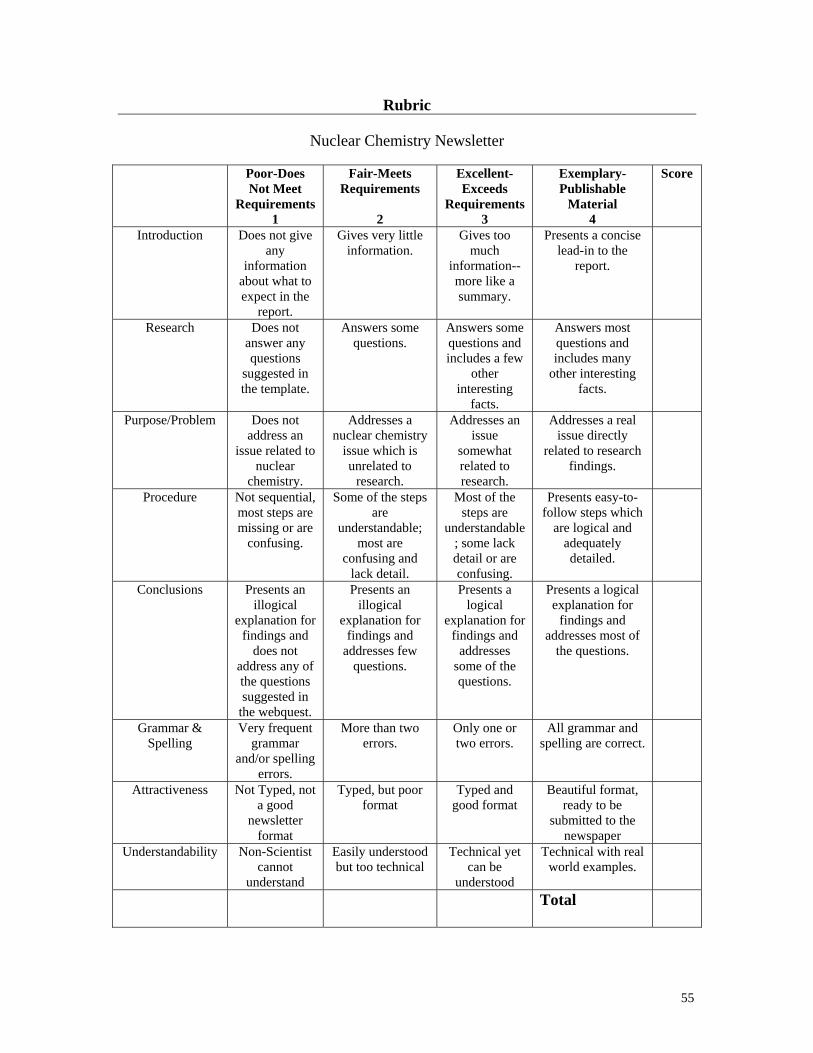
Rubric
Nuclear Chemistry Newsletter
Poor-Does Not Meet
Requirements 1
Fair-Meets Requirements
2
Excellent-Exceeds
Requirements 3
Exemplary-Publishable
Material 4
Score
Introduction Does not give any
information about what to expect in the
report.
Gives very little information.
Gives too much
information--more like a summary.
Presents a concise lead-in to the
report.
Research
Does not answer any questions
suggested in the template.
Answers some questions.
Answers some questions and includes a few
other interesting
facts.
Answers most questions and includes many
other interesting facts.
Purpose/Problem Does not address an
issue related to nuclear
chemistry.
Addresses a nuclear chemistry
issue which is unrelated to
research.
Addresses an issue
somewhat related to research.
Addresses a real issue directly
related to research findings.
Procedure
Not sequential, most steps are missing or are
confusing.
Some of the steps are
understandable; most are
confusing and lack detail.
Most of the steps are
understandable; some lack detail or are confusing.
Presents easy-to-follow steps which
are logical and adequately detailed.
Conclusions Presents an illogical
explanation for findings and
does not address any of the questions suggested in
the webquest.
Presents an illogical
explanation for findings and
addresses few questions.
Presents a logical
explanation for findings and
addresses some of the questions.
Presents a logical explanation for
findings and addresses most of
the questions.
Grammar & Spelling
Very frequent grammar
and/or spelling errors.
More than two errors.
Only one or two errors.
All grammar and spelling are correct.
Attractiveness Not Typed, not a good
newsletter format
Typed, but poor format
Typed and good format
Beautiful format, ready to be
submitted to the newspaper
Understandability Non-Scientist cannot
understand
Easily understood but too technical
Technical yet can be
understood
Technical with real world examples.
Total
56
Demonstration 1: Chain Reaction: (Source: Howe High School Chemistry)
• Tape 8 to 10 books of paper matches in a line on a metal rod with the heads pointing outward.
• Use a ring stand to clamp the metal rod upright. • Light the bottom match. The others will ignite in turn. • Each match represents an atom that fissions, emitting one neutron, causing the
next atom to fission. • Energy is released as an unstable, fissionable element changes into a more stable
element.

57
Demonstration 2: The Cloud Chamber(Source: http://www.lbl.gov/abc/experiments/Experiment9.html) Introduction Would you like to observe the effects of nuclear radiation? The cloud chamber is excellent for studying the rate of alpha decay and the range of an alpha particle. Alcohol vapors are held up highly pressurized by dry ice. When a harmless radioactive alpha source is inserted in the chamber, the tracks of the alpha particles can be observed. A cloud chamber Objective To create condensation trails which are evidence of the passage of alpha particles. Materials
• chamber with cover • radiation source • two blotting paper viewers • strong light source (300 W to 500 W) • dry ice • denatured ethyl alcohol
Procedure 1. Soak the blotting paper with alcohol. 2. Place the blotting paper in the chamber and cover. 3. Place the chamber on dry ice. 4. Insert the radioactive source through the hole in the side of the chamber. 5. Focus the strong light through the chamber. 6. Observe vapor trails against the black bottom of the chamber. 7. Replace the radioactive source in test tube when experiment is complete.
Data 1. Draw and label your observations
Questions 1. Why are alpha particles easy to view with the chamber? 2. Why is dry ice needed? 3. Why is alcohol needed?

58
Appendix Two