Embed Size (px)
Citation preview

1/37 International Capital Markets Day - Grupa LOTOS S.A. - Gdańsk November 27th 2013 1/40
INTERNATIONAL CAPITAL MARKETS DAY
GRUPA LOTOS S.A.
GDAŃSK
NOVEMBER 27TH 2013

2/37 International Capital Markets Day - Grupa LOTOS S.A. - Gdańsk November 27th 2013 2/40
STRATEGIC OVERVIEW
PAWEŁ OLECHNOWICZ
CHIEF EXECUTIVE OFFICER, GRUPA LOTOS S.A.
PRESIDENT OF THE MANAGEMENT BOARD OF GRUPA LOTOS S.A.

3/37
YME exit route : settlement with SBM
Heimdal package acquisition
expanded upstream portfolio (14 licenses)
crude oil production doubled (~10 000 bbl/d)
2/3 of deferred tax asset unlocked by 2016
Milestone for B8 Project development (financing)
EXECUTIVE SUMMARY
UP
ST
RE
AM
D
OW
NS
TR
EA
M
FIN
AN
CIA
LS
Outperforming in challenging macro environment
Operational excellence confirmed by Solomon Associates Study
Coker unit (DCU) project
Pre-feasibility study of the petrochemical project with Grupa Azoty
Steadily decreasing level of indebtedness
net debt down to 5.5 bn PLN
61% gearing ratio (net debt / equity)
New CAPEX solely focused on the core business areas

4/37
GLOBAL PRODUCT DEMAND – OUTLOOK UNTIL 2015
(’000 boe/d)
Source: JBC

5/37
= B8
THE AGREEMENT OF PIR AND LOTOS PETROBALTIC FOR B8 PROJECT

6/37
Significant improvement of EBIT margin : LPG and naphtha
Cost synergies : e.g. energy cost savings
PETROCHEMICAL COMPLEX IN GDAŃSK
STRATEGIC DETERMINANTS OF THE PROJECT
Deficit of raw materials for the production of petrochemicals
Opportunities of enlarging products portfolio
A significant deficit in international trade in chemicals
Demand for highly processed products and innovative installations
Labor market : new jobs
Cooperation with PIR
Grupa LOTOS S.A.
Grupa Azoty S.A.
The Polish economy
7/37
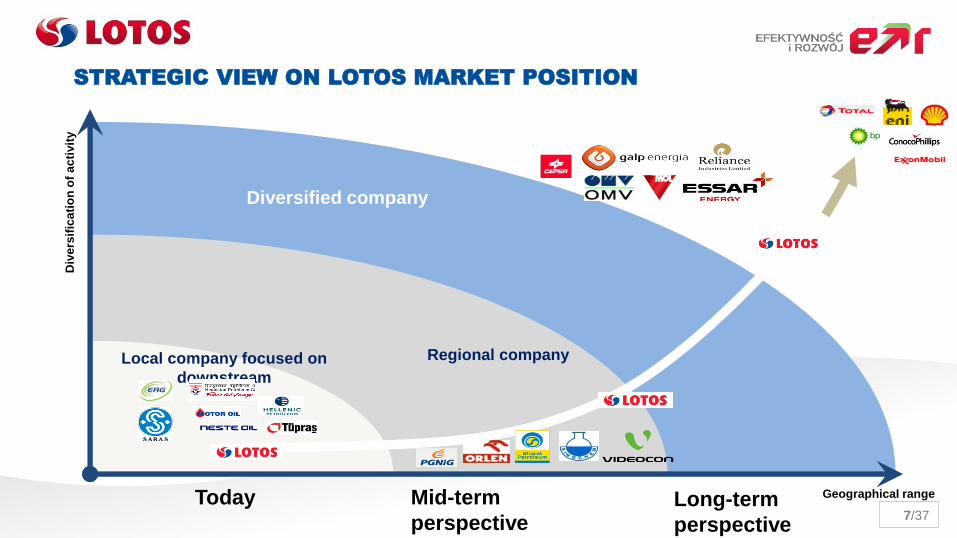
STRATEGIC VIEW ON LOTOS MARKET POSITION D
ive
rsif
ica
tio
n o
f a
cti
vit
y
Geographical range
Local company focused on
downstream
Regional company
Diversified company
Today Mid-term
perspective Long-term
perspective

8/37
Value creation : over PLN 1bn worth of brand
Downstream : LOTOS refinery’s capacity extension by 75% (up to 10.5m tpa)
Wholesale : 34% domestic fuel market share (trading in 62 countries)
Retail : over 400 service stations in Poland (8.4% market share)
Exploration and production : international upstream operations
Key strategic focus : value-creation in well balanced E&P portfolio of assets
STRONG MANAGEMENT TEAM
Stable and experienced Management Board

9/37 International Capital Markets Day - Grupa LOTOS S.A. - Gdańsk November 27th 2013 9/40
FINANCIAL SEGMENT
MARIUSZ MACHAJEWSKI
CHIEF FINANCIAL OFFICER, GRUPA LOTOS S.A.
VICE PRESIDENT OF THE MANAGEMENT BOARD OF GRUPA LOTOS S.A.

10/37
Strategic goal for 2015
Wholesale market share (eop) Retail market share (eop)
10% 30%
Gearing ratio (net debt / equity)
40%
Key comments
Wholesale : exceeding the target
Retail : systematic growth
Gearing ratio : steadily improving
STRATEGIC UPDATE : DOWNSTREAM AND FINANCIALS

11/37
BITUMENS
New model
margin
New product yield(1)
less Ural price
Cost of gas from the natural gas grid
c. 3 USD/bbl
HSFO
Notes:
(1) Assuming 95% utilization rate.
All prices based on Thomson Reuters data source
(2) LPG price benchmarked to 50/50 mix of propane/butane prices
LESS
50% butane (2)
50% propane (2)
Yield structure in the old and new model
ADJUSTED MODEL REFINING MARGIN

12/37
Average quarterly model refining margin (USD/bbl)
(1)
Notes :
(1) New model refining margin beginning with the 3Q of 2012
New model refining margin assuming current product slate, influenced by the switch to the natural
gas grid and maintenance shutdown triggering energetic improvement
GRUPA LOTOS’ MODEL REFINING MARGIN
1
13/37
Notes :
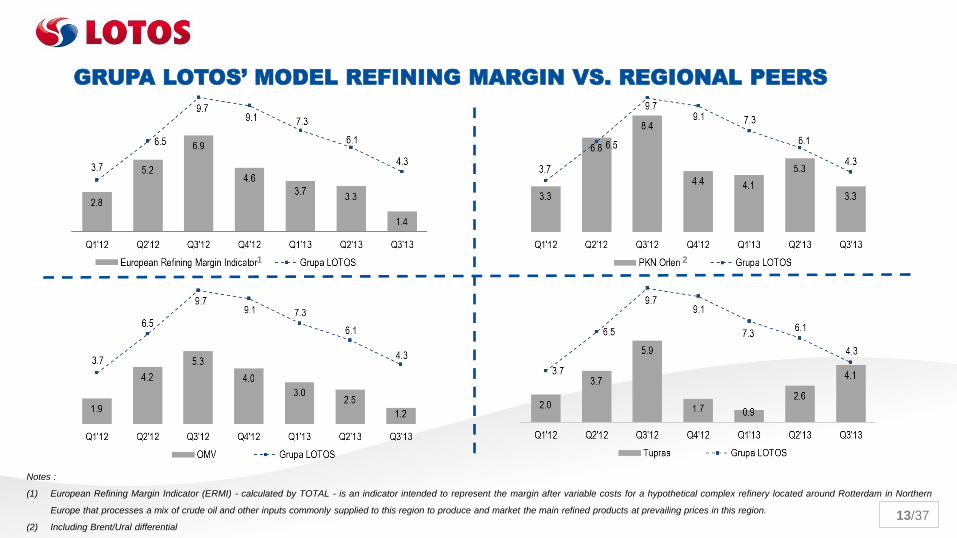
(1) European Refining Margin Indicator (ERMI) - calculated by TOTAL - is an indicator intended to represent the margin after variable costs for a hypothetical complex refinery located around Rotterdam in Northern
Europe that processes a mix of crude oil and other inputs commonly supplied to this region to produce and market the main refined products at prevailing prices in this region.
(2) Including Brent/Ural differential
1
GRUPA LOTOS’ MODEL REFINING MARGIN VS. REGIONAL PEERS
2

14/37 International Capital Markets Day - Grupa LOTOS S.A. - Gdańsk November 27th 2013 14/40
UPSTREAM SEGMENT
ZBIGNIEW PASZKOWICZ
EXPLORATION AND PRODUCTION OFFICER, GRUPA LOTOS S.A.
VICE PRESIDENT OF THE MANAGEMENT BOARD OF GRUPA LOTOS S.A.

15/37
Poland
Lithuania
Norway
Poland:
– offshore: development of existing
fields and full exploration of the
Baltic Sea
– onshore: cooperation with PGNIG
Norway:
– offshore: exploration, development
and production activities
Lithuania:
– onshore: full development of the
licenses held
2015 – production potential 24 kboe/d
LOTOS E&P STRATEGY

16/37
2013
B3 field: PG-1 unmanned rig revamped, back
in production in October 2013
continued production from B3 field until 2026
the first seismic campaign since 2009 - 2D
and 3D seismic 1200 km²
2 new licenses
2015-2014
B8 field development, first oil in 4Q 2015,
production potential: 3.5 million t, cooperation
with PIR
B4/B6 gas fields – preparation and launching
the development together with CalEnergy,
production potential: 4 billion m3 gas
drilling exploration campaign
seismic to be realised in 2013
POLAND: THE INTENSIFICATION OF WORKS IN THE BALTIC SEA

17/37
drilling rig purchase – plan 2014
operation to a water depth of >120 m
implementation of horizontal wells
to be used for exploration and production
activities
exploration target: prospective resources of 30 million toe
POLAND: FULL EXPLORATION OF THE BALTIC SEA

18/37
3 producing, 3 development fields, 1 HUB
5.000+ boe/d production net
14 licenses / operator in Fulla development
$ 175.8m acquisition price
$ 80m (45%) of the acquisition costs financed on
a non-cash basis (using the tax shield)
required approvals from Norwegian authorities:
– Ministry of Petroleum and Energy (MPE)
– Ministry of Finance (MoF)
Heimdal – reserves and resources net
2P 2C prospective resources
NORWAY: HEIMDAL ACQUISITION

19/37
2/3 of the tax assets unlocked in 2013 – 2016
recovery of acquisition cost by late 2014/early 2015
cooperation with experienced Partners:
Statoil, Centrica, Total
risk diversification
building up strong E&P industry position within NCS
access to areas with high potential for the discovery of
resources
doubling production
Positive
effects
Heimdal = new begining
NORWAY: HEIMDAL TRANSACTION RESULTS

20/37
Dated as of 01.01.2013
mm boe Poland Norway Lithuania
35.2
8.4
22.0
+16%
2P reserves = 65.6 mn boe
30.1
0.3
31.0
+102%
Poland Norway Lithuania
2C reserves = 61.4 mn boe
RESERVES AFTER HEIMDAL TRANSACTION

21/37
4.7 5.7
9.4 10.4
24.0
0
5
10
15
20
25
30
2011 2012 2013 2014 2015
dai
ly p
rod
uct
ion
(kb
oe
/d)
+5.1 - B8
+2 - other PL (onshore)
+ 0.5 - Lithuania
+6 - acquisition
total investments in LOTOS E&P 2011-2015 3.9 billion PLN
daily p
rod
ucti
on
(kb
oe/d
)
*kboe/d
Strategy implementation plan
2015 – PRODUCTION POTENTIAL 24 KBOE/D

22/37
production potential 24 kboe/d in 2015
full exploration of the Baltic Sea licenses
onshore presence in Poland
stable position and growth potential in Norway
solving the problem with YME
an active participant in the international market
a modern and dynamic organization with a
highly qualified staff
SUMMARY

23/37 International Capital Markets Day - Grupa LOTOS S.A. - Gdańsk November 27th 2013 23/40
OPERATING SEGMENT
MAREK SOKOŁOWSKI
CHIEF OPERATION OFFICER, GRUPA LOTOS S.A.
VICE PRESIDENT OF THE MANAGEMENT BOARD OF GRUPA LOTOS S.A.

24/37
2008 → 2010→ 2012
Refinery Utilization 1Q → 3Q → 2Q
Energy Intensity Index (EII™ ) 1Q → 1Q → 1Q
Personnel Index 4Q → 3Q → 2Q
Personnel Cost Indicator 3Q → 1Q → 1Q
Mechanical Availability 3Q → 1Q → 2Q
Maintenance Index 2Q → 1Q → 1Q
Maintenance Cost Efficiency Index (MEI™) 2Q → 1Q → 1Q
Return on Investment 1Q → 1Q → 2Q
LOTOS REFINERY IN SOLOMON STUDIES
25/37
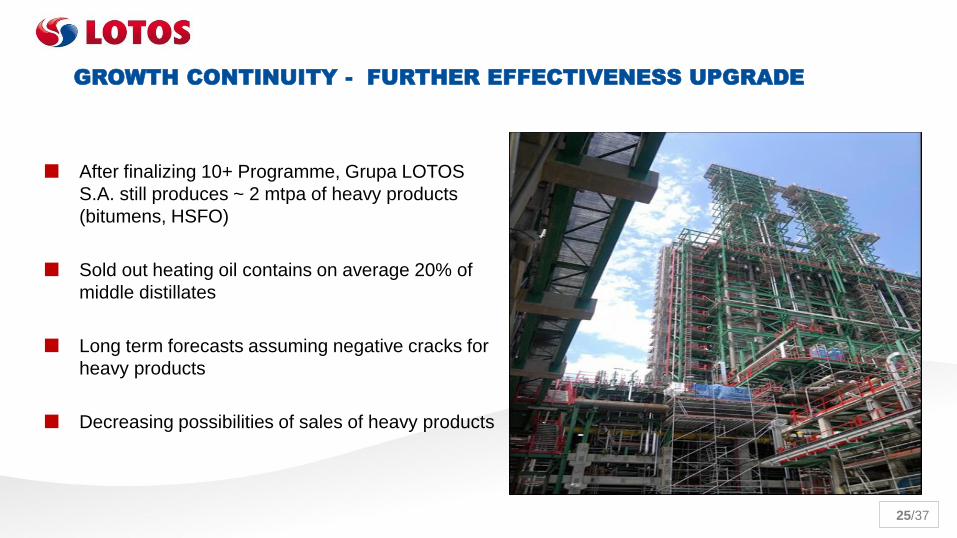
GROWTH CONTINUITY - FURTHER EFFECTIVENESS UPGRADE
After finalizing 10+ Programme, Grupa LOTOS
S.A. still produces ~ 2 mtpa of heavy products
(bitumens, HSFO)
Sold out heating oil contains on average 20% of
middle distillates
Long term forecasts assuming negative cracks for
heavy products
Decreasing possibilities of sales of heavy products

26/37
Very low low very high
IRR
NPV
Una
ttrac
tive
at
trac
tive
CHP*
DCU*
IGCC*
Size of the bubble – relative CAPEX for the project
CAPEX for the project EUR 400 – 500m
Higher utilization rate of the existing units
(HDS and MHC)
Middle distillates production oriented
Solving all problems of heavy residue
Increase of the refining margin – estimated
for 2 USD/bbl
Source: Purvin & Gertz * DCU – Delayed Coking Unit
IGCC – Integrated Gasification Combined Cycle
CHP – Combined Heat and Power
ALTERNATIVE SCENARIOS POSITIONING – RATIONALE BEHIND DCU
27/37
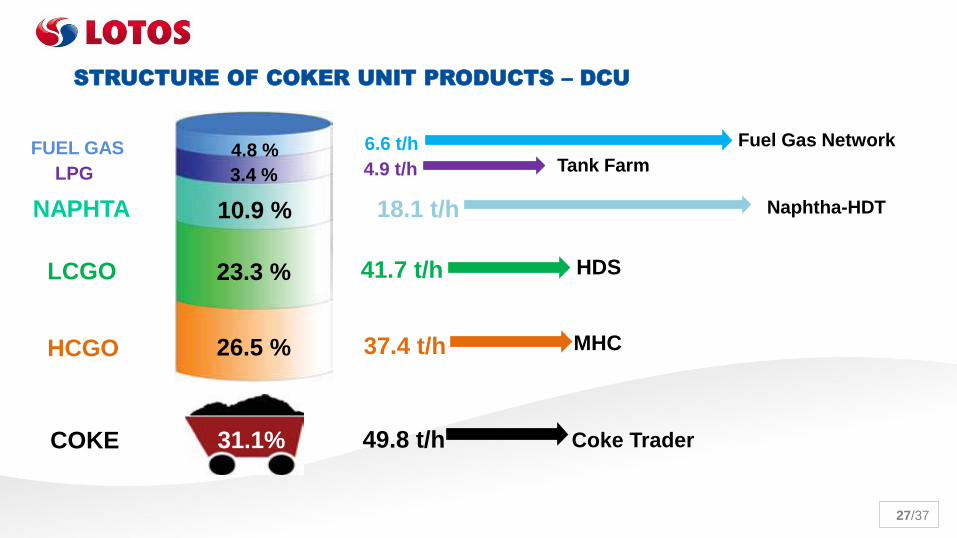
31,1 %
26.5 %
23.3 %
10.9 %
3.4 %
4.8 % FUEL GAS
NAPHTA
LPG
LCGO
HCGO
COKE
41.7 t/h HDS
37.4 t/h MHC
49.8 t/h Coke Trader
18.1 t/h Naphtha-HDT
Fuel Gas Network 6.6 t/h
4.9 t/h Tank Farm
31.1%
STRUCTURE OF COKER UNIT PRODUCTS – DCU

28/37
Product yield following implementation of DCU (% product)
Decrease of the heavy
products’ share in the total
output
Increased level of middle
distillates
Residual Coke appearing
following the finalization of the
project
+8pp
-12pp
Notes:
1) Gasoline + Naphtha + LPG
2) Diesel + Jet Fuel + LHO
3) HSFO + Bitumens + Slacks
1) 2) 3)
DCU – SIGNIFICANT IMPROVEMENT OF PRODUCTS YIELD

29/37
Increase of hydrogen available in the
refinery – by recovery from refining gases -
increase of refining margin
Replacing high margin products (used in
refinery fuel gas) with natural gas
CAPEX ~ PLN 100m
NPV PLN 400 – 500m:
Payback period: 2 years (after completion
of the project)
Additional annual production from HRU (k tons)
+50%
+4%
+7%
Product sales volume increase thanks to HRU
HYDROGEN RECOVERY UNIT

30/37 International Capital Markets Day - Grupa LOTOS S.A. - Gdańsk November 27th 2013 30/40
MARKETING SEGMENT
MACIEJ SZOZDA
CHIEF COMMERCIAL OFFICER, GRUPA LOTOS S.A.
VICE PRESIDENT OF THE MANAGEMENT BOARD OF GRUPA LOTOS S.A.

31/37
Main achievements Future goals
LOTOS TANK AND AIR BP JOIN VENTURE
DOMESTIC MARKET DEVELOPMENT IN
FUELS AND LUBRICANTS
RETAIL MARKET SHARE INCREASE
NEW IMPORTANT DESTINATIONS IN
LUBRICANTS’ SALE
PETROL STATION NETWORK EXPANSION
IN DOMESTIC MARKET
10% SHARE IN RETAIL MARKET IN 2015
SUSTAINABLE SALES GROWTH IN ALL
PRODUCTS
INVESTMENTS IN DOMESTIC LOGISTICS
INFRASTRUCTURE

32/37
LOTOS AIR BP

33/37
DECEMBER 2013 – 451 petrol stations
2012
Domestic retail consumption (mln m3)
2013
(5.8%)
14.7 13.9
2012
LOTOS Group share in retail market
2013
0.6 pp
8.0%
Forecast
Forecast
8.6%
RETAIL MARKET IN POLAND

34/37
27.1% 27.9%
2012 2013
LOTOS Group share
in the domestic lubricants market
0.8 pp
Strong expansion of LOTOS Group in the
lubricants export.
Our products are available in more than 50
countries in Europe and around the world.
Forecast
LUBRICANTS AND PLASTICIZERS MARKET

35/37
LOGISTICS
Key projects
Logistic assets’ optimization
LOTOS Terminale – fuel terminals integration and development – operational
concentration in one functional structure
Fuel storage effectiveness improvement
Marine terminal investment at Martwa Wisła
Creating trans shipment availability in the nearest district
Export and import channels diversification
Intermediaries’ costs elimination

36/37
Yemen Vietnam
Venezuela
V.A.E
Uzbekistan
USA
Ukraine
Tunesia
Turkey
Togo
Tansania
Tadschikistan
South Africa
Sudan Senegal
Sweden Russia
Romania
Portugal
Poland
Philippines
Peru
Panama
Norway
Nigeria
Morocco
Mauretania
Madagascar
Liberia
Kirgisistan
Kasachstan
Israel
Italy
Ireland
Iraq
Indonesia
Guinea
Greece
Great Britain
Germany
Fr. Guyana
France
Finland
Egypt
Cote d‘Ivoire
Chile
Belarus
Argentinia
Algeria
Alaska
Afghanistan
EXPORT TO 62 COUNTRIES ALL AROUND THE WORLD

37/37
Thank You