Embed Size (px)
Citation preview
NTAsian Emerging Leaders Fund
March
2017
Investments Mar-17
Contents
Valuation table 3
Company page
Minth (425 HK) 4
Tisco (TISCO TB) 5
Puregold (PGOLD PM) 6
Luk Fook (590 HK) 7
Silverlake Axis (SILV SP) 8
Pakuwon (PWON IJ) 9
Larson & Toubro Infotech (LTI IN) 10
Hanon Systems (018880 KS) 11
Cosmo Lady (2298 HK) 12
Blue Bird (BIRD IJ) 13
Disclaimer 14
NTAsian Emerging Leaders Fund March 2017
Page | 3
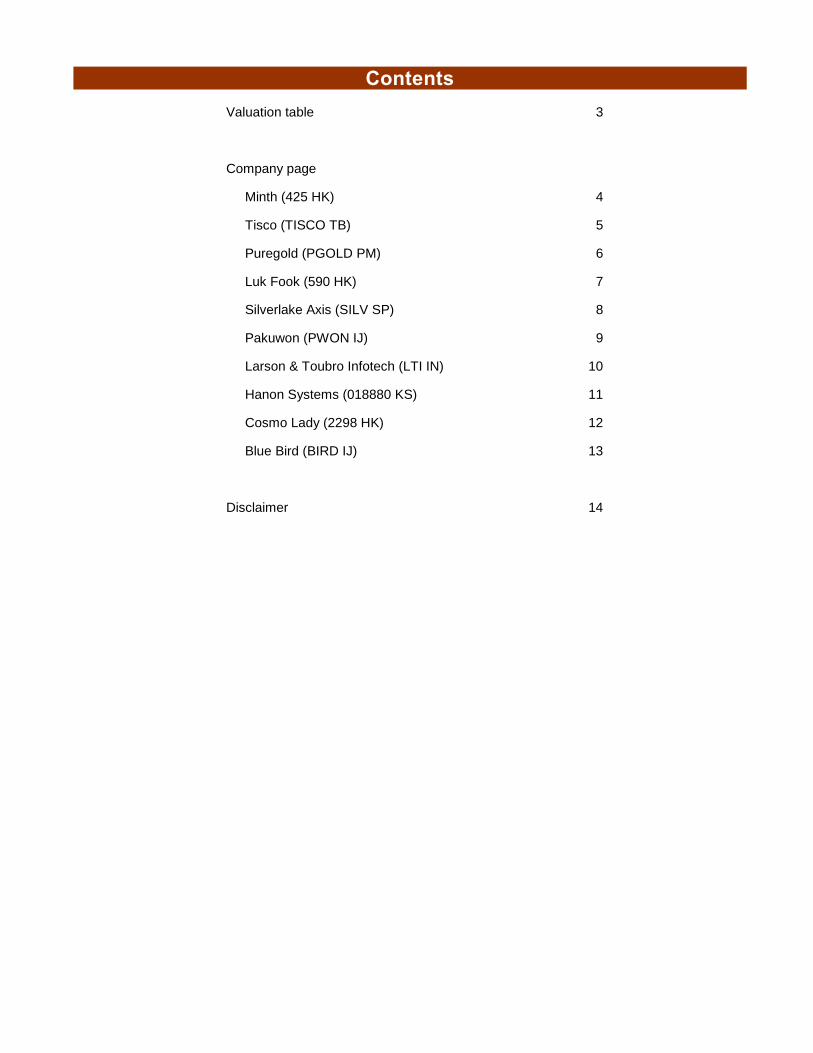
Valuation table
Ownership PER EPS gr FY17F Valuation
Company Code Mkt
cap % of % of co Price ^ 15A 16A 17F 18F 15A 16A 17F 18F EV/EBITDA Yield PBV DE ROE ROCE
USDm NAV
Paid-
up
capital
Local
curr x x x x % % % % x % x % % %
Top ten holdings
Minth 425 5,296 10.9 0.5 32.25 25.3 19.1 15.5 13.0 12.8 32.5 23.0 19.4 11.3 2.5 2.7 NC 18.6 22.5
Tisco TISCO 1,594 9.7 1.3 69.00 13.0 11.0 9.9 8.9 0.01 17.8 11.7 11.3 n/a 4.6 1.6 n/a 17.0 n/a
Puregold ** PGOLD 2,411 8.3 0.7 43.80 24.2 22.8 19.6 17.0 10.6 6.5 15.9 15.2 11.9 0.7 2.6 6.1 13.8 17.9
Luk Fook * 590 1,848 8.3 0.9 24.45 15.0 15.6 14.6 14.4 (40.6) (3.9) 7.0 1.4 8.0 3.4 1.5 NC 10.7 12.7
Silverlake Axis * SILV 1,097 8.2 1.6 0.58 17.8 7.7 17.4 14.3 (1.7) 131.4 (55.8) 21.7 15.0 5.8 8.3 NC 36.2 38.2
Pakuwon ** PWON 2,168 8.1 0.8 600.00 22.9 16.6 15.0 12.5 (49.8) 37.8 10.5 20.5 11.2 1.3 2.8 29.6 20.2 16.3
L&T Infotech * LTI 1,801 7.2 0.8 690.60 12.7 12.4 11.7 10.6 15.1 2.8 5.8 10.6 8.1 2.9 3.7 NC 34.7 42.1
Hanon Systems 018880 4,470 6.8 0.3 9,400.00 21.8 17.2 13.7 12.2 (16.3) 26.7 12.8 12.2 6.4 2.9 2.3 NC 17.5 21.8
Cosmo Lady 2298 653 6.7 2.4 2.36 7.4 16.5 9.6 8.3 13.9 (55.1) 71.5 15.5 4.2 3.7 1.3 NC 14.6 18.4
Blue Bird BIRD 695 6.0 1.8 3,700.00 11.2 18.2 15.3 13.2 (1.9) (38.4) 19.1 16.4 6.0 2.6 1.8 19.7 12.5 14.5
Top ten weighted average – reported profit 17.6 15.5 14.3 12.5 (5.6) 20.3 11.3 14.5 9.3 3.0 2.9 3.4 19.6 23.5
Top ten weighted average – core profit 16.5 15.6 13.0 11.3 2.6 0.1 20.0 14.6
Portfolio weighted average – reported profit 17.5 15.5 14.2 12.4 2.3 18.7 11.3 13.8 9.1 2.9 2.8 2.3 19.8 23.8
Portfolio weighted average – core profit 16.5 16.4 13.9 12.3 9.2 2.5 18.4 13.9
^ As of 24 March 2017
* Year ended Jan-Jun, all valuation are included in Dec in preceding year i.e. valuation of Jun 16 will be included in 15.
** 16F
NTAsian Emerging Leaders Fund March 2017
Page | 4
Minth (425 HK)
Share Data (as of 24 Mar 17)
Share price HKD 32.25
2017 high / low price HKD 32.25 / 23.70
Shares outstanding m 1,131
Market cap USDm 5,296
NT's ownership % of NAV 10.9
NT's ownership % of co. 0.5
Top 3 shareholders
1. Jong Hwa Chin 39.5%
2. Commonwealth Bank 9.0%
3. Matthews Intl Capital Management 6.7%
Share Valuation Dec 15A 16A 17F 18F
Revenue CNYm 7,654 9,400 11,317 13,439
Net profit CNYm 1,272 1,719 2,109 2,517
EBITDA CNYm 2,041 2,528 3,068 3,626
EPS CNY/sh 1.14 1.52 1.86 2.23
Net profit gr % 13.8 35.2 22.7 19.4
EBITDA gr % 44.2 23.9 21.4 18.2
EPS gr % 12.8 32.5 23.0 19.4
PER x 25.3 19.1 15.5 13.0
Yield % 1.5 2.0 2.5 2.9
ROE % 14.5 17.4 18.6 19.4
ROA % 9.8 12.2 13.0 13.4
ROCE % 19.0 21.0 22.5 23.5
EV/EBITDA x 17.4 12.3 11.3 9.4
Net DE (cash) % (8.8) (14.1) (12.6) (15.1)
PBV x 3.5 3.1 2.7 2.4
P/OCF x 32.5 14.9 14.9 14.4
FCF/EV x (0.2) 2.8 1.7 3.7
Source: NTAsset
Revenue breakdown by geographical segment (%)
Source: Company data
Share Price Chart
Source: Bloomberg
Background & Investment case
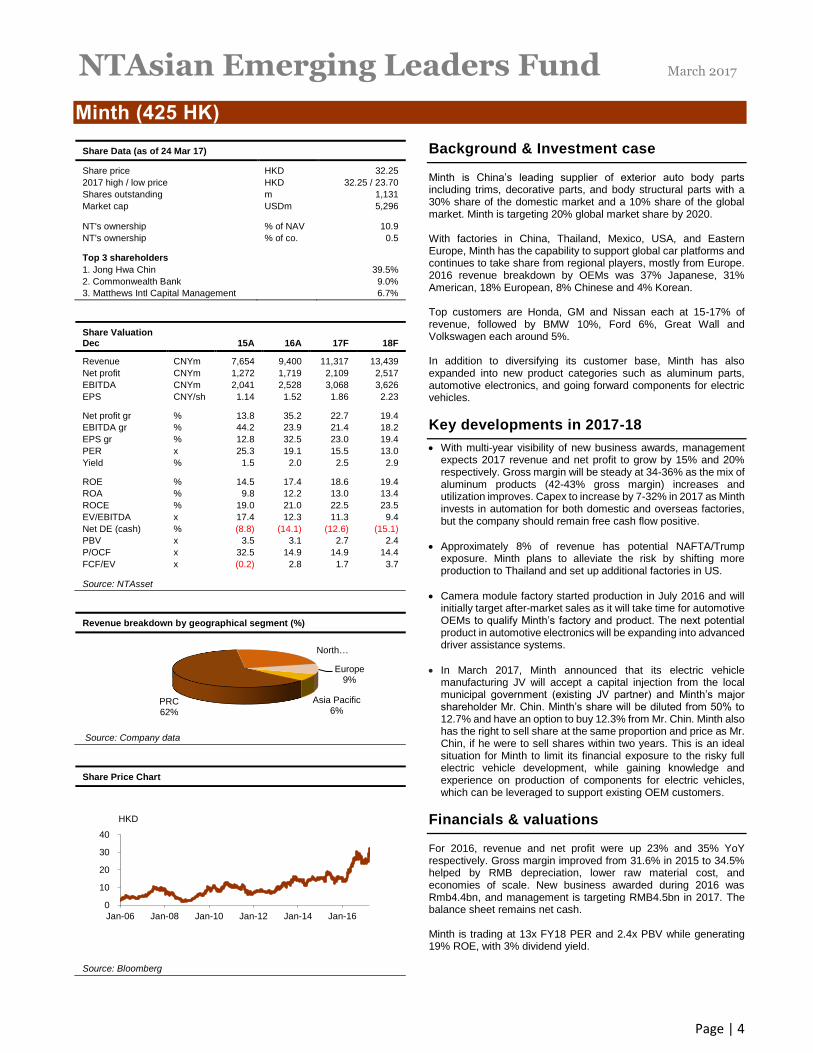
Minth is China’s leading supplier of exterior auto body parts including trims, decorative parts, and body structural parts with a 30% share of the domestic market and a 10% share of the global market. Minth is targeting 20% global market share by 2020. With factories in China, Thailand, Mexico, USA, and Eastern Europe, Minth has the capability to support global car platforms and continues to take share from regional players, mostly from Europe. 2016 revenue breakdown by OEMs was 37% Japanese, 31% American, 18% European, 8% Chinese and 4% Korean. Top customers are Honda, GM and Nissan each at 15-17% of revenue, followed by BMW 10%, Ford 6%, Great Wall and Volkswagen each around 5%. In addition to diversifying its customer base, Minth has also expanded into new product categories such as aluminum parts, automotive electronics, and going forward components for electric vehicles.
Key developments in 2017-18
With multi-year visibility of new business awards, management expects 2017 revenue and net profit to grow by 15% and 20% respectively. Gross margin will be steady at 34-36% as the mix of aluminum products (42-43% gross margin) increases and utilization improves. Capex to increase by 7-32% in 2017 as Minth invests in automation for both domestic and overseas factories, but the company should remain free cash flow positive.
Approximately 8% of revenue has potential NAFTA/Trump exposure. Minth plans to alleviate the risk by shifting more production to Thailand and set up additional factories in US.
Camera module factory started production in July 2016 and will initially target after-market sales as it will take time for automotive OEMs to qualify Minth’s factory and product. The next potential product in automotive electronics will be expanding into advanced driver assistance systems.
In March 2017, Minth announced that its electric vehicle manufacturing JV will accept a capital injection from the local municipal government (existing JV partner) and Minth’s major shareholder Mr. Chin. Minth’s share will be diluted from 50% to 12.7% and have an option to buy 12.3% from Mr. Chin. Minth also has the right to sell share at the same proportion and price as Mr. Chin, if he were to sell shares within two years. This is an ideal situation for Minth to limit its financial exposure to the risky full electric vehicle development, while gaining knowledge and experience on production of components for electric vehicles, which can be leveraged to support existing OEM customers.
Financials & valuations
For 2016, revenue and net profit were up 23% and 35% YoY respectively. Gross margin improved from 31.6% in 2015 to 34.5% helped by RMB depreciation, lower raw material cost, and economies of scale. New business awarded during 2016 was Rmb4.4bn, and management is targeting RMB4.5bn in 2017. The balance sheet remains net cash. Minth is trading at 13x FY18 PER and 2.4x PBV while generating 19% ROE, with 3% dividend yield.
PRC62%
North …
Europe9%
Asia Pacific6%
0
10
20
30
40
Jan-06 Jan-08 Jan-10 Jan-12 Jan-14 Jan-16
HKD
NTAsian Emerging Leaders Fund March 2017
Page | 5
Tisco (TISCO TB)
Share Data (as of 24 Mar 17)
Share price THB 69.00
2017 high / low price THB 69.50 / 60.50
Shares outstanding m 801
Market cap USDm 1,594
NT's ownership % of NAV 9.7
NT's ownership % of co. 1.3
Top 3 shareholders
1. Stock Exchange of Thailand 18.3%
2. CDIB & Partners Investment 10.0%
3. Krungsri Asset 5.2%
Share Valuation Dec 15A 16A 17F 18F
Net interest inc THBm 10,130 10,920 10,641 10,735
Non interest inc THBm 5,057 5,167 5,699 6,269
Pre provision profit THBm 10,566 10,216 10,170 10,523
Net profit THBm 4,250 5,005 5,591 6,223
EPS THB/sh 5.31 6.25 6.98 7.77
EPS gr % 0.01 17.8 11.7 11.3
PER x 13.0 11.0 9.9 8.9
PBV x 2.0 1.8 1.6 1.4
Yield % 3.5 4.1 4.6 5.1
ROE % 15.8 16.9 17.0 17.0
ROA % 1.4 1.8 2.0 2.1
Tier 1 ratio % 13.9 14.9 15.8 16.2
NPL coverage ratio % 80.1 120.0 120.0 120.0
Loan growth % (9.3) (6.5) 0.5 7.5
NIM % 3.7 4.3 4.3 4.2
Source: NTAsset
Revenue breakdown by business segment (%)
Source: Company data
Share Price Chart
Source: Bloomberg
Background & Investment case
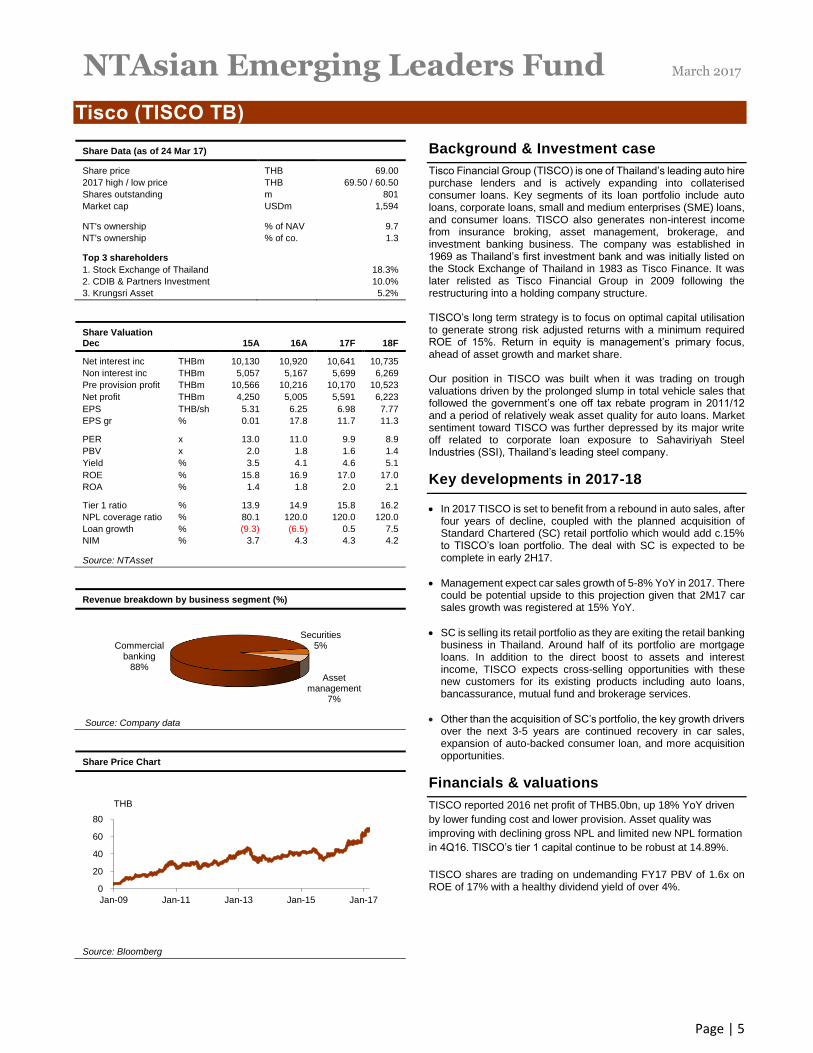
Tisco Financial Group (TISCO) is one of Thailand’s leading auto hire purchase lenders and is actively expanding into collaterised consumer loans. Key segments of its loan portfolio include auto loans, corporate loans, small and medium enterprises (SME) loans, and consumer loans. TISCO also generates non-interest income from insurance broking, asset management, brokerage, and investment banking business. The company was established in 1969 as Thailand’s first investment bank and was initially listed on the Stock Exchange of Thailand in 1983 as Tisco Finance. It was later relisted as Tisco Financial Group in 2009 following the restructuring into a holding company structure. TISCO’s long term strategy is to focus on optimal capital utilisation to generate strong risk adjusted returns with a minimum required ROE of 15%. Return in equity is management’s primary focus, ahead of asset growth and market share. Our position in TISCO was built when it was trading on trough valuations driven by the prolonged slump in total vehicle sales that followed the government’s one off tax rebate program in 2011/12 and a period of relatively weak asset quality for auto loans. Market sentiment toward TISCO was further depressed by its major write off related to corporate loan exposure to Sahaviriyah Steel Industries (SSI), Thailand’s leading steel company.
Key developments in 2017-18
In 2017 TISCO is set to benefit from a rebound in auto sales, after four years of decline, coupled with the planned acquisition of Standard Chartered (SC) retail portfolio which would add c.15% to TISCO’s loan portfolio. The deal with SC is expected to be complete in early 2H17.
Management expect car sales growth of 5-8% YoY in 2017. There could be potential upside to this projection given that 2M17 car sales growth was registered at 15% YoY.
SC is selling its retail portfolio as they are exiting the retail banking business in Thailand. Around half of its portfolio are mortgage loans. In addition to the direct boost to assets and interest income, TISCO expects cross-selling opportunities with these new customers for its existing products including auto loans, bancassurance, mutual fund and brokerage services.
Other than the acquisition of SC’s portfolio, the key growth drivers over the next 3-5 years are continued recovery in car sales, expansion of auto-backed consumer loan, and more acquisition opportunities.
Financials & valuations
TISCO reported 2016 net profit of THB5.0bn, up 18% YoY driven
by lower funding cost and lower provision. Asset quality was
improving with declining gross NPL and limited new NPL formation
in 4Q16. TISCO’s tier 1 capital continue to be robust at 14.89%.
TISCO shares are trading on undemanding FY17 PBV of 1.6x on ROE of 17% with a healthy dividend yield of over 4%.
Commercial banking
88%
Securities5%
Asset management
7%
0
20
40
60
80
Jan-09 Jan-11 Jan-13 Jan-15 Jan-17
THB
NTAsian Emerging Leaders Fund March 2017
Page | 6
Puregold (PGOLD PM)
Share Data (as of 24 Mar 17)
Share price PHP 43.80
2017 high / low price PHP 46.30 / 38.50
Shares outstanding m 2,765
Market cap USDm 2,411
NT's ownership % of NAV 8.3
NT's ownership % of co. 0.7
Top 3 shareholders
1. Cosco Capital 51.0%
2. Lucio L Co 7.6%
3. Susan P Co 6.5%
Share Valuation Dec 15A 16F 17F 18F
Revenue PHPm 97,172 112,251 128,962 146,706
Net profit PHPm 5,002 5,323 6,170 7,108
EBITDA PHPm 8,455 9,186 10,459 11,786
EPS PHP/sh 1.81 1.92 2.23 2.57
Net profit gr % 10.7 6.4 15.9 15.2
EBITDA gr % 9.9 8.6 13.9 12.7
EPS gr % 10.6 6.5 15.9 15.2
PER x 24.2 22.8 19.6 17.0
Yield % 0.7 0.7 0.7 0.7
ROE % 14.5 13.1 13.8 14.5
ROA % 9.3 9.0 10.0 10.7
ROCE % 17.1 16.8 17.9 19.1
EV/EBITDA x 14.3 13.7 11.9 10.3
Net DE (cash) % (0.5) 11.1 6.1 1.0
PBV x 3.2 2.8 2.6 2.4
P/OCF x 36.4 n/a 21.9 19.1
FCF/EV % 0.7 (3.1) 3.2 3.9
Source: NTAsset
Revenue breakdown by business segment (%)
Source: Company data
Share Price Chart
Source: Bloomberg
Background & Investment case
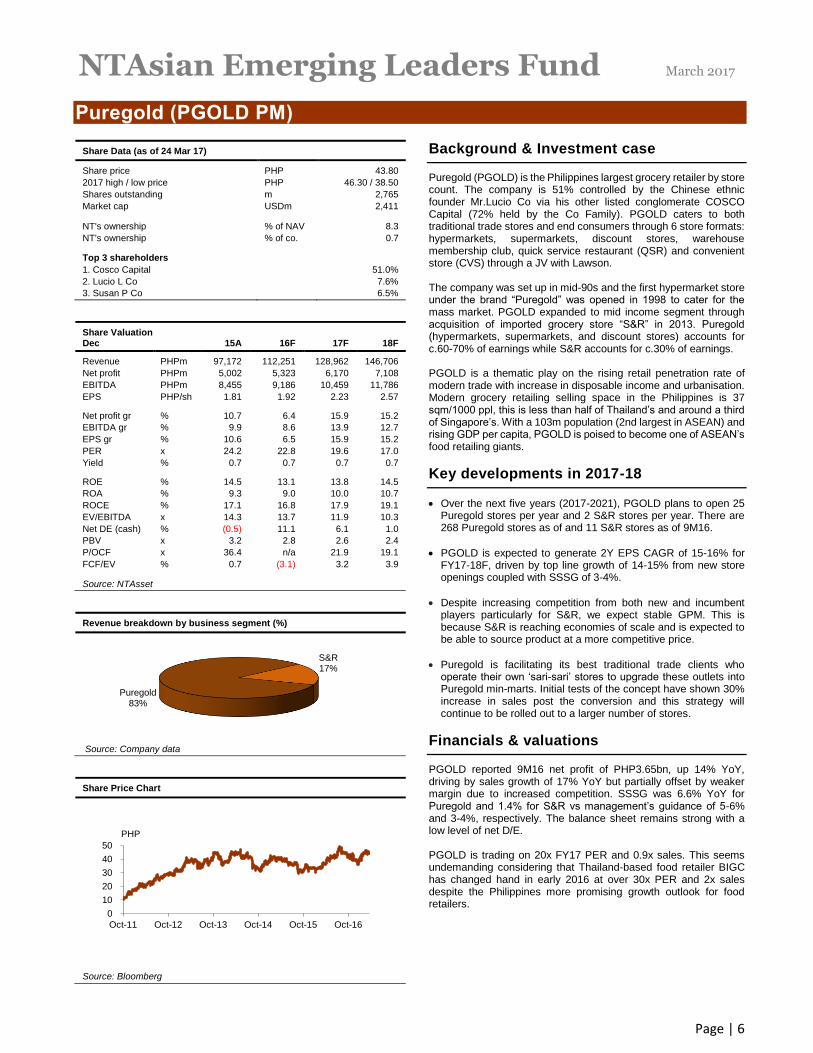
Puregold (PGOLD) is the Philippines largest grocery retailer by store count. The company is 51% controlled by the Chinese ethnic founder Mr.Lucio Co via his other listed conglomerate COSCO Capital (72% held by the Co Family). PGOLD caters to both traditional trade stores and end consumers through 6 store formats: hypermarkets, supermarkets, discount stores, warehouse membership club, quick service restaurant (QSR) and convenient store (CVS) through a JV with Lawson. The company was set up in mid-90s and the first hypermarket store under the brand “Puregold” was opened in 1998 to cater for the mass market. PGOLD expanded to mid income segment through acquisition of imported grocery store “S&R” in 2013. Puregold (hypermarkets, supermarkets, and discount stores) accounts for c.60-70% of earnings while S&R accounts for c.30% of earnings. PGOLD is a thematic play on the rising retail penetration rate of modern trade with increase in disposable income and urbanisation. Modern grocery retailing selling space in the Philippines is 37 sqm/1000 ppl, this is less than half of Thailand’s and around a third of Singapore’s. With a 103m population (2nd largest in ASEAN) and rising GDP per capita, PGOLD is poised to become one of ASEAN’s food retailing giants.
Key developments in 2017-18
Over the next five years (2017-2021), PGOLD plans to open 25 Puregold stores per year and 2 S&R stores per year. There are 268 Puregold stores as of and 11 S&R stores as of 9M16.
PGOLD is expected to generate 2Y EPS CAGR of 15-16% for FY17-18F, driven by top line growth of 14-15% from new store openings coupled with SSSG of 3-4%.
Despite increasing competition from both new and incumbent players particularly for S&R, we expect stable GPM. This is because S&R is reaching economies of scale and is expected to be able to source product at a more competitive price.
Puregold is facilitating its best traditional trade clients who operate their own ‘sari-sari’ stores to upgrade these outlets into Puregold min-marts. Initial tests of the concept have shown 30% increase in sales post the conversion and this strategy will continue to be rolled out to a larger number of stores.
Financials & valuations
PGOLD reported 9M16 net profit of PHP3.65bn, up 14% YoY, driving by sales growth of 17% YoY but partially offset by weaker margin due to increased competition. SSSG was 6.6% YoY for Puregold and 1.4% for S&R vs management’s guidance of 5-6% and 3-4%, respectively. The balance sheet remains strong with a low level of net D/E. PGOLD is trading on 20x FY17 PER and 0.9x sales. This seems undemanding considering that Thailand-based food retailer BIGC has changed hand in early 2016 at over 30x PER and 2x sales despite the Philippines more promising growth outlook for food retailers.
Puregold83%
S&R17%
0
10
20
30
40
50
Oct-11 Oct-12 Oct-13 Oct-14 Oct-15 Oct-16
PHP
NTAsian Emerging Leaders Fund March 2017
Page | 7
Luk Fook (590 HK)
Share Data (as of 24 Mar 17)
Share price HKD 24.45
2017 high / low price HKD 24.70 / 20.25
Shares outstanding m 587
Market cap USDm 1,848
NT's ownership % of NAV 8.3
NT's ownership % of co. 0.9
Top 3 shareholders
1. Luk Fook (Control) Ltd 39.9%
2. Silchester Intl Investors 11.0%
3. Brandes Investment 6.0%
Share Valuation Mar 16A 17F 18F 19F
Revenue HKDm 14,031 12,587 12,373 12,579
Net profit HKDm 959 922 987 1,000
EBITDA HKDm 1,313 1,334 1,447 1,476
EPS HKD/sh 1.63 1.57 1.68 1.70
Net profit gr % (40.6) (3.8) 7.0 1.4
EBITDA gr % (38.9) 1.6 8.5 2.0
EPS gr % (40.6) (3.9) 7.0 1.4
PER x 15.0 15.6 14.6 14.4
Yield % 4.5 3.2 3.4 3.5
ROE % 11.1 10.5 10.7 10.3
ROA % 8.7 8.6 8.9 8.6
ROCE % 11.8 12.3 12.7 12.3
EV/EBITDA x 9.7 9.0 8.0 7.7
Net DE (cash) % (19.8) (26.7) (29.6) (30.3)
PBV x 1.7 1.6 1.5 1.4
P/OCF x 7.1 8.8 11.7 13.2
FCF/EV % 15.3 13.2 10.2 9.1
Source: NTAsset
Revenue breakdown by geographical segment (%)
Source: Company data
Share Price Chart
Source: Bloomberg
Background & Investment case
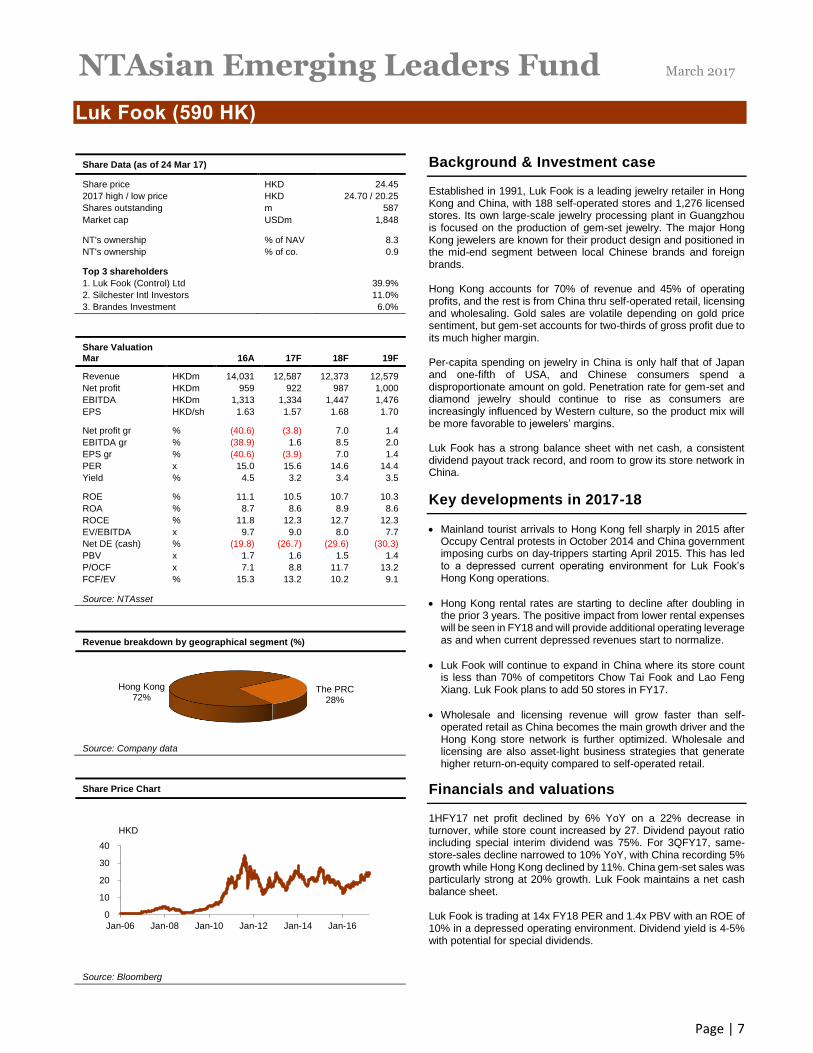
Established in 1991, Luk Fook is a leading jewelry retailer in Hong Kong and China, with 188 self-operated stores and 1,276 licensed stores. Its own large-scale jewelry processing plant in Guangzhou is focused on the production of gem-set jewelry. The major Hong Kong jewelers are known for their product design and positioned in the mid-end segment between local Chinese brands and foreign brands. Hong Kong accounts for 70% of revenue and 45% of operating profits, and the rest is from China thru self-operated retail, licensing and wholesaling. Gold sales are volatile depending on gold price sentiment, but gem-set accounts for two-thirds of gross profit due to its much higher margin. Per-capita spending on jewelry in China is only half that of Japan and one-fifth of USA, and Chinese consumers spend a disproportionate amount on gold. Penetration rate for gem-set and diamond jewelry should continue to rise as consumers are increasingly influenced by Western culture, so the product mix will be more favorable to jewelers’ margins. Luk Fook has a strong balance sheet with net cash, a consistent dividend payout track record, and room to grow its store network in China.
Key developments in 2017-18
Mainland tourist arrivals to Hong Kong fell sharply in 2015 after Occupy Central protests in October 2014 and China government imposing curbs on day-trippers starting April 2015. This has led to a depressed current operating environment for Luk Fook’s Hong Kong operations.
Hong Kong rental rates are starting to decline after doubling in the prior 3 years. The positive impact from lower rental expenses will be seen in FY18 and will provide additional operating leverage as and when current depressed revenues start to normalize.
Luk Fook will continue to expand in China where its store count is less than 70% of competitors Chow Tai Fook and Lao Feng Xiang. Luk Fook plans to add 50 stores in FY17.
Wholesale and licensing revenue will grow faster than self-operated retail as China becomes the main growth driver and the Hong Kong store network is further optimized. Wholesale and licensing are also asset-light business strategies that generate higher return-on-equity compared to self-operated retail.
Financials and valuations
1HFY17 net profit declined by 6% YoY on a 22% decrease in turnover, while store count increased by 27. Dividend payout ratio including special interim dividend was 75%. For 3QFY17, same-store-sales decline narrowed to 10% YoY, with China recording 5% growth while Hong Kong declined by 11%. China gem-set sales was particularly strong at 20% growth. Luk Fook maintains a net cash balance sheet. Luk Fook is trading at 14x FY18 PER and 1.4x PBV with an ROE of 10% in a depressed operating environment. Dividend yield is 4-5% with potential for special dividends.
Hong Kong72%
The PRC28%
0
10
20
30
40
Jan-06 Jan-08 Jan-10 Jan-12 Jan-14 Jan-16
HKD
NTAsian Emerging Leaders Fund March 2017
Page | 8
Silverlake Axis (SILV SP)
Share Data (as of 24 Mar 17)
Share price SGD 0.580
2017 high / low price SGD 0.60 / 0.52
Shares outstanding m 2,646
Market cap USDm 1,097
NT's ownership % of NAV 8.2
NT's ownership % of co. 1.6
Top 3 shareholders
1. Goh Peng Ooi 64.3%
2. HNA Group International 5.4%
3. NTAsian Discovery Fund 5.0%
Share Valuation Jun 16A 17F 18F 19F
Revenue MYRm 636 594 695 799
Net profit MYRm 274 634 280 341
EBITDA MYRm 304 245 312 379
EPS MYR/sh 0.10 0.24 0.11 0.13
Net profit gr % (3.1) 131.4 (55.8) 21.7
EBITDA gr % (2.0) (19.4) 27.1 21.5
EPS gr % (1.7) 131.4 (55.8) 21.7
PER x 17.8 7.7 17.4 14.3
Yield % 5.2 13.0 5.8 7.0
ROE % 44.1 81.6 36.2 54.4
ROA % 34.0 66.6 29.4 39.0
ROCE % 46.7 31.0 38.2 52.9
EV/EBITDA x 15.5 17.9 15.0 12.3
Net DE (cash) % (25.9) (49.7) (30.1) (28.5)
PBV x 8.2 5.2 8.3 7.5
P/OCF x 22.0 8.1 13.2 15.4
FCF/EV % 4.6 13.6 7.9 6.8
Source: NTAsset
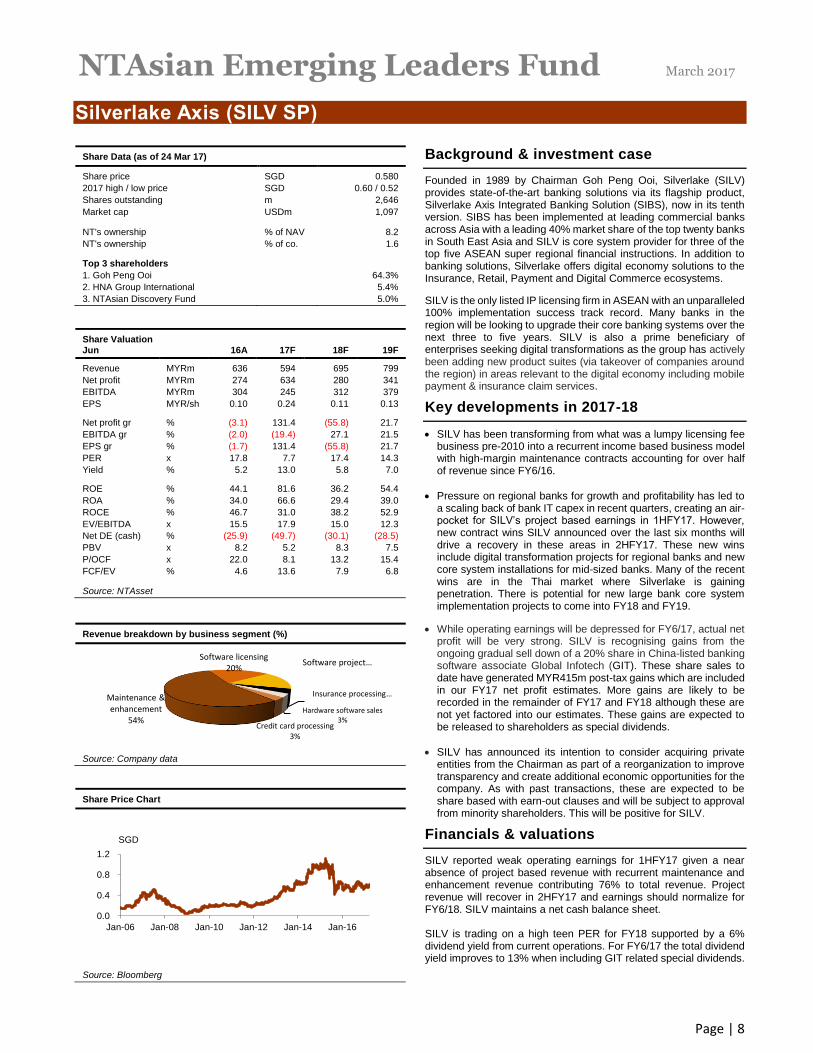
Revenue breakdown by business segment (%)
Source: Company data
Share Price Chart
Source: Bloomberg
Background & investment case
Founded in 1989 by Chairman Goh Peng Ooi, Silverlake (SILV) provides state-of-the-art banking solutions via its flagship product, Silverlake Axis Integrated Banking Solution (SIBS), now in its tenth version. SIBS has been implemented at leading commercial banks across Asia with a leading 40% market share of the top twenty banks in South East Asia and SILV is core system provider for three of the top five ASEAN super regional financial instructions. In addition to banking solutions, Silverlake offers digital economy solutions to the Insurance, Retail, Payment and Digital Commerce ecosystems.
SILV is the only listed IP licensing firm in ASEAN with an unparalleled 100% implementation success track record. Many banks in the region will be looking to upgrade their core banking systems over the next three to five years. SILV is also a prime beneficiary of enterprises seeking digital transformations as the group has actively been adding new product suites (via takeover of companies around the region) in areas relevant to the digital economy including mobile payment & insurance claim services.
Key developments in 2017-18
SILV has been transforming from what was a lumpy licensing fee business pre-2010 into a recurrent income based business model with high-margin maintenance contracts accounting for over half of revenue since FY6/16.
Pressure on regional banks for growth and profitability has led to a scaling back of bank IT capex in recent quarters, creating an air-pocket for SILV’s project based earnings in 1HFY17. However, new contract wins SILV announced over the last six months will drive a recovery in these areas in 2HFY17. These new wins include digital transformation projects for regional banks and new core system installations for mid-sized banks. Many of the recent wins are in the Thai market where Silverlake is gaining penetration. There is potential for new large bank core system implementation projects to come into FY18 and FY19.
While operating earnings will be depressed for FY6/17, actual net profit will be very strong. SILV is recognising gains from the ongoing gradual sell down of a 20% share in China-listed banking software associate Global Infotech (GIT). These share sales to date have generated MYR415m post-tax gains which are included in our FY17 net profit estimates. More gains are likely to be recorded in the remainder of FY17 and FY18 although these are not yet factored into our estimates. These gains are expected to be released to shareholders as special dividends.
SILV has announced its intention to consider acquiring private entities from the Chairman as part of a reorganization to improve transparency and create additional economic opportunities for the company. As with past transactions, these are expected to be share based with earn-out clauses and will be subject to approval from minority shareholders. This will be positive for SILV.
Financials & valuations
SILV reported weak operating earnings for 1HFY17 given a near absence of project based revenue with recurrent maintenance and enhancement revenue contributing 76% to total revenue. Project revenue will recover in 2HFY17 and earnings should normalize for FY6/18. SILV maintains a net cash balance sheet. SILV is trading on a high teen PER for FY18 supported by a 6% dividend yield from current operations. For FY6/17 the total dividend yield improves to 13% when including GIT related special dividends.
Maintenance & enhancement
54%
Software licensing20%
Software project …
Insurance processing…
Hardware software sales3%
Credit card processing3%
0.0
0.4
0.8
1.2
Jan-06 Jan-08 Jan-10 Jan-12 Jan-14 Jan-16
SGD
NTAsian Emerging Leaders Fund March 2017
Page | 9
Pakuwon (PWON IJ)
Share Data (as of 24 Mar 17)
Share price IDR 600
2017 high / low price IDR 605 / 555
Shares outstanding m 48,160
Market cap USDm 2,168
NT's ownership % of NAV 8.1
NT's ownership % of co. 0.8
Top 3 shareholders
1. Tedja Family (through four holding companies) 52.2%
2. Vanguard Group 1.7%
3. Blackrock 0.9%
Share Valuation Dec 15A 16F 17F 18F
Revenue IDRbn 4,625 5,088 5,596 6,436
Net profit IDRbn 1,262 1,739 1,920 2,313
EBITDA IDRbn 2,422 2,590 2,844 3,370
EPS IDR/sh 26.20 36.10 39.87 48.03
Net profit gr % (49.8) 37.8 10.5 20.5
EBITDA gr % 11.6 6.9 9.8 18.5
EPS gr % (49.8) 37.8 10.5 20.5
PER x 22.9 16.6 15.0 12.5
Yield % 0.8 0.9 1.3 1.6
ROE % 18.8 21.8 20.2 20.5
ROA % 7.1 8.9 9.0 9.9
ROCE % 17.5 16.6 16.3 17.4
EV/EBITDA x 13.1 12.3 11.2 9.4
Net DE (cash) % 39.3 34.3 29.6 22.6
PBV x 4.0 3.3 2.8 2.4
P/OCF x 17.0 17.5 15.2 12.7
FCF/EV % (0.3) 0.2 0.9 2.1
Source: NTAsset
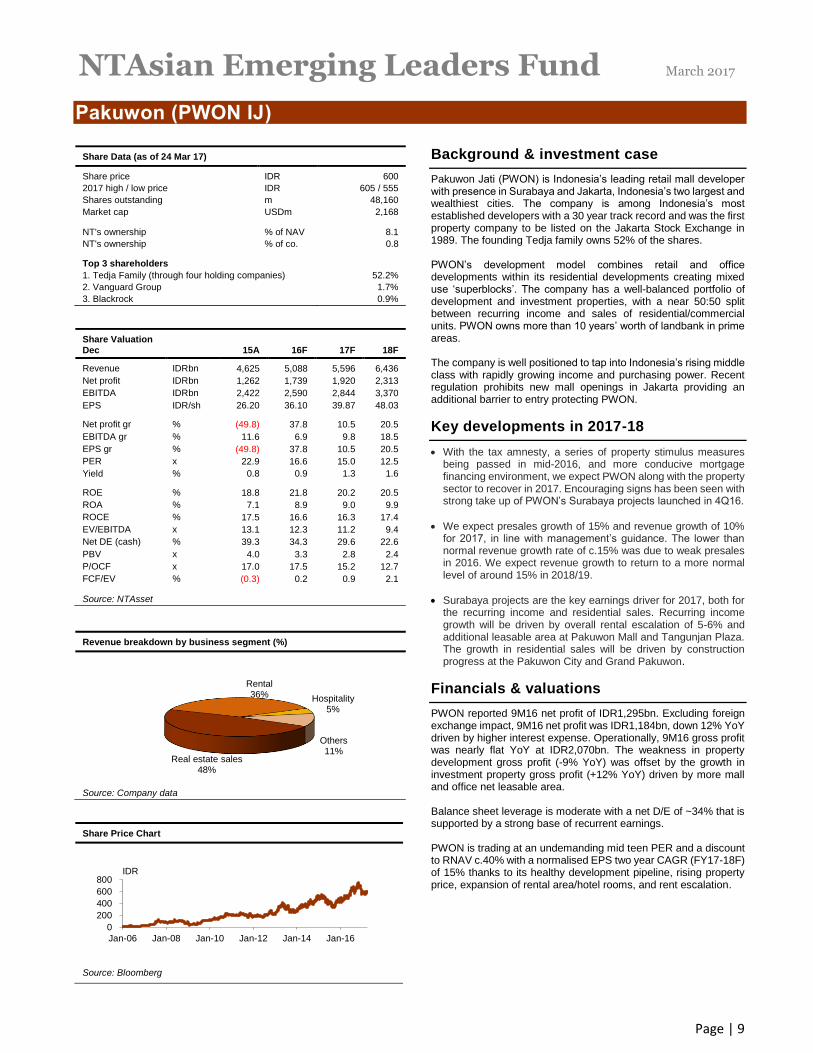
Revenue breakdown by business segment (%)
Source: Company data
Share Price Chart
Source: Bloomberg
Background & investment case
Pakuwon Jati (PWON) is Indonesia’s leading retail mall developer with presence in Surabaya and Jakarta, Indonesia’s two largest and wealthiest cities. The company is among Indonesia’s most established developers with a 30 year track record and was the first property company to be listed on the Jakarta Stock Exchange in 1989. The founding Tedja family owns 52% of the shares. PWON’s development model combines retail and office developments within its residential developments creating mixed use ‘superblocks’. The company has a well-balanced portfolio of development and investment properties, with a near 50:50 split between recurring income and sales of residential/commercial units. PWON owns more than 10 years’ worth of landbank in prime areas. The company is well positioned to tap into Indonesia’s rising middle class with rapidly growing income and purchasing power. Recent regulation prohibits new mall openings in Jakarta providing an additional barrier to entry protecting PWON.
Key developments in 2017-18
With the tax amnesty, a series of property stimulus measures being passed in mid-2016, and more conducive mortgage financing environment, we expect PWON along with the property sector to recover in 2017. Encouraging signs has been seen with strong take up of PWON’s Surabaya projects launched in 4Q16.
We expect presales growth of 15% and revenue growth of 10% for 2017, in line with management’s guidance. The lower than normal revenue growth rate of c.15% was due to weak presales in 2016. We expect revenue growth to return to a more normal level of around 15% in 2018/19.
Surabaya projects are the key earnings driver for 2017, both for the recurring income and residential sales. Recurring income growth will be driven by overall rental escalation of 5-6% and additional leasable area at Pakuwon Mall and Tangunjan Plaza. The growth in residential sales will be driven by construction progress at the Pakuwon City and Grand Pakuwon.
Financials & valuations
PWON reported 9M16 net profit of IDR1,295bn. Excluding foreign exchange impact, 9M16 net profit was IDR1,184bn, down 12% YoY driven by higher interest expense. Operationally, 9M16 gross profit was nearly flat YoY at IDR2,070bn. The weakness in property development gross profit (-9% YoY) was offset by the growth in investment property gross profit (+12% YoY) driven by more mall and office net leasable area. Balance sheet leverage is moderate with a net D/E of ~34% that is supported by a strong base of recurrent earnings. PWON is trading at an undemanding mid teen PER and a discount to RNAV c.40% with a normalised EPS two year CAGR (FY17-18F) of 15% thanks to its healthy development pipeline, rising property price, expansion of rental area/hotel rooms, and rent escalation.
Real estate sales48%
Rental36% Hospitality
5%
Others11%
0
200
400
600
800
Jan-06 Jan-08 Jan-10 Jan-12 Jan-14 Jan-16
IDR
NTAsian Emerging Leaders Fund March 2017
Page | 10
Larson & Toubro Infotech (LTI IN)
Share Data (as of 24 Mar 17)
Share price INR 690.60
2017 high / low price INR 713.25 / 665.20
Shares outstanding m 171
Market cap USDm 1,801
NT's ownership % of NAV 7.2
NT's ownership % of co. 0.8
Top 3 shareholders
1. Larsen & Toubro 84.3%
2. Auburn Limited 1.8%
3. Kotak Mahindra 1.0%
Share Valuation Mar 16A 17F 18F 19F
Revenue INRm 61,431 66,058 72,222 79,539
Net profit INRm 9,223 9,485 10,034 11,101
EBITDA INRm 10,357 12,220 13,089 14,398
EPS INR/sh 54.31 55.86 59.08 65.37
Net profit gr % 21.3 2.8 5.8 10.6
EBITDA gr % 3.1 18.0 7.1 10.3
EPS gr % 15.1 2.8 5.8 10.6
PER x 12.7 12.4 11.7 10.6
Yield % 5.0 2.7 2.9 3.2
ROE % 45.6 41.1 34.7 31.5
ROA % 28.3 24.9 22.2 20.9
ROCE % 51.9 49.2 42.1 39.1
EV/EBITDA x 11.1 9.1 8.1 7.0
Net DE (cash) % (9.5) (25.4) (35.1) (42.1)
P/BV x 5.8 4.5 3.7 3.0
P/OCF x 10.2 11.8 11.4 10.5
FCF/EV % 8.9 7.6 8.2 9.4
Source: NTAsset
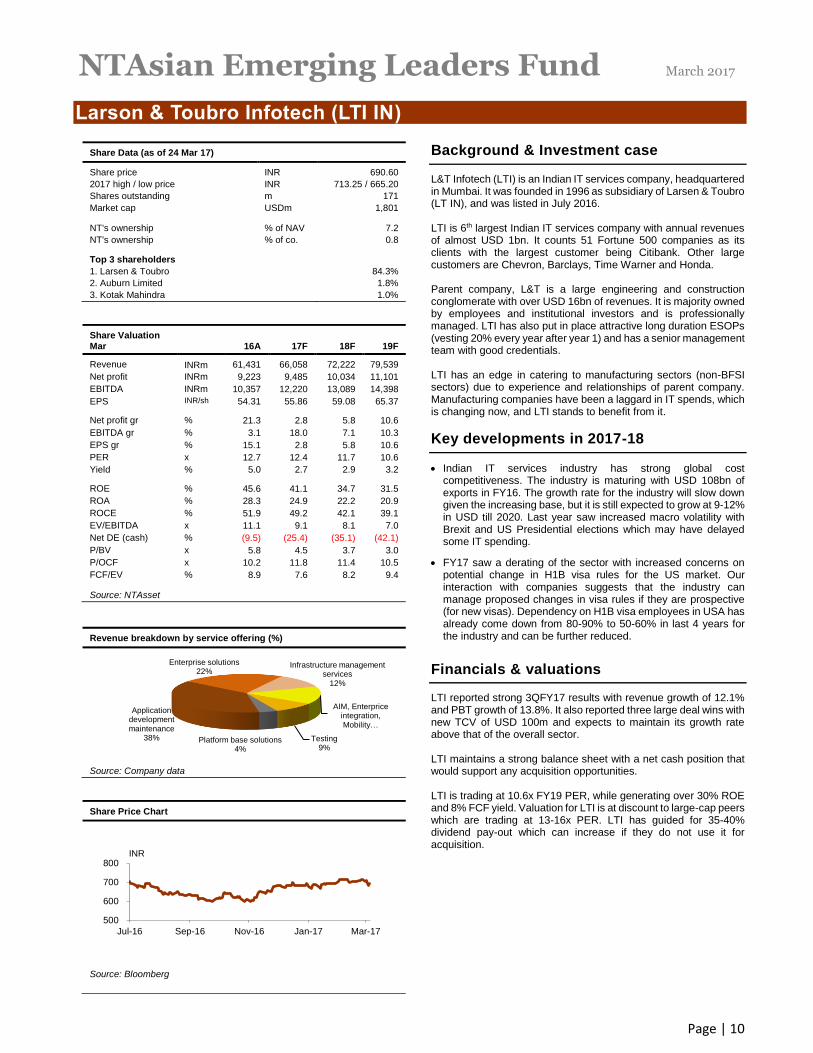
Revenue breakdown by service offering (%)
Source: Company data
Share Price Chart
Source: Bloomberg
Background & Investment case
L&T Infotech (LTI) is an Indian IT services company, headquartered in Mumbai. It was founded in 1996 as subsidiary of Larsen & Toubro (LT IN), and was listed in July 2016. LTI is 6th largest Indian IT services company with annual revenues of almost USD 1bn. It counts 51 Fortune 500 companies as its clients with the largest customer being Citibank. Other large customers are Chevron, Barclays, Time Warner and Honda. Parent company, L&T is a large engineering and construction conglomerate with over USD 16bn of revenues. It is majority owned by employees and institutional investors and is professionally managed. LTI has also put in place attractive long duration ESOPs (vesting 20% every year after year 1) and has a senior management team with good credentials. LTI has an edge in catering to manufacturing sectors (non-BFSI sectors) due to experience and relationships of parent company. Manufacturing companies have been a laggard in IT spends, which is changing now, and LTI stands to benefit from it.
Key developments in 2017-18
Indian IT services industry has strong global cost competitiveness. The industry is maturing with USD 108bn of exports in FY16. The growth rate for the industry will slow down given the increasing base, but it is still expected to grow at 9-12% in USD till 2020. Last year saw increased macro volatility with Brexit and US Presidential elections which may have delayed some IT spending.
FY17 saw a derating of the sector with increased concerns on potential change in H1B visa rules for the US market. Our interaction with companies suggests that the industry can manage proposed changes in visa rules if they are prospective (for new visas). Dependency on H1B visa employees in USA has already come down from 80-90% to 50-60% in last 4 years for the industry and can be further reduced.
Financials & valuations
LTI reported strong 3QFY17 results with revenue growth of 12.1% and PBT growth of 13.8%. It also reported three large deal wins with new TCV of USD 100m and expects to maintain its growth rate above that of the overall sector. LTI maintains a strong balance sheet with a net cash position that would support any acquisition opportunities. LTI is trading at 10.6x FY19 PER, while generating over 30% ROE and 8% FCF yield. Valuation for LTI is at discount to large-cap peers which are trading at 13-16x PER. LTI has guided for 35-40% dividend pay-out which can increase if they do not use it for acquisition.
Application development maintenance
38%
Enterprise solutions22%
Infrastructure management services
12%
AIM, Enterprice integration, Mobility…
Testing9%
Platform base solutions4%
500
600
700
800
Jul-16 Sep-16 Nov-16 Jan-17 Mar-17
INR
NTAsian Emerging Leaders Fund March 2017
Page | 11
Hanon Systems (018880 KS)
Share Data (as of 24 Mar 17)
Share price KRW 9,400
2017 high / low price KRW 10,650 / 8,250
Shares outstanding m 534
Market cap USDm 4,470
NT's ownership % of NAV 6.8
NT's ownership % of co. 0.3
Top 3 shareholders
1. Hahn & Co Auto Holdings 50.5%
2. Hankook Tire 19.5%
3. National Pension Service 5.0%
Share Valuation Dec 15A 16A 17F 18F
Revenue KRWbn 5,558 5,704 6,029 6,296
Net profit KRWbn 231 292 367 412
EBITDA KRWbn 533 864 710 774
EPS KRW/sh 432 547 687 771
Net profit gr % (16.3) 26.7 12.8 12.2
EBITDA gr % (3.0) 62.1 9.3 9.1
EPS gr % (16.3) 26.7 12.8 12.2
PER x 21.8 17.2 13.7 12.2
Yield % 2.1 2.4 2.9 3.2
ROE % 13.7 16.4 17.5 17.5
ROA % 6.9 8.0 9.7 10.1
ROCE % 17.3 19.7 21.8 21.9
EV/EBITDA x 9.3 6.1 6.4 5.6
Net DE (cash) % (2.9) 11.7 (20.1) (27.8)
PBV x 2.9 2.7 2.3 2.0
P/OCF x 11.6 28.2 9.8 8.9
FCF/EV % 4.2 (0.5) 6.7 8.5
Source: NTAsset
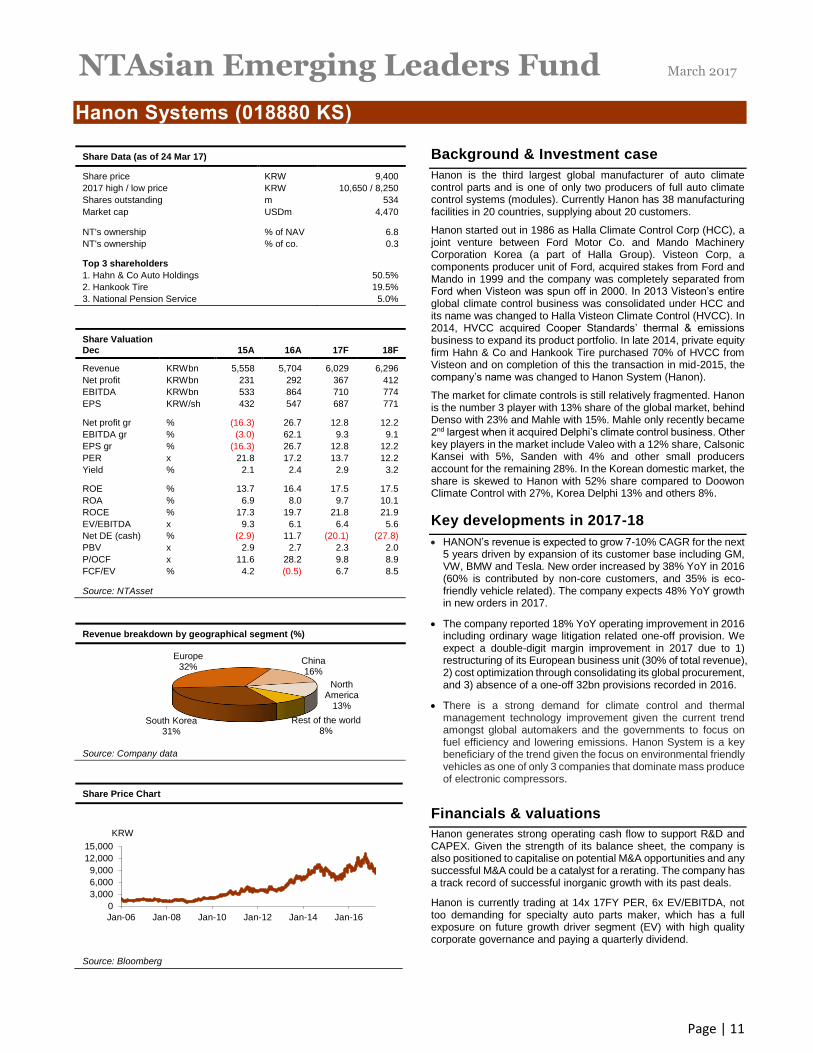
Revenue breakdown by geographical segment (%)
Source: Company data
Share Price Chart
Source: Bloomberg
Background & Investment case
Hanon is the third largest global manufacturer of auto climate control parts and is one of only two producers of full auto climate control systems (modules). Currently Hanon has 38 manufacturing facilities in 20 countries, supplying about 20 customers.
Hanon started out in 1986 as Halla Climate Control Corp (HCC), a joint venture between Ford Motor Co. and Mando Machinery Corporation Korea (a part of Halla Group). Visteon Corp, a components producer unit of Ford, acquired stakes from Ford and Mando in 1999 and the company was completely separated from Ford when Visteon was spun off in 2000. In 2013 Visteon’s entire global climate control business was consolidated under HCC and its name was changed to Halla Visteon Climate Control (HVCC). In 2014, HVCC acquired Cooper Standards’ thermal & emissions business to expand its product portfolio. In late 2014, private equity firm Hahn & Co and Hankook Tire purchased 70% of HVCC from Visteon and on completion of this the transaction in mid-2015, the company’s name was changed to Hanon System (Hanon).
The market for climate controls is still relatively fragmented. Hanon is the number 3 player with 13% share of the global market, behind Denso with 23% and Mahle with 15%. Mahle only recently became 2nd largest when it acquired Delphi’s climate control business. Other key players in the market include Valeo with a 12% share, Calsonic Kansei with 5%, Sanden with 4% and other small producers account for the remaining 28%. In the Korean domestic market, the share is skewed to Hanon with 52% share compared to Doowon Climate Control with 27%, Korea Delphi 13% and others 8%.
Key developments in 2017-18
HANON’s revenue is expected to grow 7-10% CAGR for the next 5 years driven by expansion of its customer base including GM, VW, BMW and Tesla. New order increased by 38% YoY in 2016 (60% is contributed by non-core customers, and 35% is eco-friendly vehicle related). The company expects 48% YoY growth in new orders in 2017.
The company reported 18% YoY operating improvement in 2016 including ordinary wage litigation related one-off provision. We expect a double-digit margin improvement in 2017 due to 1) restructuring of its European business unit (30% of total revenue), 2) cost optimization through consolidating its global procurement, and 3) absence of a one-off 32bn provisions recorded in 2016.
There is a strong demand for climate control and thermal management technology improvement given the current trend amongst global automakers and the governments to focus on fuel efficiency and lowering emissions. Hanon System is a key beneficiary of the trend given the focus on environmental friendly vehicles as one of only 3 companies that dominate mass produce of electronic compressors.
Financials & valuations
Hanon generates strong operating cash flow to support R&D and CAPEX. Given the strength of its balance sheet, the company is also positioned to capitalise on potential M&A opportunities and any successful M&A could be a catalyst for a rerating. The company has a track record of successful inorganic growth with its past deals.
Hanon is currently trading at 14x 17FY PER, 6x EV/EBITDA, not too demanding for specialty auto parts maker, which has a full exposure on future growth driver segment (EV) with high quality corporate governance and paying a quarterly dividend.
South Korea31%
Europe32%
China16%
North America
13%
Rest of the world8%
0
3,000
6,000
9,000
12,000
15,000
Jan-06 Jan-08 Jan-10 Jan-12 Jan-14 Jan-16
KRW
NTAsian Emerging Leaders Fund March 2017
Page | 12
Cosmo Lady (2298 HK)
Share Data (as of 24 Mar 17)
Share price HKD 2.36
2017 high / low price HKD 3.02 / 2.08
Shares outstanding m 1,906
Market cap USDm 653
NT's ownership % of NAV 6.7
NT's ownership % of co. 2.4
Top 3 shareholders
1. Harmonious Composition Investment 21.4%
2. Prime Capital Management 8.2%
3. Capital Today Investment 7.0%
Share Valuation Dec 15A 16A 17F 18F
Revenue CNYm 4,953 4,512 4,753 5,322
Net profit CNYm 540 242 415 480
EBITDA CNYm 770 328 667 774
EPS CNY/sh 0.28 0.13 0.22 0.25
Net profit gr % 27.0 (55.2) 71.7 15.5
EBITDA gr % 28.1 (57.4) 103.3 16.0
EPS gr % 13.9 (55.1) 71.5 15.5
PER x 7.4 16.5 9.6 8.3
Yield % 3.7 2.1 3.7 4.3
ROE % 22.1 9.1 14.6 15.2
ROA % 17.3 6.7 10.6 11.3
ROCE % 29.1 11.9 18.4 19.3
EV/EBITDA x 3.9 10.3 4.2 3.2
Net DE (cash) % (36.4) (22.6) (40.3) (45.7)
P/BV x 1.5 1.5 1.3 1.2
P/OCF x 9.7 n/a 5.0 7.4
FCF/EV % 7.3 (4.8) 23.3 17.6
Source: NTAsset
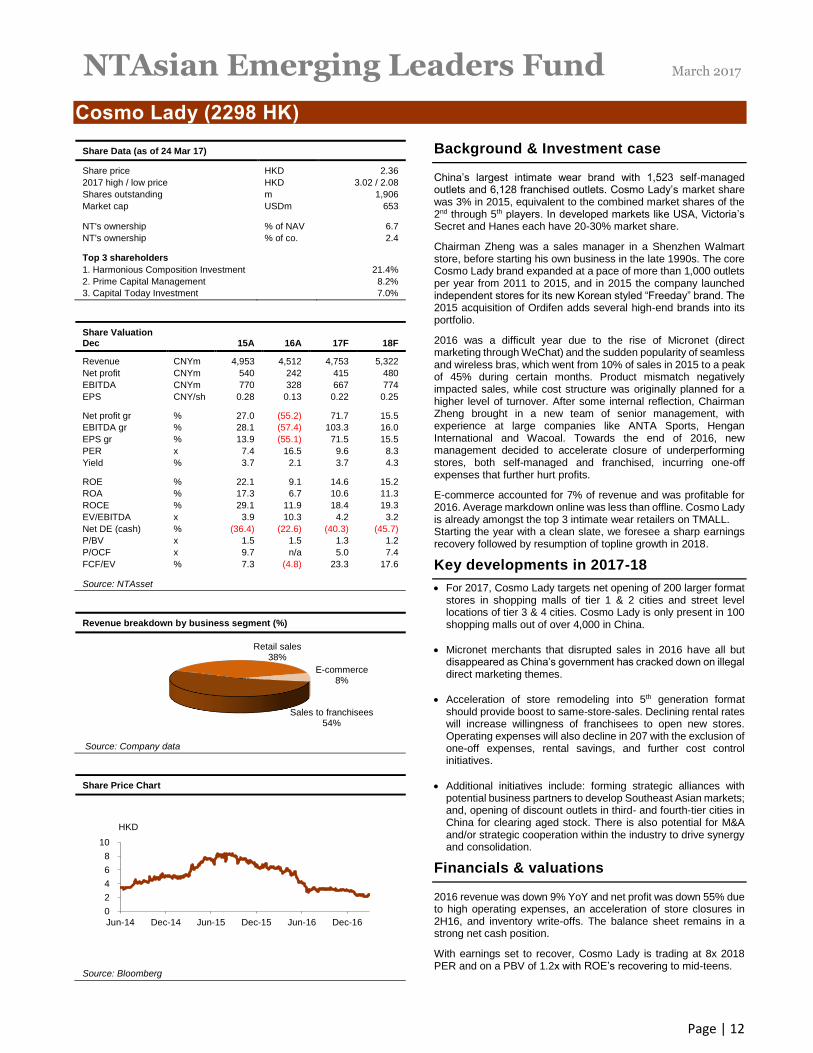
Revenue breakdown by business segment (%)
Source: Company data
Share Price Chart
Source: Bloomberg
Background & Investment case
China’s largest intimate wear brand with 1,523 self-managed outlets and 6,128 franchised outlets. Cosmo Lady’s market share was 3% in 2015, equivalent to the combined market shares of the 2nd through 5th players. In developed markets like USA, Victoria’s Secret and Hanes each have 20-30% market share.
Chairman Zheng was a sales manager in a Shenzhen Walmart store, before starting his own business in the late 1990s. The core Cosmo Lady brand expanded at a pace of more than 1,000 outlets per year from 2011 to 2015, and in 2015 the company launched independent stores for its new Korean styled “Freeday” brand. The 2015 acquisition of Ordifen adds several high-end brands into its portfolio.
2016 was a difficult year due to the rise of Micronet (direct marketing through WeChat) and the sudden popularity of seamless and wireless bras, which went from 10% of sales in 2015 to a peak of 45% during certain months. Product mismatch negatively impacted sales, while cost structure was originally planned for a higher level of turnover. After some internal reflection, Chairman Zheng brought in a new team of senior management, with experience at large companies like ANTA Sports, Hengan International and Wacoal. Towards the end of 2016, new management decided to accelerate closure of underperforming stores, both self-managed and franchised, incurring one-off expenses that further hurt profits.
E-commerce accounted for 7% of revenue and was profitable for 2016. Average markdown online was less than offline. Cosmo Lady is already amongst the top 3 intimate wear retailers on TMALL. Starting the year with a clean slate, we foresee a sharp earnings recovery followed by resumption of topline growth in 2018.
Key developments in 2017-18
For 2017, Cosmo Lady targets net opening of 200 larger format stores in shopping malls of tier 1 & 2 cities and street level locations of tier 3 & 4 cities. Cosmo Lady is only present in 100 shopping malls out of over 4,000 in China.
Micronet merchants that disrupted sales in 2016 have all but disappeared as China’s government has cracked down on illegal direct marketing themes.
Acceleration of store remodeling into 5th generation format should provide boost to same-store-sales. Declining rental rates will increase willingness of franchisees to open new stores. Operating expenses will also decline in 207 with the exclusion of one-off expenses, rental savings, and further cost control initiatives.
Additional initiatives include: forming strategic alliances with potential business partners to develop Southeast Asian markets; and, opening of discount outlets in third- and fourth-tier cities in China for clearing aged stock. There is also potential for M&A and/or strategic cooperation within the industry to drive synergy and consolidation.
Financials & valuations
2016 revenue was down 9% YoY and net profit was down 55% due to high operating expenses, an acceleration of store closures in 2H16, and inventory write-offs. The balance sheet remains in a strong net cash position.
With earnings set to recover, Cosmo Lady is trading at 8x 2018 PER and on a PBV of 1.2x with ROE’s recovering to mid-teens.
Sales to franchisees54%
Retail sales38%
E-commerce8%
0
2
4
6
8
10
Jun-14 Dec-14 Jun-15 Dec-15 Jun-16 Dec-16
HKD
NTAsian Emerging Leaders Fund March 2017
Page | 13
Blue Bird (BIRD IJ)
Share Data (as of 24 Mar 17)
Share price IDR 3,700
2017 high / low price IDR 4,100 / 2,720
Shares outstanding m 2,502
Market cap USDm 695
NT's ownership % of NAV 6.0
NT's ownership % of co. 1.8
Top 3 shareholders
1. PT Pusaka Citra Djokosoetono 37.2%
2. Prawiro H Purnomo 9.6%
3. Djokosoetono Sigit Priawan 6.0%
Share Valuation Dec 15A 16A 17F 18F
Revenue IDRbn 5,472 4,796 4,949 5,148
Net profit IDRbn 824 507 604 703
EBITDA IDRbn 1,968 1,597 1,697 1,819
EPS IDR/sh 329 203 242 281
Net profit gr % 12.2 (38.4) 19.1 16.4
EBITDA gr % 9.6 (18.9) 6.3 7.2
EPS gr % (1.9) (38.4) 19.1 16.4
PER x 11.2 18.2 15.3 13.2
Yield % 1.8 1.6 2.6 3.0
ROE % 21.1 11.5 12.5 13.3
ROA % 11.5 7.0 8.3 9.5
ROCE % 21.4 13.8 14.5 15.6
EV/EBITDA x 5.6 6.6 6.0 5.5
Net DE (cash) % 39.9 27.3 19.7 14.6
PBV x 2.2 2.0 1.8 1.7
P/OCF x 6.3 8.0 6.7 6.6
FCF/EV % 0.9 5.9 3.9 4.3
Source: NTAsset
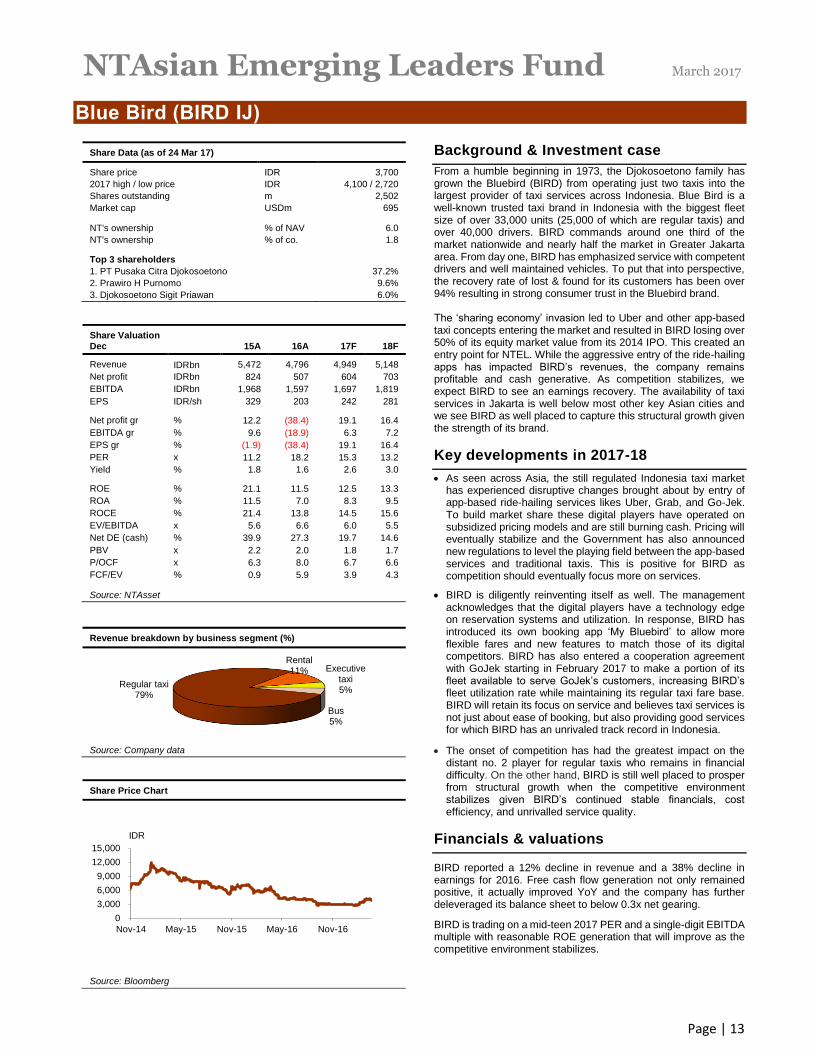
Revenue breakdown by business segment (%)
Source: Company data
Share Price Chart
Source: Bloomberg
Background & Investment case
From a humble beginning in 1973, the Djokosoetono family has grown the Bluebird (BIRD) from operating just two taxis into the largest provider of taxi services across Indonesia. Blue Bird is a well-known trusted taxi brand in Indonesia with the biggest fleet size of over 33,000 units (25,000 of which are regular taxis) and over 40,000 drivers. BIRD commands around one third of the market nationwide and nearly half the market in Greater Jakarta area. From day one, BIRD has emphasized service with competent drivers and well maintained vehicles. To put that into perspective, the recovery rate of lost & found for its customers has been over 94% resulting in strong consumer trust in the Bluebird brand. The ‘sharing economy’ invasion led to Uber and other app-based taxi concepts entering the market and resulted in BIRD losing over 50% of its equity market value from its 2014 IPO. This created an entry point for NTEL. While the aggressive entry of the ride-hailing apps has impacted BIRD’s revenues, the company remains profitable and cash generative. As competition stabilizes, we expect BIRD to see an earnings recovery. The availability of taxi services in Jakarta is well below most other key Asian cities and we see BIRD as well placed to capture this structural growth given the strength of its brand.
Key developments in 2017-18
As seen across Asia, the still regulated Indonesia taxi market has experienced disruptive changes brought about by entry of app-based ride-hailing services likes Uber, Grab, and Go-Jek. To build market share these digital players have operated on subsidized pricing models and are still burning cash. Pricing will eventually stabilize and the Government has also announced new regulations to level the playing field between the app-based services and traditional taxis. This is positive for BIRD as competition should eventually focus more on services.
BIRD is diligently reinventing itself as well. The management acknowledges that the digital players have a technology edge on reservation systems and utilization. In response, BIRD has introduced its own booking app ‘My Bluebird’ to allow more flexible fares and new features to match those of its digital competitors. BIRD has also entered a cooperation agreement with GoJek starting in February 2017 to make a portion of its fleet available to serve GoJek’s customers, increasing BIRD’s fleet utilization rate while maintaining its regular taxi fare base. BIRD will retain its focus on service and believes taxi services is not just about ease of booking, but also providing good services for which BIRD has an unrivaled track record in Indonesia.
The onset of competition has had the greatest impact on the distant no. 2 player for regular taxis who remains in financial difficulty. On the other hand, BIRD is still well placed to prosper from structural growth when the competitive environment stabilizes given BIRD’s continued stable financials, cost efficiency, and unrivalled service quality.
Financials & valuations
BIRD reported a 12% decline in revenue and a 38% decline in earnings for 2016. Free cash flow generation not only remained positive, it actually improved YoY and the company has further deleveraged its balance sheet to below 0.3x net gearing.
BIRD is trading on a mid-teen 2017 PER and a single-digit EBITDA multiple with reasonable ROE generation that will improve as the competitive environment stabilizes.
Regular taxi79%
Rental11% Executive
taxi5%
Bus5%
0
3,000
6,000
9,000
12,000
15,000
Nov-14 May-15 Nov-15 May-16 Nov-16
IDR
NTAsian Emerging Leaders Fund March 2017
Page | 14
Disclaimer
The contents of this message are intended for informational purposes only and are not for distribution to and does not constitute an offer to sell or the solicitation of any offer to buy or sell any securities to any person in any jurisdiction. While NTAsset has done its best to verify the accuracy of all information contained herein, no reliance should be placed on the information or opinions in this communication or their accuracy or completeness, for the purpose of making any investment or any other purpose. No representation, warranty or undertaking, express or implied, is given as to the information or opinions in this communication or their accuracy or completeness, by NTAsset or by their respective directors, officers, partners, employees, affiliates or agents, and no liability is accepted by any of the foregoing as to the information or opinions in this communication or their accuracy or completeness. Any investment information is intended for use by professional investors only. An offer to buy or sell any securities may only be made through offering documents in compliance with the Securities Act of 1933 or exemptive provisions there under. Past performance is not a guarantee of future returns. All investment strategies entail some risk. When an investment involves a transaction denominated in a foreign currency, it may be subject to currency fluctuations that will have an impact on the value of the investment in another currency. In addition complex tax structures and delays in distributing important tax information, differences in regulatory requirements and fees. Investments in the emerging markets involve risks not normally associated with investments in more developed and economically stable jurisdictions with more sophisticated capital markets and regulatory regimes. Such risks include political, economic and currency risks and the risk associated with investing in underdeveloped legal, regulatory and accounting environments. In addition, investments are volatile, and have limited liquidity, transparency and depth, which may make it difficult to achieve a desired purchase or sale price for investments or to purchase or sell investments at any particular time. Any investment should not be made without careful reference to the relevant Prospectus. Nothing herein shall constitute an investment recommendation or investment, accounting, tax or legal advice. All content is for informational purposes only. Index MSCI AC (All Country) Asia ex Japan Index is a free float-adjusted market capitalization weighted index that is designed to measure the equity market performance of Asia, excluding Japan. As of December 2012 the MSCI AC Asia ex Japan Index consisted of the following 10 developed and emerging market country indices: China, Hong Kong, India, Indonesia, Korea, Malaysia, Philippines, Singapore, Taiwan, and Thailand. The Fund is an actively managed portfolio as compared to the index which is unmanaged. In addition there may be significant differences between the Fund and the indices including liquidity and volatility.


![Untitled-17 [] Hanon Exercises/Hanon .pdfUntitled-17 Author: FRY'S ELECTRONICS Created Date: 9/30/2013 2:33:03 PM](https://img.pdfslide.us/doc/110x75/5fb93ce8b3e54f18f01ed2a3/untitled-17-hanon-exerciseshanon-pdf-untitled-17-author-frys-electronics.jpg)