Embed Size (px)
Citation preview

NTA TRACER STUDY OF TECHNICAL VOCATIONAL EDUCATION GRADUATES
REPORT
SUBMITTED by ERNWACA
December 2013

i
CONTENTS page
Acknowledgements iii
Acronyms iv
Executive Summary V
CHAPTER 1: INTRODUCTION AND BACKGROUND 1 1.1 Earlier developments and current state of TVET in The Gambia 1
CHAPTER 2: THE AIMS AND OBJECTIVES AND SCOPE OF WO RK OF THE TRACER STUDY OF TVET GRADUATES
4
CHAPTER 3: METHODOLOGY 5 3.1 Desk Review 5 3.2 Consultation and Interview 5 3.3 Research Approach 5 3.4 Target Group 6 3.5 Sample Frame and Size 6 3.5.1 Sample Frame 7 3.5.2 Sample Size Determination 7 3.5.3 Selection Procedures 7 3.5.4 Design of Questionnaires and Data Collection 8 3.6 Pilot Testing 8 3.7 Data Collection 8 3.8 Data Processing 9 3.9 Data Analysis including SWOT 9 3.10 Limitations and Constraints 9 CHAPTER 4: SPECIFIC RESULT OF THE TRACER AND ASSESSMENT STUDY OF TVET GRADUATES 2009 TO 2011
10
4.1 Introduction 10 4.2 Response Rate 10 4.3 Analysis of the result of TVET Graduates (2009-2011) Performance 10 4.3.1 Profile of 2009 -2011 TVET Graduates – Distribution of TVET Graduates by LGA
of residence, LGA of birth, age group, Type of course and gender 10
4.3.2 Distribution of TVET graduates by duration of course, mode of attendance, year of completion, disability status and gender
15
4.3.3 Distribution of TVET graduates by employment status and course/programme attended, duration of course, year of completion, disability status, education level before TVET training, and gender
17
4.3.4 Distribution of employed TVET graduates by opinion on relevance, adequacy of TVET training for their jobs by gender.
21
4.3.5 Distribution of employed TVET graduates by opinion on the adequacy of the practical aspect of their TVET training by gender
23
4.3.6 Distribution of unemployed TVET graduates by difficulties to secure employment 24 4.3.7 Distribution of unemployed TVET graduates by difficulties to secure self-
employment, 25
4.3.8 Distribution of TVET graduates by employment status and opinion on availability of jobs in their residential area
25
4.3.9 Number of graduates interviewed who had to change subject area studied in TVET 26

ii
Institution 4.3.10 Job situation of TVET graduates interviewed 27 4.3.11 The need for guidance and counselling of students before the commencement of the
course 30
4.3.12 Employment status of Graduates interviewed and the type of employment (paid or self employed), employment status and by type of organisation, employed
32
4.3.13 Time-lag for graduates to get present job after TVET training and by gender 34 4.3.14 The social effects of employment or unemployment on TVET graduates interviewed 35 4.3.15 Distribution of employed TVET graduates by opinion on relevance, adequacy and
practical aspect of TVET training for their jobs by course attended 38
4.3.16 Distribution of employed TVET graduates by level of monthly salary and level of satisfaction therein
43
CHAPTER 5: EMPLOYERS OF TVET GRADUATES 2009-2011 44
5.1 Profile of employers employing TVET graduates 2009-2011 44 5.2 Employers’ level of satisfaction with skills and performance of the 2009 –
2011TVET graduates 45
5.3 Distribution of employers of TVET graduates by type of enterprise and level of satisfaction on skills, performance of employed TVET graduates
45
5.4 Distribution of employers of TVET graduates by opinion on the quality and relevance of specific courses offered at TVET training institutions
49
5.5 Type of qualification and skills preferred by employers of TVET graduates 50 CHAPTER 6: TVET TRAINING PROVIDERS 52 6.1 Profile of TVET Training Providers 52 6.2 TVET training institutions curriculum for each skill area 53 6.3 Labour market research 53 6.4 Linkages between TVET training institutions and industry 54 6.5 Quality assurance system in TVET training institutions 55 6.6 Assessment and monitoring of TVET training institutions 56 6.7 Career guidance and counseling 56 6.8 Assessment of The Capacity of TVET Training Providers 57 CHAPTER 7: SUMMARY OF SPECIFIC AND GENERAL FINDINGS OF THE TVET TRACER STUDY
59
7.1 Major specific findings TVET tracer study 59 7.2 Summary of general finding of the tracer of TVET graduates 61 7.2.1 Effectiveness and Relevance of Training to Job Market 61 7.2.2 Adequacy of Training to Present Jobs of Graduates 61 7.2.3 Quality Assurance System 62 7.2.4 Enhancing Training Programmes and Services of TVET Providers 62 7.2.5 On Innovation Regarding TVET 62 7.2.6 Network improvement between Providers and Industries 62 7.2.7 Standards and Qualification 62 CHAPTER 8: CONCLUSION 63
CHAPTER 9: RECOMMENDATION 64
References 68
APPENDIX 1: Distribution of Graduates Interviewed by TVET Institutions attended 69 APPENDIX II QUESTIONNAIRES 71

iii
Acknowledgements
The Gambia Chapter of the Educational Research Network for West and Central Africa (ERNWACA) wishes to thank the National Training Authority (NTA) and its Staff for the support and participation which they provided for during the planning and implementation of this important project. Our thanks also go to the Ministry of Trade Industry Regional Integration and Employment and United Nations Development Programme(UNDP) for providing financial support for the consultancy.
We wish to acknowledge the efficient professional services provided for by our associate consultants Mr. Abdoulie O. Bittaye, Mr Abdou A.B. Njie and Mr. Idi Ceesay
Our thanks go to all the Enumerators, Supervisors, Employers of TVET graduates, Training providers for the administration of the research instruments.
Many thanks to Haddy Sillah and Mariama Keita for providing an efficient an excellent secretarial services..
Mr. M.A. Njie
(National Co-ordinator ERNWACA Chapter)

iv
Acronyms
CRR - Central River Region
CSPRO - Census and Survey Programme
ERNWACA - Educational Research Network for West and Central Africa
GBA - Greater Banjul Area
GBOS - Gambia Bureau of Statistics
GDP - Gross Domestic Product
GoG - Government of Gambia
GSQF - Gambia Skills Qualification Framework
GTTI - Gambia Technical Training Institute
IT - Information Technology
LGA - Local Government Area
LMIS - Labour Market Information System
MoHERST - Ministry of Higher Education, Research Science and Technology
NEAP - National Employment Action Programme
NYSS - National Youths Service Scheme
NVQ - National Vocational Qualification
NTA - National Training Authority
PAGE - Programme for Accelerated Growth and Employment
SPSS - Statistical Package for Social Science
SWOT - Strengths Weaknesses Opportunities Threat
ToR - Terms of Reference
TVET - Technical Vocational Education Training
UNDP - United Nation Development Programme

v
EXECUTIVE SUMMARY One of the Major challenges facing The Gambia is the provision of a pool of well trained skilled artisans and technicians to meet the requirements of the country’s socio-economic development activities. In the last three decades, The Gambia Government developed vocational and skills training programmes as integral parts of broader strategies to promote development and employment. Many of the TVET training providers both in the public and private sectors have been producing graduates in various occupational areas and there has never been any comprehensive tracer study conducted on TVET graduates countrywide. Some of the tracer studies conducted were limited to the graduates of specific training institutions. The NTA in collaboration with the Ministry of Trade, Industry, Regional Integration and Employment saw the need to carry out a comprehensive tracer study of TVET graduates to assess the relevance and impact of current courses in meeting the labour market needs and the success of training providers in preparing trainees adequately for the job market. The NTA with funding from the United Nations Development Programme (UNDP) decided to engage the service of a consultant to undertake the assessment of the Technical Vocational Education and Training programmes conducted by TVET training providers. THE AIMS The aim of this TVET tracer study of TVET Graduates was to determine the outcomes of TVET training provided to trainees in terms of relevant skills necessary for their entry into the job market. The data, information, findings, and recommendations of the study will hopefully help to enhance the development of the TVET system, especially in the area of quality assurance control and delivery. THE METHODOLOGY The tracer study of TVET graduates and the assessment of the current courses in meeting the labour market needs was based on the following:
i. Literature review of existing relevant reports and documents on the TVET system and empirical studies.
ii. Consultation with key informants and stakeholders. iii. Field survey/interviews of representative sample of graduates, employers and
training providers, using the retrospective approach for employers of the TVET graduates and training providers respectively.
THE ACHIEVED SAMPLES AND DATA COLLECTION PROCEDURES For the retrospect approach, 1314 TVET graduates was the sample size for (2009 – 2011). However out of this target 1073 were interviewed. giving a response rate of 81.7 percent. A random sample of 34 employers of the TVET graduates for the period concerned were also interviewed for their views on the level of satisfaction with regard to TVET graduates skills and performance level, on the job, whilst another random sample of 73 TVET training institutions were selected based on the list provided by NTA. The number of training providers interviewed was 59; the remaining 14 institutions were either not functioning at the time of the survey or some of them did not have graduates for the targeted period.
vi
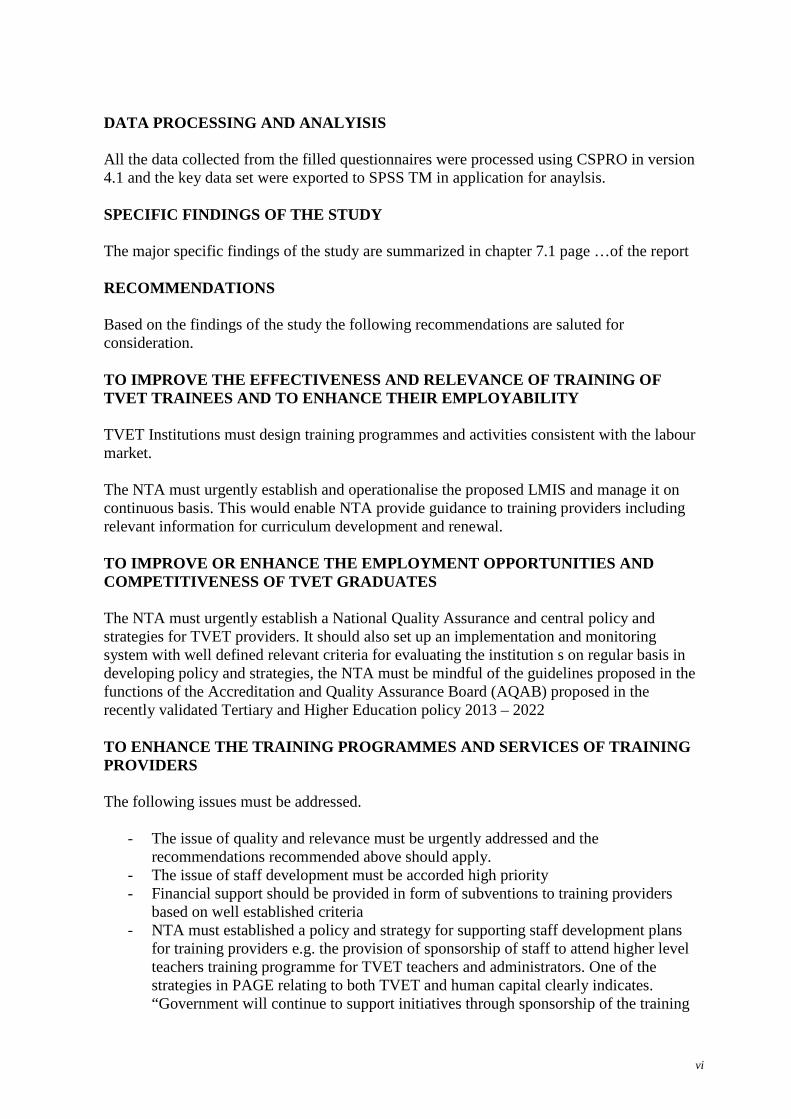
DATA PROCESSING AND ANALYISIS All the data collected from the filled questionnaires were processed using CSPRO in version 4.1 and the key data set were exported to SPSS TM in application for anaylsis. SPECIFIC FINDINGS OF THE STUDY The major specific findings of the study are summarized in chapter 7.1 page …of the report RECOMMENDATIONS Based on the findings of the study the following recommendations are saluted for consideration. TO IMPROVE THE EFFECTIVENESS AND RELEVANCE OF TRAIN ING OF TVET TRAINEES AND TO ENHANCE THEIR EMPLOYABILITY TVET Institutions must design training programmes and activities consistent with the labour market. The NTA must urgently establish and operationalise the proposed LMIS and manage it on continuous basis. This would enable NTA provide guidance to training providers including relevant information for curriculum development and renewal. TO IMPROVE OR ENHANCE THE EMPLOYMENT OPPORTUNITIES AND COMPETITIVENESS OF TVET GRADUATES The NTA must urgently establish a National Quality Assurance and central policy and strategies for TVET providers. It should also set up an implementation and monitoring system with well defined relevant criteria for evaluating the institution s on regular basis in developing policy and strategies, the NTA must be mindful of the guidelines proposed in the functions of the Accreditation and Quality Assurance Board (AQAB) proposed in the recently validated Tertiary and Higher Education policy 2013 – 2022 TO ENHANCE THE TRAINING PROGRAMMES AND SERVICES OF TRAINING PROVIDERS The following issues must be addressed.
- The issue of quality and relevance must be urgently addressed and the recommendations recommended above should apply.
- The issue of staff development must be accorded high priority - Financial support should be provided in form of subventions to training providers
based on well established criteria - NTA must established a policy and strategy for supporting staff development plans
for training providers e.g. the provision of sponsorship of staff to attend higher level teachers training programme for TVET teachers and administrators. One of the strategies in PAGE relating to both TVET and human capital clearly indicates. “Government will continue to support initiatives through sponsorship of the training

vii
initiatives are in line with and in support of government strategies to achieve growth and employment”.
STRENGTHENING THE CAPACITIES OF THE NATIONAL TRAINI NG AUTHORITY It is strongly recommended that the capacity of the personel of NTA should be strengthen through training and the provision of technical assistance. VALUABLE LESSONS FOR THE TVET SYSTEM ADAPTATION AND INNOVATION
The World Bank publication entitled “Skills Development in Sub-Saharan Africa has identified some successful interventions, in countries like Ghana, Kenya, Senegal etc and it may be useful for NTA officials to visit to study intervention and approaches in these Countries as regards skills development.
FOR THE IMPROVEMENT OF A NETWORK BETWEEN TRAINING PROVIDERS AND INDUSTRIES.
The quantitative analyses clearly suggest that there is a need for better co-ordination and support through the NTA Committee Structures. The Authority should urgently review the composition and function of its Trade Committees responsible for the development of national occupational standards. Networking between TVET training institutions and industries with the NTA serving as the “middle linking chain”. Accordingly a platform for a carefully structured networking system among institutions or institutions offering similar programmes should be established with the involvement of industries particularly in the absence of a council for Higher Education in The Gambia.
NTA must urgently develop further its National Vocational Qualification Standard into the required level indicated by the Higher Education Policy Framework
DECONCENTRATION OF TVET TRAINING INSTITUTIONS FROM THE GBA
NTA to follow up on the Ministry (MoHERST) to establish at least one TVET institution in each region in order to expand skills training in the rural areas as recommended in many reports and Government policy documents.

1
TRACER STUDY OF TECHNICAL VOCATIONAL EDUCATION GRADUATES
CHAPTER ONE
1.0 INTRODUCTION AND BACKGROUND
The Gambia is situated in the West Coast of Africa; the latest recorded population year 2003 census was 1.8 million. The provisional average growth rate between 2003-2013 is estimated at 4.2 percent per annum – a fast growing rate within the developing world. Agriculture is the main source of livelihood and the sector is associated with low productivity mainly as result of over reliance on poor technology, low and declining soil fertility, as well as structural and cultural problems, such as women’s limitation on accessing land, inadequate rural credit facilities, insufficient access to appropriate technology, inadequate supply of farm inputs and marketing constraints (UNDP). In addition to the above noted situation, the latest Government medium term socio-economic development blue print Programme For Accelerated Growth and Employment (PAGE, 2011-2015) indicates that over 50 percent of the Gambian population is under the age of 20 years. The youth population is seriously affected by poverty and high unemployment. The main policy–related issues are an uncoordinated policy and institutional framework for youth development, inadequate vocational and skills training facilities, the persistent growth in unemployment among high school leavers, dropouts, and under utilization of youth talents, resulting in youth energies being channelled into anti–social activities, (page 36 of PAGE). According to the National Development blue print, the Government believes that The Gambia’s youth population if properly managed has the potential to provide labour to all sectors which could lead to rapid growth with equity. The government strongly believes that, to address the above situation of youth unemployment (including women), it would involve training them in knowledge and skills relevant to the job market. The Agricultural Sector provides the main source of employment in The Gambia. The Manufacturing Sector which has the potential to generate employment is small and contributes only approximately 10% of the GDP. The Service Sector is dominated by the tourism and the trading sectors of the economy which contributes about 65% of the GDP. These two sectors have the potential of providing employment opportunities for the youth.
The above concerns have prompted the Government to initiate urgent policies and strategies to address the situation, recognizing the fact that “a weak human resources base and substantial shortages of relevant skilled labour will constitute a major constraint to economic growth and poverty alleviation in The Gambia” (NTA 2007 p2)
Education and skills development is therefore seen as a key priority within the country’s development objectives.
1.1 Earlier Developments and Current State of TVET in The Gambia
The Government of The Gambia has long recognized the need for a trained workforce, particularly one that possesses technological and vocational skills. In its endeavour to address the problem of youth unemployment, it had initiated over the years many policies and strategies to address the situation of early school leavers and an untrained and unskilled labour force. Both the (1975-80) and (1981-86) National Development Plans stated the following as priority objectives:

2
- Eradication of Poverty through Education and Training
- Improvement of facilities to cater for relevant vocational and technical training
- To enhanced the development of its manpower requirements.
In addition to these earlier initiatives, the present Gambia Government’s long term development Plan for socio–economic development, as incorporated in its Vision 2020 document (G.o.G 1996), has given serious consideration to and placed emphasis on; “Vocational and skills – based training and the encouragement of entrepreneurship “as a cornerstone for human resource development” coupled with “high quality academic and professional training”.
The above emphasis in the Government’s vision is embedded in the new Education policy 2004 – 2016 as well as in the Technical Act (TVET) Policy 2003. This priority is also reflected in the structures and institutions it sought to establish in order to regulate organize and supervise the TVET sub–sector. The NEAP (2003) has also set objectives to help reorient the TVET system to respond to national occupational needs. However, despite all these initiatives by the Government and the various institutions, the economic growth recorded over the years, has not resulted in reducing or alleviating poverty. The NTA Policy of (2003) indicated that poverty was partly due to the lack of skilled manpower, and the PAGE document concluded that Technical Education and Vocational Training and Skills Development
- were not strategically structured
- lacked direction
- failed to meet the need to stimulate the Country’s production growth and
- showed gaps and shortcomings in The Gambia’s TVET system that are significant, as illustrated by the recent studies below:
(1) The Adjivon “Study 2007” A study of the co–ordination of skills development with employment needs in The Gambia
Significant conclusion of this Study suggests that:
- There is a mismatch between output of training provider institutions and the requirements of employers (The job market)
- Interaction and co–ordination between training providers and employers was not in place in a formalized manner to enhance relevance.
(2) The Mapping Study of Industries in The Gambia, which included the assessment of employees, capacities, training needs and potential training providers, commissioned by the NTA and executed by “Sahel Investment” in 2008. Made the following significant findings:
- the Study indicates that 66% of the 1395 interviewed workers, had no formal training during their career development and that,

3
- most craft persons found in the industries had their training in the informal sector.
There will therefore be the need to give a serious consideration to the informal sector in future planning and development of the sector.
(3) The mapping study of Master Craftsperson’s in The Gambia (2008), including their capacities, training needs, facilities, location and resources as potential training providers.
Significant findings include:
- Evidence of lack of co–ordination and contacts between the training authorities and providers.
- Few contacts between training providers, employers and potential trainees/students (therefore the mismatch between output of the training system and the job market).
- That the traditional informal apprenticeship system is unstructured, unorganized and unsystematic.
There is therefore the need to improve the apprenticeship system, trade testing and certification of informal training programmes.
As mentioned earlier, the 2004 – 2016 National Education Policy indicates clearly Government’s commitment to the objectives highlighted earlier as regards skills development. In addition, the recently published PAGE (2011-2015) policy document under pillar No3, states “that it intends achieving the objectives it has outlined regarding human resource development, through strategies that link capacity building initiatives (such as TVET Programmes) to job market requirements by ensuring access to basic services including Education” (and relevant tertiary and higher education).
What is now apparent is that the “TVET” Sector is expected to play a very significant role with regards to the Country’s education and training system and The Gambia Government considers it as “ one of the important tools for economic prosperity” and that the NTA and the Ministry of Higher Education, Research, Science and Technology are now expected to embark on serious innovation projects to address the needs of TVET and ensure its relevance to labour market needs,
From the evaluation of the national development policies and interventions by the Government as discussed above, it is clear that the initiatives have not led to the development of a curriculum that is relevant and of high quality to will match the job market and the employment opportunities that exist including self employment, and eventually help to reduce poverty. The latest Gambia Government’s Development Blue Prints (PAGE) confirms this situation. However, recent initiatives and actions by the Government are encouraging and are worth highlighting. These include:
- The establishment of the National Training Authority (NTA) for the supervision and management of the TVET sub–sectors (such as the formal sector, the informal sector, apprenticeship and implant training).

4
- The NTA’s mandate to coordinate the quality of Technical and Vocational Education and Training and standardisation of National Qualifications.
The NTA is the regulatory body responsible for the award of National Vocational Qualifications (NVQ) in collaboration with Education and Training Establishments and with employers in The Gambia. They have now developed a “Gambian Skills Qualification Framework” “(GSQF) to guide and regulate skills qualification and their levels in the country, and is in the process of establishing a “labour market information system” (LMIS).
The challenge now is the implementation of the strategies and work plan the NTA has in place and to execute its mandate and role as accorded by authority enshrined in the 2003 Act establishing the NTA.
CHAPTER TWO
2.0 THE AIMS AND OBJECTIVES AND SCOPE OF WORK OF TH E TRACER OF TVET GRADUATES STUDY
The reform of The Gambia TVET system in 2006 was undertaken to improve the Quality Assurance and delivery of TVET and to provide the trainees with the skills necessary for their entry into the labour market. It also caters for a career in life and encourages lifelong learning. Specifically, the reform is TVET demand-driven, accessible, affordable, and quality assured
This Tracer Study aims to determine the outcomes of TVET trainings provided to graduates in terms of employment rate, earnings, and retention rates after employment, regional distribution, and other relevant factors.
The overall objective is to evaluate the impact of the training programmes on the graduates’ training relevance to job markets, and to assess the employment status of the graduates.
This study includes among others the following:
1. Assessing the impact of training programmes’ 2. Assessing the performance of graduates 3. Identifies gaps in the training offered 4. To make recommendations for future training programmes, including higher level
programmes and fields of training.
It was therefore important to carry out this study to inform the planning and quality assurance efforts of the TVET system. The data and information to be provided would require suitable methodology not only to ensure the correct data collection, and analysis, but also to provide valuable lessons and feed back into the TVET system to enable adaptation and innovation. The information would be further used to establish the effectiveness and relevance of TVET.

5
CHAPTER THREE
3.0 METHODOLOGY
3.1 DESK REVIEW
Relevant literature was reviewed including Reports, Policy documents relating to TVET, Curricular of Training providers and NTA’s GSQF.
The documentary sources include:
- The TVET Policy (including the NTA Act of 2002) - The report on the Coordination of Skills Development with Employment in The
Gambia (Adjivon, 2007) - The Gambia Skills Qualification Framework - The Survey of Skills Centres in The Gambia (Benett, 1997) - Skills Development in sub-Saharan African (the World Bank 2004) - PAGE document - Ministry of Higher Education, Research Science and Technology (MoHERST) report
on tracer study of graduates of public institutions. - Mapping Studies of Industries in The Gambia - Mapping Study of Master Craft persons - Tracer Study of GTTI Graduates 2013 - Draft Tertiary and Higher Education Policy 2013 – 2022 - Skills Gap Analysis for out of school youths in CRR North and Kombo North
Districts
3.2 CONSULTATION AND INTERVIEWS
Prior to the commencement of the study, a consultation meeting with NTA and Training providers was held at the conference room of the Authority. The consultants presented to the meeting their strategies and plans for the implementation of the project, and as stakeholders that will benefit from the findings and recommendation of the study, the consultant appealed to them to give their full support and cooperation. They gave valuable suggestions. In addition to above consultations, the instruments developed for the study were sent to the NTA for their review and input. The Ministry of Higher Education, Research Science and Technology (MoHERST) was also consulted on the policy aspects of TVET.
3.3 RESEARCH APPROACH
ERNWACA was guided by the terms of reference and the scope of work. It was understood that the scope of work described therein was the basic minimum and an additional task that was required to enhance the deliverables of the study was undertaken.
In accordance with the primary objectives of the assignment, our team of consultants had designed and formulated a methodology for the tracer study combined with simple assessment/evaluation techniques including SWOT analysis. In each section of the study, one or more of the following aspects of the assessment was considered – skills relevance, productivity, and level to be deployed in the process of assessment.

6
For the tracer study approach, which involves actually enumerating and tracing a sample of graduates who completed their training between September 2009 to September 2011 and the assessment of the relevance of their current engagements to their respective course study, we adopted the “retrospective approach”. This involves research into appropriate files and students’ records in training institutions with homes, addresses and telephone numbers as a starting point. The main objective was to find out the medium term effects of the training experiences of former students especially the relevance of the courses to the work they are currently engaged in.
For the mapping out of all current employers of the graduates, we adopted the employer- oriented tracer study approach. This approach involved gathering evidence of employers’ perception and judgments on the graduates and the training they have received from training institutions, their effectiveness, commitment and discipline at work. An overall assessment to determine the satisfaction of the employers with regards to the level of competence and comportment was therefore undertaken.
For the self-employed graduates, a tracer and assessment study was undertaken to assess their preparedness for self-employment, performance levels and the extent to which their training has contributed to their success. In assessing preparedness, we considered a number of factors that constitute preparedness. Prominent among them are the skills and competence required for a particular job.
As regard the relevance of courses to meet the labour market demand, a review of the curricula of Training providers was also undertaken to assess their relevance.
3.4 TARGET GROUP
The target group was a sample of graduates who completed their training between
September 2009 to September 2011.
3.5 SAMPLE FRAME AND SIZE
A sample frame was designed and sample size determined to ensure that it is adequately representative of the graduates and the training providers concerned.
The methodology/approach described above was cleared with the client. And the team of consultants proceeded to carry out comprehensive literature review of relevant reports and documents as well as interviews with relevant authorities or stakeholders.
This was followed by the design of research instrument viz questionnaires covering the parameters to be measured as per–ToR and the administration of the questionnaires through field interviews.
7
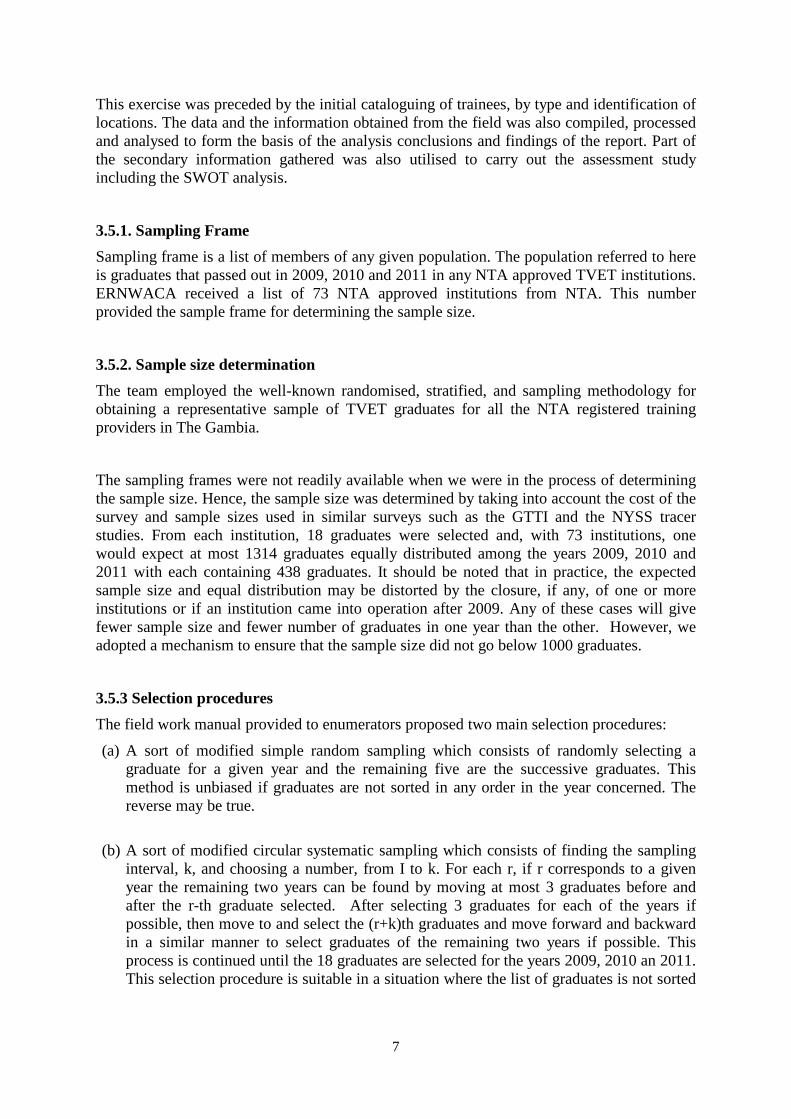
This exercise was preceded by the initial cataloguing of trainees, by type and identification of locations. The data and the information obtained from the field was also compiled, processed and analysed to form the basis of the analysis conclusions and findings of the report. Part of the secondary information gathered was also utilised to carry out the assessment study including the SWOT analysis.
3.5.1. Sampling Frame
Sampling frame is a list of members of any given population. The population referred to here is graduates that passed out in 2009, 2010 and 2011 in any NTA approved TVET institutions. ERNWACA received a list of 73 NTA approved institutions from NTA. This number provided the sample frame for determining the sample size.
3.5.2. Sample size determination
The team employed the well-known randomised, stratified, and sampling methodology for obtaining a representative sample of TVET graduates for all the NTA registered training providers in The Gambia.
The sampling frames were not readily available when we were in the process of determining the sample size. Hence, the sample size was determined by taking into account the cost of the survey and sample sizes used in similar surveys such as the GTTI and the NYSS tracer studies. From each institution, 18 graduates were selected and, with 73 institutions, one would expect at most 1314 graduates equally distributed among the years 2009, 2010 and 2011 with each containing 438 graduates. It should be noted that in practice, the expected sample size and equal distribution may be distorted by the closure, if any, of one or more institutions or if an institution came into operation after 2009. Any of these cases will give fewer sample size and fewer number of graduates in one year than the other. However, we adopted a mechanism to ensure that the sample size did not go below 1000 graduates.
3.5.3 Selection procedures
The field work manual provided to enumerators proposed two main selection procedures:
(a) A sort of modified simple random sampling which consists of randomly selecting a graduate for a given year and the remaining five are the successive graduates. This method is unbiased if graduates are not sorted in any order in the year concerned. The reverse may be true.
(b) A sort of modified circular systematic sampling which consists of finding the sampling interval, k, and choosing a number, from I to k. For each r, if r corresponds to a given year the remaining two years can be found by moving at most 3 graduates before and after the r-th graduate selected. After selecting 3 graduates for each of the years if possible, then move to and select the (r+k)th graduates and move forward and backward in a similar manner to select graduates of the remaining two years if possible. This process is continued until the 18 graduates are selected for the years 2009, 2010 an 2011. This selection procedure is suitable in a situation where the list of graduates is not sorted

8
into years. Depending on the type of distribution of graduates on the list, the enumerators were advised to select the most suitable among the two proposed selection procedures.
3.5.4 DESIGN OF QUESTIONNAIRE AND DATA COLLECTION
Three questionnaires were developed, one for graduates, the second was designed to map out and carry out assessment of all current employers of graduates, and the third questionnaire was developed to deal with TVET training providers. Based on the requirements of the study, 3 survey instruments and an interview guide were developed. They were as follows (also, see the Attachment):
The different types of instruments and their uses F1 – Self-completion questionnaires for graduates F2 – Self-completion questionnaires for employers F3 – Self-completion questionnaires for training providers An interview guide for Training Providers Use of Form F1 is to interview each graduate selected from each training provider for the targeted three years (2009 to 2011). Use of Form F2 was to interview the managers or owners of each enterprise selected. Use of Form F3 was to interview managers of Training Institutions/informal set-up. The project team examined closely the individual items in each instrument in order to ensure content validity and reliability. 3.6 PILOT TESTING
All the questionnaires were pilot-tested after their development using respective populations and a sample size of about five percent (5%) of each population.
We used print and electronic media to sensitise the graduate population and to draw them to respond to the survey.
Selected enumerators were trained for a period of 2 days to administer the questionnaires and collect the data.
3.7 DATA COLLECTION
To gather data from the field, 14 enumerators and 2 field supervisors were appointed and a two-day intensive training in the administration of the questionnaires was conducted by the consultant. Questionnaires 1, 2 and 3 were covered during the training. A field manual for enumerators and field supervisors was developed and used during the training and the field

9
work started in earnest and should have lasted for 15 working days but due to constraints beyond our control the field work had to be extended for two weeks further.
3.8 DATA PROCESSING
The data collection was processed (by computers) and analysed using the SPSS software, factor analysis, multiple regression analysis and log-liner analysis was applied and the data cross-tabulated. Depending on the structure of the questionnaires, coders were recruited to code open ended questions. Computer programmes/syntax was prepared to control and identify possible data processing errors. Separate syntax in CSPRO application was also prepared for data entry and its structural and consistency checks.
3.9 DATA ANALYSIS INCLUDING SWOT
The information and data obtained in the field was analyzed including the use of SWOT and a report compiled containing the main findings conclusions and recommendations of the study.
3.10. LIMITATIONS AND CONSTRAINTS It will be recalled that during the contract negotiations the consultant brought to the attention of the client that given the scope, the extent, and complexity of the consultancy assignment as contain in the ToR, the time allocated to the assignment was too short. This was however, increase only by two weeks which was still not adequate.
The fieldwork exercise which should have lasted for 15 working days had to be extended for two weeks to complete the data collection at the consultant’s expense. Moreover the late disbursement of funds (first and second instalment) cause serious constraints and delays in the fieldwork

10
CHAPTER FOUR: SPECIFIC RESULT OF THE TRACER AND ASSESSMENT STUDY OF TVET GRADUATES 2009 TO 2011.
4.1 Introduction
Chapter 4 provides specific results of the tracer study and specifically the assessment of TVET training programmes and the performance of TVET graduates as it related to the labour market needs. The section below provides analysis of the following:
(a) analysis of the results 2009 – 2011 TVET graduates tracer study (b) employers of TVET graduates 2009 – 2011 (c) TVET training providers’ programmes on graduates in terms of relevance of the job
market.
4.2 Response Rate
As stated earlier in the report, the expected sample size of the TVET graduates to be surveyed was 1314 equally distributed among the years 2009-2011 with each year containing 438 graduates. However a total of 1073 TVET graduates responded and interviewed giving a response rate of 81.7 percent. 4.3 Analysis of the result of TVET graduates (2009 – 2011) performance. The data obtained from the interviews and the completion of the questionnaires by TVET graduates during the field survey was analyzed and interpreted as follows:
4.3.1: Profile of 2009 – 2011 TVET graduates -- Distribution of TVET graduates by LGA of residence, LGA of birth, age group, LGA of birth, age group, Type of course and gender
Table 1: Percentage distribution of TVET graduates by LGA of residence and gender, 2013
LGA of residence of TVET graduates
Gender of TVET graduates Total
Male Female NS
Number Percent Number Percent Number Percent Number Percent
Banjul 10 .9 27 2.5 0 .0 37 3.4
Kanifing 265 24.7 356 33.2 0 .0 621 57.9
Brikama 120 11.2 171 15.9 0 .0 291 27.1
Mansakonko 17 1.6 1 .1 0 .0 18 1.7
Kerewan 10 .9 2 .2 0 .0 12 1.1
Kuntaur 3 .3 2 .2 0 .0 5 .5
Janjabureh 3 .3 7 .7 0 .0 10 .9
NS 25 2.3 53 4.9 1 .1 79 7.4
Total 453 42.2 619 57.7 1 .1 1073 100.0

11
Table 1: Percentage distribution of TVET graduates by LGA of residence and gender, 2013
LGA of residence of TVET graduates
Gender of TVET graduates Total
Male Female NS
Number Percent Number Percent Number Percent Number Percent
Banjul 10 .9 27 2.5 0 .0 37 3.4
Kanifing 265 24.7 356 33.2 0 .0 621 57.9
Brikama 120 11.2 171 15.9 0 .0 291 27.1
Mansakonko 17 1.6 1 .1 0 .0 18 1.7
Kerewan 10 .9 2 .2 0 .0 12 1.1
Kuntaur 3 .3 2 .2 0 .0 5 .5
Janjabureh 3 .3 7 .7 0 .0 10 .9
NS 25 2.3 53 4.9 1 .1 79 7.4
Total 453 42.2 619 57.7 1 .1 1073 100.0
Source: Survey of TVET Graduates, 2013
Table 1 shows the percentage distribution of TVET graduates by geographical location and sex. The table also shows that the majority of graduate respondents reside in the Kanifing Municipality and Brikama LGA, representing 57.9 percent and 27.1 percent respectively. It also shows that 33.2 percent of those residing in Kanifing are female compared to 24.7 percent male. Similarly, in Brikama, the female respondents are the majority, representing 15.5 percent and 11.2 percent male. It should be noted that the percentage distribution of respondents in other LGAs are relatively small since most of the respondent graduates are located in the GBA and Brikama coupled with the fact that there are a few TVET training institutions and limited employment opportunities in those LGAs. Moreover, most of the respondents interviewed were born in the Greater Banjul area (GBA) (see Table 2).The Mapping Study of Master Craft persons reported similar findings.

12
Table 2: Percentage distribution of TVET graduates by LGA of birth and gender, 2013
LGA of birth of TVET graduates
Gender of TVET graduates Total
Male Female NS
Number
Perc
ent Number Percent Number Percent Number Percent
Banjul 50 4.7 93 8.7 0 .0 143 13.3
Kanifing 141 13.1 242 22.6 0 .0 383 35.7
Brikama 102 9.5 133 12.4 0 .0 235 21.9
Mansakonko 45 4.2 17 1.6 0 .0 62 5.8
Kerewan 39 3.6 30 2.8 0 .0 69 6.4
Kuntaur 6 .6 9 .8 0 .0 15 1.4
Janjabureh 11 1.0 17 1.6 0 .0 28 2.6
Basse 19 1.8 5 .5 0 .0 24 2.2
NS 40 3.7 73 6.8 1 .1 114 10.6
Total 453 42.2 619 57.7 1 .1 1073 100.
0
Table 2 shows the percentage distribution of TVET graduates by LGA of birth and gender. The table indicated that most of the graduates interviewed were born mainly in Banjul, Kanifing and Brikama LGA representing 13.3 percent in Banjul, 35.7 percent in Kanifing and 21.9 percent in Brikama.
This shows that most of the school leavers born in the LGAs that are in the Provinces had little opportunity of attending TVET training institutions. This state of affairs highlights the need to provide more TVET training institution in the rural areas. The PAGE and the Draft Tertiary and Higher Education Policy 2013-2022 advocated that such a policy and programme should be put in place.

13
According to table 3 above, the majority of the graduate respondents were within the youth age group of 20 to 29 years representing 79.4 percent. The table also shows that the majority of respondents are female representing 49.2 percent compared to 30.1 percent male.
Table 3: Percentage distribution of TVET graduates by age group and gender, 2013
Age of owner of enterprise
Gender of TVET graduates Total
Male Female NS
Number Percent Number Percent Number Percent Number Percent
15-19 9 .8 25 2.3 0 .0 34 3.2
20-24 143 13.3 364 33.9 0 .0 507 47.3
25-29 180 16.8 164 15.3 0 .0 344 32.1
30-34 54 5.0 40 3.7 0 .0 94 8.8
35-39 22 2.1 9 .8 0 .0 31 2.9
40-44 17 1.6 4 .4 0 .0 21 2.0
45-49 5 .5 2 .2 0 .0 7 .7
50-54 2 .2 0 .0 0 .0 2 .2
55-59 2 .2 0 .0 0 .0 2 .2
Missing/DK 19 1.8 11 1.0 1 .1 31 2.9
Total 453 42.2 619 57.7 1 .1 1073 100.0
Source: Survey of TVET Graduates, 2013

14
Table 4: Percentage distribution of TVET graduates by Type of course and gender, 2013
Type of course
Gender of TVET graduates Total
Male Female NS
Number
Percen
t Number Percent Number Percent Number Percent
Arts, craft and humanities 9 2.0 11 1.8 0 .0 20 1.9
Social and behavioural science, journalism and information 5 1.1 2 .3 0 .0 7 .7
Business management and public administration 108 23.8 155 25.0 0 .0 263 24.5
Secretarial office job 1 .2 16 2.6 0 .0 17 1.6
Law and legal affairs 0 .0 8 1.3 0 .0 8 .7
Computing, IT, ITC 189 41.7 199 32.1 0 .0 388 36.2
Repairs and maintenance of vehicles, electrical and electronic engineering
17 3.8 4 .6 0 .0 21 2.0
Manufacturing 15 3.3 68 11.0 0 .0 83 7.7
Construction, Architectural draftmanship, Civil engineering 36 7.9 5 .8 0 .0 41 3.8
Agriculture and Health 2 .4 0 .0 0 .0 2 .2
Social and personal services 4 .9 62 10.0 0 .0 66 6.2
Tourism, Hospitality, Travelling, Hotel and Catering 38 8.4 57 9.2 0 .0 95 8.9
Other courses 20 4.4 26 4.2 0 .0 46 4.3
Not applicable or Not stated 9 2.0 6 1.0 1 100.0 16 1.5
Total 453 100.0 619 100.0 1 100.0 1073 100.0
Source: Survey of TVET Graduates, 2013
Table 4 shows that the majority of graduates interviewed attended courses in Business Management, Public Administration, Computing, IT and Tourism and Hospitality. This confirms the finding of previous Tracer Study on TVET graduates (G.T.T.I 2013 and Skill Gap Analysis 2013), which indicated significant number of training providers in the country and in particular the private TVET training providers, are concentrating mainly in commercial and business studies. Very few of these training providers provide technical skills training and development programmes. This situation described above was also confirmed in 2002 by a study entitled: TVET Draft Policy (2002).It concluded that there has been a significant increase in private TVET centres, but they are mainly in the commercial and I.T areas. The reason for this situation is associated with the high cost of establishing skills centres with the appropriate technical equipment needed to produce quality and relevant graduates.

15
An observation from other studies, with a high number of respondents stated that the “Training they had received was relevant. Similarly the responses of employers, when asked if they had found the graduates’ performance adequate, their responses were positive. It should be rated that most of these graduates were mainly working in the commercial sector. However these studies had opposite results for graduates in the engineering and construction areas. In Table 4, most of the graduate respondents attending TVET programmes graduated in Business Management, Public Administration and IT and according to the table the majority of the graduate respondents in these areas mentioned above are females.
It could be noted that technical programmes are expensive to run and required substantial resources for investment in equipment, training materials, tools and qualified personnel.
4.3.2: Distribution of TVET graduates by duration of course, mode of attendance, year of completion, disability status and gender
Table 5: Percentage distribution of TVET graduates by duration of course and gender, 2013
Duration of course in months
Gender of TVET graduates Total
Male Female NS
Number Percent Number Percent Number Percent Number Percent
0 - 5 months 76 16.8 83 13.4 0 .0 159 14.8
6 months 146 32.2 194 31.3 0 .0 340 31.7
9 months 41 9.1 63 10.2 0 .0 104 9.7
12 months 34 7.5 81 13.1 0 .0 115 10.7
18 months 23 5.1 50 8.1 0 .0 73 6.8
24 months 46 10.2 44 7.1 0 .0 90 8.4
36 months 38 8.4 53 8.6 0 .0 91 8.5
Other months 42 9.3 42 6.8 0 .0 84 7.8
NS 7 1.5 9 1.5 1 100.0 17 1.6
Total 453 100.0 619 100.0 1 100.0 1073 100.0
Source: Survey of TVET Graduates, 2013
Table 5 provides the data on the percentage distribution of TVET graduates by duration of courses. The table shows that the majority of the graduates interviewed attended courses with duration of 0-6 months representing 46.5 percent. Most of these short duration courses are mainly Business and IT programmes which once completed allow graduates to seek for employment in the commercial and business sector. Moreover, commercial programmes are easier to modularize for competence-based learning.

16
This grouping is followed by those who completed their courses within 12 months, representing 10.7 percent. Table 6: Distribution of TVET graduates by mode of attending course
Mode of attending Number Percent
Full -Time 932 86.9
Part -Time 119 11.1
Day release 1 1
NS 21 2.0
Total 1073 100.0
Table 6 shows that 86.9 percent of the respondents attended courses on full-time basis compared to 11.1 percent part-time and 0.1 percent Day-release.
Table 7: Distribution of TVET graduates by year of co mpletion
Year of completion Number Percent
NS 1 .1
2009 175 16.3
2010 354 33.0
2011 543 50.6
Total 1073 100.0
Table 7 above shows that the majority of the respondents graduated in 2011, representing 50.6 percent of graduates interviewed
Table 8: Distribution of TVET graduates by disability status, 2013
Disability status Number Percent
Yes 9 .8
No 1031 96.1
NS 33 3.1
Total 1073 100.0

17
The survey result at Table 8 shows that only 0.8 percent of the respondents indicated that they have disability compared to 96.1 percent who indicated that they do not have any form of disability.
4.3.3: Distribution of TVET graduates by employment status and course/programme attended, duration of course, year of completion, disability status, education level before TVET training, and gender
Table 9: Percentage distribution of TVET graduates by employment status and gender, 2013
Employment and unemployment
Gender of TVET graduates Total
Male Female NS
Number Percent Number Percent Number Percent Number Percent
Employed 199 43.9 173 27.9 0 .0 372 34.7
Unemployed 250 55.2 443 71.6 0 .0 693 64.6
NS 4 .9 3 .5 1 100.0 8 .7
Total 453 100.0 619 100.0 1 100.0 1073 100.0
Source: Survey of TVET Graduates, 2013
Table 9 above, shows the percentage distribution of TVET graduates by employment status and gender. The table shows that, 64.6 percent of the respondents were unemployed compared to 34.7 percent who were employed. The Table also indicated that a very high percentage of female respondents were unemployed representing 63.9 percent of total unemployed graduate respondents. The high unemployment rate of graduates is reflective of the high unemployment rate of the country, which according to The Gambia Integrated Household survey 2010 conducted by GBOS shows that 25 percent of the national labour force was unemployed. Some of the contributing factors to the high unemployment as indicated in NEAP, PAGE the Adjivon study are related to the following:
1. Lack of an LMIS (Labour Market Information System) 2. Mismatch between training providers out-put and Job requirements in the market. 3. Programmes offered by the institutions are not market-demand driven.
A serious examination of the situation highlighted above is therefore urgently required.

18
Table 10 : Percentage distribution of TVET graduates by employment status and course/programme attended, 2013
Employment and unemployment Total
Employed Unemployed NS
Number Percent Number Percent Number Percent Number Percent
Arts, craft and humanities 8 2.2 12 1.7 0 .0 20 1.9
Social and behavioural science, Journalism and information 5 1.3 2 .3 0 .0 7 .7
Business management and public administration 106 28.5 154 22.2 3 37.5 263 24.5
Secretarial office job 9 2.4 8 1.2 0 .0 17 1.6
Law and legal affairs 0 .0 8 1.2 0 .0 8 .7
Computing, IT, ITC 107 28.8 280 40.4 1 12.5 388 36.2
Repairs and maintenance of vehicles, electrical and electronic engineering 10 2.7 11 1.6 0 .0 21 2.0
Manufacturing 24 6.5 58 8.4 1 12.5 83 7.7
Construction, Architectural craftsmanship, Civil engineering 16 4.3 25 3.6 0 .0 41 3.8
Agriculture and Health 0 .0 2 .3 0 .0 2 .2
Social and personal services 25 6.7 41 5.9 0 .0 66 6.2
Tourism, Hospitality, Travelling, Hotel and Catering 34 9.1 61 8.8 0 .0 95 8.9
Other courses 23 6.2 23 3.3 0 .0 46 4.3
Not applicable or Not stated 5 1.3 8 1.2 3 37.5 16 1.5
Total 372 100.0 693 100.0 8 100.0 1073 100.0
Source: Survey of TVET Graduates, 2013
Table 10 shows the percentage distribution of TVET graduates by employment status and course/programme attended. The table shows that a high percentage of unemployed respondents attended Computer and IT courses representing 40.4 percent of the 693 unemployed respondents interviewed, followed by those who did Business Management and Public Administration representing 22.2 percent of the total unemployed respondents. The main reasons for the high unemployment among graduates that attend Computer IT courses are that most of these courses are foundation courses which provide basic IT literacy.

19
Table 11 : Percentage distribution of TVET graduates by employment status and duration of course, 2013
Employment and unemployment Total
Employed Unemployed NS
Number Percent Number Percent Number Percent Number Percent
Duration of course
in months
0 - 5 months 45 12.1 114 16.5 0 .0 159 14.8
6 months 114 30.6 224 32.3 2 25.0 340 31.7
9 months 42 11.3 62 8.9 0 .0 104 9.7
12 months 38 10.2 77 11.1 0 .0 115 10.7
18 months 10 2.7 62 8.9 1 12.5 73 6.8
24 months 45 12.1 45 6.5 0 .0 90 8.4
36 months 45 12.1 46 6.6 0 .0 91 8.5
Other months 27 7.3 55 7.9 2 25.0 84 7.8
NS 6 1.6 8 1.2 3 37.5 17 1.6
Total 372 100.0 693 100.0 8 100.0 1073 100.0
Source: Survey of TVET Graduates, 2013
Table 11 above shows that a high percentage of both employed and unemployed graduate respondents attended courses with duration 0-6 months representing 46.5 percent of the total number of graduates interviewed. These respondents are mainly in the commercial sector (IT and Business Management). It should be noted that all the technical skills programmes have duration of at least one year or more.
Table 12 : Percentage distribution of TVET graduates by employment status and year of completion, 2013
Year of completion
Employment and unemployment Total
Employed Unemployed NS
Number Percent Number Percent Number Percent Number Percent
NS 0 .0 0 .0 1 12.5 1 .1
2009 78 21.0 95 13.7 2 25.0 175 16.3
2010 135 36.3 218 31.5 1 12.5 354 33.0
2011 159 42.7 380 54.8 4 50.0 543 50.6
Total 372 100.0 693 100.0 8 100.0 1073 100.0
Source: Survey of TVET Graduates, 2013

20
Table 12 above presents the data on percentage distribution of respondent TVET graduates’ employment status and year of completion. The table shows that there were more TVET graduates in 2011 with high unemployment rate of 35.4 percent of the total graduate respondents. It also shows that out of the number interviewed (n=1073) 14.8 percent of the graduate respondents were employed. Table 12b: Time series of employment rates of TVET graduates , 2009 - 2011
Year Employment rate Total
Number Percent Number Percent
NS 0 .0 1 .1
2009 78 44.6 175 16.3
2010 135 33.1 354 33.0
2011 159 29.3 543 50.6
372 34.7 1073 100.0
The overall employment rate of TVET graduates for the period 2009 – 2011 was 34.7 percent. However, the rate differs from one year to another year. In 2009, the employment rate of TVET graduates was 44.6 percent. The employment rate of TVET graduates declined successively during the periods 2010 and 2011.
Table 13 : Percentage distribution of TVET graduates b y employment status and disability status, 2013
Do you have any form of disability
Employment and unemployment Total
Employed Unemployed NS
Number Percent Number Percent Number Percent Number Percent
Yes 6 1.6 3 .4 0 .0 9 .8
No 356 95.7 671 96.8 4 50.0 1031 96.1
NS 10 2.7 19 2.7 4 50.0 33 3.1
Total 372 100.0 693 100.0 8 100.0 1073 100.0
Source: Survey of TVET Graduates, 2013
Table 13 indicates that out of the 9 graduate respondents who confirmed that they have disabilities, 6 were employed and 3 were unemployed, indicating that people with disability no longer have much barrier or constraints in obtaining employment
21
Table 14 : Percentage distribution of TVET graduates b y employment status and education level before TVET t raining,
2013
Employment and unemployment Total
Employed Unemployed NS
Number Percent Number Percent Number Percent Number Percent
level of
education
before TVET
‘Early Childhood’ 1 .3 4 .6 0 .0 5 .5
Primary School (Grade 1-6)
4 1.1 4 .6 0 .0 8 .7
Junior Secondary School (Grade7-9)
51 13.7 106 15.3 1 12.5 158 14.7
Senior Secondary school (Grade 10-12); High School (Cambridge International Examination)
270 72.6 536 77.3 3 37.5 809 75.4
Tertiary – after high school diploma, certificates
26 7.0 13 1.9 0 .0 39 3.6
Tertiary – degree 1 .3 0 .0 0 .0 1 .1
Other 1 .3 7 1.0 0 .0 8 .7
NS 18 4.8 23 3.3 4 50.0 45 4.2
Total 372 100.0 693 100.0 8 100.0 1073 100.0
Source: Survey of TVET Graduates, 2013
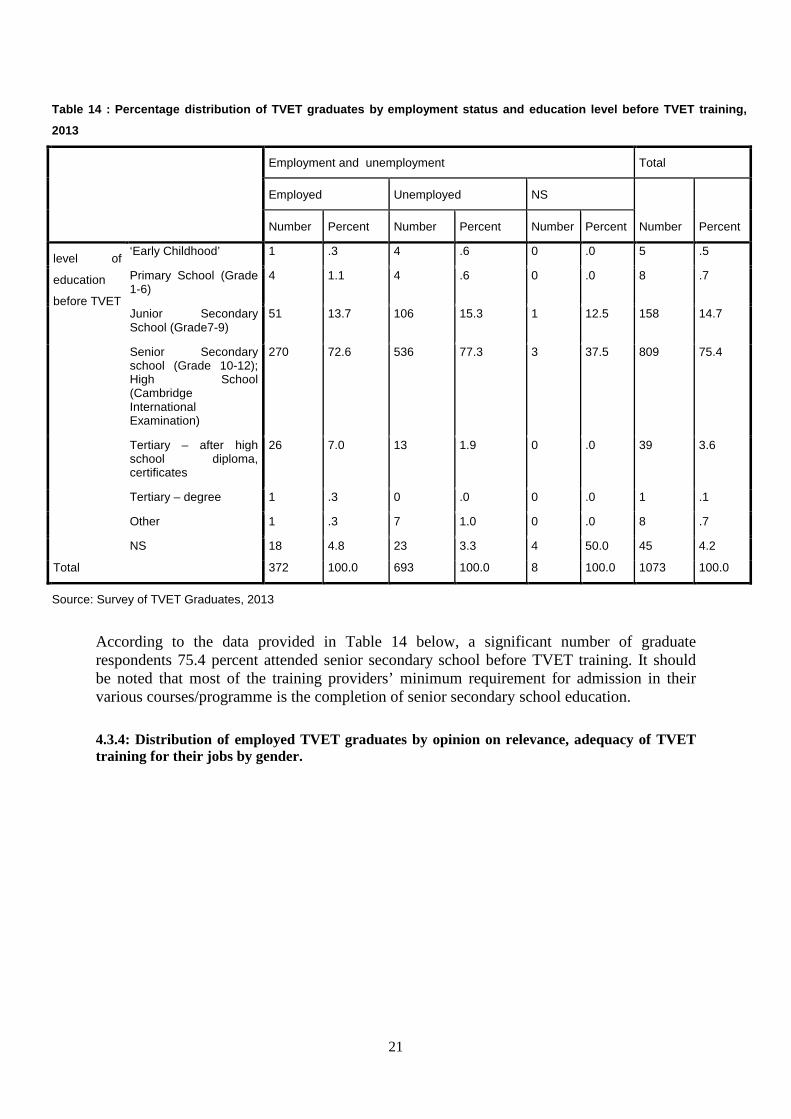
According to the data provided in Table 14 below, a significant number of graduate respondents 75.4 percent attended senior secondary school before TVET training. It should be noted that most of the training providers’ minimum requirement for admission in their various courses/programme is the completion of senior secondary school education.
4.3.4: Distribution of employed TVET graduates by opinion on relevance, adequacy of TVET training for their jobs by gender.

22
Table 15 : Percentage distribution of employed TVET gr aduates by opinion on relevance of TVET training for
their jobs by gender, 2013
Gender of TVET graduates Total
Male Female
Number Percent Number Percent Number Percent
Graduates The job is the same as that
for which I was trained
74 37.2 92 53.2 166 44.6
The job is highly relevant
and related to the training
49 24.6 24 13.9 73 19.6
The training has served as a
foundation for the job
20 10.1 14 8.1 34 9.1
The job is not the same as
that for which I .was trained
43 21.6 32 18.5 75 20.2
NS 13 6.5 11 6.4 24 6.5
Total 199 100.0 173 100.0 372 100.0
Source: Survey of TVET Graduates, 2013
Table 15 presents the data on the distribution of graduate respondents who received training by relationship of training to job. The table shows that 44.6 percent of graduate respondents indicated that their job is the same as that for which they were trained and 19.6 percent said that their job is highly related to their training. However a significant number (n=75) of the respondents representing 20.2 percent stated that the job was not the same as that for which they were trained. It should be noted that most of the graduate respondents found employment in the commercial and business enterprises including I.C. T (see table 4) and as indicated earlier in the report most of the training providers offer courses in the commercial and business areas.

23
Table 16 : Percentage distribution of employed TVET gr aduates by opinion on adequacy of TVET training
for their jobs by gender, 2013
Gender of TVET graduates Total
Male Female
Number Percent Number Percent Number Percent
Graduates' opinion on
adequacy of training taking
into account needs of job
Yes 143 71.9 140 80.9 283 76.1
No 36 18.1 23 13.3 59 15.9
NS 20 10.1 10 5.8 30 8.1
Total 199 100.0 173 100.0 372 100.0
Source: Survey of TVET Graduates, 2013
Table 16 provides the data on the percentage distribution of employed TVET graduates by opinion on the adequacy of TVET training for their jobs. Majority (76.1 percent) of respondents indicated that their TVET training was adequate for their present job, whereas 15.9 percent of graduate respondents indicated that their training was not adequate for their present job. As mentioned above, most of those graduate respondents who indicated that their TVET training was adequate for their jobs found employment in commercial and business enterprises including ICT (see Table 4) 4.3.5: Distribution of employed TVET graduates by opinion on the adequacy of the practical aspect of their TVET training by gender,
Table 17 : Percentage distribution of employed TVET gr aduates by opinion on the adequacy of the
practical aspect of their TVET training by gender, 2 013
Gender of TVET graduates Total
Male Female
Number Percent Number Percent Number Percent
Graduates' opinion on
adequacy of practical
training taking into account
needs of job
Yes 146 73.4 139 80.3 285 76.6
No 33 16.6 21 12.1 54 14.5
NS 20 10.1 13 7.5 33 8.9
Total 199 100.0 173 100.0 372 100.0
Source: Survey of TVET Graduates, 2013
Table 17 above revealed that the majority of respondents interviewed, 76.6 percent, who attended courses indicated that the practical aspect of their training was adequate whereas 14.5 percent of the graduate respondents revealed that the practical aspects of their courses were inadequate.

24
4.3.6: Distribution of unemployed TVET graduates by difficulties to secure employment
Table 18 : Percentage distribution of unemployed TVET graduates by difficulties to secure employment, 201 3
Sex of TVET graduates Total
Male Female
Number Percent Number Percent Number Percent
Difficulties of the
unemployed to secure
employment
level of professional
qualification and job
experience
56 22.4 90 20.3 146 21.1
Economic
downturn/depression
2 .8 7 1.6 9 1.3
Drop in demand for
employment in the
skill area qualified
30 12.0 31 7.0 61 8.8
No jobs 103 41.2 215 48.5 318 45.9
Because of my
disability
0 .0 1 .2 1 .1
Other specify 34 13.6 70 15.8 104 15.0
NS 25 10.0 29 6.5 54 7.8
Total 250 100.0 443 100.0 693 100.0
Source: Survey of TVET Graduates, 2013
Table 18 above presents information and data on the difficulties encountered by unemployed graduates in securing employment. The table also shows that the majority (45.9 percent) of respondents could not find a job because suitable jobs were not available. Another significant number (n= 56) of unemployed graduates interviewed stated that they could not secure jobs because they did not have the required level of professional qualification and job experience, representing 21.1 percent. This information confirms that under circumstances where there are shortages of jobs in the labour market, graduates find it difficult to secure jobs. It also shows that where graduates do not have the level of professional qualification and experience relevant to jobs available in the labour market this category of people cannot compete and tend to have difficulties in securing jobs. This finding confirms the assessment made in “PAGE” on the Job market situation – that education and Training by providers are not market-demand driven.

25
4.3.7: distribution of unemployed TVET graduates by difficulties to secure self-employment
Table 19 : Percentage distribution of unemployed TVET graduates by difficulties to secure self-
employment, 2013
Difficulties in securing self-employment
Gender of TVET graduates Total
Male Female
Number Percent Number Percent Number Percent
Lack of start-up capital 212 84.8 377 85.1 589 85.0
Inadequate technical
skills
12 4.8 12 2.7 24 3.5
Lack of entrepreneur
skills
4 1.6 26 5.9 30 4.3
NS 22 8.8 28 6.3 50 7.2
Total 250 100.0 443 100.0 693 100.0
Source: Survey of TVET Graduates, 2013
Table 19 above provides information on the difficulties encountered by the unemployed TVET graduates to become self-employed. The table revealed that the vast majority of the unemployed graduates were mainly constrained by the lack of access to start-up capital to establish their own businesses/enterprises representing 85 percent of the graduate respondents. Similar studies conducted in recent times such as the NYSS and GTTI Tracer Studies have come out with the similar findings. According to the graduates interviewed, adequate technical and entrepreneurial skills have not been major constraints in establishing their own businesses/enterprises. The need to provide start–up capital through micro-financing schemes therefore becomes a critical issue.
The newly validated Tertiary and Higher Education Policy also highlighted this problem and it intends to address this problem of access to start up capital for the youth and it has outlined strategies and programmes to address the situation.
4.3.8: distribution of TVET graduates by employment status and opinion on availability of jobs in their residential area.
26
Table 20: Percentage distribution of TVET graduates b y employment status and opinion on availability of
jobs in their residential area, 2013
Are job or vacancies available in your residential
areas
Employment and unemployment Total
Employed Unemployed NS
Number Percent Number Percent Number Percent Number Percent
Yes 136 36.6 0 .0 1 12.5 137 12.8
No 193 51.9 0 .0 0 .0 193 18.0
NS 43 11.6 693 100.0 7 87.5 743 69.2
Total 372 100.0 693 100.0 8 100.0 1073 100.0
Source: Survey of TVET Graduates, 2013
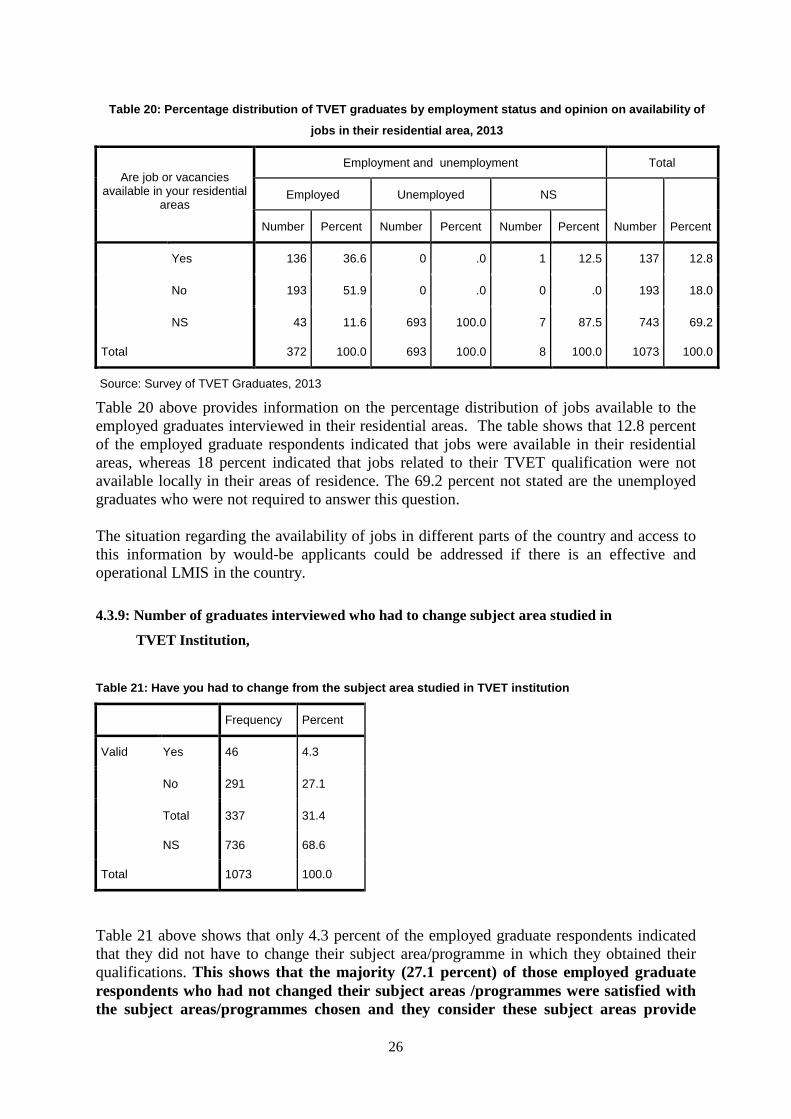
Table 20 above provides information on the percentage distribution of jobs available to the employed graduates interviewed in their residential areas. The table shows that 12.8 percent of the employed graduate respondents indicated that jobs were available in their residential areas, whereas 18 percent indicated that jobs related to their TVET qualification were not available locally in their areas of residence. The 69.2 percent not stated are the unemployed graduates who were not required to answer this question. The situation regarding the availability of jobs in different parts of the country and access to this information by would-be applicants could be addressed if there is an effective and operational LMIS in the country.
4.3.9: Number of graduates interviewed who had to change subject area studied in
TVET Institution,
Table 21: Have you had to change from the subject a rea studied in TVET institution
Frequency Percent
Valid Yes 46 4.3
No 291 27.1
Total 337 31.4
NS 736 68.6
Total 1073 100.0
Table 21 above shows that only 4.3 percent of the employed graduate respondents indicated that they did not have to change their subject area/programme in which they obtained their qualifications. This shows that the majority (27.1 percent) of those employed graduate respondents who had not changed their subject areas /programmes were satisfied with the subject areas/programmes chosen and they consider these subject areas provide

27
them with opportunities for possible employment. As mentioned above, the percentage attributed to not stated are those unemployed graduates who were not required to answer the question. This confirms the findings in Table 16 above, where the majority (76.1 percent) of employed graduate respondents agreed that their TVET training was adequate for their jobs. Apparently this high percentage of satisfaction gives the indication that the TVET training provided by all training providers are relevant vis a vis the job market. It should however be noted that according to the survey, the majority of the respondents had their TVET training in the Commercial and Business areas/programmes and most of them eventually found employment (see table 4) in this sector. As stated above this situation may be misleading as it might only apply to the Commercial/ IT sector. Other studies (NYSS, GTTI Tracer studies) came out with findings that many graduates who pursued courses in engineering, construction and other technical subjects stated that their TVET training was adequate. In light of these different situations, there will be the need for NTA to carry out further investigation and come up with policy recommendation that may support private TVET providers that are prepared to invest in Engineering and construction and their technical training courses and programmes. 4.3.10 Job situation of TVET graduates interviewed Table 22: Is your present job your first job after TVET training
Frequency Percent
Valid Yes 286 26.7
No 53 4.9
Total 339 31.6
NS 734 68.4
Total 1073 100.0
According to Table 22 above, a total number of 286 representing 26.7 percent of employed graduate respondents indicated that their present job is the first job they secured after their TVET training. However, a lower percentage (4.9 percent) indicated that this is not their first job after completing their TVET training. This indicates that the TVET training received by these graduates in the areas of commercial and IT were to a large extent relevant or matched the jobs available in this sector.

28
Table 23: Have you been looking for a job in the l ast 30 days been looking for a job Frequency Percent
Yes 343 32.0
No 335 31.2
Total 678 63.2
NS 395 36.8
Total 1073 100.0
Table 16 shows that 32 percent of unemployed graduate respondents have been looking for jobs for the past 30 days at the time of the survey. A similar percentage (31.2 percent) of those unemployed respondents stated that they have not been looking for jobs for the past 30 days at the time of the survey. Some of the main reasons advanced for some of these graduates not looking for jobs are as follows:
(a) Pursuing further training in various institutions. (b) Limited jobs available in their residential areas. (c) Looked for jobs before but could not find one. (d) Waiting for the outcome of job interviews attended.
(See Table 24 page 24, below for percentage distribution of data). Table 24 : Reasons for not looking for a Job
Frequency Percent
Valid Was waiting for the results of a vacancy competition or an interview
26 2.4
Awaiting the season for work 7 .7
Attended school or training courses 153 14.3
Family responsibilities or housework 15 1.4
Pregnancy 8 .7
Illness, injury 7 .7
Does not know how and where to look for work
5 .5
Unable to find work for his/her skills 14 1.3
Had looked for job(s) before but had not found any
38 3.5
No jobs available in the area/district 47 4.4
Disability 2 .2
Already found a job to start at a later date
8 .7
Other reason 16 1.5
Total 346 32.2
Missing System 727 67.8

29
Frequency Percent
Valid Was waiting for the results of a vacancy competition or an interview
26 2.4
Awaiting the season for work 7 .7
Attended school or training courses 153 14.3
Family responsibilities or housework 15 1.4
Pregnancy 8 .7
Illness, injury 7 .7
Does not know how and where to look for work
5 .5
Unable to find work for his/her skills 14 1.3
Had looked for job(s) before but had not found any
38 3.5
No jobs available in the area/district 47 4.4
Disability 2 .2
Already found a job to start at a later date
8 .7
Other reason 16 1.5
Total 346 32.2
Missing System 727 67.8
Total 1073 100.0
For analysis of this table (24) see table 23 above.
Table 25: have you been offered a job in the last 3 0 days
Frequency Percent
Valid Yes 29 2.7
No 645 60.1
Total 674 62.8
Missing System 399 37.2
Total 1073 100.0
According to table 25 above, there was only a small percentage (2.7) among the unemployed respondents that were offered jobs at the time of the survey and declined the offer, mainly because of the following reasons indicated in below:
(a) Very low salary (b) Unsuitable and inconvenient working hours (see table 26)

30
Table 26: Reasons for not accepting offer of jobs Frequency Percent
Valid ‘Because of low income’ 8 .7
Part time (contract ) 4 .4
‘Working hours or time the
close was not favourable’
4 .4
‘Because of pregnancy’ 3 .3
‘Other’ 12 1.1
Total 31 2.9
Missing System 1042 97.1
Total 1073 100.0
4.3.11: The need for guidance and counselling of students before the commencement of the course
Table 27: Do you now wish you had done a different course
Frequency Percent
Valid Yes 171 15.9
No 878 81.8
Total 1049 97.8
Missing System 24 2.2
Total 1073 100.0
Table 27 above shows that 81.8 percent of graduate respondents stated that they did not wish to pursue different courses, indicating their satisfaction with the course programme they had pursued. A small percentage of the respondents (15.9 percent) stated that they would have liked to pursue difference courses.

31
Table 28: Reason for wishing to have done a differe nt course at TVET training
Frequency Percent
Valid Occupations relating to the
subject I studied are not
lucrative
58 5.4
The job opportunities open
to me are not related with
my subject area
75 7.0
Other 23 2.1
Total 156 14.5
Missing System 917 85.5
Total 1073 100.0
Table 28 above shows the reasons why some of the graduate respondents interviewed wanted to change courses. The main reason given was that job opportunities available in the market were not related to their subject areas trained. This indicates that there is the need to provide career guidance and counselling in some of the TVET training institutions. 29: Did you have any guidance before the commencem ent of the course
Frequency Percent
Valid Yes 727 67.8
No 312 29.1
Total 1039 96.8
Missing System 34 3.2
Total 1073 100.0
Table 29 above confirms the need to provide continuous counselling and guidance to would-be TVET students on relevant courses that might make them employable in the job market after completion of their courses. The table shows that 29.1 percent of the respondents interviewed indicated that they did not have any guidance and counselling before the commencement of their courses. It is interesting to note that according to table 30 below, 17.3 percent of the respondents interviewed had in fact confirmed that they would have wished to have been given guidance and counselling before they embarked on their courses.

32
Table 30: If no, do you wish you had been given gu idance Frequency Percent
Valid Yes 186 17.3
No 140 13.0
Total 326 30.4
Missing System 747 69.6
Total 1073 100.0
4.3.12 Employment status of Graduates interviewed and the type of employment (paid or self employed), employment status and by type of organisation, employed
Table 31: Employment status of TVET Graduates interv iewed and the type of employment (paid or self
employed)
Frequency Percent
Valid Employed for pay or wages
312 29.1
Self-employed with employees 41 3.8
Self-employed with employees 10 .9
Self-employed 4 .4
Unpaid family worker 5 .5
Currently unemployed 260 24.2
Never worked 433 40.4
NS 8 .7
Total 1073 100.0
Table 31 above provides data on the employment status and the type of employment of the TVET graduates interviewed. The table shows that 34.7 percent of graduate respondents were employed either as paid workers or self–employed, whereas 64.3 percent were unemployed. Out of those employed 29.1 were employed for pay and 6.1 percent were self–employed and are mainly found in the formal sector. With regards to the unemployed 24.2 percent are currently unemployed and 40.4 percent had never worked. As indicated earlier the high unemployment rate is mainly due to the depressed job market.

33
Table 32: Percentage distribution of employed TVET gra duates by employment status and by type of organisa tion,
employed 2013
Employment status
Type of Organisation
Total Private Public
Local
government Parastatal
NGO/
CBO
International
organization NS
Employed for pay
or wages
Percent 79.8 100.0 91.7 100.0 100.0 100.0 60.0 83.9
Self-employed with
employees
Percent 12.3 .0 8.3 .0 .0 .0 40.0 11.0
Self-employed with
employees
Percent 4.1 .0 .0 .0 .0 .0 .0 2.7
Self-employed Percent 1.6 .0 .0 .0 .0 .0 .0 1.1
Unpaid family
worker
Percent 2.1 .0 .0 .0 .0 .0 .0 1.3
Total Number 243 53 12 29 8 2 25 372
Percent 100.0 100.0 100.0 100.0 100.0 100.0 100.0 100.0
Source: Survey of TVET Graduates, 2013
Table 32 presents data on percentage distribution of employed TVET graduates by employment status and type of organization they worked for. The table shows that 83.9 percent of the employed graduates interviewed were employed for pay in the public, NGO and the private sectors. As shown in table 32, out of the total number (372) of employed graduates interviewed, 243 were employed in the private sector, representing 65.3 percent. Out of the 243 employed graduates interviewed 79.8 percent were employed for pay in the private sector and 20.1 percent were self–employed. This is followed by those employed for pay in the public sector representing 14.2 percent of the 372 employed graduates interviewed. Those employed in parastatal organisations represented 7.8 percent of the employed graduates interviewed. The above analysis confirms findings of previous studies (Mapping Studies of Industries in the Gambia 2008, and the Economic census of the Gambia 2005) that the private sector provides the main avenue for paid and self-employment and most of the graduates interviewed and currently employed are found in the private sector. The public sector is also an important source of employment.
The result is significant and it is urgent for the NTA to constructively engage and collaborate with the private sector on a continuing basis in most of the areas they deal in.

34
4.3.13 Time-lag for graduates to get present job after TVET training and by gender
Table 33: Percentage distribution of employed TVET gra duates by duration it took to get present job after TVET
training and by gender, 2013
Gender of TVET graduates Total
Male Female
Number Percent Number Percent Number Percent
Graduates Within one month after
leaving the TVET training
institution
27 13.6 37 21.4 64 17.2
Within three months after
leaving the TVET training
institution
27 13.6 14 8.1 41 11.0
More than three months
after leaving the TVET
training institution
6 3.0 12 6.9 18 4.8
More than six months after
leaving the TVET training
institution
73 36.7 72 41.6 145 39.0
I was already employed
when I was doing my TVET
training programme
54 27.1 26 15.0 80 21.5
NS 12 6.0 12 6.9 24 6.5
Total 199 100.0 173 100.0 372 100.0
Source: Survey of TVET Graduates, 2013
Table 33 above provides data on duration in securing first job after TVET training and by gender. The table indicated that 145 (73 male and 72 female) of the total number of graduate respondents stated that they had their first job six months after leaving their TVET training institutions representing 39 percent of the employed graduates interviewed. One of the main reasons for this long wait for employment is due to the depressed job market situation based on secondary information received, followed by those graduates interviewed who stated that they were already employed when they were doing their TVET training programmes representing 21.5 percent. Those graduates interviewed who indicated that they had their first job one month after their TVET training programme was a sizeable number, representing 17.2 percent of the total number of graduates interviewed.
Experience and studies have shown that under extremely depressed labour market conditions, the period it takes for graduates to find employment may be long. Respondents were asked: how long after completing your training at your TVET training Institution were you able to get your present job?

35
4.3.14: The social effects of employment or unemployment on TVET graduates interviewed
Table 34: Which of the following social aspects do you experience during employment or
unemployment
34a Frequency Percent Valid Percent
Cumulative
Percent
Valid The job has enhanced my
capacity to manage a
household
132 12.3 100.0 100.0
Missing System 941 87.7
Total 1073 100.0
34 b Frequency Percent Valid Percent
Cumulative
Percent
Valid The job has enhanced my
capacity to give support to
the extended family system
91 8.5 100.0 100.0
Missing System 982 91.5
Total 1073 100.0
34c Frequency Percent Valid Percent
Cumulative
Percent
Valid The job has enhanced my
capacity to give support to
the community
76 7.1 100.0 100.0
Missing System 997 92.9
Total 1073 100.0
Tables 34(a) to 34(g) deal with the social aspect of the impacts, positive or negative experienced by the employed or the unemployed graduates interviewed within society. As regards those who were employed and interviewed see table (34a to 34c) 27.9 percent of the total number of graduate respondents stated that having a job had empowered them and enhanced their capacity to do the following within their family and community:
(a) Enhanced their capacity to manage their household (b) Enhanced their capacity to give support to the extended family system – and (c) Enhanced their capacity to give support to the community.

36
34d Frequency Percent Valid Percent
Cumulative
Percent
Valid Lack of employment has
effected my ability to give
support to the extended
family system
259 24.1 100.0 100.0
Missing System 814 75.9
Total 1073 100.0
34e Frequency Percent Valid Percent
Cumulative
Percent
Valid Lack of employment has
affected my ability to give
support to the community
40 3.7 100.0 100.0
Missing System 1033 96.3
Total 1073 100.0
34f Frequency Percent Valid Percent
Cumulative
Percent
Valid Lack of employment has
reduced my respect within
my family
95 8.9 100.0 100.0
Missing System 978 91.1
Total 1073 100.0
34g Frequency Percent Valid Percent
Cumulative
Percent
Valid Lack of employment has
affected my ability to
influence decisions within
the family and community
36 3.4 100.0 100.0
Missing System 1037 96.6
Total 1073 100.0

37
Tables 34d to 34g deal with the negative social impacts experienced by the unemployed graduates interviewed. As regards the unemployed graduates interviewed on average 10 percent of total respondents stated that being unemployed has affected their ability to do the following:
(a) To manage their household and assume certain responsibilities (b) To provide support to their extended family system (c) To give support to their community in general. (d) To maintain their standing and respect within their families (e) To influence decisions within the family and the community.
The above statements reflect the common experience of the employed or unemployed people in society especially at the level of their family and the community providing jobs to TVET graduates should be given priority as it provides social economic empowerment of the youth who contribute 45 percent of the population. Moreover this category of the population has a critical .role to play in national development.

38
4.3.15: distribution of employed TVET graduates by opinion on relevance, adequacy and practical aspect of TVET training for their jobs by course attended
Table 35: Percentage distribution of employed TVET graduates by opinion on relevance of TVET training for their jobs by course attended, 2013
Graduates Total
The job is the same as
that for which I was
trained
The job is highly
relevant and related
to the training
The training has served
as a foundation for the
job
The job is not the same as
that for which I .was trained NS
Number Percent Number Percent Number Percent Number Percent Number Percent Number Percent
Arts, craft and humanities 4 2.4 1 1.4 1 2.9 2 2.7 0 .0 8 2.2
Social and behavioural
science, journalism and
information
1 .6 2 2.7 2 5.9 0 .0 0 .0 5 1.3
Business management
and public administration
46 27.7 26 35.6 12 35.3 19 25.3 3 12.5 106 28.5
Secretarial office job 7 4.2 0 .0 0 .0 2 2.7 0 .0 9 2.4
Computing, IT, ITC 25 15.1 26 35.6 15 44.1 30 40.0 11 45.8 107 28.8
Repairs and maintenance
of vehicles, electrical and
electronic engineering
5 3.0 1 1.4 0 .0 1 1.3 3 12.5 10 2.7
Manufacturing 13 7.8 0 .0 0 .0 4 5.3 7 29.2 24 6.5

39
Table 35 above provides the data on the percentage distribution of the employed TVET graduates by opinion on relevance of TVET training for their jobs by course attended. The table shows that out of the total number (372) of the employed graduate respondents, 166 indicated that their jobs were the same for which they were trained representing 44.6 percent of the employed graduates interviewed. However, n=75 of the graduate respondents stated that their jobs were not the same for which they were trained representing 20.2 percent. It should be noted that most of the employed graduates who indicated that their jobs were the same for which they were trained, attended courses in Business Management and Public Administration n, ICT, Social Personal Services, Tourism & Hospitality and as stated earlier, the largest number of the employed graduates interviewed is from the business sector social and personal services. On the whole, a substantial percentage of the employed graduates interviewed, mainly those in the commercial sector, social and personal services, Tourism and Hospitality, agreed that the TVET courses they attended were relevant and related to their jobs.
Construction,
Architectural
draftmanship, Civil
engineering
8 4.8 4 5.5 1 2.9 3 4.0 0 .0 16 4.3
Social and personal
services
22 13.3 0 .0 0 .0 3 4.0 0 .0 25 6.7
Tourism, Hospitality,
Travelling, Hotel and
Catering
15 9.0 11 15.1 2 5.9 6 8.0 0 .0 34 9.1
Other courses 18 10.8 0 .0 1 2.9 4 5.3 0 .0 23 6.2
Not applicable or Not
stated
2 1.2 2 2.7 0 .0 1 1.3 0 .0 5 1.3
Total 166 100.0 73 100.0 34 100.0 75 100.0 24 100.0 372 100.0
Source: Survey of TVET Graduates, 2013

40
Table 36 : Percentage distribution of employed TVET grad uates by opinion on adequacy of TVET training for their jobs by course attended, 2013
Graduates' opinion on adequacy of training taking into account
needs of job Total
Yes No NS
Number Percent Number Percent Number Percent Number Percent
Arts, craft and humanities 7 2.5 1 1.7 0 .0 8 2.2
Social and behavioural science, journalism and information
2 .7 3 5.1 0 .0 5 1.3
Business management and public administration
87 30.7 13 22.0 6 20.0 106 28.5
Secretarial office job 9 3.2 0 .0 0 .0 9 2.4
Computing, IT, ITC 73 25.8 24 40.7 10 33.3 107 28.8
Repairs and maintenance of vehicles, electrical and electronic engineering
7 2.5 1 1.7 2 6.7 10 2.7
Manufacturing 14 4.9 3 5.1 7 23.3 24 6.5
Construction, Architectural draftmanship, Civil engineering
10 3.5 3 5.1 3 10.0 16 4.3
Social and personal services
22 7.8 3 5.1 0 .0 25 6.7
Tourism, Hospitality, Travelling, Hotel and Catering
29 10.2 5 8.5 0 .0 34 9.1
Other courses 19 6.7 2 3.4 2 6.7 23 6.2
Not applicable or Not stated
4 1.4 1 1.7 0 .0 5 1.3
Total 283 100.0 59 100.0 30 100.0 372 100.0
Source: Survey of TVET Graduates, 2013
As regards the employed graduates’ opinion on the adequacy of their training for their jobs vis a vis the courses they attended, table 36 shows that a higher percentage (76.1 percent) of the total graduates interviewed indicated that their TVET training was adequate for their jobs. It should again be noted that most of these employed graduates are employed in the business sector and the social and personal services. This finding may not be representative of all the courses in the TVET sector

41
Table 37: Percentage distribution of employed TVET graduates by opinion on the adequacy of the practic al aspect of their TVET training by course
attended, 2013
Graduates' opinion on adequacy of practical training taking into account needs of job Total
Yes No NS
Number Percent Number Percent Number Percent Number Percent
Arts, craft and humanities 7 2.5 1 1.9 0 .0 8 2.2
Social and behavioural science, journalism and information
2 .7 3 5.6 0 .0 5 1.3
Business management and public administration
86 30.2 13 24.1 7 21.2 106 28.5
Secretarial office job 9 3.2 0 .0 0 .0 9 2.4
Computing, IT, ITC 74 26.0 22 40.7 11 33.3 107 28.8
Repairs and maintenance of vehicles, electrical and electronic engineering
7 2.5 1 1.9 2 6.1 10 2.7
Manufacturing 14 4.9 3 5.6 7 21.2 24 6.5
Construction, Architectural draftmanship, Civil engineering
10 3.5 3 5.6 3 9.1 16 4.3
Social and personal services 21 7.4 3 5.6 1 3.0 25 6.7
Tourism, Hospitality, Travelling, Hotel and Catering
31 10.9 3 5.6 0 .0 34 9.1
Other courses 20 7.0 1 1.9 2 6.1 23 6.2
Not applicable or Not stated 4 1.4 1 1.9 0 .0 5 1.3
Total 285 100.0 54 100.0 33 100.0 372 100.0
Source: Survey of TVET Graduates, 2013

42
Table 37 above provides the data on the percentage distribution of employed TVET graduates by opinion on the adequacy of the practical aspect of their TVET training by course attended. The above Table 37 shows similar results those indicated in Tables 35 and 36. The table also shows that as regards the adequacy of the practical aspects of their training programmes, the majority 76.6 percent of employed graduates indicated that the practical aspects were adequate. However, 14.5 percent of the employed respondents felt that the practical aspects of their TVET training were not adequate. As regards the technical courses, even thought the number of those technical graduates employed who were interviewed was small, representing 10.9 percent of the 285, they also said that practical training was adequate whereas 7 out of 54 employed graduates in the technical TVET said the practical training was not adequate. The reasons given by those employed graduates (n=54) who felt that the practical aspects of their training was not adequate were as follows:
(a) The practical aspect is not quite adequate to enable them perform their work effectively.
(b) Advanced practical training is needed for higher position (c) The period for the practical aspect of the programme was not adequate.
Based on the analysis made above it appears that there is improvement in the practical aspect of TVET training programmes as far as Commercial, Business Sector, Tourism and Hospitality, ITC and the Social and Personal Services courses are concerned. NTA may wish to carry out further limited studies on the practical aspect of TVET technical training courses to determine its adequacy.

43
4.3.16 Distribution of employed TVET graduates by level of monthly salary and level of satisfaction therein
Table 38: Percentage distribution of employed TVET graduates by level of monthly salary and level of s atisfaction therein, 2013
10 What is the level of your satisfaction with your earnings Total
Highly satisfactory Satisfactory Less satisfactory Not satisfactory
Number Percent Number Percent Number Percent Number Percent Number Percent
Monthly income of
employed persons
0 - 2000 10 25.0 24 16.2 26 28.9 26 55.3 86 26.5
2000 - 4000 14 35.0 71 48.0 41 45.6 12 25.5 138 42.5
4000 - 6000 11 27.5 25 16.9 13 14.4 7 14.9 56 17.2
6000 - 8000 3 7.5 11 7.4 3 3.3 1 2.1 18 5.5
8000 - 10000 1 2.5 6 4.1 1 1.1 0 .0 8 2.5
10000 - 12000 1 2.5 5 3.4 3 3.3 0 .0 9 2.8
12000 plus 0 .0 6 4.1 3 3.3 1 2.1 10 3.1
Total 40 100.0 148 100.0 90 100.0 47 100.0 325 100.0
Source: Survey of TVET Graduates, 2013
Table 38 above provides the data of employed TVET graduates by level of monthly salary and level of satisfaction. The most significant data coming out of table 38 is that the lesser the income of the employed graduates the more they are dissatisfied with their earnings. This is a normal situation and it is amply indicated in the above table. The table shows that 26 out of 47 graduate respondents who are dissatisfied with their earnings fall within the 0-2000 Dalasis monthly income bracket, representing 55.3 percent, compared to those earning 12000 Dalasis plus monthly income. It was noted that only 1 respondent with high level of income out of the 47 graduate respondents indicated his dissatisfaction with the income he was earning.

44
CHAPTER FIVE
5.0 EMPLOYERS OF TVET GRADUATES 2009-2011 This section provides among others, the outcome of assessment made by employers of the TVET graduates on the level of satisfaction with regards to their skills and performance level on the job. The section also provides a review of the effectiveness and relevance of training of TVET graduates from the employers’ perspectives. It also deals with the outcome of employers’ assessment of the courses offered at TVET training institutions in meeting the job market needs.
5.1 Profile of employers employing TVET graduates 2009-2011
Table 38a: Distribution of employers of TVET graduates by LGA in which the organization is located, 2013
LGA of location Number Percent
Banjul 9 26.5
Kanifing 22 64.7
Brikama 3 8.8
Other LGA
Total 34 100.0
Table 38a shows that 64.7 percent of the organizations that employed TVET graduates are located in the Kanifing Local Government Area and the rest are in Banjul municipality and Brikama LGA. Only one TVET provider is located in the province that is Janjanbureh. The Table shows that 34 organisations of employers of TVET graduates were interviewed.

45
5.2 Employers’ level of satisfaction with skills and performance of the 2009 – 2011 TVET graduates
Table 39: Percentage distribution of employers of TVET graduates by type of enterprise and level of satisfaction on performance of employed TVET graduates, 2013
Type of enterprise Total
Private Government Parastatal NS
Number Percent Number Percent Number Percent Number Percent Number Percent
Very good 13 46.4 0 .0 2 100.0 2 100.0 17 50.0
Good 11 39.3 1 50.0 0 .0 0 .0 12 35.3
Satisfactory 2 7.1 1 50.0 0 .0 0 .0 3 8.8
NS 2 7.1 0 .0 0 .0 0 .0 2 5.9
Total 28 100.0 2 100.0 2 100.0 2 100.0 34 100.0
Source: Survey of TVET Graduates, 2013
Table 39 above presents the data on employers of TVET graduates by type of enterprise and level of satisfaction on performance of employed TVET graduates on the job. The table shows that employers of TVET graduates from the private sector rated the job performance of TVET graduates as follows:
a) 46.4 percent rated the job performance of TVET graduates as very good.
b) 39.3 Percent rated the job performance of TVET graduates as good
c) 7.1 Percent rated the job performance of TVET graduates as satisfactory
5.3: Distribution of employers of TVET graduates by type of enterprise and level of satisfaction on skills, performance of employed TVET graduates

46
Table 40: Percentage distribution of employers of T VET graduates by type of enterprise and level of
satisfaction on skills of employed TVET graduates, 2013
Type of enterprise Total
Private Government Parastatal NS
Number Percent Number Percent Number Percent Number Percent Number Percent
Very good 8 28.6 0 .0 2 100.0 0 .0 10 29.4
Good 11 39.3 2 100.0 0 .0 2 100.0 15 44.1
Satisfactory 5 17.9 0 .0 0 .0 0 .0 5 14.7
NS 4 14.3 0 .0 0 .0 0 .0 4 11.8
Total 28 100.0 2 100.0 2 100.0 2 100.0 34 100.0
Source: Survey of TVET Graduates, 2013
The private sector constitutes the largest employer of TVET graduates and 39.3 percent of them regard the skills of TVET graduates in their organizations as good as shown in Table 40 above. The table also shows that only 2 government and 2 parastatal organisations have employed TVET graduates.

47
Table 41: Percentage distribution of employers of T VET graduates by level of satisfaction on performan ce of graduates in specific areas of work, 2013
Areas of work Very good Good Satisfactory Poor Very poor NS Total
Number Percent Number Percent Number Percent Number Percent Number Percent Number Percent Number Percent
Secretarial 0 .0 0 .0 3 8.8 5 14.7 3 8.8 23 67.6 34 100.0
Accounting Financial
0 .0 0 .0 3 8.8 4 11.8 8 23.5 19 55.9 34 100.0
Marketing 0 .0 1 2.9 2 5.9 4 11.8 6 17.6 21 61.8 34 100.0
Business Management
0 .0 0 .0 4 11.8 4 11.8 6 17.6 20 58.8 34 100.0
Information Technology
0 .0 0 .0 2 5.9 6 17.6 4 11.8 22 64.7 34 100.0
Computing 0 .0 0 .0 3 8.8 6 17.6 6 17.6 19 55.9 34 100.0
Electrical 2 5.9 0 .0 1 2.9 0 .0 3 8.8 28 82.4 34 100.0
Auto mechanic 2 5.9 0 .0 1 2.9 1 2.9 1 2.9 29 85.3 34 100.0
Carpentry/Joinery
2 5.9 0 .0 1 2.9 1 2.9 0 .0 30 88.2 34 100.0
Welding 2 5.9 0 .0 1 2.9 2 5.9 0 .0 29 85.3 34 100.0
Masonry 1 2.9 0 .0 1 2.9 1 2.9 0 .0 31 91.2 34 100.0
Cabinet Making 1 2.9 0 .0 1 2.9 0 .0 0 .0 32 94.1 34 100.0
Plumbing 1 2.9 0 .0 1 2.9 1 2.9 0 .0 31 91.2 34 100.0
Community and Extension Development Service
1 2.9 0 .0 1 2.9 0 .0 0 .0 32 94.1 34 100.0
Others 1 2.9 0 .0 2 5.9 8 23.5 4 11.8 19 55.9 34 100.0
NS 0 .0 0 .0 0 .0 1 2.9 0 .0 33 97.1 34 100.0

48
Table 41 above, the fields of study relating to Computing, Business Management, and Accounting benefit most from the supply of labour that received TVET orientation compared to other fields of study in TVET institutions.
In the field of Computing, 8.8 percent of the employers described the performance of workers in this area as ‘satisfactory’. However, 17.6 percent of the employers who employed TVET graduates working in the areas of computing and related services described the performance of this category of employees as ‘poor’ . Another group of employers (17.6) percent at the same time described the performance of their employees working in the areas of computing as ‘very poor’ . In general, a significant proportion of employers of TVET graduates described the performance of those in the field of computing as poor or very poor.
In general, 35.2 percent of the employers described the performance of the TVET graduates who were working in the areas of computing as poor or very poor. Only 8.8 percent of the employers described the performance of these TVET graduates working in the areas of computing as ‘satisfactory’.
Similarly, a significant proportion of the employers (36.4 percent) described the performance of the TVET graduates who were working in the areas of Business Management as poor or very poor. Only 11.8 percent of the employers described the performance of these TVET graduates as ‘satisfactory’.
The performance of TVET graduates working in the field of Accounting was described as satisfactory by 8.8 percent of the employers of TVET graduates interviewed. About 35.3 percent of the employers described the performance of these TVET employees as poor or very poor.
The number of Employed TVET graduates interviewed working in the areas of electricity, auto-mechanics, carpentry, joinery, and welding was relatively low. At least 82.4 percent of the employers did not employ TVET graduates working as electrician, auto-mechanics, carpenters, Joiners and welders.
Table 41 however shows that 5.9 percent of the employers described the performance of workers in the areas of engineering and construction as very good.

49
5.4: distribution of employers of TVET graduates by opinion on the quality and relevance of specific courses offered at TVET training institutions.
Table 42: Percentage distribution of employers of T VET graduates by opinion on the quality and relevan ce of specific courses offered at TVET training ins titutions,
2013
Courses Very good Good Satisfactory Poor Very poor NS Total
Number Percent Number Percent Number Percent Number Percent Number Percent Number Percent Number Percent
Secretarial 0 .0 0 .0 3 8.8 2 5.9 7 20.6 22 64.7 34 100.0
Accounting Financial
0 .0 0 .0 2 5.9 4 11.8 10 29.4 18 52.9 34 100.0
Marketing 1 2.9 0 .0 0 .0 3 8.8 0 .0 30 88.2 34 100.0
Business Management
1 2.9 0 .0 3 8.8 8 23.5 5 14.7 17 50.0 34 100.0
Information Technology
0 .0 1 2.9 1 2.9 5 14.7 4 11.8 23 67.6 34 100.0
Computing 0 .0 1 2.9 1 2.9 8 23.5 7 20.6 17 50.0 34 100.0
Electrical 1 2.9 0 .0 0 .0 0 .0 3 8.8 30 88.2 34 100.0
Auto mechanic 1 2.9 0 .0 0 .0 0 .0 2 5.9 31 91.2 34 100.0
Carpentry/Joinery 1 2.9 0 .0 0 .0 0 .0 3 8.8 30 88.2 34 100.0
Welding 1 2.9 0 .0 1 2.9 2 5.9 3 8.8 27 79.4 34 100.0
Masonry 1 2.9 0 .0 0 .0 0 .0 3 8.8 30 88.2 34 100.0
Cabinet Making 1 2.9 0 .0 0 .0 0 .0 2 5.9 31 91.2 34 100.0
Plumbing 1 2.9 0 .0 0 .0 1 2.9 3 8.8 29 85.3 34 100.0
Community and Extension Development Service
1 2.9 0 .0 0 .0 0 .0 2 5.9 31 91.2 34 100.0
Others 1 2.9 0 .0 1 2.9 6 17.6 2 5.9 24 70.6 34 100.0
NS 0 .0 0 .0 0 .0 1 2.9 1 2.9 32 94.1 34 100.0

50
It is interesting to note that those employers who described the performance of the TVET graduates working in the areas of Computing, Business Management, and Accounting as poor or very poor also used almost the same ratings to describe the relevance of their courses to their jobs. Table 42 shows that 41.2 percent of the employers described the quality and relevance of the courses offered in TVET institutions as poor or very poor. The concept of quality and relevance is assumed to have been formed by the employer by considering a number of factors such as the work of the employee, the standard of the job required, the level of quality desired, and perhaps knowledge of the curriculum. The table also shows that 38.2 percent of the employers regarded the quality and relevance of the course on Business Management as poor or very poor. The highest proportion of employers interviewed (44.1 percent) regarded the quality and relevance of the course in Computing as poor or very poor. 5.5 Type of qualification and skills preferred by employers of TVET graduates
Table 43: Percentage distribution of Organisations by ratings on the importance of general
academic qualifications of applicants'.
Ratings on importance Number Percent
Very little 2 5.9
Little 1 2.9
Much 13 38.2
Very much 16 47.1
NS 2 5.9
Total 34 100.0
Table 43 reveals that 47.1 percent of the employers of TVET graduates rated the importance of general academic qualification as “Very Much” `compared to 5.9 percent of the employers who rated the importance of general academic qualification as “Very Little”. This finding is not surprising since most of the employed graduates interviewed are working in the commercial sector where academic qualification is important.

51
Table 44: Percentage distribution of Organisations by ratings on the importance of technical and commercial qualifications of applicants.
Number Percent
Valid Little 5 14.7
Much 8 23.5
Very much 20 58.8
NS 1 2.9
Total 34 100.0
Table 44 reveals that 58.8 percent of the employers of TVET graduates who are mainly in the Commercial and Business Sector, rated the importance of technical and commercial qualification as “Very Much” `compared to 14.7 percent of the employers who rated the importance of technical and commercial qualification as “Little”

52
CHAPTER SIX
6.0 TVET TRAINING PROVIDERS
This section provides the outcome of the review carried out on Training Providers relating to issues such as their curriculum for skills areas, their use of the LMIS or market research, relationship with industry and quality assurance system. Some of these issues have bearing on factors affecting effectiveness and relevance of training provided by Training Providers.
6.1 Profile of TVET Training Providers
Table 45: Type of training institutions covered
Number Percent
Valid Private 43 72.9
Public 4 6.8
NGO 4 6.8
Community based
organisation
2 3.4
Other 4 6.8
Total 57 96.6
NS 2 3.4
Total 59 100.0
Table 45 provides the type of training institutions the survey had covered. The table shows that a total of 59 TVET training institutions were interviewed, out of which 72.9 percent private TVET were training institutions. Only 4 were public, 4 NGOs and 2 Community-based organisations.
The number of training providers is significant and indicates that the contribution of training providers towards national skills development capacity is important and substantial.

53
6.2: TVET training institutions curriculum for each skill area
Table 46: Do you have curriculum for each skill are a?
Frequenc
y Percent
Valid 1-yes 56 94.9
2-no 1 1.7
3-yes for some 1 1.7
Total 58 98.3
NS 1 1.7
Total 59 100.0
Table 46 above shows that 56 of 59 representing 94.9 percent of TVET training institutions interviewed have indicated that they have curriculum for each of their programmes. Only one TVET training institution has stated that it does not have a curriculum for its programmes and one indicated that it has curriculum for some courses.
6.3: Labour market research
Table 47: In the absence of LMIS do you conduct mar ket research?
Frequency Percent
Valid 1 yes 38 64.4
2 no 9 15.3
Total 47 79.7
NS 12 20.3
Total 59 100.0
According to table 47 above 64.4 percent of TVET training institutions interviewed indicated that they do normally conduct market research in the absence of the LMIS, compared to the15.3 percent who did not conduct market research.

54
Table 48: if no why?
Frequency Percent
Valid NS 54 91.5
BECAUSE WE ALREADY KNOW
WHAT INDUSTRY WANTS
1 1.7
NOT APPLICABLE TO
LANGUAGE PROGRAMME
1 1.7
OUR COMPANY DOES IT ALL 1 1.7
WE DON'T CONDUCT MARKET
RESEARCH
1 1.7
WE USE THE INTERNATIONAL
EXTERNAL EXAMS
1 1.7
Total 59 100.0
The reasons put forward why the 15.3 percent of TVET training institutions did not conduct market research are indicated in table 48 above is that they already know what skills are required by industry.
6.4: Linkages between TVET training institutions and industry
Table 49: Do you have any relation/input from indus try?
Frequency Percent
Valid 1 yes 48 81.4
2 no 9 15.3
Total 57 96.6
Missing System 2 3.4
Total 59 100.0
Table 49 shows that 81.4 percent of TVET training institutions interviewed indicated that they have relation/input from industry concerning the type of skills they need and the development of their curriculum compared to15.3 percent who said they have no relationship or input from industry. This trend in interfacing with industry is a positive development and should be encouraged since it will help relate TVET training programmes to the job market.
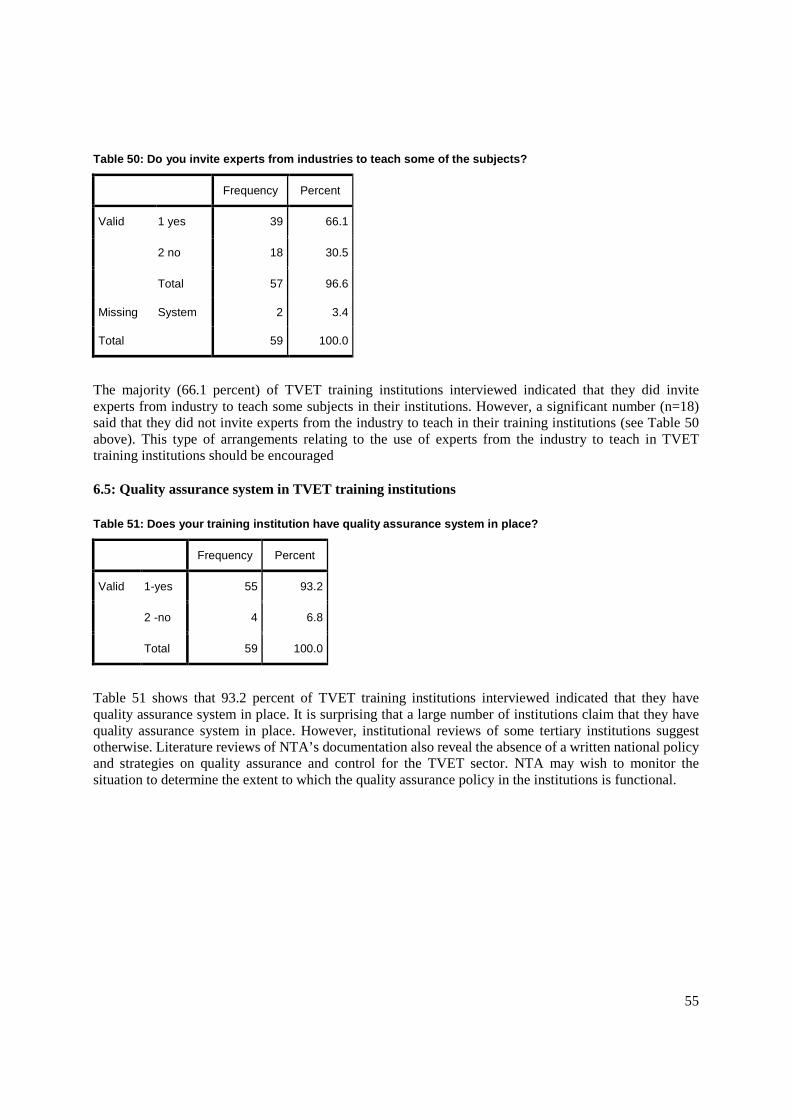
55
Table 50: Do you invite experts from industries to teach some of the subjects?
Frequency Percent
Valid 1 yes 39 66.1
2 no 18 30.5
Total 57 96.6
Missing System 2 3.4
Total 59 100.0
The majority (66.1 percent) of TVET training institutions interviewed indicated that they did invite experts from industry to teach some subjects in their institutions. However, a significant number (n=18) said that they did not invite experts from the industry to teach in their training institutions (see Table 50 above). This type of arrangements relating to the use of experts from the industry to teach in TVET training institutions should be encouraged
6.5: Quality assurance system in TVET training institutions
Table 51: Does your training institution have quali ty assurance system in place?
Frequency Percent
Valid 1-yes 55 93.2
2 -no 4 6.8
Total 59 100.0
Table 51 shows that 93.2 percent of TVET training institutions interviewed indicated that they have quality assurance system in place. It is surprising that a large number of institutions claim that they have quality assurance system in place. However, institutional reviews of some tertiary institutions suggest otherwise. Literature reviews of NTA’s documentation also reveal the absence of a written national policy and strategies on quality assurance and control for the TVET sector. NTA may wish to monitor the situation to determine the extent to which the quality assurance policy in the institutions is functional.

56
6.6: Assessment and monitoring of TVET training institutions
Table 52: Is your institution assessed and monitore d by NTA?
Frequency Percent
Valid 1 59 100.0
With regards to assessment and monitoring of TVET training institutions, Table 52 shows that all the TVET training institutions interviewed confirmed that they were assessed and monitored by NTA. In addition, according to Table 53 below, 98.3 percent of the TVET training institutions interviewed have indicated that they did carry out self-assessment.
Table 53: Do you carry out self-assessment?
Frequency Percent
Valid 1-yes 58 98.3
NS 1 1.7
Total 59 100.0
6.7: Career guidance and counselling
Table 54: Do you have career guidance and counselli ng unit?
Frequency Percent
Valid 1-yes 37 62.7
2-no 22 37.3
Total 59 100.0
Table 54 shows that 62.7 percent of TVET training institutions interviewed indicated that they have career guidance and counselling units at their institutions. However, a high number (n=22) of TVET training institutions interviewed indicated that they do not have career guidance and counselling unit representing 37.3 percent. It is important that students are helped to make the right choice for courses and subjects that could eventually help them obtain the right jobs.

57
6.8. ASSESSMENT OF THE CAPACITY OF TVET TRAINING PROVIDERS Based on the information gathered from the survey of TVET Institutions and establishments interviewed, most of these institutions only provide training in commercial subjects, Business Management and Public Administration, Social Personal Services, Tourism & Hospitality and information technology. Very few of these formal institutions provide training in the technical skill areas
The information gathered from the institutions interviewed a SWOT analysis on the institutions mentioned in annex 1 was undertaken. See Table 55 below
Table 55 SWOT analysis of TVET Training Providers
Strengths and Weaknesses of TVET Training Providers
Ref: Strengths Ref: Weaknesses
1 Programmes based on labour market demand 1 The mis-match between training and Employers’ skills needs (Relevance)
2 Adequate Qualified Staff 2 Inadequate finance and resources (both physical and human)
3 Library resources with access to internet for wider studies/research
3 Lack of adequate tools, inadequacy of the institutions’ facilities and equipment
4 Attachment opportunities to industry, to relate theory to practice.
4 Difficulty in getting students attached to a firm or establishment. Many firms unwilling to take students on attachment.
5 Strict adherence to the curriculum and teaching procedures
5 Lack of Quality Assurance System
6 ___ 6 Lack of electricity supply in most skill centres in the rural areas
7 Good management practices 7 Inadequate linkage with Industry for programmes development.
8 ___ 8 Lack of motivation and developmental programme for staff
9 ___ 9 The absence a database to facilitate constant monitoring and evaluation
The majority of training providers interviewed indicated their strengths and weaknesses and these are indicated in table 55 above. However, as regards their purported strengths, some of the reports reviewed by the consultant shows that there is lack of capacity throughout the sector in relation to the quality and numbers of instructors and trainers and training materials and

58
equipment. As regards trainers, the TVET policy (2002) concluded that; throughout the sector there was the lack of capacity of trainers to:
� Develop standards of achievements and curricula � Provide the links between knowledge and the associated development of skill � Assessment (summative) of vocational competence
Most of these TVET Training Providers are also constrained because of inadequate training materials and equipment.
The above challenges are not exhaustive and there are other weaknesses. However those mentioned above are crucial and TVET providers have to overcome them if they are to play and contribute constructively towards the national TVET aims and objectives.
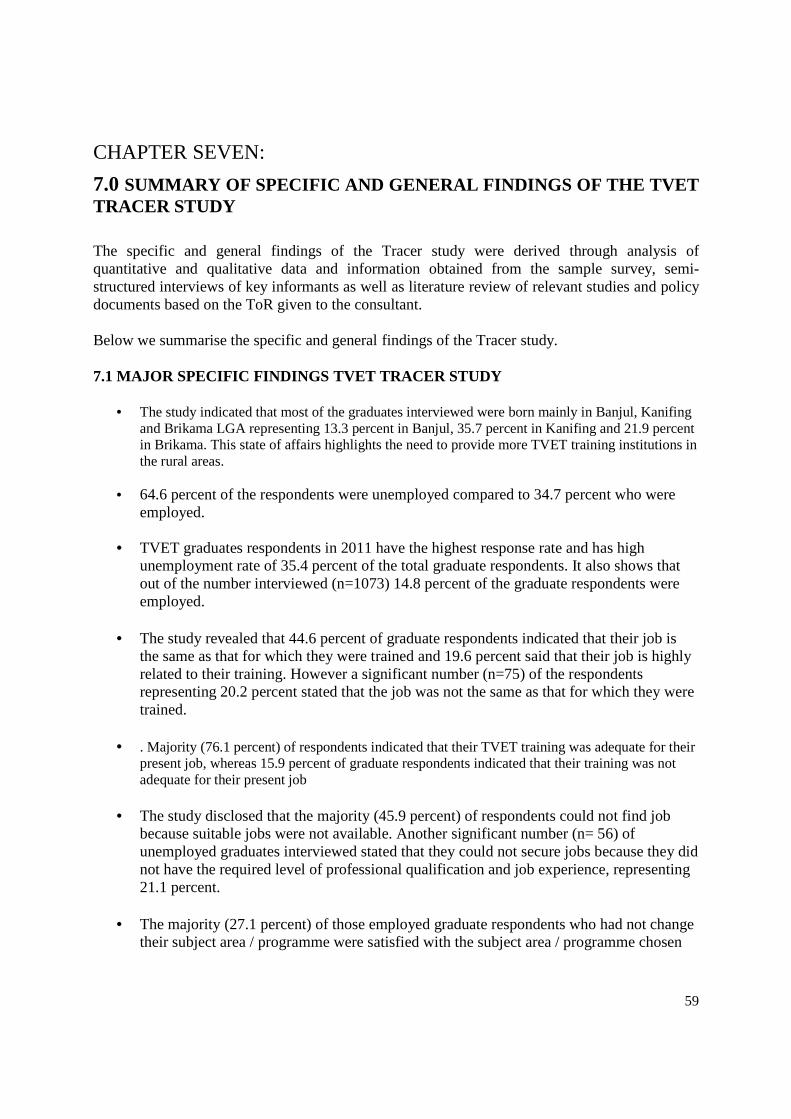
59
CHAPTER SEVEN:
7.0 SUMMARY OF SPECIFIC AND GENERAL FINDINGS OF THE TVE T TRACER STUDY The specific and general findings of the Tracer study were derived through analysis of quantitative and qualitative data and information obtained from the sample survey, semi-structured interviews of key informants as well as literature review of relevant studies and policy documents based on the ToR given to the consultant. Below we summarise the specific and general findings of the Tracer study. 7.1 MAJOR SPECIFIC FINDINGS TVET TRACER STUDY
• The study indicated that most of the graduates interviewed were born mainly in Banjul, Kanifing and Brikama LGA representing 13.3 percent in Banjul, 35.7 percent in Kanifing and 21.9 percent in Brikama. This state of affairs highlights the need to provide more TVET training institutions in the rural areas.
• 64.6 percent of the respondents were unemployed compared to 34.7 percent who were
employed.
• TVET graduates respondents in 2011 have the highest response rate and has high unemployment rate of 35.4 percent of the total graduate respondents. It also shows that out of the number interviewed (n=1073) 14.8 percent of the graduate respondents were employed.
• The study revealed that 44.6 percent of graduate respondents indicated that their job is
the same as that for which they were trained and 19.6 percent said that their job is highly related to their training. However a significant number (n=75) of the respondents representing 20.2 percent stated that the job was not the same as that for which they were trained.
• . Majority (76.1 percent) of respondents indicated that their TVET training was adequate for their
present job, whereas 15.9 percent of graduate respondents indicated that their training was not adequate for their present job
• The study disclosed that the majority (45.9 percent) of respondents could not find job
because suitable jobs were not available. Another significant number (n= 56) of unemployed graduates interviewed stated that they could not secure jobs because they did not have the required level of professional qualification and job experience, representing 21.1 percent.
• The majority (27.1 percent) of those employed graduate respondents who had not change
their subject area / programme were satisfied with the subject area / programme chosen

60
and they consider these subject areas provides them with opportunities for possible employment.
• There will be the need for NTA to carry out further investigation and come up with
policy recommendation that may support private TVET providers that are prepared to invest in engineering and construction and technical training courses and programmes
• According Table 22, a total number of 286 representing 26.7 percent of employed
graduate respondents indicated that their present job is the first job they secured after their TVET training. However, a lower percentage (4.9 percent) indicated that this is not their first job after completing their TVET training. This indicates that the TVET training received by these graduates in the areas of commercial and IT were to a large extent relevant or matched the jobs available in this sector.
• The study revealed that 145 (73 male and 72 female) of the total number of graduate
respondents stated that they had their first job six months after leaving their TVET training institutions representing 39 percent of the employed graduates interviewed. One of the main reasons for this long wait for employment is due to the depressed job market situation based on secondary information reviewed.
• Based on the analysis made in study, it appears that there is improvement in the practical
aspect of TVET training programmes as far as commercial, business sector, tourism and hospitality, ITC and the social and personal services courses are concerned. NTA may wish to carry out further limited studies on the practical aspect of TVET technical training courses to determine their adequacy.
• The most significant data coming out of the study is that the lesser the income of employed
graduates the more they are dissatisfied with their earnings. This is a normal situation and it is amply indicated in the table 38. It shows that 26 out of 47 graduate respondents who are dissatisfied with their earnings fall within the 0-2000 Dalasis monthly income bracket, representing 55.3 percent
• The private sector constitutes the largest employer of TVET graduates and 39.3 percent of them
regard the skills of TVET graduates in their organizations as good
• The fields of study relating to computing, business management, and accounting benefit most from the supply of labour that received TVET orientation compared to other fields of study in TVET institutions.
• In general, 35.2 percent of the employers described the performance of the TVET graduates who were working in the areas of computing as poor or very poor. Only 8.8 percent of the employers described the performance of these TVET graduates working in the areas of computing as ‘satisfactory’.
• The number of Employed TVET graduates interviewed working in the areas of electricity, auto-mechanics, carpentry, joinery, and welding was relatively low. At least

61
82.4 percent of the employers did not employ TVET graduates working as electrician, auto-mechanics, carpenters, Joiners and welders.
• The Table 41 however shows that 5.9 percent of the employers described the performance of workers in the areas of engineering and construction as very good.
• 64.4 percent of TVET training institutions interviewed indicated that they do conduct market research in the absence of the LMIS, compared to the15.3 percent who did not conduct market research.
• Table 51 shows that 93.2 percent of TVET training institutions interviewed indicated that they have quality assurance system in place. This need to be further confirmed by NTA.
• However institutional reviews of some tertiary institutions suggest otherwise. Literature reviews of NTA’s documentation also reveal the absence of a written national policy and strategies on quality assurance and control for the TVET sector. NTA may wish to monitor the situation to determine the extent to which the quality assurance policy in the institutions is functional.
• High number (n=22) of TVET training institutions interviewed indicated they do not have career guidance and counselling unitS representing 37.3 percent. It is important that students are helped to make the right choice of courses and subjects that could eventually help them obtain the right jobs.
7.2 SUMMARY OF GENERAL FINDINGS OF THE TRACER STUDY OF TVET
GRADUATES
7.2.1 EFFECTIVENESS AND RELEVANCE OF TRAINING TO JOB MARK ET
On effectiveness and relevance of training provision that will enhance employability, the study discovered that in the commercial and IT areas considerable progress has been made as regards the employability of graduates, and relevance of course programmes to job requirements. However a significant number (20.2 percent) of employed graduates interviewed indicated that their training is not related to the work they do. As for engineering construction and technical artisans graduates, most studies have indicated the opposite, i.e training programmes are not geared towards market demand. This situation, according to our analysis, is caused by the absence of an efficient established LMIS at the NTA, as well as the substantial capital involved in establishing engineers and construction training centre and, maintaining them. 7.2.2 ADEQUACY OF TRAINING TO PRESENT JOBS OF GRADUATES
The high percentage responses rate from graduates regarding the appropriateness of the training they had received as adequate, refers to graduates interviewed and were pursuing courses provided by training institution mainly in the commercial and business, tourism and hospitality and may be mis-leading. The concern for Government now, is the development of human resource in all fields of economic development regarding the country’s manpower requirements, and in particular in the engineering, construction and manufacturing sectors. The expansion of Training Providers in the country is mainly in the commercial and IT sector with very few TVET training institution in the Technical areas. It has been stated in the report that some of the main reasons why there are very few private technical training institutions are that technical training
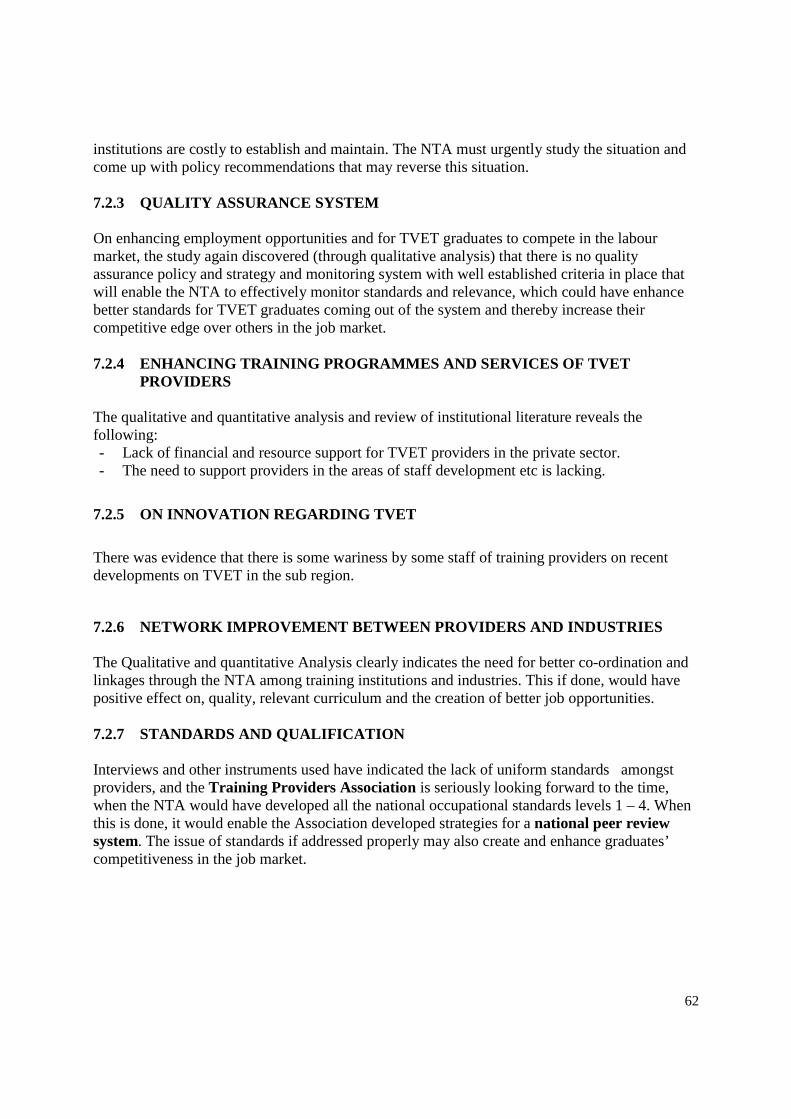
62
institutions are costly to establish and maintain. The NTA must urgently study the situation and come up with policy recommendations that may reverse this situation. 7.2.3 QUALITY ASSURANCE SYSTEM On enhancing employment opportunities and for TVET graduates to compete in the labour market, the study again discovered (through qualitative analysis) that there is no quality assurance policy and strategy and monitoring system with well established criteria in place that will enable the NTA to effectively monitor standards and relevance, which could have enhance better standards for TVET graduates coming out of the system and thereby increase their competitive edge over others in the job market. 7.2.4 ENHANCING TRAINING PROGRAMMES AND SERVICES OF TVET
PROVIDERS The qualitative and quantitative analysis and review of institutional literature reveals the following: - Lack of financial and resource support for TVET providers in the private sector. - The need to support providers in the areas of staff development etc is lacking.
7.2.5 ON INNOVATION REGARDING TVET
There was evidence that there is some wariness by some staff of training providers on recent developments on TVET in the sub region.
7.2.6 NETWORK IMPROVEMENT BETWEEN PROVIDERS AND INDUSTRIE S The Qualitative and quantitative Analysis clearly indicates the need for better co-ordination and linkages through the NTA among training institutions and industries. This if done, would have positive effect on, quality, relevant curriculum and the creation of better job opportunities.
7.2.7 STANDARDS AND QUALIFICATION
Interviews and other instruments used have indicated the lack of uniform standards amongst providers, and the Training Providers Association is seriously looking forward to the time, when the NTA would have developed all the national occupational standards levels 1 – 4. When this is done, it would enable the Association developed strategies for a national peer review system. The issue of standards if addressed properly may also create and enhance graduates’ competitiveness in the job market.

63
CHAPTER 8 CONCLUSION An evaluation of all our national development policies, including education policies and strategies over the last 30 years, and other studies relating to the TVET sector carried out and highlighted in this report and the major findings of this tracer study (2013) have highlighted the challenges facing The Gambia in linking skills training and the job market. It also indicated government’s attempt to review and enhanced its TVET system so as to ensure that it is more relevant and provide trainees with the skills necessary for their entry into the labour market with the right quality to compete for jobs. The finding of this study has highlighted key fundamental issues, relating to the objectives and ToR of this study, and they are highlighted in this report.
According to our own assessment, the challenges now for the NTA, its line ministry and other collaborating partners are:
1) The full implementation of the NTA Act and its mandate. NTA is mandated to co-ordinate the quality of delivery of TVET in the country, and they will require technical assistance support to build up capacity of the organisation. Qualitative analysis has confirmed that the necessary units, structures and legal framework are in place and that they are adequate. All what is needed is to implement its programmes.
2) The NTA is also mandated to make TVET relevant to all occupations and to the occupations classified as unskilled.
3) They are also mandated to encourage and promote life – long learning (TVET 2002). The legislative framework is therefore in place for the NTA to implement its mandate. However, this study has availed us the opportunity to thoroughly examine the TVET system through this national tracer study. We are confident that the recommendations contained in this report, when effectively and efficiently implemented, lead to the improvement of the TVET system
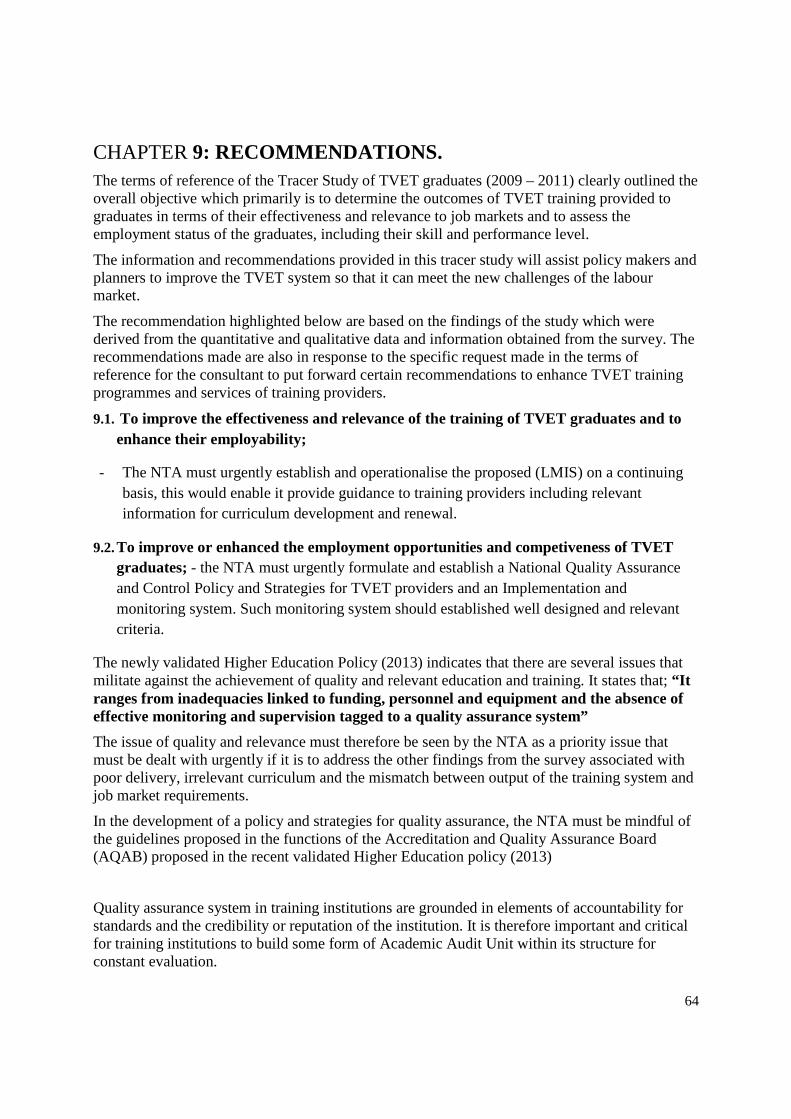
64
CHAPTER 9: RECOMMENDATIONS. The terms of reference of the Tracer Study of TVET graduates (2009 – 2011) clearly outlined the overall objective which primarily is to determine the outcomes of TVET training provided to graduates in terms of their effectiveness and relevance to job markets and to assess the employment status of the graduates, including their skill and performance level.
The information and recommendations provided in this tracer study will assist policy makers and planners to improve the TVET system so that it can meet the new challenges of the labour market.
The recommendation highlighted below are based on the findings of the study which were derived from the quantitative and qualitative data and information obtained from the survey. The recommendations made are also in response to the specific request made in the terms of reference for the consultant to put forward certain recommendations to enhance TVET training programmes and services of training providers.
9.1. To improve the effectiveness and relevance of the training of TVET graduates and to enhance their employability;
- The NTA must urgently establish and operationalise the proposed (LMIS) on a continuing basis, this would enable it provide guidance to training providers including relevant information for curriculum development and renewal.
9.2. To improve or enhanced the employment opportunities and competiveness of TVET graduates; - the NTA must urgently formulate and establish a National Quality Assurance and Control Policy and Strategies for TVET providers and an Implementation and monitoring system. Such monitoring system should established well designed and relevant criteria.
The newly validated Higher Education Policy (2013) indicates that there are several issues that militate against the achievement of quality and relevant education and training. It states that; “It ranges from inadequacies linked to funding, personnel and equipment and the absence of effective monitoring and supervision tagged to a quality assurance system”
The issue of quality and relevance must therefore be seen by the NTA as a priority issue that must be dealt with urgently if it is to address the other findings from the survey associated with poor delivery, irrelevant curriculum and the mismatch between output of the training system and job market requirements.
In the development of a policy and strategies for quality assurance, the NTA must be mindful of the guidelines proposed in the functions of the Accreditation and Quality Assurance Board (AQAB) proposed in the recent validated Higher Education policy (2013)
Quality assurance system in training institutions are grounded in elements of accountability for standards and the credibility or reputation of the institution. It is therefore important and critical for training institutions to build some form of Academic Audit Unit within its structure for constant evaluation.

65
9.3. In order to enhanced the training programmes and services of training providers, the following issues must be addressed:
- The issue of quality and relevance must be addressed and the recommendations and issues raised above should apply
- The issue of staff development must be accorded high priority
- The NTA must established a policy and strategy for supporting staff development plans for training providers, i.e. through sponsorship of staff to attend higher level teacher training programmes e.g., the City and Guilds 730 at the Institutes of Tourism and the GTTI, Technical teacher Training Programme
As regards the improvement of the Services of Training Providers, the qualitative analysis of the interview results of the President of the Association of Providers (private) conducted by the Consultant during the consultations clearly expresses the need for such support and the justification. In addition, the analysis of the “returns” of the semi-structured questionnaires for Training providers of the sampled Institutions, again confirms the need for financial and material support. An interview with the Director General NTA indicates that financial support as of now only goes to the Associations whose members regularly pay their education levy. The support is regarded as a “plough back” and takes the form of financing training programme of staff of these associations. The NTA must now develop new criteria for evaluating providers to determine who qualifies for financial support.
The recent government development Blue Print (PAGE) clearly indicates, that it will “continue supporting private TVET initiatives through sponsorship, if the training initiatives are in line with and in support of government strategies to achieve accelerated growth and employment, The NTA must consider this statement in developing criteria for the allocation of subventions to providers.
9.4. Valuable lessons for the TVET system adaptation and innovation.
- The World Bank publication entitled “Skills Development in Sub-Saharan Africa has identified some successful interventions, in countries like Ghana, Kenya, Senegal etc and it may be useful for NTA officials to visit to study intervention and approaches in these Countries as regards skills development.
9.5. For the improvement of a network between training providers and industries.
The quantitative and qualitative analysis clearly suggests that there is a need for better co-ordination and support through the NTA Committee Structures. The Authority should urgently review the composition and function of its Trade Committees responsible for the development of national occupational standards. Networking between TVET training institutions and industries should be developed with NTA serving as the “middle linking chain”. Accordingly a platform for a carefully structured networking system among

66
institutions or institutions offering similar programmes should be established with the involvement of industries particularly in the absence of a council for Higher Education in The Gambia.
9.6. Strengthening the Capacities of the NTA
We have already expressed the urgency for the NTA to establish its database and LMIS and to it use them efficiently on a continuing basis. It is our views that technical assistance would be required to do this.
9.7. The examination of the NTA administrative and technical organisational structures indicates that the units established are in line with the requirements of the TVET act 2003. However, what is lacking is the personnel required to enforce the act as regards. Supervision and monitoring of activities of training providers. What was clear during the interviews with officials of the NTA and Ministry of Higher Education, Research, Science and Technology was that technical assistance support will be needed if the objectives TVET programmes are to be achieved.
9.8. An important recommendation that is outside the (ToR) is linking the Higher Education Policy objectives with the TVET policy. The Higher Education Policy states:
“Develop and implement a national qualifications framework for all levels of tertiary and higher education, in co-operating the existing Gambia skills qualification framework”
The NTA must, therefore, urgently further developed its NVQ standards into the required levels indicated in the Higher Education Policy framework; this it will now have to do, in cooperation with recognized tertiary institutions, the University of the Gambia, the Ministry of Basic, Secondary and Higher Education, and the Association of Training Providers. This activity will required Technical assistance For example, the UK GNVQ was developed to cut across the entire education system that now defines pathways for students, to have smooth credit transfers and recognition by tertiary and Higher Education Institutions.
9.9. Deconcentration of TVET Training Institutions from the GBA
NTA to follow up on the Ministry (MoHERST) to establish at least one TVET institution in each region in order to expand skills training in the rural areas as recommended in many reports to and Government policy document.
9.10. Data Base, Data Collection Instruments and Management System of the data base.
The NTA should create a database preferably in Microsoft Excel to monitor the occupational movement of a sample of 10 percent of TVET graduates that passed out each previous year. This implies that each year TVET institutions should by requirement send details of list of graduates that passed out to NTA. A standard format of the type of information to be furnished by the institutions should be prepared and made available to all institutions.

67
The standard form for data collection should contain the following information: name of the graduate, telephone number, home address, age, sex, type of course pursued, year started, year of graduation, and employment status (employee. self-employed and unemployed)
The NTA should appoint a database administrator who will be responsible for data collection and management of the database.
Every year the database administrator should select a sample of TVET graduates that passed out the previous year so as to find out their employment status and if employed their place of work. This of course implies that the database that NTA would maintain will include variables from the standard form and two more variables - employment status and place of work.
The telephone numbers and, if needed, the home address would be used by the database administrator to collect the required information from the sampled graduates.
The database administrator can recommend to the Director of NTA the appointment of two or more temporary enumerators for a period of two weeks to assist in data collection.

68
References
Adjivon (2007) A study of the Co-ordination of skill development with employment
Needs in the Gambia, (ERNWACA The Gambia Chapter).
DOSE (1988) The Education Policy (1988-2003)
DoSE (2004-15) The Education Policy 2004 – 2015 (Department of State for Education)
Gambia Government (1975) Five year Plan for Economic and Social development (1975/76-80)
(Government Printer)
Gambia Government (1980) Second Five year plan for Economic and Social Development
(1980-85) (Government Printer)
Gambia Government (2011) Programme for Accelerated Growth and Employment (PAGE)
Ministry of Finance and Economic Affaire
MoHERST (2013) Validation Tertiary and Higher Education Policy
NE Policy (2002) National Employment Policy
NEAP (2003) National Employment Action Plan
Njie M.A. (1979) Technical and Vocational Education in The Gambia, the Road Ahead
Master’s Degree Thesis (University of the Shefield UK)
NTA (2003) Mapping study of Employers employing 5 or more people
NTA (2008) The Mapping Study of Master Craft persons NTA.
PRSP II (2007) Poverty Reduction Strategies paper (2007-2015) Government Printer.
The Gambia Incorporated (1996) Vision 2020
TVET Policy (2003) Technical Vocational Education and Training Act (2003) National Training Authority
World Bank (2005) “Technical assistance for in proving relevance and efficiency in TVET and Higher Education in The Gambia” (Ministry of Higher Education, Research, Science and Technology.

69
ANNEX 1 DISTRIBUTION OF GRADUATES INTERVIEWED BY TVET INSTI TUTIONS ATTENDED, 2013
Institution Number Percent
‘African Information Holdings LTD’ 12 1.1
Banjul Institute of Professional Studies (BIPS) 9 .8
Banutu Business College (BBC) 1 .1
‘Business Training Centre’ 54 5.0
‘Canaan Technical Institute’ 1 .1
‘Cinchips Institute’ 16 1.5
‘ECG Wellingara Skills Centre’ 2 .2
‘Edenic Languages & Professional Institute’ 9 .8
‘Emamos Computer Training Institute & Professional Studies’ 2 .2
‘Fabulous Gambia Training Centre Charity’ 7 .7
‘Fajara Skills Development Centre’ 2 .2
‘Gambia Press Union School of Journalism’ 1 .1
Gambia Telecommunication and Multimedia Institute (GTMI) 9 .8
‘Gambia Technical Training Institute’ 76 7.1
‘Gaye Njoro Hair Plus’ 16 1.5
‘Grace Institute of Professional Accounting’ 22 2.1
‘Holron Computing Training Centre’ 10 .9
‘Insight Training Centre’ 12 1.1
Institute of Professional Administration & Management (IPAM) 37 3.4
‘Institute of Travel and Tourism of The Gambia’ 50 4.7
‘International Community College’ 1 .1
‘Janjanbureh Training Centre’ 8 .7
‘John Pickering Skills Training Centre’ 20 1.9
‘Jollof Tutors’ 21 2.0
‘Kairasu Institute For Technology and Vocational Skills Centre’ 23 2.1
Lamin Institute of Professional Studies (LIPS) 31 2.9
‘Lasting Solution’ 17 1.6
‘Matrix Solutions Training Institute’ 3 .3
‘Microtech Institute of Multimedia and Technology’ 13 1.2
‘MJ Hairdressing Express Salon & Skills Training Centre’ 15 1.4
‘Nifty ICT Solution’ 27 2.5
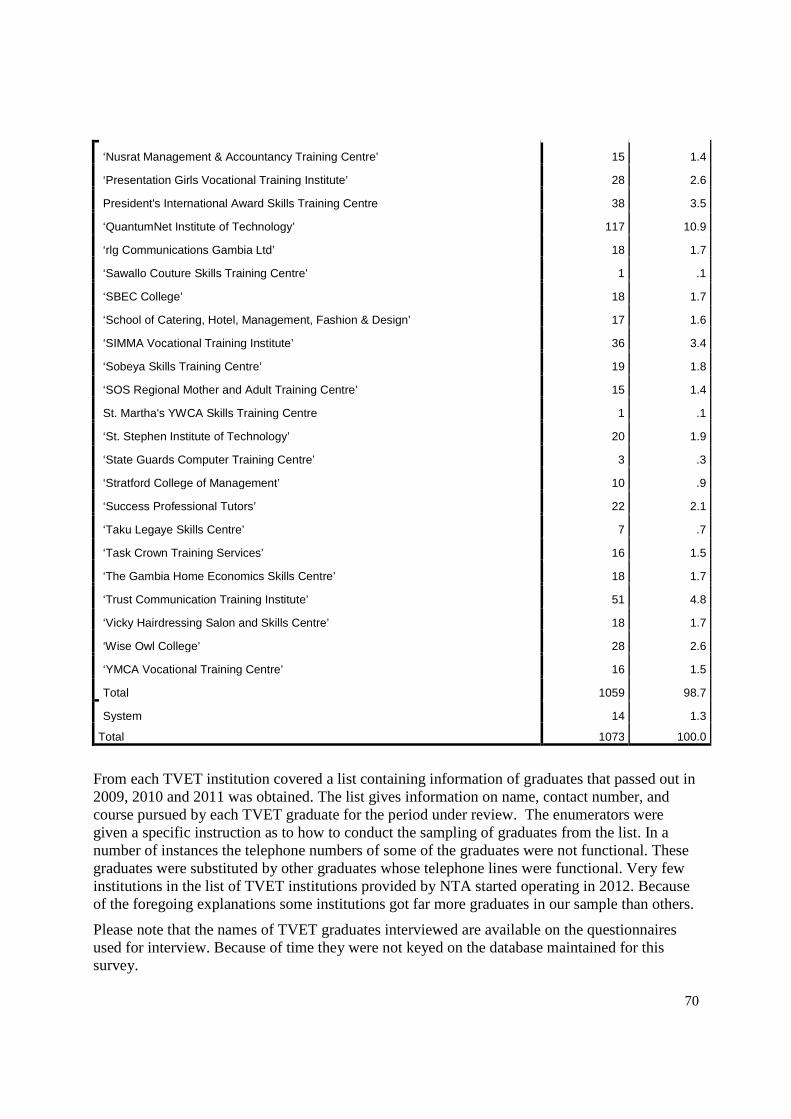
70
‘Nusrat Management & Accountancy Training Centre’ 15 1.4
‘Presentation Girls Vocational Training Institute’ 28 2.6
President's International Award Skills Training Centre 38 3.5
‘QuantumNet Institute of Technology’ 117 10.9
‘rlg Communications Gambia Ltd’ 18 1.7
‘Sawallo Couture Skills Training Centre’ 1 .1
‘SBEC College’ 18 1.7
‘School of Catering, Hotel, Management, Fashion & Design’ 17 1.6
‘SIMMA Vocational Training Institute’ 36 3.4
‘Sobeya Skills Training Centre’ 19 1.8
‘SOS Regional Mother and Adult Training Centre’ 15 1.4
St. Martha's YWCA Skills Training Centre 1 .1
‘St. Stephen Institute of Technology’ 20 1.9
‘State Guards Computer Training Centre’ 3 .3
‘Stratford College of Management’ 10 .9
‘Success Professional Tutors’ 22 2.1
‘Taku Legaye Skills Centre’ 7 .7
‘Task Crown Training Services’ 16 1.5
‘The Gambia Home Economics Skills Centre’ 18 1.7
‘Trust Communication Training Institute’ 51 4.8
‘Vicky Hairdressing Salon and Skills Centre’ 18 1.7
‘Wise Owl College’ 28 2.6
‘YMCA Vocational Training Centre’ 16 1.5
Total 1059 98.7
System 14 1.3
Total 1073 100.0
From each TVET institution covered a list containing information of graduates that passed out in 2009, 2010 and 2011 was obtained. The list gives information on name, contact number, and course pursued by each TVET graduate for the period under review. The enumerators were given a specific instruction as to how to conduct the sampling of graduates from the list. In a number of instances the telephone numbers of some of the graduates were not functional. These graduates were substituted by other graduates whose telephone lines were functional. Very few institutions in the list of TVET institutions provided by NTA started operating in 2012. Because of the foregoing explanations some institutions got far more graduates in our sample than others.
Please note that the names of TVET graduates interviewed are available on the questionnaires used for interview. Because of time they were not keyed on the database maintained for this survey.

71
ANNEX 2
FORM 1
QUESTIONNAIRE FOR TVET GRADUATES, 2013.
A. Name of Enumerator:____________________________________________
B. Date of Interview: _____Day Month Year
SECTION 1 – PROFILE OF RESPONDENT:-
1. Name of respondent/graduate …………………………………..
2. Current address of graduate
a. Settlement…………………………………………….
b. LGA of current residence:
1. Banjul 2. Kanifing 3. Brikama 4. Mansakonko 5. Kerewan
6. Kuntaur 7. Janjabureh 8. Basse
c. Street and No/compound owner....................................................................................................................
d. Telephone number.....................
3. Age of Respondent
4. Gender: 1. Male

72
2. Female
5. Place of birth …………………………………………….
6. LGA of birth: 1. Banjul 2. Kanifing
3. Brikama 4. Mansakonko
5. Kerewan 6. Kuntaur
7. Janjabureh 8. Basse
c. Street and No/compound owner....................................................................................................................
7. Name of TVET training institution attended...........................................................................................................................
8. Course/Programme attended: ........................................................................................................................................
9. Duration of course (in months)...........................
10. Mode of attendance:
11. Year of completion ………………..
12. Do you have any form of disability? 1. Yes 2. No
13. Level of education before TVET
1 Full Time 2 Part Time 3 Day Release

73
14. Level of education after TVET
SECTION 2: EMPLOYMENT STATUS
1. What is your current employment status?
a) Employed for pay or wages
b) Self-employed without employees
c) Self-employed with employees
d) Self-employed (but not having contract past 30 days)
e) Unpaid family worker
f) Currently Unemployed (then skip to Section 4)
g) Never worked (then skip to Section 4)
2. What is your main occupation in your current job?......................................................................................
3. Describe the main activity of your work place?.............................................................................................
4. Type of enterprise/organization/work place:
1) Private 2) Public 3) Local government

74
4) Parastatal
5) NGO/CBO
6) International organization.
5. What is your position and level in the organisation/enterprise?
6. How did you get the information about the job?
a. Newspapers b. Internet c. Word of mouth (family and friends) d. TV/Radio e. Job centres
7. Apart from qualifications which one of the following factors helped you most to become aware of and get your present job?
- Staff contacts / recommendations - Job advertisement.
- Self-contact
- Family/relatives
- Gender
- Any others (specify) -
8. Is the enterprise for which you work, registered with the Attorney General’s chamber?
1 Yes 2 No
Please give the following details:
1
2
3
4
5
7

75
1. Name of organization/ enterprise in which you work:
2. Address of organization/ enterprise in which you work:
3. Telephone/mobile no. of employer or immediate supervisor:
4. [__][__][__][__][__][__][__][__]/[__][__][__][__][__][__][__][__]
9. What is your present monthly earnings/income in kind or cash in Dalasis from your current employment?
Dalasis......................
10. What is the level of your satisfaction with your earnings/income in terms of your present professional qualification and experience?
1 Highly satisfactory
2 Satisfactory
3 Less satisfactory
4 Not satisfactory
11. Is your present job your first job after leaving your TVET training institution?
- Yes - No
If yes skip to question 10 12. (1) If No (1) Give your reason(s) for changing jobs: (Multiple)
1. Better job 2. Disliked job 3. Better pay 4. Family reasons 5. Redundancy 6. Termination 7. Other (specify)………….
1
2

76
(2) List each job and place of work over the last three years (if you had changed job(s)):
1. Job/Occupation 2. Name of work place
13. Which one of the following statements best describes the relationship between your job competence and the training which you followed at your TVET training institution?
- The job is the same as that for which I was trained. - The job is highly relevant and related to the training.
- The training has served as a foundation for the job.
- The job is not the same as that for which I was trained.
14. How long (in months) after completing your training at your TVET training institution were you able to get your present job?
- Within one month after leaving the TVET training institution - Within three months after leaving the TVET training institution.
- More than three months after leaving the TVET training institution.
- More than six months after leaving the TVET training institution
15. How long after completing your training at your TVET training institution were you able to be self-employed?
- Within one month after leaving the TVET training institution. - Within three months after leaving the TVET training institution.
- More than three months after leaving the TVET training institution.
1
2
3
4
1
2
3
4
1
2
3

77
- More than six months after leaving the TVET training institution.
16. Are jobs or vacancies available in your residential area, related to the qualification which you obtained at your TVET training institution?
1. Yes 2. No
17. Which of the following social factors have been influential in enhancing your opportunities for getting your present job? (Multiple)
1 Religion 3 Personal relationship/ Family/relatives
5 Political
2 Ethnic group 4 Gender 6 Other (Please specify)
SECTION 3: TRAINING
1. Do you consider the training course received from your TVET training institution quite adequate for your present job?
Yes
No
2 If No, give your main reason
1 I need more or new skills so that I can become more productive 2 The training and the job are not much related 3 I need higher qualification for higher position 4 Other specify…………………..
3 Do you consider the practical aspect of your training course received from your TVET training institution quite adequate for your present job?
1 Yes 2 No
4
1
2

78
4. If no, give your main reason ……………………………………………………………… I need more or new practical skills so that I can become more productive
1 The practical aspect is not quite adequate. 2 I need advanced practical training for higher position 3 Other specify…………………..
5. (a) Have you had to change from the subject area/programme in which you obtained your qualifications at your TVET training institution?
1 YES
2 NO
(b) Can you explain why if answer is yes?
1 Occupations relating to the subject I studied are not lucrative 2 The job opportunities open to me are not related with my subject area 3 Other (specify)................................
SECTION 4: UNEMPLOYED
1. Have you been looking for a job in the last 30 days?
1 yes 2 No
2. If No, what was the MAIN reason why you did not look for work in the 30 days?
01 Was waiting for the results of a vacancy competition or an interview
02 Awaiting the season for work
03 Attended school or training courses (Student attending in school/Training)
04 Family responsibilities or housework
05 Pregnancy
06 Illness, injury
07 Does not know how and where to look for work
08 Unable to find work for his/her skills
09 Had looked for job(s) before but had not found any

79
10 No jobs available in the area/district
11 Disability
12 Already found a job to start at a later date 13 Other reason (specify): _____________
3. Have you been offered a job in the last 30 days?
1 yes 2 No
4. If yes, why did you not accept the offer? ………………………………………………………
5. Why was it difficult for you to secure employment?
1 level of professional qualification and job experience
2 Economic downturn/depression
3. Drop in demand for employment in the skill area qualified
4 No jobs
5. Because of my disability
6. Other specify…………………………………………………
6. Why was it difficult for you to secure self-employment?
a) Lack of start-up capital b) Inadequate technical skills c) Lack of entrepreneur skills
SECTION 5: FOR ALL RESPONDENTS
1. Do you now wish you had done a different course/programme at your institution? 1 YES
2 NO
a) If YES, Explain why
1 Occupations relating to the subject I studied are not lucrative 2 The job opportunities open to me are not related with my subject area

80
3 Other (specify).................... .
…………………………………………………………………………………………………
2. Did you have any guidance before the commencement of your course?
1 Yes 2 No
3. . If no, do you wish you had been given guidance on choosing a course before you started
your training at your TVET training institution? 1 YES
2 NO
a) If YES, what kind of guidance?
1 Guidance relating to subject where I could have perform better 2 Guidance relating to subjects that have good prospect for jobs 3 Guidance relating to subjects that have better prospects for promotion 4 Guidance relating to subjects that give lucrative employments 5 Other specify…….

81
FORM 2
EMPLOYERS OF TVET GRADUATES
1. Name of establishment__________________________________________-___
2. Respondent’s Name________________________________________________
2. Current address of enterprise
a. Settlement…………………………………………….
b. LGA:
1. Banjul 2. Kanifing 3. Brikama 4. Mansakonko 5. Kerewan
6. Kuntaur 7. Janjabureh 8. Basse
c. Street and No/Enterprise name....................................................................................................
3. Sex of respondent 1. Male 2. Female
4. Type of enterprise
1. Private 2. Government 3. NGO 4. Parastatal
5. Community 6. Other (specify)…………
5. What is the activity of your enterprise?……………..
6. Now I want to evaluate your level of satisfaction with the skills and performance of the TVET graduate named below:

82
Item 1. Very good
2. Good
3. Satisfactory
4. Poor
5. Very poor
Item 1. Very good
2. Good
3. Satisfactory
4. Poor
5. Very Poor
1. Name of TVET graduate employee
………………….
………………….
………………….
NA
2. Standard of discipline
3. Sex of employee:
1.Male 2. Female
4. Ability to lead
5. Ability to use appropriate working techniques
6. Ability to manage assignments
7. Performance on the job 8. Level of competence in applying skills
9. Ability to work with others 10. Behaviour
11. Ability to work without supervision
12. Attendance record
13. Ability to manage time 14. Computer literacy
15. Ability to solve problems
17. Punctuality
7. What professional qualities does your organization look for in applicants when recruiting employees? ……………………………………………………………………………………
………………………………………………………………………………………………….
8. How much value does your organization place on the qualifications of applicants (for jobs in the organization)?
Very much Much Little Very Little None
General Academic Qualifications
5 4 3 2 1
Technical / Commercial Qualifications
5 4 3 2 1

83
9. Which one of the following types of qualifications does your organization prefer TVET graduates to have obtained:-
Internal Certificate /Diploma) External Certificate / Diploma (CGLI, RSA, Pitman, AAT etc)? Both internal and external Certificate/ Diploma
10. How would you rate the performance of TVET graduates employed in your organization using the categories shown?
Area of work Very Good
Good satisfactory Poor Very Poor
Secretarial 5 4 3 2 1
Accounting Financial
5 4 3 2 1
Marketing 5 4 3 2 1
Business Managememt
5 4 3 2 1
Information Technology
5 4 3 2 1
Computing 5 4 3 2 1
Electrical 5 4 3 2 1
Auto mechanic 5 4 3 2 1
Carpentry/Joinery 5 4 3 2 1
Welding 5 4 3 2 1
Masonry 5 4 3 2 1
Cabinet Making 5 4 3 2 1
Plumbing 5 4 3 2 1
Community and Extension Development Service
5 4 3 2 1
Others 5 4 3 2 1
2
3
1

84
TRAINING
1. Does your organization have sufficient information about the level and range of courses offered at TVET training institutions?
1 YES
2 NO
If yes, how did you get the information? Please state …………………………………….
………………………………………………………………………………………………………
2. Do you have any say or input in the development of the curriculum of TVET training institutions as regards the skills needed?
1. YES 2. NO
(b) If no, what type of linkage would you like to propose between your establishment and TVET training institutions as regards the skills needed? …………………………………………………………………………………………………………
3. What would you say is the consensus of opinion in your organization about the quality and relevance of the courses offered at TVET training institutions in the following areas of work?
Very Good
Good satisfactory Poor Very Poor
Secretarial 5 4 3 2 1
Accounting Financial
5 4 3 2 1
Marketing
Business Managememt
5 4 3 2 1
Information 5 4 3 2 1

85
Very Good
Good satisfactory Poor Very Poor
Technology
Computing 5 4 3 2 1
Electrical 5 4 3 2 1
Auto mechanic 5 4 3 2 1
Carpentry/Joinery 5 4 3 2 1
Welding 5 4 3 2 1
Masonry 5 4 3 2 1
Cabinet Making 5 4 3 2 1
Plumbing 5 4 3 2 1
Community and Extension Development Service
5 4 3 2 1
Others 5 4 3 2 1

86
FORM 3
QUESTIONNAIRE FOR TRAINING INSTITTIONS-2013
________________________________________________________________
A. TRAINING INSTITUTION’S PROFILE:
1. Name of institution………………………………………………………….
2. Name of respondent…………………………………………………………
3. Address………………………………………………………………………
4. LGA…………………………………………………………………………
5. Settlement…………………………………………………………………..
6a. Tel. no………………6b. Mobile no……………..6c. Email……………………
6d.Website…………………..…..
7. Type of institution
1. Private
2. Government
3. NGO
4. Parastatal
5. Community
6. Other (specify)…………
8. Activity of the institution/Main courses offered
…a.………………………………………………………………………………
…b………………………………………………………………………………
…c………………………………………………………………………………

87
…d………………………………………………………………………………
…e………………………………………………………………………………
....f..………………………………………………………………………………
B. TRAINING CURICULUM
1. Do you have a curriculum for each skill area of the training programme offered to trainees?
1. Yes
2. No.
3. Yes for some
2. If yes, what is the course content of the skill area? (Provide a copy if possible).
……………………………………………………………………
……………………………………………………………………
……………………………………………………………………
……………………………………………………………………
……………………………………………………………………
……………………………………………………………………
……………………………………………………………………
3. I n the absences of LMIS system in place do you conduct market research before you prepare your training programmes/course content?
4. Do you have any relation/input from industry concerning the type of skills they need and the development of your curriculum.
1. Yes
2. No
If no, why ……………………………………………………………………………..

88
5. Do you invite expert from industry to teach some of the subjects in your institution?
1 Yes
2. No
6. Do your training institution have quality assurance system in place?
1 Yes
2 No
7. Is your institution assess and monitored by NTA to ensure that standards and quality are maintained
1 Yes
2 No
8. Do you carry out self-assessment of your quality standards of your training programmes?
1 Yes
2 No
If yes, how often ……………………………………………..
9 Do you have career guidance and counselling unit at your institution?
1 Yes 2 No
a) If yes, how does it operate? ……………………………………………………
………………………………………………………………………………………
b) If no, how do you counsel your students? ………………………………………..
…………………………………………………………………………………………