Embed Size (px)
Citation preview
NSX-T TroubleshootingGuideModified on 5 JUN 2018VMware NSX-T Data Center 2.2
NSX-T Troubleshooting Guide
VMware, Inc. 2
You can find the most up-to-date technical documentation on the VMware website at:
https://docs.vmware.com/
If you have comments about this documentation, submit your feedback to
Copyright © 2017, 2018 VMware, Inc. All rights reserved. Copyright and trademark information.
VMware, Inc.3401 Hillview Ave.Palo Alto, CA 94304www.vmware.com
Contents
NSX-T Troubleshooting Guide 5
1 Troubleshooting Layer 2 Connectivity 6
Check the NSX Manager and NSX Controller Cluster Status 6
Check the Logical Ports 7
Check the Transport Node Status 8
Check the Logical Switch Status 8
Check the CCP for the Logical Switch 9
Check the Local Control Plane Status 9
Troubleshoot Config Session Issues 10
Troubleshoot L2 Session Issues 11
Troubleshoot Dataplane Issues for an Overlay logical Switch 12
Troubleshoot Dataplane Issues for a VLAN logical Switch 13
Troubleshoot ARP Issues for an Overlay Logical Switch 14
Troubleshoot Packet Loss for a VLAN logical Switch or When ARP Is Resolved 14
2 Troubleshooting Installation 16
3 Trouleshooting Routing 20
4 Troubleshooting Firewall 22
Determining Firewall Rules that Apply on an ESXi Host 22
Determining Firewall Rules that Apply on a KVM Host 25
Firewall Packet Logs 26
5 Logs and Services 28
Log Messages 28
Troubleshooting Syslog Issues 32
Checking Services 33
Collecting Support Bundles 35
6 Other Troubleshooting Scenarios 36
Failure to Add or Delete a Transport Node 36
Transport Node Takes About 5 Minutes to Connect to Another Controller 37
NSX Manager VM Is Degraded 37
NSX Agent Times Out Communicating with NSX Manager 39
Failure to Add an ESXi Host 40
Incorrect NSX Controller Status 40
VMware, Inc. 3

Management IPs on KVM VMs Not Reachable with IPFIX Enabled 41
NSX-T Troubleshooting Guide
VMware, Inc. 4
NSX-T Troubleshooting Guide
The NSX-T Troubleshooting Guide provides information on how to troubleshoot issues that might occur inan NSX-T environment.
Intended AudienceThis guide is for system administrators of NSX-T. A familiarity with virtualization, networking, anddatacenter operations is assumed.
VMware Technical Publications GlossaryVMware Technical Publications provides a glossary of terms that might be unfamiliar to you. Fordefinitions of terms as they are used in VMware technical documentation, go to http://www.vmware.com/support/pubs.
VMware, Inc. 5
Troubleshooting Layer 2Connectivity 1If there is a communication failure between two virtual interfaces (VIFs) that are connected to the samelogical switch, for example, you cannot ping one VM from another, you can follow the steps in this sectionto troubleshoot the failure.
Before you start, make sure that there is no firewall rule blocking traffic between the two logical ports. It isrecommended that you follow the order of the topics in this section to troubleshoot the connectivity issue.
This chapter includes the following topics:n Check the NSX Manager and NSX Controller Cluster Status
n Check the Logical Ports
n Check the Transport Node Status
n Check the Logical Switch Status
n Check the CCP for the Logical Switch
n Check the Local Control Plane Status
n Troubleshoot Config Session Issues
n Troubleshoot L2 Session Issues
n Troubleshoot Dataplane Issues for an Overlay logical Switch
n Troubleshoot Dataplane Issues for a VLAN logical Switch
n Troubleshoot ARP Issues for an Overlay Logical Switch
n Troubleshoot Packet Loss for a VLAN logical Switch or When ARP Is Resolved
Check the NSX Manager and NSX Controller ClusterStatusVerify that the status of NSX Manager and the NSX Controller cluster is normal, and the controllers areconnected to the NSX Manager.
VMware, Inc. 6
Procedure
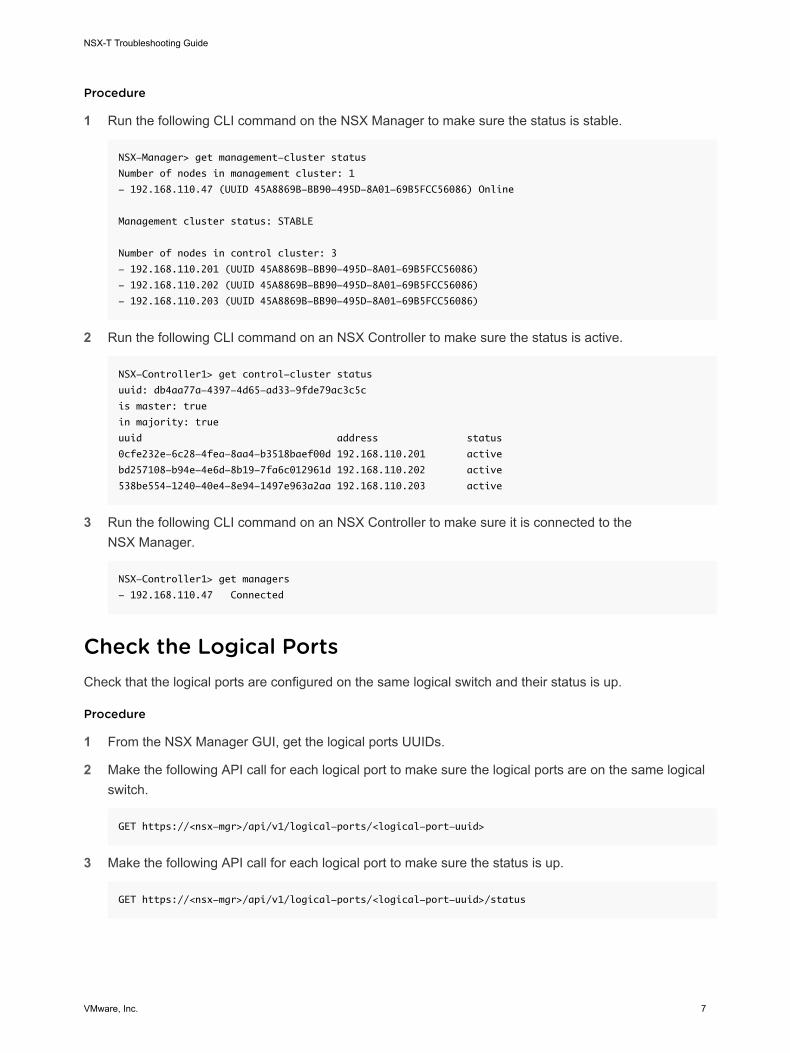
1 Run the following CLI command on the NSX Manager to make sure the status is stable.
NSX-Manager> get management-cluster status
Number of nodes in management cluster: 1
- 192.168.110.47 (UUID 45A8869B-BB90-495D-8A01-69B5FCC56086) Online
Management cluster status: STABLE
Number of nodes in control cluster: 3
- 192.168.110.201 (UUID 45A8869B-BB90-495D-8A01-69B5FCC56086)
- 192.168.110.202 (UUID 45A8869B-BB90-495D-8A01-69B5FCC56086)
- 192.168.110.203 (UUID 45A8869B-BB90-495D-8A01-69B5FCC56086)
2 Run the following CLI command on an NSX Controller to make sure the status is active.
NSX-Controller1> get control-cluster status
uuid: db4aa77a-4397-4d65-ad33-9fde79ac3c5c
is master: true
in majority: true
uuid address status
0cfe232e-6c28-4fea-8aa4-b3518baef00d 192.168.110.201 active
bd257108-b94e-4e6d-8b19-7fa6c012961d 192.168.110.202 active
538be554-1240-40e4-8e94-1497e963a2aa 192.168.110.203 active
3 Run the following CLI command on an NSX Controller to make sure it is connected to theNSX Manager.
NSX-Controller1> get managers
- 192.168.110.47 Connected
Check the Logical PortsCheck that the logical ports are configured on the same logical switch and their status is up.
Procedure
1 From the NSX Manager GUI, get the logical ports UUIDs.
2 Make the following API call for each logical port to make sure the logical ports are on the same logicalswitch.
GET https://<nsx-mgr>/api/v1/logical-ports/<logical-port-uuid>
3 Make the following API call for each logical port to make sure the status is up.
GET https://<nsx-mgr>/api/v1/logical-ports/<logical-port-uuid>/status
NSX-T Troubleshooting Guide
VMware, Inc. 7
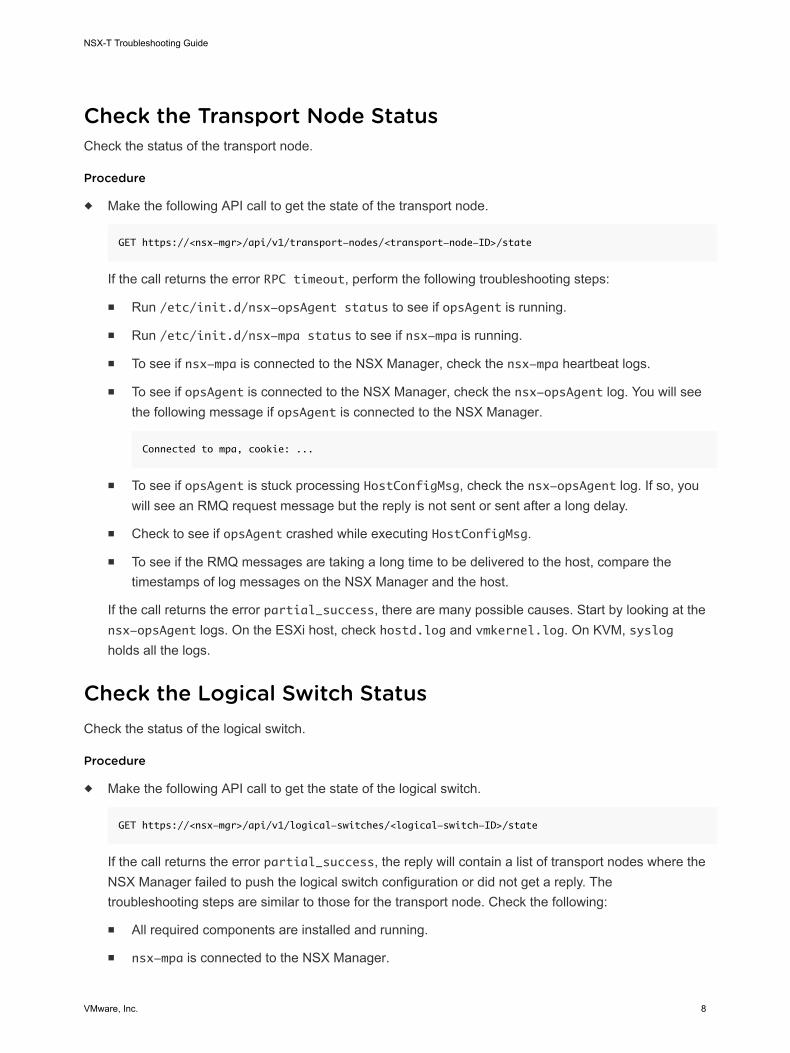
Check the Transport Node StatusCheck the status of the transport node.
Procedure
u Make the following API call to get the state of the transport node.
GET https://<nsx-mgr>/api/v1/transport-nodes/<transport-node-ID>/state
If the call returns the error RPC timeout, perform the following troubleshooting steps:
n Run /etc/init.d/nsx-opsAgent status to see if opsAgent is running.
n Run /etc/init.d/nsx-mpa status to see if nsx-mpa is running.
n To see if nsx-mpa is connected to the NSX Manager, check the nsx-mpa heartbeat logs.
n To see if opsAgent is connected to the NSX Manager, check the nsx-opsAgent log. You will seethe following message if opsAgent is connected to the NSX Manager.
Connected to mpa, cookie: ...
n To see if opsAgent is stuck processing HostConfigMsg, check the nsx-opsAgent log. If so, youwill see an RMQ request message but the reply is not sent or sent after a long delay.
n Check to see if opsAgent crashed while executing HostConfigMsg.
n To see if the RMQ messages are taking a long time to be delivered to the host, compare thetimestamps of log messages on the NSX Manager and the host.
If the call returns the error partial_success, there are many possible causes. Start by looking at thensx-opsAgent logs. On the ESXi host, check hostd.log and vmkernel.log. On KVM, syslogholds all the logs.
Check the Logical Switch StatusCheck the status of the logical switch.
Procedure
u Make the following API call to get the state of the logical switch.
GET https://<nsx-mgr>/api/v1/logical-switches/<logical-switch-ID>/state
If the call returns the error partial_success, the reply will contain a list of transport nodes where theNSX Manager failed to push the logical switch configuration or did not get a reply. Thetroubleshooting steps are similar to those for the transport node. Check the following:
n All required components are installed and running.
n nsx-mpa is connected to the NSX Manager.
NSX-T Troubleshooting Guide
VMware, Inc. 8
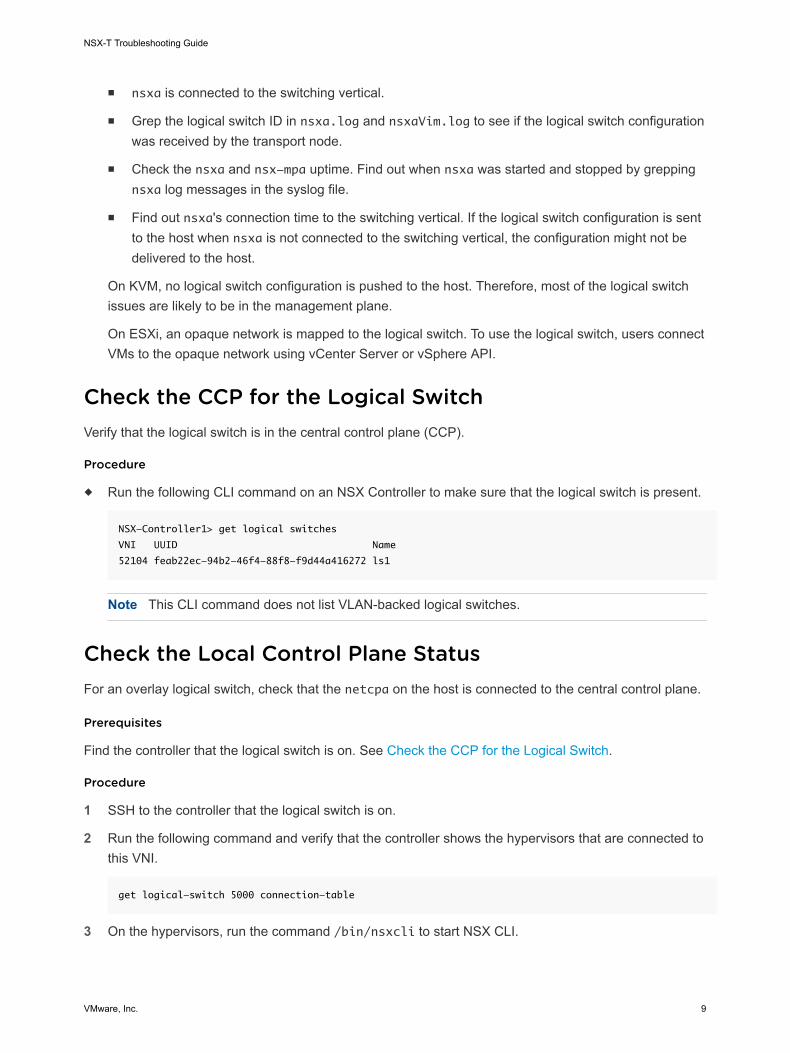
n nsxa is connected to the switching vertical.
n Grep the logical switch ID in nsxa.log and nsxaVim.log to see if the logical switch configurationwas received by the transport node.
n Check the nsxa and nsx-mpa uptime. Find out when nsxa was started and stopped by greppingnsxa log messages in the syslog file.
n Find out nsxa's connection time to the switching vertical. If the logical switch configuration is sentto the host when nsxa is not connected to the switching vertical, the configuration might not bedelivered to the host.
On KVM, no logical switch configuration is pushed to the host. Therefore, most of the logical switchissues are likely to be in the management plane.
On ESXi, an opaque network is mapped to the logical switch. To use the logical switch, users connectVMs to the opaque network using vCenter Server or vSphere API.
Check the CCP for the Logical SwitchVerify that the logical switch is in the central control plane (CCP).
Procedure
u Run the following CLI command on an NSX Controller to make sure that the logical switch is present.
NSX-Controller1> get logical switches
VNI UUID Name
52104 feab22ec-94b2-46f4-88f8-f9d44a416272 ls1
Note This CLI command does not list VLAN-backed logical switches.
Check the Local Control Plane StatusFor an overlay logical switch, check that the netcpa on the host is connected to the central control plane.
Prerequisites
Find the controller that the logical switch is on. See Check the CCP for the Logical Switch.
Procedure
1 SSH to the controller that the logical switch is on.
2 Run the following command and verify that the controller shows the hypervisors that are connected tothis VNI.
get logical-switch 5000 connection-table
3 On the hypervisors, run the command /bin/nsxcli to start NSX CLI.
NSX-T Troubleshooting Guide
VMware, Inc. 9
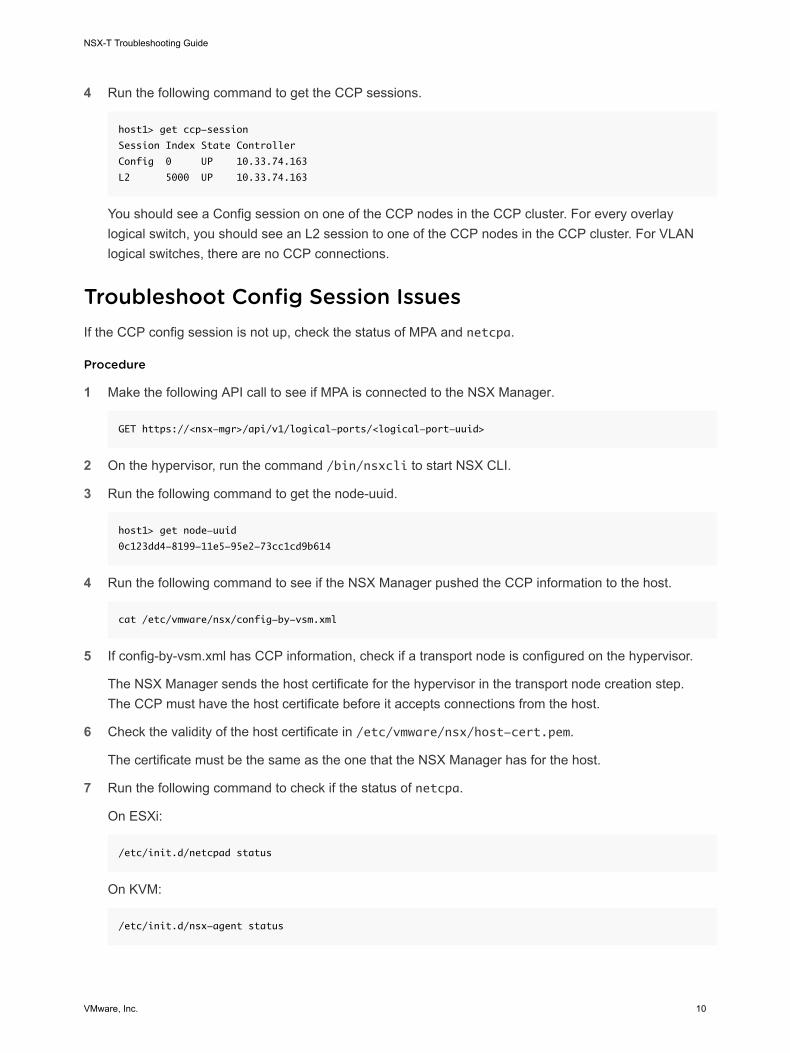
4 Run the following command to get the CCP sessions.
host1> get ccp-session
Session Index State Controller
Config 0 UP 10.33.74.163
L2 5000 UP 10.33.74.163
You should see a Config session on one of the CCP nodes in the CCP cluster. For every overlaylogical switch, you should see an L2 session to one of the CCP nodes in the CCP cluster. For VLANlogical switches, there are no CCP connections.
Troubleshoot Config Session IssuesIf the CCP config session is not up, check the status of MPA and netcpa.
Procedure
1 Make the following API call to see if MPA is connected to the NSX Manager.
GET https://<nsx-mgr>/api/v1/logical-ports/<logical-port-uuid>
2 On the hypervisor, run the command /bin/nsxcli to start NSX CLI.
3 Run the following command to get the node-uuid.
host1> get node-uuid
0c123dd4-8199-11e5-95e2-73cc1cd9b614
4 Run the following command to see if the NSX Manager pushed the CCP information to the host.
cat /etc/vmware/nsx/config-by-vsm.xml
5 If config-by-vsm.xml has CCP information, check if a transport node is configured on the hypervisor.
The NSX Manager sends the host certificate for the hypervisor in the transport node creation step.The CCP must have the host certificate before it accepts connections from the host.
6 Check the validity of the host certificate in /etc/vmware/nsx/host-cert.pem.
The certificate must be the same as the one that the NSX Manager has for the host.
7 Run the following command to check if the status of netcpa.
On ESXi:
/etc/init.d/netcpad status
On KVM:
/etc/init.d/nsx-agent status
NSX-T Troubleshooting Guide
VMware, Inc. 10
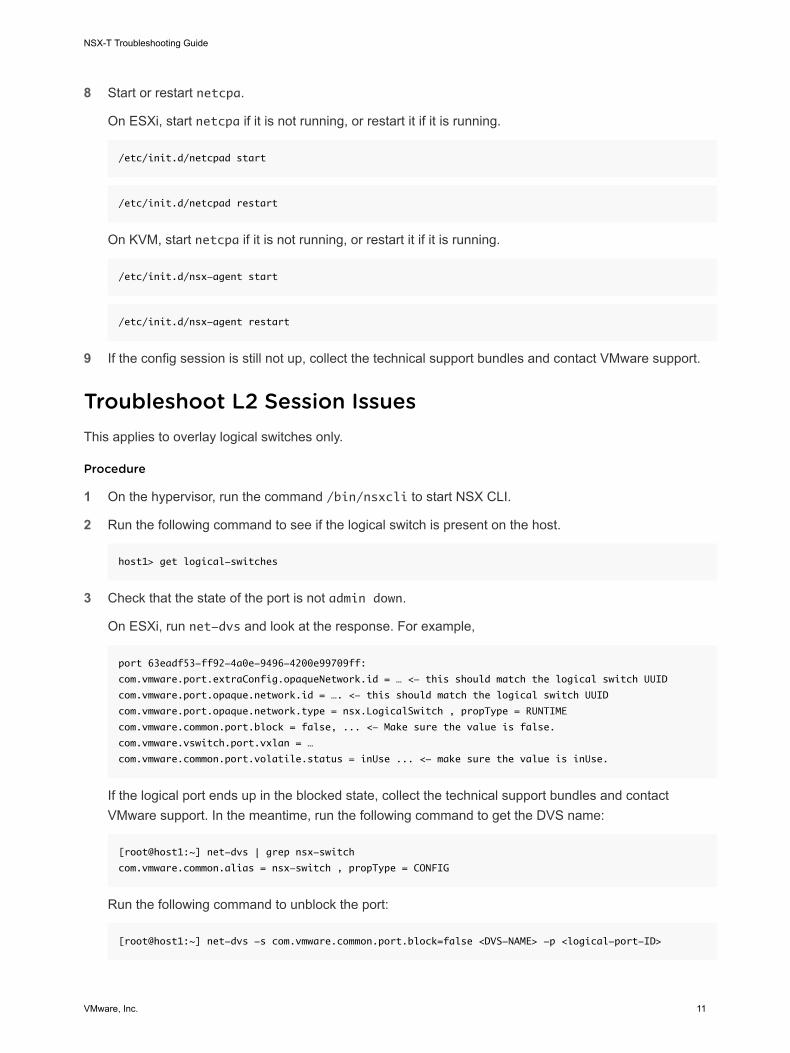
8 Start or restart netcpa.
On ESXi, start netcpa if it is not running, or restart it if it is running.
/etc/init.d/netcpad start
/etc/init.d/netcpad restart
On KVM, start netcpa if it is not running, or restart it if it is running.
/etc/init.d/nsx-agent start
/etc/init.d/nsx-agent restart
9 If the config session is still not up, collect the technical support bundles and contact VMware support.
Troubleshoot L2 Session IssuesThis applies to overlay logical switches only.
Procedure
1 On the hypervisor, run the command /bin/nsxcli to start NSX CLI.
2 Run the following command to see if the logical switch is present on the host.
host1> get logical-switches
3 Check that the state of the port is not admin down.
On ESXi, run net-dvs and look at the response. For example,
port 63eadf53-ff92-4a0e-9496-4200e99709ff:
com.vmware.port.extraConfig.opaqueNetwork.id = … <- this should match the logical switch UUID
com.vmware.port.opaque.network.id = …. <- this should match the logical switch UUID
com.vmware.port.opaque.network.type = nsx.LogicalSwitch , propType = RUNTIME
com.vmware.common.port.block = false, ... <- Make sure the value is false.
com.vmware.vswitch.port.vxlan = …
com.vmware.common.port.volatile.status = inUse ... <- make sure the value is inUse.
If the logical port ends up in the blocked state, collect the technical support bundles and contactVMware support. In the meantime, run the following command to get the DVS name:
[root@host1:~] net-dvs | grep nsx-switch
com.vmware.common.alias = nsx-switch , propType = CONFIG
Run the following command to unblock the port:
[root@host1:~] net-dvs -s com.vmware.common.port.block=false <DVS-NAME> -p <logical-port-ID>
NSX-T Troubleshooting Guide
VMware, Inc. 11
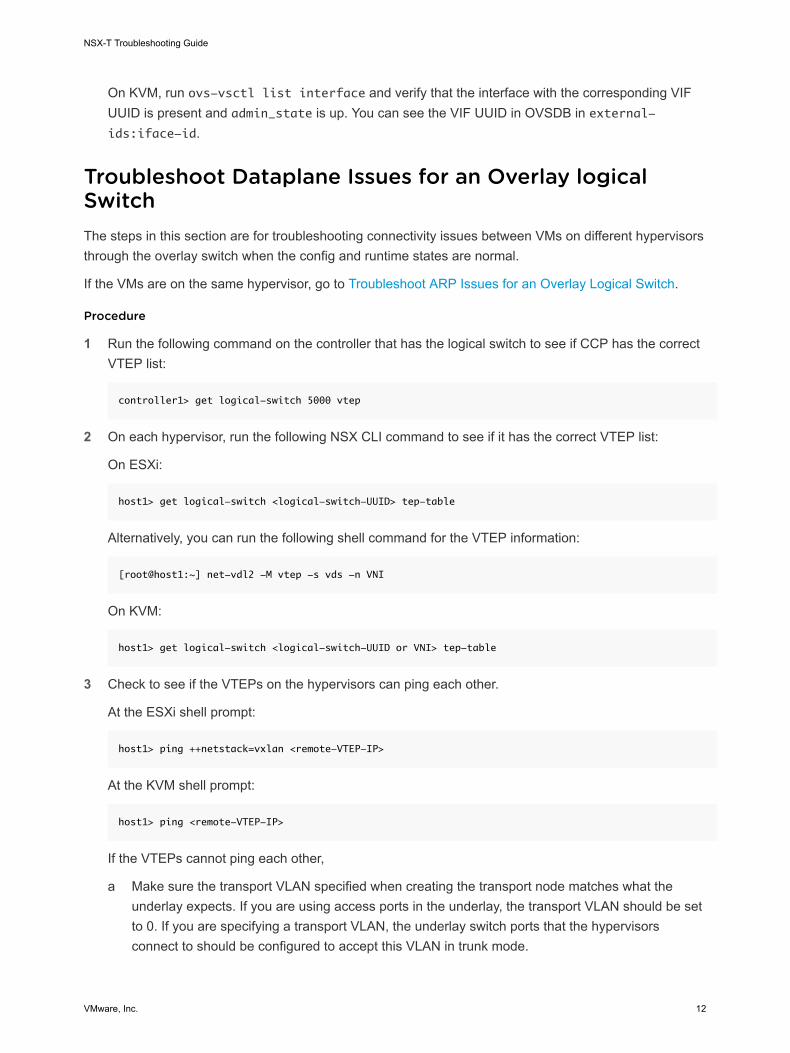
On KVM, run ovs-vsctl list interface and verify that the interface with the corresponding VIFUUID is present and admin_state is up. You can see the VIF UUID in OVSDB in external-ids:iface-id.
Troubleshoot Dataplane Issues for an Overlay logicalSwitchThe steps in this section are for troubleshooting connectivity issues between VMs on different hypervisorsthrough the overlay switch when the config and runtime states are normal.
If the VMs are on the same hypervisor, go to Troubleshoot ARP Issues for an Overlay Logical Switch.
Procedure
1 Run the following command on the controller that has the logical switch to see if CCP has the correctVTEP list:
controller1> get logical-switch 5000 vtep
2 On each hypervisor, run the following NSX CLI command to see if it has the correct VTEP list:
On ESXi:
host1> get logical-switch <logical-switch-UUID> tep-table
Alternatively, you can run the following shell command for the VTEP information:
[root@host1:~] net-vdl2 -M vtep -s vds -n VNI
On KVM:
host1> get logical-switch <logical-switch-UUID or VNI> tep-table
3 Check to see if the VTEPs on the hypervisors can ping each other.
At the ESXi shell prompt:
host1> ping ++netstack=vxlan <remote-VTEP-IP>
At the KVM shell prompt:
host1> ping <remote-VTEP-IP>
If the VTEPs cannot ping each other,
a Make sure the transport VLAN specified when creating the transport node matches what theunderlay expects. If you are using access ports in the underlay, the transport VLAN should be setto 0. If you are specifying a transport VLAN, the underlay switch ports that the hypervisorsconnect to should be configured to accept this VLAN in trunk mode.
NSX-T Troubleshooting Guide
VMware, Inc. 12
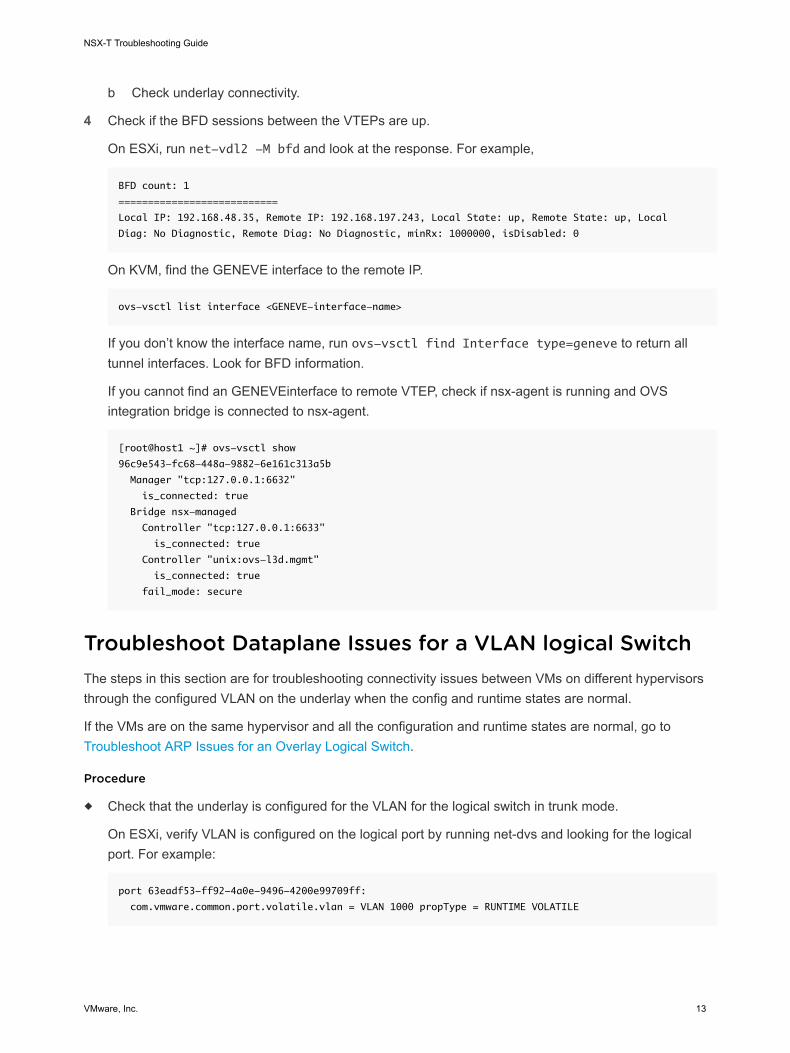
b Check underlay connectivity.
4 Check if the BFD sessions between the VTEPs are up.
On ESXi, run net-vdl2 -M bfd and look at the response. For example,
BFD count: 1
===========================
Local IP: 192.168.48.35, Remote IP: 192.168.197.243, Local State: up, Remote State: up, Local
Diag: No Diagnostic, Remote Diag: No Diagnostic, minRx: 1000000, isDisabled: 0
On KVM, find the GENEVE interface to the remote IP.
ovs-vsctl list interface <GENEVE-interface-name>
If you don’t know the interface name, run ovs-vsctl find Interface type=geneve to return alltunnel interfaces. Look for BFD information.
If you cannot find an GENEVEinterface to remote VTEP, check if nsx-agent is running and OVSintegration bridge is connected to nsx-agent.
[root@host1 ~]# ovs-vsctl show
96c9e543-fc68-448a-9882-6e161c313a5b
Manager "tcp:127.0.0.1:6632"
is_connected: true
Bridge nsx-managed
Controller "tcp:127.0.0.1:6633"
is_connected: true
Controller "unix:ovs-l3d.mgmt"
is_connected: true
fail_mode: secure
Troubleshoot Dataplane Issues for a VLAN logical SwitchThe steps in this section are for troubleshooting connectivity issues between VMs on different hypervisorsthrough the configured VLAN on the underlay when the config and runtime states are normal.
If the VMs are on the same hypervisor and all the configuration and runtime states are normal, go to Troubleshoot ARP Issues for an Overlay Logical Switch.
Procedure
u Check that the underlay is configured for the VLAN for the logical switch in trunk mode.
On ESXi, verify VLAN is configured on the logical port by running net-dvs and looking for the logicalport. For example:
port 63eadf53-ff92-4a0e-9496-4200e99709ff:
com.vmware.common.port.volatile.vlan = VLAN 1000 propType = RUNTIME VOLATILE
NSX-T Troubleshooting Guide
VMware, Inc. 13
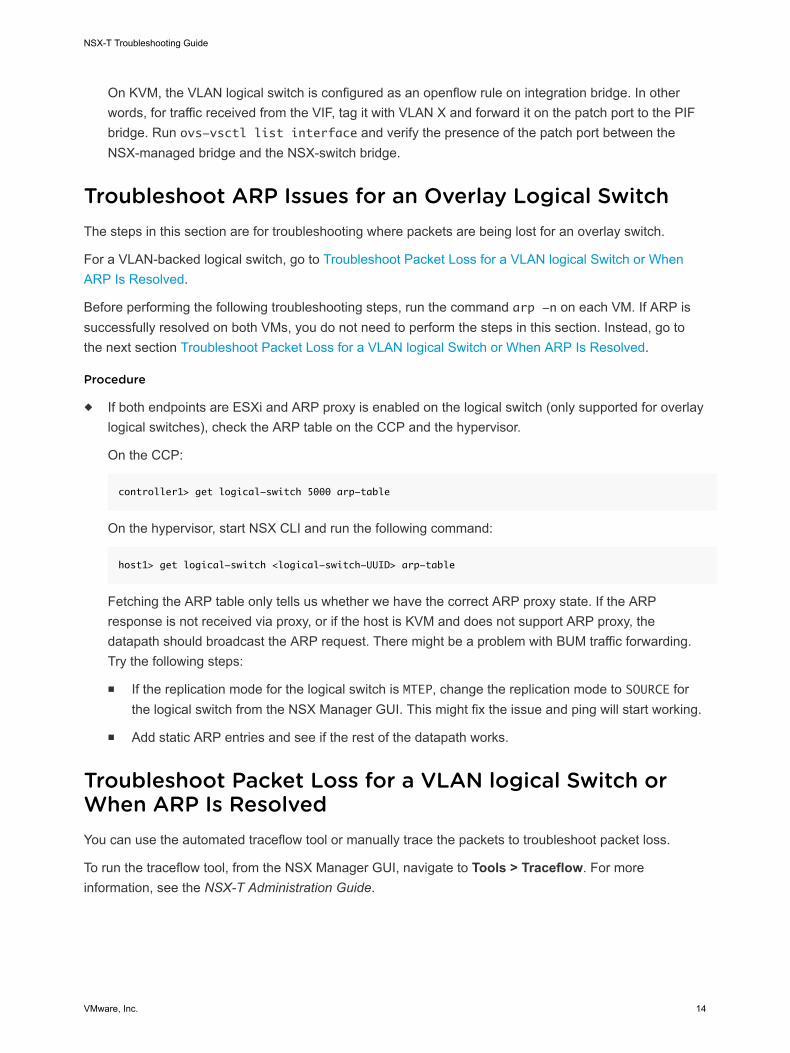
On KVM, the VLAN logical switch is configured as an openflow rule on integration bridge. In otherwords, for traffic received from the VIF, tag it with VLAN X and forward it on the patch port to the PIFbridge. Run ovs-vsctl list interface and verify the presence of the patch port between theNSX-managed bridge and the NSX-switch bridge.
Troubleshoot ARP Issues for an Overlay Logical SwitchThe steps in this section are for troubleshooting where packets are being lost for an overlay switch.
For a VLAN-backed logical switch, go to Troubleshoot Packet Loss for a VLAN logical Switch or WhenARP Is Resolved.
Before performing the following troubleshooting steps, run the command arp -n on each VM. If ARP issuccessfully resolved on both VMs, you do not need to perform the steps in this section. Instead, go tothe next section Troubleshoot Packet Loss for a VLAN logical Switch or When ARP Is Resolved.
Procedure
u If both endpoints are ESXi and ARP proxy is enabled on the logical switch (only supported for overlaylogical switches), check the ARP table on the CCP and the hypervisor.
On the CCP:
controller1> get logical-switch 5000 arp-table
On the hypervisor, start NSX CLI and run the following command:
host1> get logical-switch <logical-switch-UUID> arp-table
Fetching the ARP table only tells us whether we have the correct ARP proxy state. If the ARPresponse is not received via proxy, or if the host is KVM and does not support ARP proxy, thedatapath should broadcast the ARP request. There might be a problem with BUM traffic forwarding.Try the following steps:
n If the replication mode for the logical switch is MTEP, change the replication mode to SOURCE forthe logical switch from the NSX Manager GUI. This might fix the issue and ping will start working.
n Add static ARP entries and see if the rest of the datapath works.
Troubleshoot Packet Loss for a VLAN logical Switch orWhen ARP Is ResolvedYou can use the automated traceflow tool or manually trace the packets to troubleshoot packet loss.
To run the traceflow tool, from the NSX Manager GUI, navigate to Tools > Traceflow. For moreinformation, see the NSX-T Administration Guide.
NSX-T Troubleshooting Guide
VMware, Inc. 14
Procedure
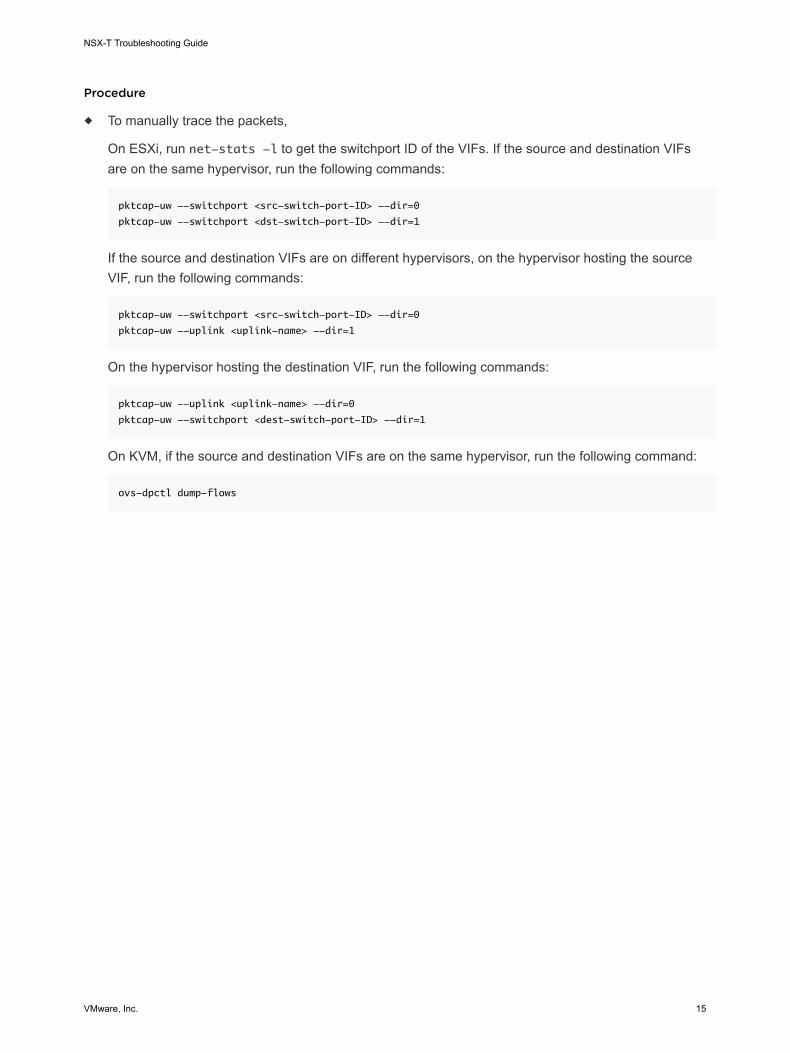
u To manually trace the packets,
On ESXi, run net-stats -l to get the switchport ID of the VIFs. If the source and destination VIFsare on the same hypervisor, run the following commands:
pktcap-uw --switchport <src-switch-port-ID> --dir=0
pktcap-uw --switchport <dst-switch-port-ID> --dir=1
If the source and destination VIFs are on different hypervisors, on the hypervisor hosting the sourceVIF, run the following commands:
pktcap-uw --switchport <src-switch-port-ID> --dir=0
pktcap-uw --uplink <uplink-name> --dir=1
On the hypervisor hosting the destination VIF, run the following commands:
pktcap-uw --uplink <uplink-name> --dir=0
pktcap-uw --switchport <dest-switch-port-ID> --dir=1
On KVM, if the source and destination VIFs are on the same hypervisor, run the following command:
ovs-dpctl dump-flows
NSX-T Troubleshooting Guide
VMware, Inc. 15
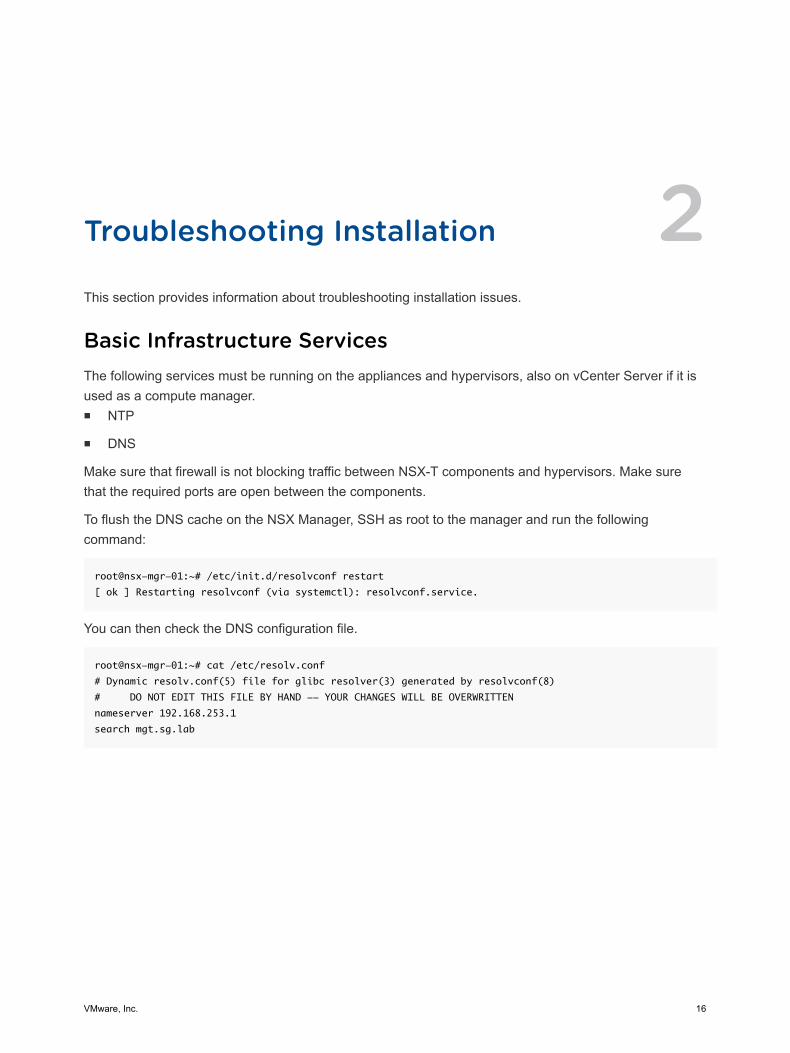
Troubleshooting Installation 2This section provides information about troubleshooting installation issues.
Basic Infrastructure ServicesThe following services must be running on the appliances and hypervisors, also on vCenter Server if it isused as a compute manager.n NTP
n DNS
Make sure that firewall is not blocking traffic between NSX-T components and hypervisors. Make surethat the required ports are open between the components.
To flush the DNS cache on the NSX Manager, SSH as root to the manager and run the followingcommand:
root@nsx-mgr-01:~# /etc/init.d/resolvconf restart
[ ok ] Restarting resolvconf (via systemctl): resolvconf.service.
You can then check the DNS configuration file.
root@nsx-mgr-01:~# cat /etc/resolv.conf
# Dynamic resolv.conf(5) file for glibc resolver(3) generated by resolvconf(8)
# DO NOT EDIT THIS FILE BY HAND -- YOUR CHANGES WILL BE OVERWRITTEN
nameserver 192.168.253.1
search mgt.sg.lab
VMware, Inc. 16
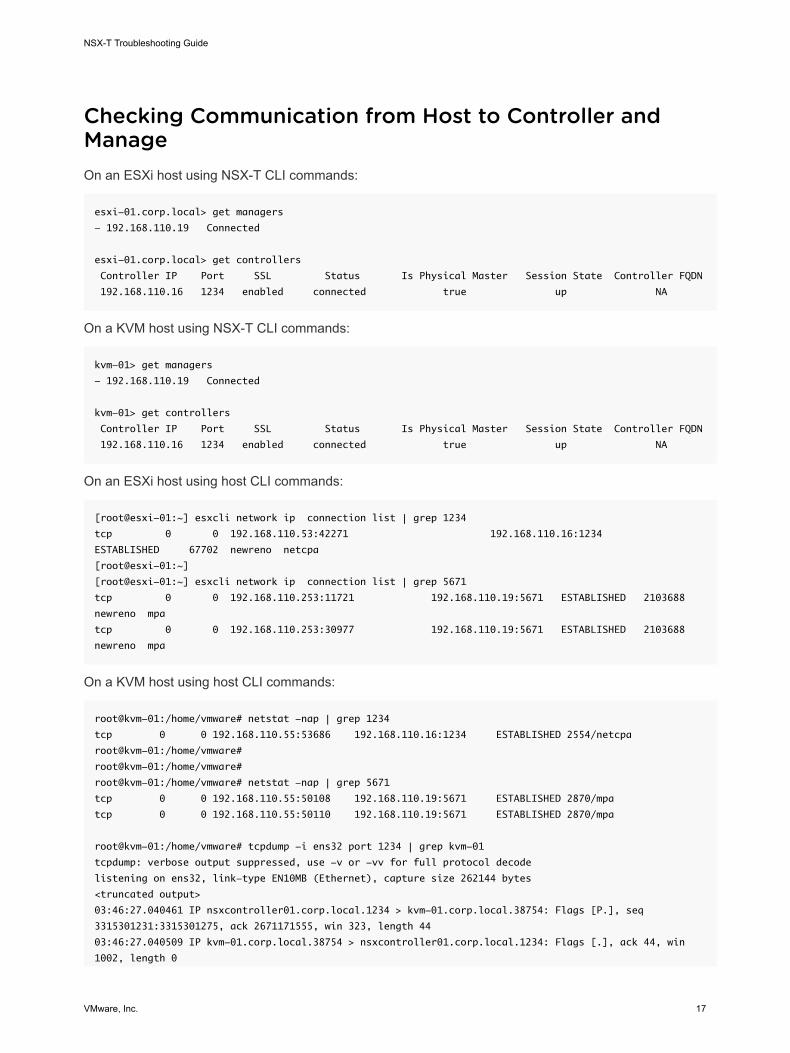
Checking Communication from Host to Controller andManageOn an ESXi host using NSX-T CLI commands:
esxi-01.corp.local> get managers
- 192.168.110.19 Connected
esxi-01.corp.local> get controllers
Controller IP Port SSL Status Is Physical Master Session State Controller FQDN
192.168.110.16 1234 enabled connected true up NA
On a KVM host using NSX-T CLI commands:
kvm-01> get managers
- 192.168.110.19 Connected
kvm-01> get controllers
Controller IP Port SSL Status Is Physical Master Session State Controller FQDN
192.168.110.16 1234 enabled connected true up NA
On an ESXi host using host CLI commands:
[root@esxi-01:~] esxcli network ip connection list | grep 1234
tcp 0 0 192.168.110.53:42271 192.168.110.16:1234
ESTABLISHED 67702 newreno netcpa
[root@esxi-01:~]
[root@esxi-01:~] esxcli network ip connection list | grep 5671
tcp 0 0 192.168.110.253:11721 192.168.110.19:5671 ESTABLISHED 2103688
newreno mpa
tcp 0 0 192.168.110.253:30977 192.168.110.19:5671 ESTABLISHED 2103688
newreno mpa
On a KVM host using host CLI commands:
root@kvm-01:/home/vmware# netstat -nap | grep 1234
tcp 0 0 192.168.110.55:53686 192.168.110.16:1234 ESTABLISHED 2554/netcpa
root@kvm-01:/home/vmware#
root@kvm-01:/home/vmware#
root@kvm-01:/home/vmware# netstat -nap | grep 5671
tcp 0 0 192.168.110.55:50108 192.168.110.19:5671 ESTABLISHED 2870/mpa
tcp 0 0 192.168.110.55:50110 192.168.110.19:5671 ESTABLISHED 2870/mpa
root@kvm-01:/home/vmware# tcpdump -i ens32 port 1234 | grep kvm-01
tcpdump: verbose output suppressed, use -v or -vv for full protocol decode
listening on ens32, link-type EN10MB (Ethernet), capture size 262144 bytes
<truncated output>
03:46:27.040461 IP nsxcontroller01.corp.local.1234 > kvm-01.corp.local.38754: Flags [P.], seq
3315301231:3315301275, ack 2671171555, win 323, length 44
03:46:27.040509 IP kvm-01.corp.local.38754 > nsxcontroller01.corp.local.1234: Flags [.], ack 44, win
1002, length 0
NSX-T Troubleshooting Guide
VMware, Inc. 17
^C
<truncated output>
root@kvm-01:/home/vmware#
root@kvm-01:/home/vmware# tcpdump -i ens32 port 5671 | grep kvm-01
tcpdump: verbose output suppressed, use -v or -vv for full protocol decode
listening on ens32, link-type EN10MB (Ethernet), capture size 262144 bytes
03:51:16.802934 IP kvm-01.corp.local.58954 > nsxmgr01.corp.local.amqps: Flags [P.], seq 1153:1222, ack
1790, win 259, length 69
03:51:16.823328 IP nsxmgr01.corp.local.amqps > kvm-01.corp.local.58954: Flags [P.], seq 1790:1891, ack
1222, win 254, length 101
^C
<truncated output>
Host Registration FailureIf NSX-T uses the wrong IP address, host registration will fail. This can happen when a host has multipleIP addresses. Trying to delete the transport node leaves it in the Orphaned state. To resolve the issue:
n Go to Fabric > Nodes > Hosts, edit the host and remove all IP addresses except the managementone.
n Click on the errors and select Resolve.
KVM Host IssuesKVM host issues are sometimes caused by not enough disk space. The /boot directory can fill up quicklyand cause errors such as:
n Failed to install software on host
n No space left on device
You can run the command df -h to check available storage. If the /boot directory is at 100%, you can dothe following:
n Run sudo dpkg --list 'linux-image*' | grep ^ii to see all the kernels installed.
n Run uname -r to see your currently running kernel. Do not remove this kernel (linux-image).
n Use apt-get purge to remove images you don't need anymore. For example, run sudo apt-getpurge linux-image-3.13.0-32-generic linux-image-3.13.0-33-generic.
n Reboot the host.
n In NSX Manager, check the errors and select Resolve.
n Make sure the VMs are powered on.
NSX-T Troubleshooting Guide
VMware, Inc. 18
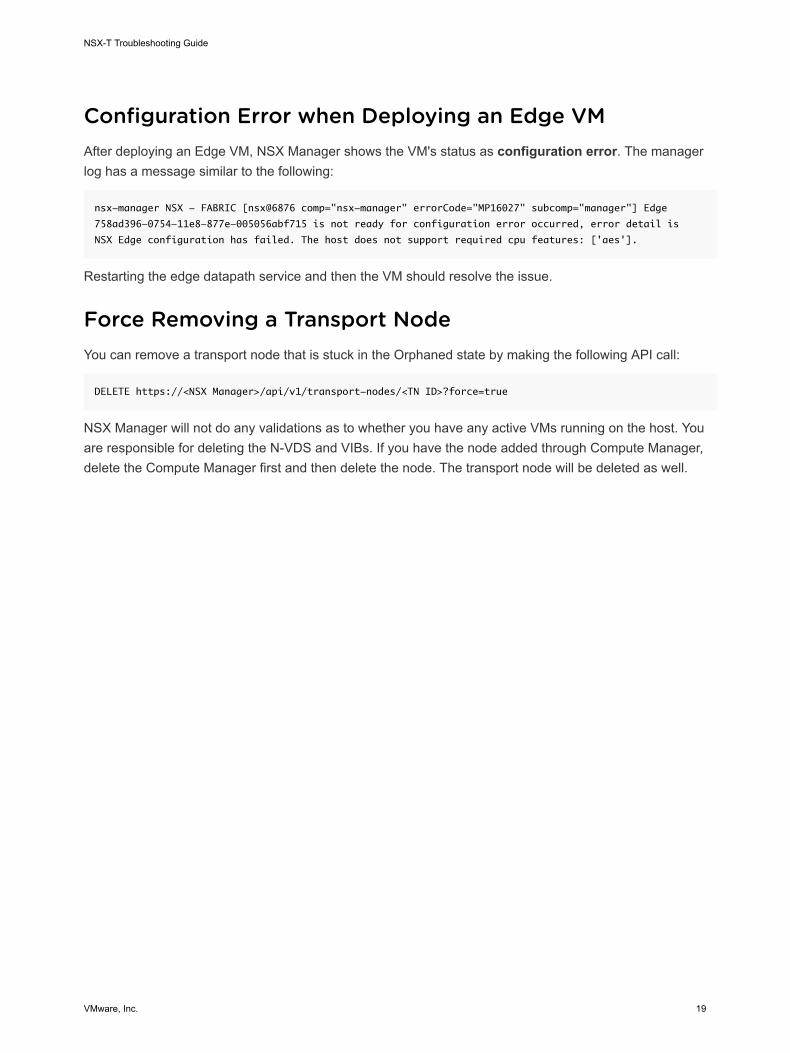
Configuration Error when Deploying an Edge VMAfter deploying an Edge VM, NSX Manager shows the VM's status as configuration error. The managerlog has a message similar to the following:
nsx-manager NSX - FABRIC [nsx@6876 comp="nsx-manager" errorCode="MP16027" subcomp="manager"] Edge
758ad396-0754-11e8-877e-005056abf715 is not ready for configuration error occurred, error detail is
NSX Edge configuration has failed. The host does not support required cpu features: ['aes'].
Restarting the edge datapath service and then the VM should resolve the issue.
Force Removing a Transport NodeYou can remove a transport node that is stuck in the Orphaned state by making the following API call:
DELETE https://<NSX Manager>/api/v1/transport-nodes/<TN ID>?force=true
NSX Manager will not do any validations as to whether you have any active VMs running on the host. Youare responsible for deleting the N-VDS and VIBs. If you have the node added through Compute Manager,delete the Compute Manager first and then delete the node. The transport node will be deleted as well.
NSX-T Troubleshooting Guide
VMware, Inc. 19
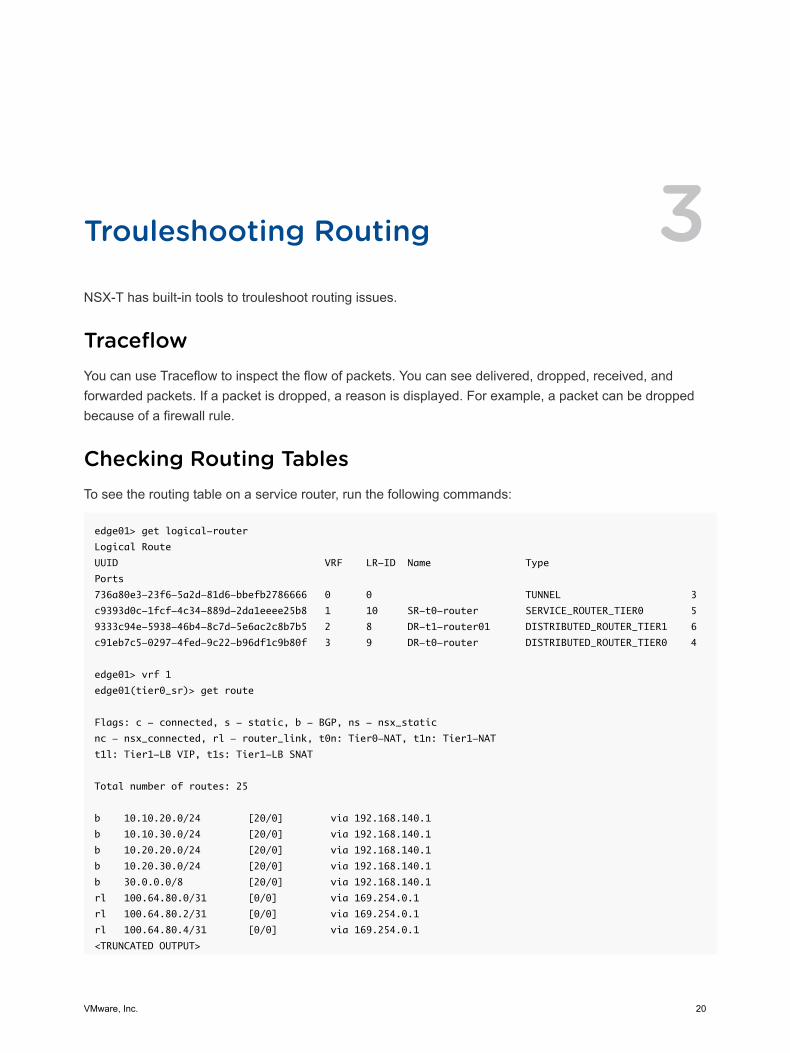
Trouleshooting Routing 3NSX-T has built-in tools to trouleshoot routing issues.
TraceflowYou can use Traceflow to inspect the flow of packets. You can see delivered, dropped, received, andforwarded packets. If a packet is dropped, a reason is displayed. For example, a packet can be droppedbecause of a firewall rule.
Checking Routing TablesTo see the routing table on a service router, run the following commands:
edge01> get logical-router
Logical Route
UUID VRF LR-ID Name Type
Ports
736a80e3-23f6-5a2d-81d6-bbefb2786666 0 0 TUNNEL 3
c9393d0c-1fcf-4c34-889d-2da1eeee25b8 1 10 SR-t0-router SERVICE_ROUTER_TIER0 5
9333c94e-5938-46b4-8c7d-5e6ac2c8b7b5 2 8 DR-t1-router01 DISTRIBUTED_ROUTER_TIER1 6
c91eb7c5-0297-4fed-9c22-b96df1c9b80f 3 9 DR-t0-router DISTRIBUTED_ROUTER_TIER0 4
edge01> vrf 1
edge01(tier0_sr)> get route
Flags: c - connected, s - static, b - BGP, ns - nsx_static
nc - nsx_connected, rl - router_link, t0n: Tier0-NAT, t1n: Tier1-NAT
t1l: Tier1-LB VIP, t1s: Tier1-LB SNAT
Total number of routes: 25
b 10.10.20.0/24 [20/0] via 192.168.140.1
b 10.10.30.0/24 [20/0] via 192.168.140.1
b 10.20.20.0/24 [20/0] via 192.168.140.1
b 10.20.30.0/24 [20/0] via 192.168.140.1
b 30.0.0.0/8 [20/0] via 192.168.140.1
rl 100.64.80.0/31 [0/0] via 169.254.0.1
rl 100.64.80.2/31 [0/0] via 169.254.0.1
rl 100.64.80.4/31 [0/0] via 169.254.0.1
<TRUNCATED OUTPUT>
VMware, Inc. 20
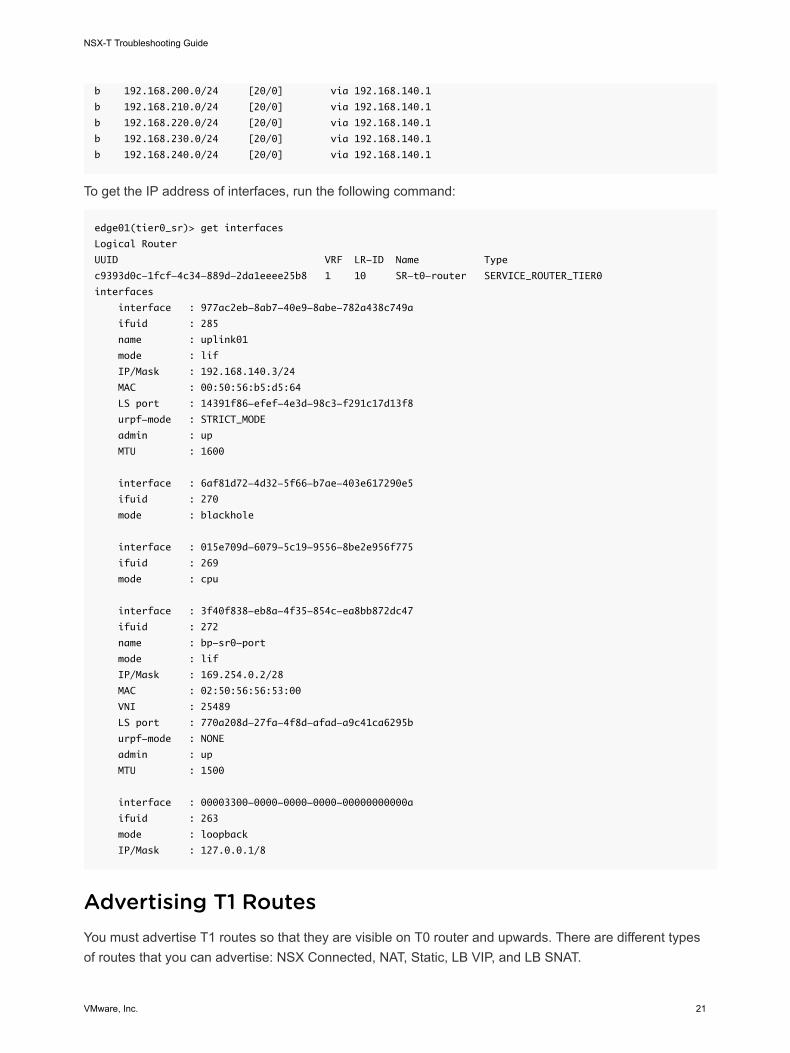
b 192.168.200.0/24 [20/0] via 192.168.140.1
b 192.168.210.0/24 [20/0] via 192.168.140.1
b 192.168.220.0/24 [20/0] via 192.168.140.1
b 192.168.230.0/24 [20/0] via 192.168.140.1
b 192.168.240.0/24 [20/0] via 192.168.140.1
To get the IP address of interfaces, run the following command:
edge01(tier0_sr)> get interfaces
Logical Router
UUID VRF LR-ID Name Type
c9393d0c-1fcf-4c34-889d-2da1eeee25b8 1 10 SR-t0-router SERVICE_ROUTER_TIER0
interfaces
interface : 977ac2eb-8ab7-40e9-8abe-782a438c749a
ifuid : 285
name : uplink01
mode : lif
IP/Mask : 192.168.140.3/24
MAC : 00:50:56:b5:d5:64
LS port : 14391f86-efef-4e3d-98c3-f291c17d13f8
urpf-mode : STRICT_MODE
admin : up
MTU : 1600
interface : 6af81d72-4d32-5f66-b7ae-403e617290e5
ifuid : 270
mode : blackhole
interface : 015e709d-6079-5c19-9556-8be2e956f775
ifuid : 269
mode : cpu
interface : 3f40f838-eb8a-4f35-854c-ea8bb872dc47
ifuid : 272
name : bp-sr0-port
mode : lif
IP/Mask : 169.254.0.2/28
MAC : 02:50:56:56:53:00
VNI : 25489
LS port : 770a208d-27fa-4f8d-afad-a9c41ca6295b
urpf-mode : NONE
admin : up
MTU : 1500
interface : 00003300-0000-0000-0000-00000000000a
ifuid : 263
mode : loopback
IP/Mask : 127.0.0.1/8
Advertising T1 RoutesYou must advertise T1 routes so that they are visible on T0 router and upwards. There are different typesof routes that you can advertise: NSX Connected, NAT, Static, LB VIP, and LB SNAT.
NSX-T Troubleshooting Guide
VMware, Inc. 21
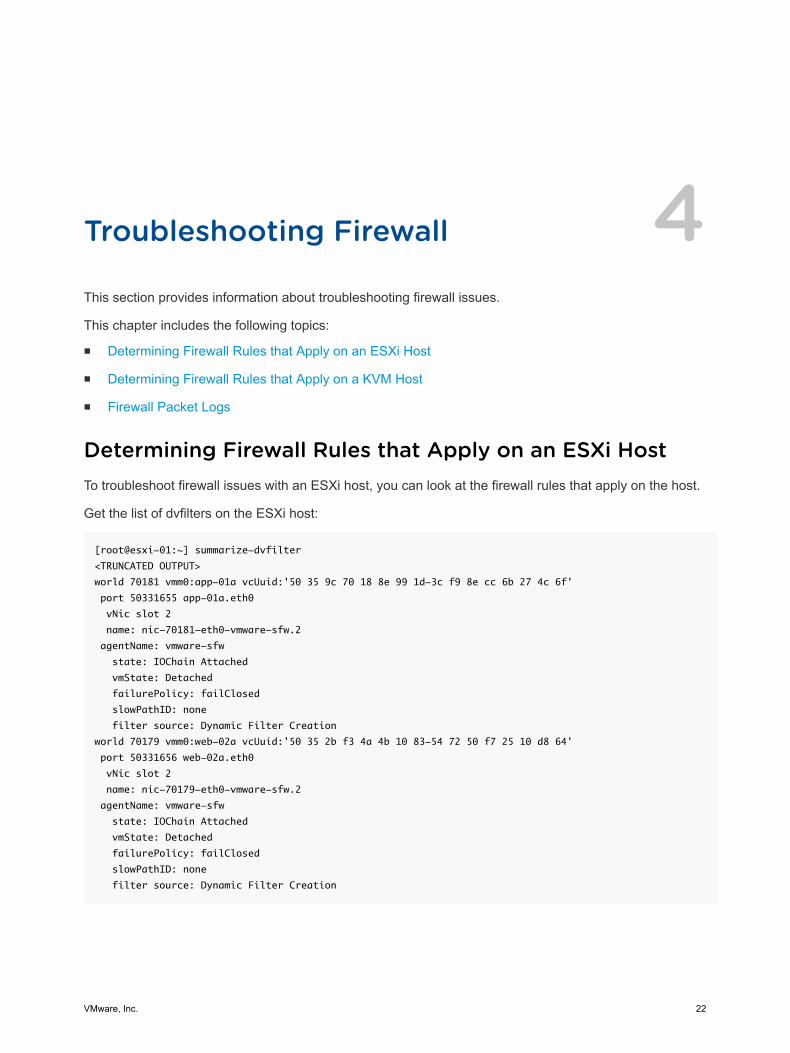
Troubleshooting Firewall 4This section provides information about troubleshooting firewall issues.
This chapter includes the following topics:
n Determining Firewall Rules that Apply on an ESXi Host
n Determining Firewall Rules that Apply on a KVM Host
n Firewall Packet Logs
Determining Firewall Rules that Apply on an ESXi HostTo troubleshoot firewall issues with an ESXi host, you can look at the firewall rules that apply on the host.
Get the list of dvfilters on the ESXi host:
[root@esxi-01:~] summarize-dvfilter
<TRUNCATED OUTPUT>
world 70181 vmm0:app-01a vcUuid:'50 35 9c 70 18 8e 99 1d-3c f9 8e cc 6b 27 4c 6f'
port 50331655 app-01a.eth0
vNic slot 2
name: nic-70181-eth0-vmware-sfw.2
agentName: vmware-sfw
state: IOChain Attached
vmState: Detached
failurePolicy: failClosed
slowPathID: none
filter source: Dynamic Filter Creation
world 70179 vmm0:web-02a vcUuid:'50 35 2b f3 4a 4b 10 83-54 72 50 f7 25 10 d8 64'
port 50331656 web-02a.eth0
vNic slot 2
name: nic-70179-eth0-vmware-sfw.2
agentName: vmware-sfw
state: IOChain Attached
vmState: Detached
failurePolicy: failClosed
slowPathID: none
filter source: Dynamic Filter Creation
VMware, Inc. 22
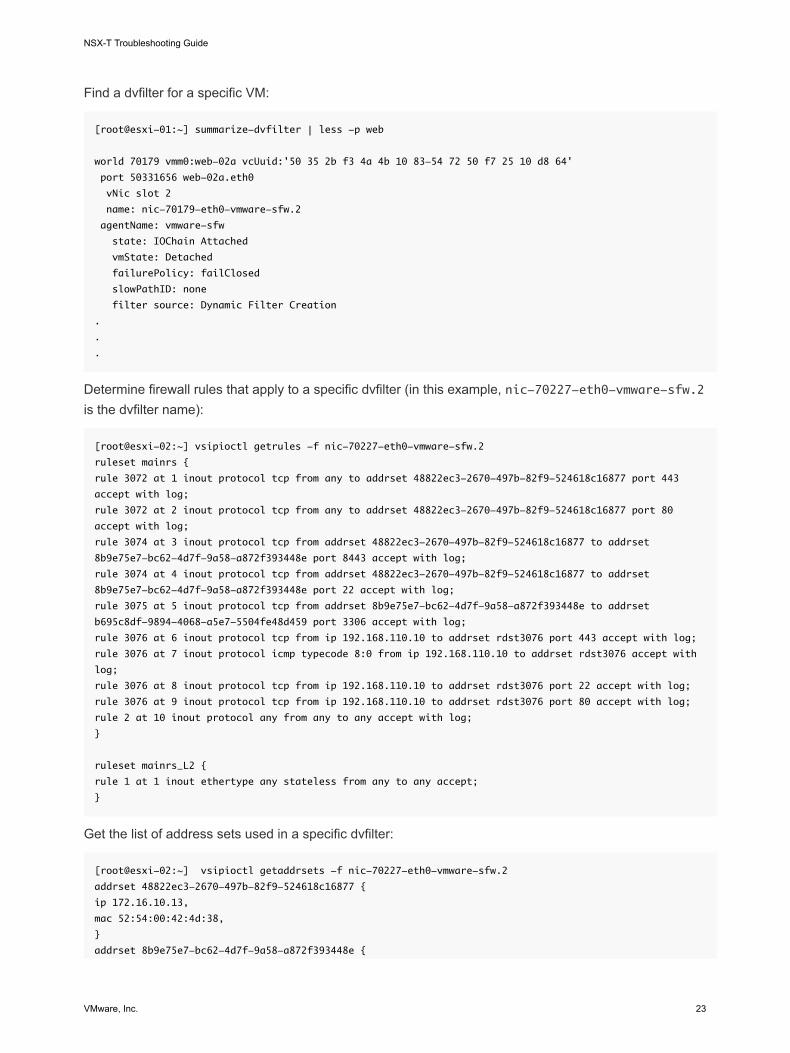
Find a dvfilter for a specific VM:
[root@esxi-01:~] summarize-dvfilter | less -p web
world 70179 vmm0:web-02a vcUuid:'50 35 2b f3 4a 4b 10 83-54 72 50 f7 25 10 d8 64'
port 50331656 web-02a.eth0
vNic slot 2
name: nic-70179-eth0-vmware-sfw.2
agentName: vmware-sfw
state: IOChain Attached
vmState: Detached
failurePolicy: failClosed
slowPathID: none
filter source: Dynamic Filter Creation
.
.
.
Determine firewall rules that apply to a specific dvfilter (in this example, nic-70227-eth0-vmware-sfw.2is the dvfilter name):
[root@esxi-02:~] vsipioctl getrules -f nic-70227-eth0-vmware-sfw.2
ruleset mainrs {
rule 3072 at 1 inout protocol tcp from any to addrset 48822ec3-2670-497b-82f9-524618c16877 port 443
accept with log;
rule 3072 at 2 inout protocol tcp from any to addrset 48822ec3-2670-497b-82f9-524618c16877 port 80
accept with log;
rule 3074 at 3 inout protocol tcp from addrset 48822ec3-2670-497b-82f9-524618c16877 to addrset
8b9e75e7-bc62-4d7f-9a58-a872f393448e port 8443 accept with log;
rule 3074 at 4 inout protocol tcp from addrset 48822ec3-2670-497b-82f9-524618c16877 to addrset
8b9e75e7-bc62-4d7f-9a58-a872f393448e port 22 accept with log;
rule 3075 at 5 inout protocol tcp from addrset 8b9e75e7-bc62-4d7f-9a58-a872f393448e to addrset
b695c8df-9894-4068-a5e7-5504fe48d459 port 3306 accept with log;
rule 3076 at 6 inout protocol tcp from ip 192.168.110.10 to addrset rdst3076 port 443 accept with log;
rule 3076 at 7 inout protocol icmp typecode 8:0 from ip 192.168.110.10 to addrset rdst3076 accept with
log;
rule 3076 at 8 inout protocol tcp from ip 192.168.110.10 to addrset rdst3076 port 22 accept with log;
rule 3076 at 9 inout protocol tcp from ip 192.168.110.10 to addrset rdst3076 port 80 accept with log;
rule 2 at 10 inout protocol any from any to any accept with log;
}
ruleset mainrs_L2 {
rule 1 at 1 inout ethertype any stateless from any to any accept;
}
Get the list of address sets used in a specific dvfilter:
[root@esxi-02:~] vsipioctl getaddrsets -f nic-70227-eth0-vmware-sfw.2
addrset 48822ec3-2670-497b-82f9-524618c16877 {
ip 172.16.10.13,
mac 52:54:00:42:4d:38,
}
addrset 8b9e75e7-bc62-4d7f-9a58-a872f393448e {
NSX-T Troubleshooting Guide
VMware, Inc. 23
}
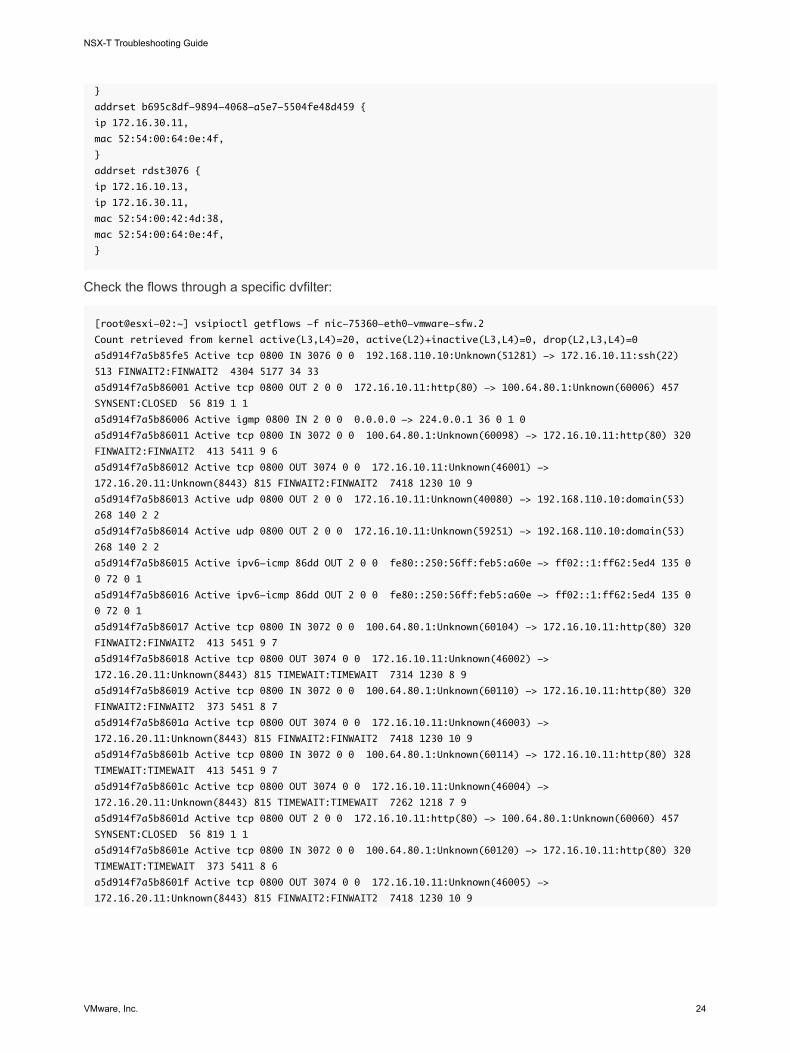
addrset b695c8df-9894-4068-a5e7-5504fe48d459 {
ip 172.16.30.11,
mac 52:54:00:64:0e:4f,
}
addrset rdst3076 {
ip 172.16.10.13,
ip 172.16.30.11,
mac 52:54:00:42:4d:38,
mac 52:54:00:64:0e:4f,
}
Check the flows through a specific dvfilter:
[root@esxi-02:~] vsipioctl getflows -f nic-75360-eth0-vmware-sfw.2
Count retrieved from kernel active(L3,L4)=20, active(L2)+inactive(L3,L4)=0, drop(L2,L3,L4)=0
a5d914f7a5b85fe5 Active tcp 0800 IN 3076 0 0 192.168.110.10:Unknown(51281) -> 172.16.10.11:ssh(22)
513 FINWAIT2:FINWAIT2 4304 5177 34 33
a5d914f7a5b86001 Active tcp 0800 OUT 2 0 0 172.16.10.11:http(80) -> 100.64.80.1:Unknown(60006) 457
SYNSENT:CLOSED 56 819 1 1
a5d914f7a5b86006 Active igmp 0800 IN 2 0 0 0.0.0.0 -> 224.0.0.1 36 0 1 0
a5d914f7a5b86011 Active tcp 0800 IN 3072 0 0 100.64.80.1:Unknown(60098) -> 172.16.10.11:http(80) 320
FINWAIT2:FINWAIT2 413 5411 9 6
a5d914f7a5b86012 Active tcp 0800 OUT 3074 0 0 172.16.10.11:Unknown(46001) ->
172.16.20.11:Unknown(8443) 815 FINWAIT2:FINWAIT2 7418 1230 10 9
a5d914f7a5b86013 Active udp 0800 OUT 2 0 0 172.16.10.11:Unknown(40080) -> 192.168.110.10:domain(53)
268 140 2 2
a5d914f7a5b86014 Active udp 0800 OUT 2 0 0 172.16.10.11:Unknown(59251) -> 192.168.110.10:domain(53)
268 140 2 2
a5d914f7a5b86015 Active ipv6-icmp 86dd OUT 2 0 0 fe80::250:56ff:feb5:a60e -> ff02::1:ff62:5ed4 135 0
0 72 0 1
a5d914f7a5b86016 Active ipv6-icmp 86dd OUT 2 0 0 fe80::250:56ff:feb5:a60e -> ff02::1:ff62:5ed4 135 0
0 72 0 1
a5d914f7a5b86017 Active tcp 0800 IN 3072 0 0 100.64.80.1:Unknown(60104) -> 172.16.10.11:http(80) 320
FINWAIT2:FINWAIT2 413 5451 9 7
a5d914f7a5b86018 Active tcp 0800 OUT 3074 0 0 172.16.10.11:Unknown(46002) ->
172.16.20.11:Unknown(8443) 815 TIMEWAIT:TIMEWAIT 7314 1230 8 9
a5d914f7a5b86019 Active tcp 0800 IN 3072 0 0 100.64.80.1:Unknown(60110) -> 172.16.10.11:http(80) 320
FINWAIT2:FINWAIT2 373 5451 8 7
a5d914f7a5b8601a Active tcp 0800 OUT 3074 0 0 172.16.10.11:Unknown(46003) ->
172.16.20.11:Unknown(8443) 815 FINWAIT2:FINWAIT2 7418 1230 10 9
a5d914f7a5b8601b Active tcp 0800 IN 3072 0 0 100.64.80.1:Unknown(60114) -> 172.16.10.11:http(80) 328
TIMEWAIT:TIMEWAIT 413 5451 9 7
a5d914f7a5b8601c Active tcp 0800 OUT 3074 0 0 172.16.10.11:Unknown(46004) ->
172.16.20.11:Unknown(8443) 815 TIMEWAIT:TIMEWAIT 7262 1218 7 9
a5d914f7a5b8601d Active tcp 0800 OUT 2 0 0 172.16.10.11:http(80) -> 100.64.80.1:Unknown(60060) 457
SYNSENT:CLOSED 56 819 1 1
a5d914f7a5b8601e Active tcp 0800 IN 3072 0 0 100.64.80.1:Unknown(60120) -> 172.16.10.11:http(80) 320
TIMEWAIT:TIMEWAIT 373 5411 8 6
a5d914f7a5b8601f Active tcp 0800 OUT 3074 0 0 172.16.10.11:Unknown(46005) ->
172.16.20.11:Unknown(8443) 815 FINWAIT2:FINWAIT2 7418 1230 10 9
NSX-T Troubleshooting Guide
VMware, Inc. 24
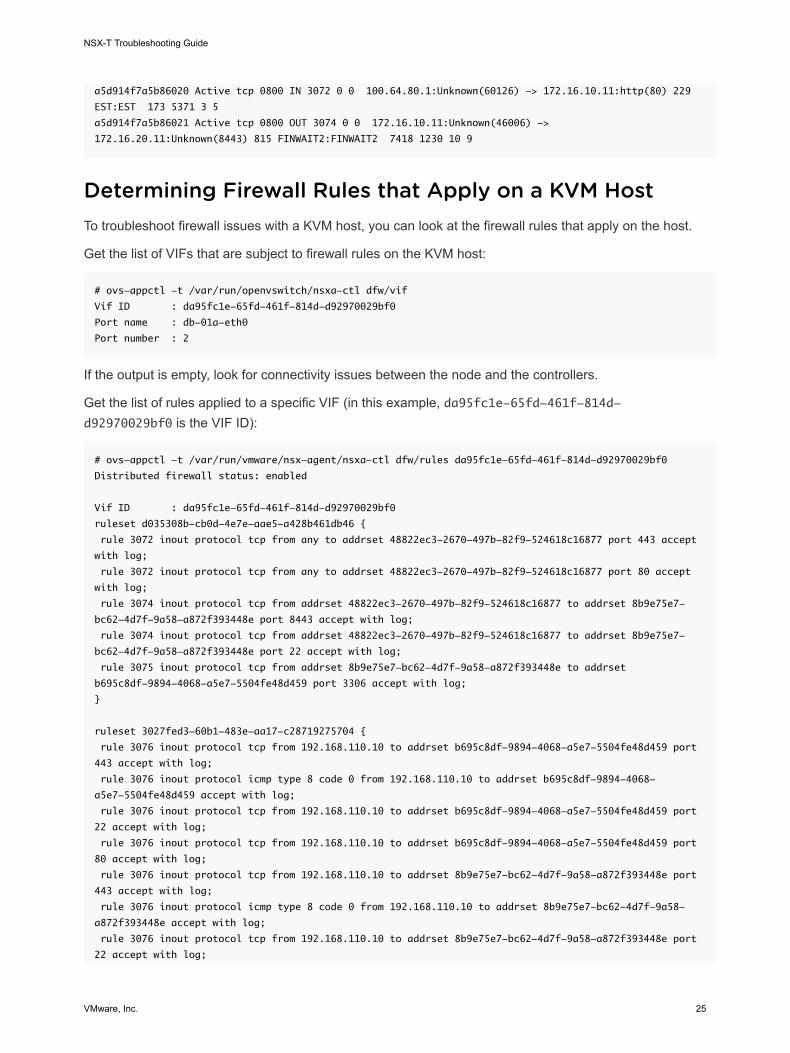
a5d914f7a5b86020 Active tcp 0800 IN 3072 0 0 100.64.80.1:Unknown(60126) -> 172.16.10.11:http(80) 229
EST:EST 173 5371 3 5
a5d914f7a5b86021 Active tcp 0800 OUT 3074 0 0 172.16.10.11:Unknown(46006) ->
172.16.20.11:Unknown(8443) 815 FINWAIT2:FINWAIT2 7418 1230 10 9
Determining Firewall Rules that Apply on a KVM HostTo troubleshoot firewall issues with a KVM host, you can look at the firewall rules that apply on the host.
Get the list of VIFs that are subject to firewall rules on the KVM host:
# ovs-appctl -t /var/run/openvswitch/nsxa-ctl dfw/vif
Vif ID : da95fc1e-65fd-461f-814d-d92970029bf0
Port name : db-01a-eth0
Port number : 2
If the output is empty, look for connectivity issues between the node and the controllers.
Get the list of rules applied to a specific VIF (in this example, da95fc1e-65fd-461f-814d-d92970029bf0 is the VIF ID):
# ovs-appctl -t /var/run/vmware/nsx-agent/nsxa-ctl dfw/rules da95fc1e-65fd-461f-814d-d92970029bf0
Distributed firewall status: enabled
Vif ID : da95fc1e-65fd-461f-814d-d92970029bf0
ruleset d035308b-cb0d-4e7e-aae5-a428b461db46 {
rule 3072 inout protocol tcp from any to addrset 48822ec3-2670-497b-82f9-524618c16877 port 443 accept
with log;
rule 3072 inout protocol tcp from any to addrset 48822ec3-2670-497b-82f9-524618c16877 port 80 accept
with log;
rule 3074 inout protocol tcp from addrset 48822ec3-2670-497b-82f9-524618c16877 to addrset 8b9e75e7-
bc62-4d7f-9a58-a872f393448e port 8443 accept with log;
rule 3074 inout protocol tcp from addrset 48822ec3-2670-497b-82f9-524618c16877 to addrset 8b9e75e7-
bc62-4d7f-9a58-a872f393448e port 22 accept with log;
rule 3075 inout protocol tcp from addrset 8b9e75e7-bc62-4d7f-9a58-a872f393448e to addrset
b695c8df-9894-4068-a5e7-5504fe48d459 port 3306 accept with log;
}
ruleset 3027fed3-60b1-483e-aa17-c28719275704 {
rule 3076 inout protocol tcp from 192.168.110.10 to addrset b695c8df-9894-4068-a5e7-5504fe48d459 port
443 accept with log;
rule 3076 inout protocol icmp type 8 code 0 from 192.168.110.10 to addrset b695c8df-9894-4068-
a5e7-5504fe48d459 accept with log;
rule 3076 inout protocol tcp from 192.168.110.10 to addrset b695c8df-9894-4068-a5e7-5504fe48d459 port
22 accept with log;
rule 3076 inout protocol tcp from 192.168.110.10 to addrset b695c8df-9894-4068-a5e7-5504fe48d459 port
80 accept with log;
rule 3076 inout protocol tcp from 192.168.110.10 to addrset 8b9e75e7-bc62-4d7f-9a58-a872f393448e port
443 accept with log;
rule 3076 inout protocol icmp type 8 code 0 from 192.168.110.10 to addrset 8b9e75e7-bc62-4d7f-9a58-
a872f393448e accept with log;
rule 3076 inout protocol tcp from 192.168.110.10 to addrset 8b9e75e7-bc62-4d7f-9a58-a872f393448e port
22 accept with log;
NSX-T Troubleshooting Guide
VMware, Inc. 25
rule 3076 inout protocol tcp from 192.168.110.10 to addrset 8b9e75e7-bc62-4d7f-9a58-a872f393448e port
80 accept with log;
rule 3076 inout protocol tcp from 192.168.110.10 to addrset 48822ec3-2670-497b-82f9-524618c16877 port
443 accept with log;
rule 3076 inout protocol icmp type 8 code 0 from 192.168.110.10 to addrset
48822ec3-2670-497b-82f9-524618c16877 accept with log;
rule 3076 inout protocol tcp from 192.168.110.10 to addrset 48822ec3-2670-497b-82f9-524618c16877 port
22 accept with log;
rule 3076 inout protocol tcp from 192.168.110.10 to addrset 48822ec3-2670-497b-82f9-524618c16877 port
80 accept with log;
}
ruleset 5e9bdcb3-adba-4f67-a680-5e6ed5b8f40a {
rule 2 inout protocol any from any to any accept with log;
}
ruleset ddf93011-4078-4006-b8f8-73f979d7a717 {
rule 1 inout ethertype any stateless from any to any accept;
}
Get the list of address sets used in a specific VIF:
# ovs-appctl -t /var/run/vmware/nsx-agent/nsxa-ctl dfw/addrsets da95fc1e-65fd-461f-814d-d92970029bf0
48822ec3-2670-497b-82f9-524618c16877 {
mac 52:54:00:42:4d:38,
ip 172.16.10.13,
}
8b9e75e7-bc62-4d7f-9a58-a872f393448e {
}
b695c8df-9894-4068-a5e7-5504fe48d459 {
mac 52:54:00:64:0e:4f,
ip 172.16.30.11,
}
Check connections through the Linux Conntrack module. In this example, we look for flows between twospecific IP addresses.
# ovs-appctl -t ovs-l3d conntrack/show | grep 192.168.110.10 | grep 172.16.10.13
ACTIVE
icmp,orig=(src=192.168.110.10,dst=172.16.10.13,id=1,type=8,code=0),reply=(src=172.16.10.13,dst=192.168.
110.10,id=1,type=0,code=0),start=2018-03-26T04:43:28.325,id=3122159040,zone=23119,status=SEEN_REPLY|
CONFIRMED,timeout=29,mark=3076,labels=0x1f
Firewall Packet LogsIf logging is enabled for firewall rules, you can look at the firewall packet logs to troubleshoot issues.
NSX-T Troubleshooting Guide
VMware, Inc. 26
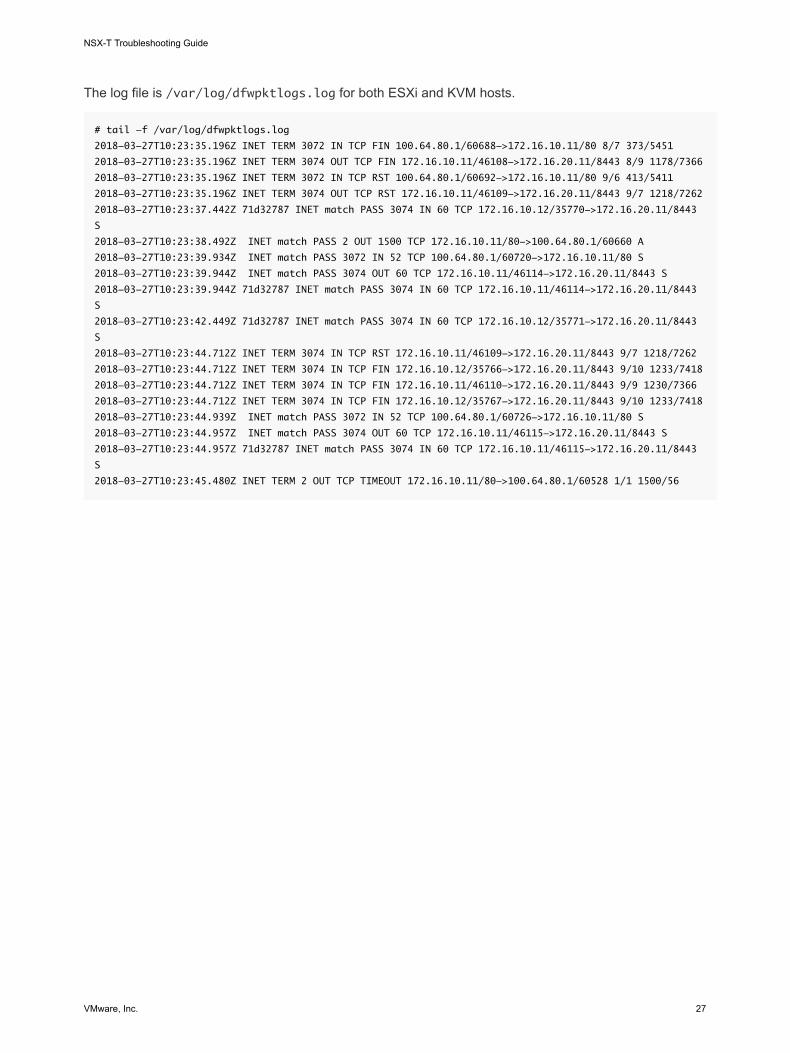
The log file is /var/log/dfwpktlogs.log for both ESXi and KVM hosts.
# tail -f /var/log/dfwpktlogs.log
2018-03-27T10:23:35.196Z INET TERM 3072 IN TCP FIN 100.64.80.1/60688->172.16.10.11/80 8/7 373/5451
2018-03-27T10:23:35.196Z INET TERM 3074 OUT TCP FIN 172.16.10.11/46108->172.16.20.11/8443 8/9 1178/7366
2018-03-27T10:23:35.196Z INET TERM 3072 IN TCP RST 100.64.80.1/60692->172.16.10.11/80 9/6 413/5411
2018-03-27T10:23:35.196Z INET TERM 3074 OUT TCP RST 172.16.10.11/46109->172.16.20.11/8443 9/7 1218/7262
2018-03-27T10:23:37.442Z 71d32787 INET match PASS 3074 IN 60 TCP 172.16.10.12/35770->172.16.20.11/8443
S
2018-03-27T10:23:38.492Z INET match PASS 2 OUT 1500 TCP 172.16.10.11/80->100.64.80.1/60660 A
2018-03-27T10:23:39.934Z INET match PASS 3072 IN 52 TCP 100.64.80.1/60720->172.16.10.11/80 S
2018-03-27T10:23:39.944Z INET match PASS 3074 OUT 60 TCP 172.16.10.11/46114->172.16.20.11/8443 S
2018-03-27T10:23:39.944Z 71d32787 INET match PASS 3074 IN 60 TCP 172.16.10.11/46114->172.16.20.11/8443
S
2018-03-27T10:23:42.449Z 71d32787 INET match PASS 3074 IN 60 TCP 172.16.10.12/35771->172.16.20.11/8443
S
2018-03-27T10:23:44.712Z INET TERM 3074 IN TCP RST 172.16.10.11/46109->172.16.20.11/8443 9/7 1218/7262
2018-03-27T10:23:44.712Z INET TERM 3074 IN TCP FIN 172.16.10.12/35766->172.16.20.11/8443 9/10 1233/7418
2018-03-27T10:23:44.712Z INET TERM 3074 IN TCP FIN 172.16.10.11/46110->172.16.20.11/8443 9/9 1230/7366
2018-03-27T10:23:44.712Z INET TERM 3074 IN TCP FIN 172.16.10.12/35767->172.16.20.11/8443 9/10 1233/7418
2018-03-27T10:23:44.939Z INET match PASS 3072 IN 52 TCP 100.64.80.1/60726->172.16.10.11/80 S
2018-03-27T10:23:44.957Z INET match PASS 3074 OUT 60 TCP 172.16.10.11/46115->172.16.20.11/8443 S
2018-03-27T10:23:44.957Z 71d32787 INET match PASS 3074 IN 60 TCP 172.16.10.11/46115->172.16.20.11/8443
S
2018-03-27T10:23:45.480Z INET TERM 2 OUT TCP TIMEOUT 172.16.10.11/80->100.64.80.1/60528 1/1 1500/56
NSX-T Troubleshooting Guide
VMware, Inc. 27
Logs and Services 5Logs can be helpful in many troubleshooting scenarios. Checking the status of services is also important.
This chapter includes the following topics:
n Log Messages
n Troubleshooting Syslog Issues
n Checking Services
n Collecting Support Bundles
Log MessagesLog messages from all NSX-T components, including those running on ESXi hosts, conform to the syslogformat as specified in RFC 5424. Log messages from KVM hosts are in the RFC 3164 format. The logfiles are in the directory /var/log.
On NSX-T appliances, you can run the following NSX-T CLI command to view the logs:
get log-file <auth.log | http.log | kern.log | manager.log | node-mgmt.log | syslog> [follow]
On hypervisors, you can use Linux commands such as tac, tail, grep, and more to view the logs. Youcan also use these commands on NSX-T appliances.
For more information about RFC 5424, see https://tools.ietf.org/html/rfc5424. For more information aboutRFC 3164, see https://tools.ietf.org/html/rfc3164.
RFC 5424 defines the following format for log messages:
<facility * 8 + severity> version UTC-TZ hostname APP-NAME procid MSGID [structured-data] msg
A sample log message:
<187>1 2016-03-15T22:53:00.114Z nsx-manager NSX - SYSTEM [nsx@6876 comp="nsx-manager"
errorCode="MP4039" subcomp="manager"] Connection verification failed for broker '10.160.108.196'.
Marking broker unhealthy.
Every message has the component (comp) and sub-component (subcomp) information to help identify thesource of the message.
VMware, Inc. 28
NSX-T produces regular logs (facility local6, which has a numerical value of 22) and audit logs (facilitylocal7, which has a numerical value of 23). All API calls trigger an audit log.
An audit log that is associated with an API call has the following information:
n An entity ID parameter entId to identify the object of the API.
n A request ID parameter req-id to identify a specific API call.
n An external request ID parameter ereqId if the API call contains the header X-NSX-EREQID:<string>.
n An external user parameter euser if the API call contains the header X-NSX-EUSER:<string>.
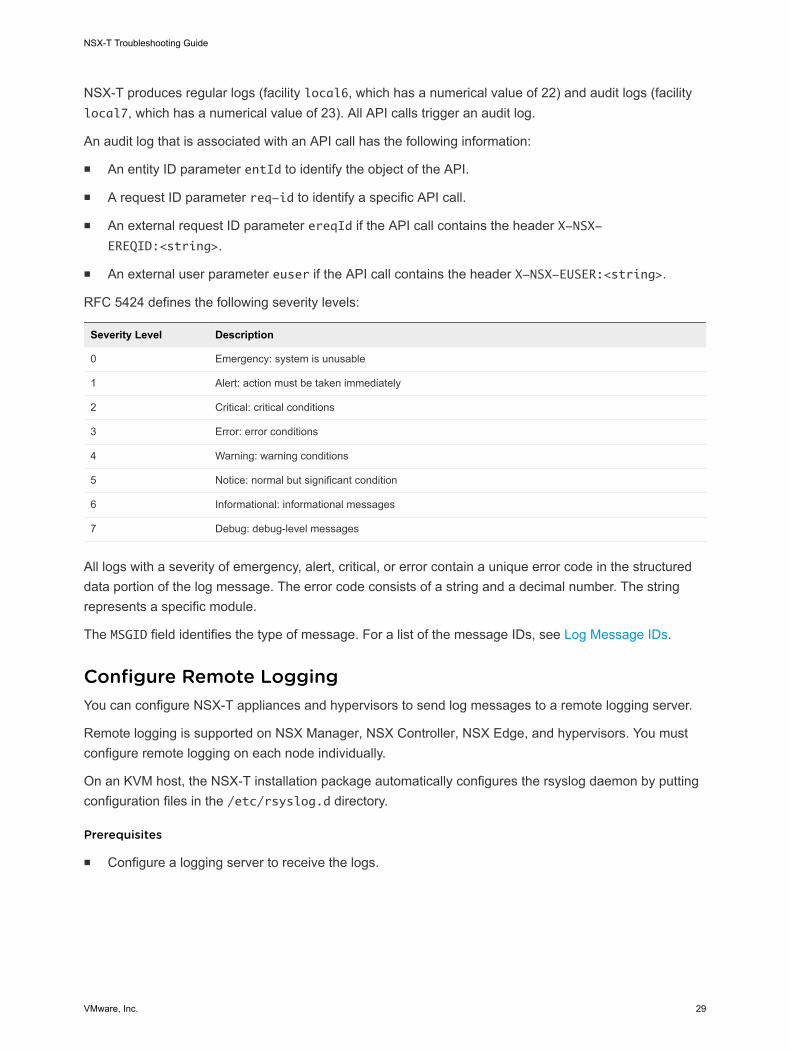
RFC 5424 defines the following severity levels:
Severity Level Description
0 Emergency: system is unusable
1 Alert: action must be taken immediately
2 Critical: critical conditions
3 Error: error conditions
4 Warning: warning conditions
5 Notice: normal but significant condition
6 Informational: informational messages
7 Debug: debug-level messages
All logs with a severity of emergency, alert, critical, or error contain a unique error code in the structureddata portion of the log message. The error code consists of a string and a decimal number. The stringrepresents a specific module.
The MSGID field identifies the type of message. For a list of the message IDs, see Log Message IDs.
Configure Remote LoggingYou can configure NSX-T appliances and hypervisors to send log messages to a remote logging server.
Remote logging is supported on NSX Manager, NSX Controller, NSX Edge, and hypervisors. You mustconfigure remote logging on each node individually.
On an KVM host, the NSX-T installation package automatically configures the rsyslog daemon by puttingconfiguration files in the /etc/rsyslog.d directory.
Prerequisites
n Configure a logging server to receive the logs.
NSX-T Troubleshooting Guide
VMware, Inc. 29
Procedure
1 To configure remote logging on an NSX-T appliance:
a Run the following command to configure a log server and the types of messages to send to thelog server. Multiple facilities or message IDs can be specified as a comma delimited list, withoutspaces.
set logging-server <hostname-or-ip-address[:port]> proto <proto> level <level> [facility
<facility>] [messageid <messageid>] [certificate <filename>] [structured-data <structured-
data>]
For more information about this command, see the NSX-T CLI Reference. You can run thecommand multiple times to add multiple logging server configurations. For example:
nsx> set logging-server 192.168.110.60 proto udp level info facility syslog messageid
SYSTEM,FABRIC
nsx> set logging-server 192.168.110.60 proto udp level info facility auth,user
b you can view the logging configuration with the get logging-server command. For example,
nsx> get logging-servers
192.168.110.60 proto udp level info facility syslog messageid SYSTEM,FABRIC
192.168.110.60 proto udp level info facility auth,user
2 To configure remote logging on an ESXi host:
a Run the following commands to configure syslog and send a test message:
esxcli network firewall ruleset set -r syslog -e true
esxcli system syslog config set --loghost=udp://<log server IP>:<port>
esxcli system syslog reload
esxcli system syslog mark -s "This is a test message"
b You can run the following command to display the configuration:
esxcli system syslog config get
3 To configure remote logging on a KVM host:
a Edit the file /etc/rsyslog.d/10-vmware-remote-logging.conf for your environment.
b Add the following line to the file:
*.* @<ip>:514;RFC5424fmt
c Run the following command:
service rsyslog restart
NSX-T Troubleshooting Guide
VMware, Inc. 30
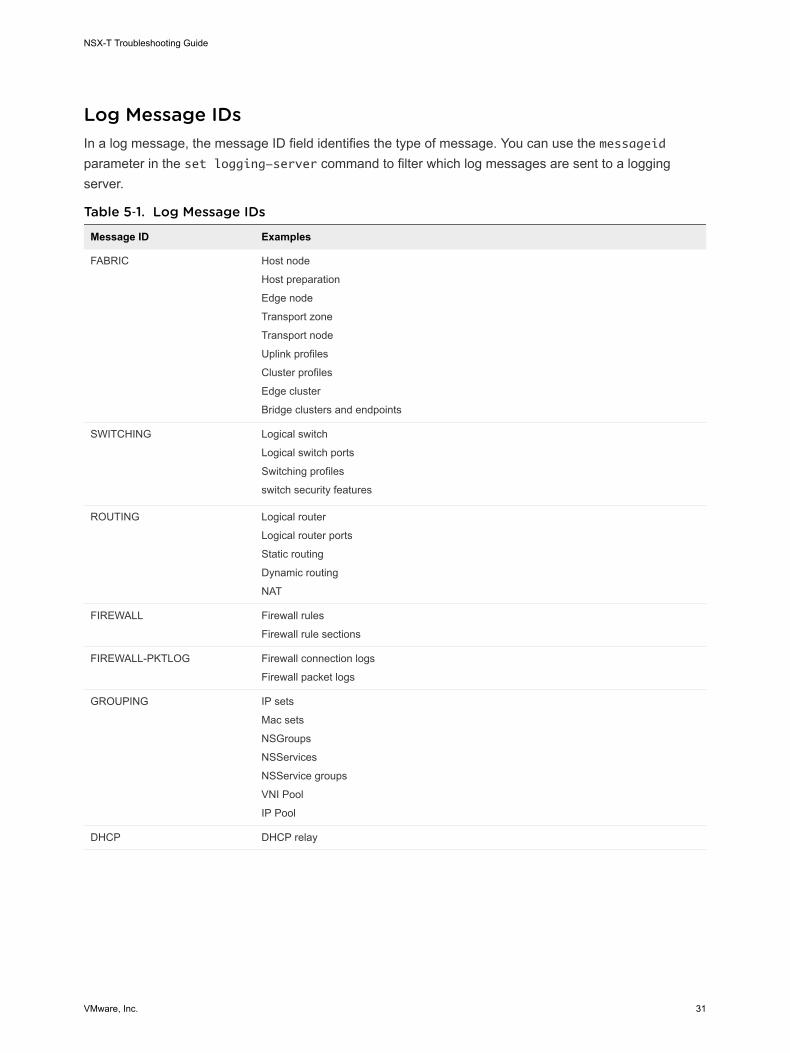
Log Message IDsIn a log message, the message ID field identifies the type of message. You can use the messageidparameter in the set logging-server command to filter which log messages are sent to a loggingserver.
Table 5‑1. Log Message IDs
Message ID Examples
FABRIC Host node
Host preparation
Edge node
Transport zone
Transport node
Uplink profiles
Cluster profiles
Edge cluster
Bridge clusters and endpoints
SWITCHING Logical switch
Logical switch ports
Switching profiles
switch security features
ROUTING Logical router
Logical router ports
Static routing
Dynamic routing
NAT
FIREWALL Firewall rules
Firewall rule sections
FIREWALL-PKTLOG Firewall connection logs
Firewall packet logs
GROUPING IP sets
Mac sets
NSGroups
NSServices
NSService groups
VNI Pool
IP Pool
DHCP DHCP relay
NSX-T Troubleshooting Guide
VMware, Inc. 31
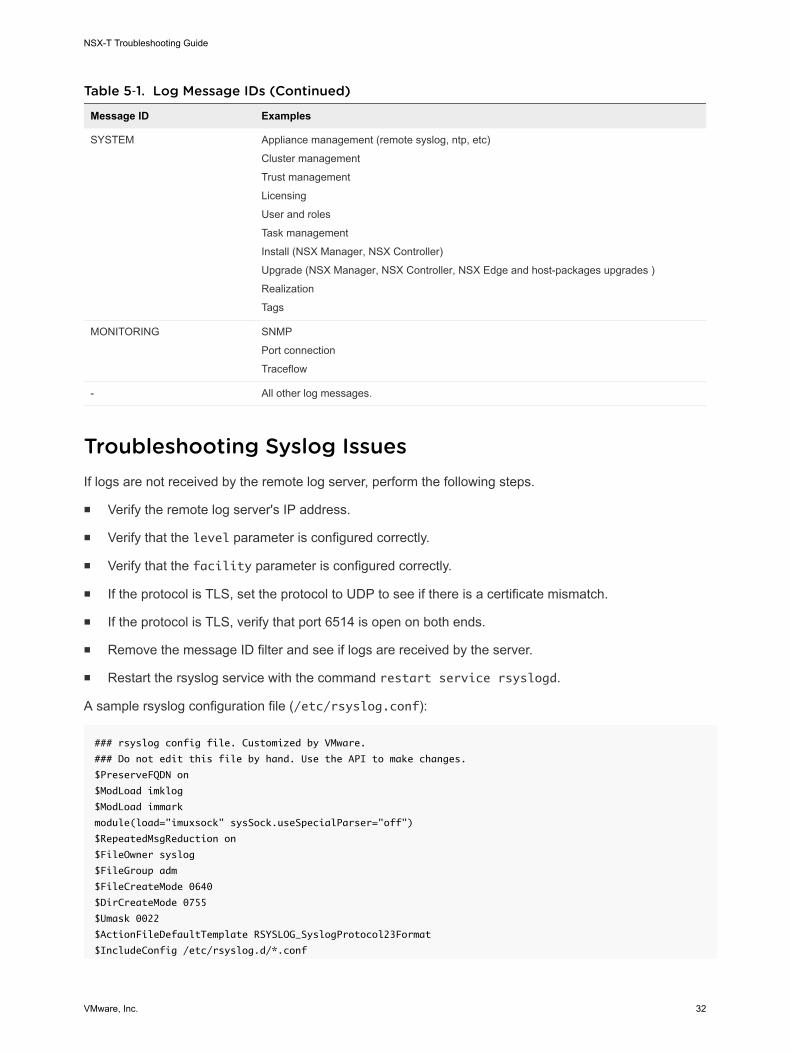
Table 5‑1. Log Message IDs (Continued)
Message ID Examples
SYSTEM Appliance management (remote syslog, ntp, etc)
Cluster management
Trust management
Licensing
User and roles
Task management
Install (NSX Manager, NSX Controller)
Upgrade (NSX Manager, NSX Controller, NSX Edge and host-packages upgrades )
Realization
Tags
MONITORING SNMP
Port connection
Traceflow
- All other log messages.
Troubleshooting Syslog IssuesIf logs are not received by the remote log server, perform the following steps.
n Verify the remote log server's IP address.
n Verify that the level parameter is configured correctly.
n Verify that the facility parameter is configured correctly.
n If the protocol is TLS, set the protocol to UDP to see if there is a certificate mismatch.
n If the protocol is TLS, verify that port 6514 is open on both ends.
n Remove the message ID filter and see if logs are received by the server.
n Restart the rsyslog service with the command restart service rsyslogd.
A sample rsyslog configuration file (/etc/rsyslog.conf):
### rsyslog config file. Customized by VMware.
### Do not edit this file by hand. Use the API to make changes.
$PreserveFQDN on
$ModLoad imklog
$ModLoad immark
module(load="imuxsock" sysSock.useSpecialParser="off")
$RepeatedMsgReduction on
$FileOwner syslog
$FileGroup adm
$FileCreateMode 0640
$DirCreateMode 0755
$Umask 0022
$ActionFileDefaultTemplate RSYSLOG_SyslogProtocol23Format
$IncludeConfig /etc/rsyslog.d/*.conf
NSX-T Troubleshooting Guide
VMware, Inc. 32
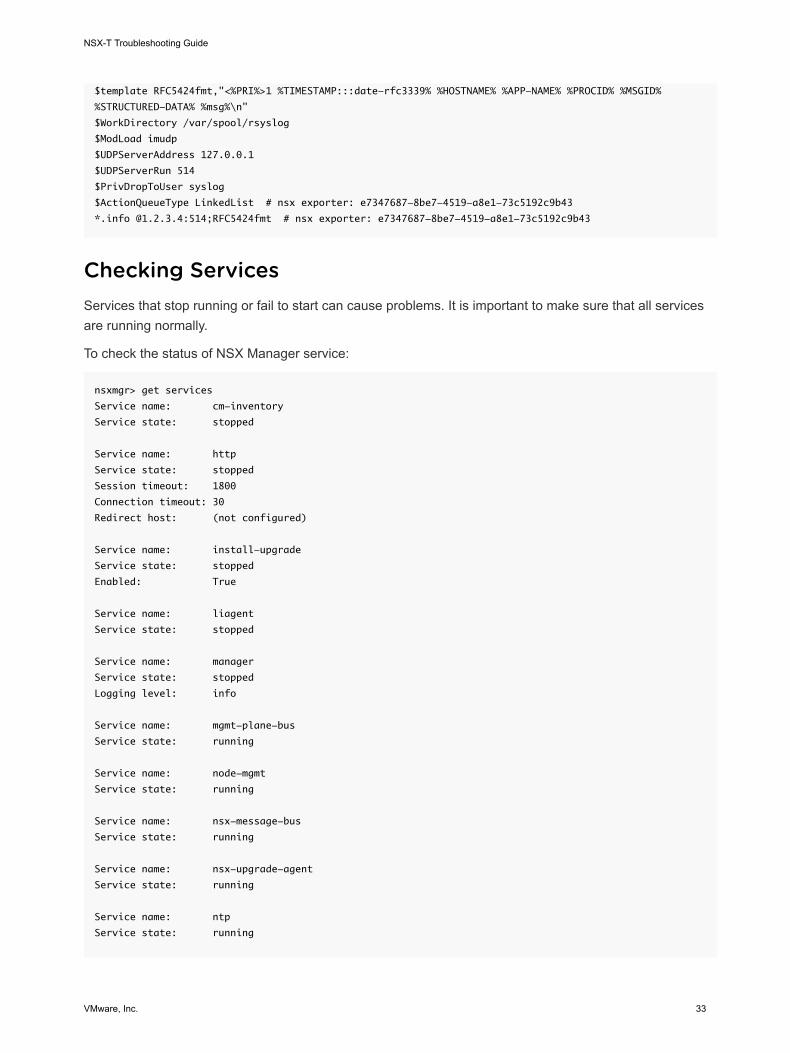
$template RFC5424fmt,"<%PRI%>1 %TIMESTAMP:::date-rfc3339% %HOSTNAME% %APP-NAME% %PROCID% %MSGID%
%STRUCTURED-DATA% %msg%\n"
$WorkDirectory /var/spool/rsyslog
$ModLoad imudp
$UDPServerAddress 127.0.0.1
$UDPServerRun 514
$PrivDropToUser syslog
$ActionQueueType LinkedList # nsx exporter: e7347687-8be7-4519-a8e1-73c5192c9b43
*.info @1.2.3.4:514;RFC5424fmt # nsx exporter: e7347687-8be7-4519-a8e1-73c5192c9b43
Checking ServicesServices that stop running or fail to start can cause problems. It is important to make sure that all servicesare running normally.
To check the status of NSX Manager service:
nsxmgr> get services
Service name: cm-inventory
Service state: stopped
Service name: http
Service state: stopped
Session timeout: 1800
Connection timeout: 30
Redirect host: (not configured)
Service name: install-upgrade
Service state: stopped
Enabled: True
Service name: liagent
Service state: stopped
Service name: manager
Service state: stopped
Logging level: info
Service name: mgmt-plane-bus
Service state: running
Service name: node-mgmt
Service state: running
Service name: nsx-message-bus
Service state: running
Service name: nsx-upgrade-agent
Service state: running
Service name: ntp
Service state: running
NSX-T Troubleshooting Guide
VMware, Inc. 33
Service name: search
Service state: stopped
Service name: snmp
Service state: stopped
Start on boot: False
Service name: ssh
Service state: running
Start on boot: True
Service name: syslog
Service state: running
In the example above, the http service is stopped. You can start the http service with the followingcommand:
nsxmgr> start service http
SSH ServiceIf the SSH service was not enabled when deploying the appliance, you can log in to the appliance asadmin and enable it with the following command:
start service ssh
You can configure SSH to start when the host starts with the following command:
set service ssh start-on-boot
To enable SSH root login, you can log in to the appliance as root, edit the file /etc/ssh/sshd_config andreplace the line
PermitRootLogin prohibit-password
Alternatively, you can enable the SSH service and enable SSH root access by powering off the applianceand modifying its vApp properties.
with
PermitRootLogin yes
and restart the sshd server with the following command:
/etc/init.d/ssh restart
NSX-T Troubleshooting Guide
VMware, Inc. 34
Collecting Support BundlesYou can collect support bundles on registered cluster and fabric nodes and download the bundles to yourmachine or upload them to a file server.
If you choose to download the bundles to your machine, you get a single archive file consisting of amanifest file and support bundles for each node. If you choose to upload the bundles to a file server, themanifest file and the individual bundles are uploaded to the file server separately.
NSX Cloud Note If you want to collect the support bundle for CSM, log in to CSM, go to System >Utilities > Support Bundle and click on Download. The support bundle for PCG is available fromNSX Manager using the following instructions. The support bundle for PCG also contains logs for all theworkload VMs.
Procedure
1 From your browser, log in with admin privileges to an NSX Manager at https://nsx-manager-ip-address.
2 Select System > Utilities from the navigation panel.
3 Click the Support Bundle tab.
4 Select the target nodes.
The available types of nodes are Management Nodes, Controller Nodes, Edges, Hosts, and PublicCloud Gateways.
5 (Optional) Specify log age in days to exclude logs that are older than the specified number of days.
6 (Optional) Toggle the switch that indicates whether to include or exclude core files and audit logs.
Note Core files and audit logs might contain sensitive information such as passwords or encryptionkeys.
7 (Optional) Select a check box to upload the bundles to a file server.
8 Click Start Bundle Collection to start collecting support bundles.
Depending on how many log files exist, each node might take several minutes.
9 Monitor the status of the collection process.
The status field shows the percentage of nodes that completed support bundle collection.
10 Click Download to download the bundle if the option to send the bundle to a file server was not set.
NSX-T Troubleshooting Guide
VMware, Inc. 35
Other TroubleshootingScenarios 6This section describes how to troubleshoot various error scenarios.
This chapter includes the following topics:
n Failure to Add or Delete a Transport Node
n Transport Node Takes About 5 Minutes to Connect to Another Controller
n NSX Manager VM Is Degraded
n NSX Agent Times Out Communicating with NSX Manager
n Failure to Add an ESXi Host
n Incorrect NSX Controller Status
n Management IPs on KVM VMs Not Reachable with IPFIX Enabled
Failure to Add or Delete a Transport NodeYou cannot delete or add a transport node.
Problem
The error occurs in the following scenario:
1 An ESXi host is a fabric node and a transport node.
2 The host is removed as a transport node. However, transport node deletion fails. The state of thetransport node is Orphaned.
3 The host is removed as a fabric node immediately.
4 The host is added as a fabric node again.
5 The host is added as a transport node with a new transport zone and switch. This step results in theerror Failed/Partial Success.
Cause
In step 2, if you wait for a few minutes, the transport node deletion will succeed because NSX Managerwill retry the deletion. When you delete the fabric node immediately, NSX Manager cannot retry becausethe host is removed from NSX-T. This results in incomplete cleanup of the host, with the switchconfiguration still present, which causes step 5 to fail.
VMware, Inc. 36
Solution
1 Delete all vmknics from vCenter Server on the host that are connected to the NSX-T switch.
2 Get the switch name using the esxcfg-vswitch -l CLI command. For example:
esxcfg-vswitch -l
Switch Name Num Ports Used Ports Configured Ports MTU Uplinks
vSwitch0 1536 4 128 1500 vmnic0
PortGroup Name VLAN ID Used Ports Uplinks
VM Network 0 0 vmnic0
Management Network 0 1 vmnic0
Switch Name Num Ports Used Ports Uplinks
nsxvswitch 1536 4
3 Delete the switch name using the esxcfg-vswitch -d <switch-name> --dvswitch CLIcommand. For example:
esxcfg-vswitch -d nsxvswitch --dvswitch
Transport Node Takes About 5 Minutes to Connect toAnother ControllerWhen an ESXi transport node's connected controller goes down, it takes about 5 minutes for the transportnode to connect to another controller.
Problem
An ESXi transport node is normally connected to a specific controller in a controller cluster. You can findthe connected controller with the CLI command get controllers. If the connected controller goesdown, it takes about 5 minutes for the transport node to be connected to another controller.
Cause
The transport node attempts to re-connect to the controller that is down for a certain amount of timebefore giving up and connecting to another controller. The whole process takes about 5 minutes. This isexpected behavior.
NSX Manager VM Is DegradedNSX Manager that is deployed on a KVM host returns an error when running CLI commands such as getservice and get interface.
NSX-T Troubleshooting Guide
VMware, Inc. 37
Problem
The CLI command get service returns an error. For example,
nsx-manager-1> get service
% An error occurred while processing the service command
Other CLI commands might also return an error. The get support-bundle command indicates thatthe /tmp directory has become read-only. For example,
nsx-manager-1> get support-bundle file failed-to-get-service.tgz
% An error occurred while retrieving the support bundle: [Errno 30] Read-only file system:
'/tmp/tmpHzXF1u'
The /var/log/messages-<timestamp> log has the a message such as the following:
Nov 17 07:26:48 no kernel: NMI watchdog: BUG: soft lockup - CPU#5 stuck for 23s! [qemu-kvm:4386]
Cause
One or more file systems on the NSX Manager appliance were corrupted. Some possible causes aredocumented in https://access.redhat.com/solutions/22621.
To resolve the issue, you can repair the corrupt file systems or perform a restore from a backup.
Solution
1 Option 1: Repair the corrupt file systems. The following steps are specifically for NSX Managerrunning on a KVM host.
a Run the virsh destroy command to stop the NSX Manager VM.
b Run the virt-rescue command in write mode on the qcow2 image. For example,
virt-rescue --rw -a nsx-unified-appliance-2.0.0.0.0.6522097.phadniss-p0-DK-to-DGo-on-rhel-
prod_nsx_manager_1.qcow2
c In the virt-rescue command prompt run the e2fsck command to fix the tmp file system. Forexample,
<rescue> e2fsck /dev/nsx/tmp
d If necessary, run the e2fsck /dev/nsx/tmp again until there are no more errors.
e Restart NSX Manager with the virsh start.
2 Option 2: Perform a restore from a backup.
For instructions, see the NSX-T Administration Guide.
NSX-T Troubleshooting Guide
VMware, Inc. 38
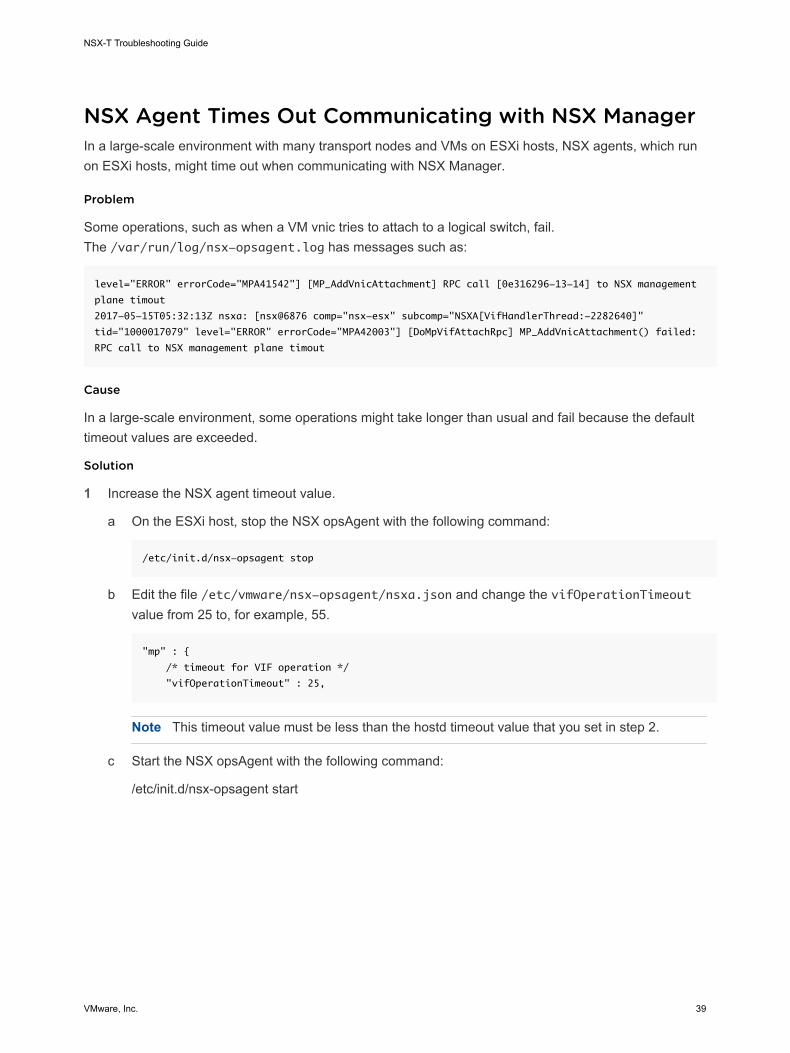
NSX Agent Times Out Communicating with NSX ManagerIn a large-scale environment with many transport nodes and VMs on ESXi hosts, NSX agents, which runon ESXi hosts, might time out when communicating with NSX Manager.
Problem
Some operations, such as when a VM vnic tries to attach to a logical switch, fail.The /var/run/log/nsx-opsagent.log has messages such as:
level="ERROR" errorCode="MPA41542"] [MP_AddVnicAttachment] RPC call [0e316296-13-14] to NSX management
plane timout
2017-05-15T05:32:13Z nsxa: [nsx@6876 comp="nsx-esx" subcomp="NSXA[VifHandlerThread:-2282640]"
tid="1000017079" level="ERROR" errorCode="MPA42003"] [DoMpVifAttachRpc] MP_AddVnicAttachment() failed:
RPC call to NSX management plane timout
Cause
In a large-scale environment, some operations might take longer than usual and fail because the defaulttimeout values are exceeded.
Solution
1 Increase the NSX agent timeout value.
a On the ESXi host, stop the NSX opsAgent with the following command:
/etc/init.d/nsx-opsagent stop
b Edit the file /etc/vmware/nsx-opsagent/nsxa.json and change the vifOperationTimeoutvalue from 25 to, for example, 55.
"mp" : {
/* timeout for VIF operation */
"vifOperationTimeout" : 25,
Note This timeout value must be less than the hostd timeout value that you set in step 2.
c Start the NSX opsAgent with the following command:
/etc/init.d/nsx-opsagent start
NSX-T Troubleshooting Guide
VMware, Inc. 39
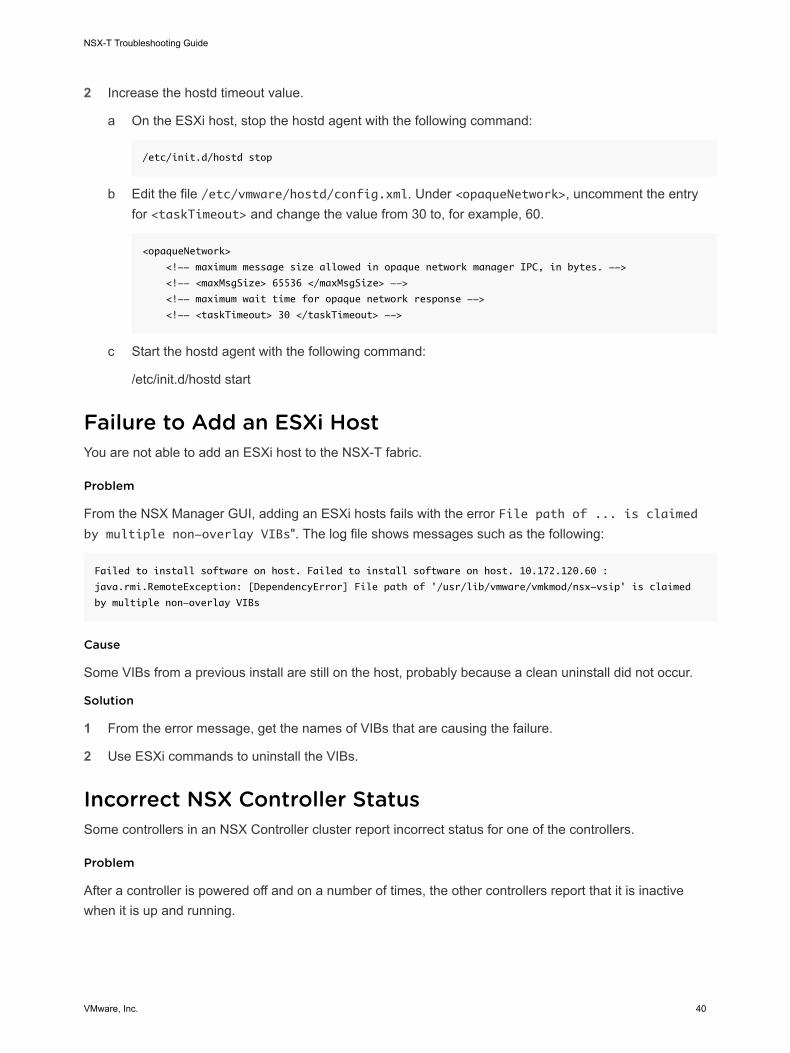
2 Increase the hostd timeout value.
a On the ESXi host, stop the hostd agent with the following command:
/etc/init.d/hostd stop
b Edit the file /etc/vmware/hostd/config.xml. Under <opaqueNetwork>, uncomment the entryfor <taskTimeout> and change the value from 30 to, for example, 60.
<opaqueNetwork>
<!-- maximum message size allowed in opaque network manager IPC, in bytes. -->
<!-- <maxMsgSize> 65536 </maxMsgSize> -->
<!-- maximum wait time for opaque network response -->
<!-- <taskTimeout> 30 </taskTimeout> -->
c Start the hostd agent with the following command:
/etc/init.d/hostd start
Failure to Add an ESXi HostYou are not able to add an ESXi host to the NSX-T fabric.
Problem
From the NSX Manager GUI, adding an ESXi hosts fails with the error File path of ... is claimedby multiple non-overlay VIBs". The log file shows messages such as the following:
Failed to install software on host. Failed to install software on host. 10.172.120.60 :
java.rmi.RemoteException: [DependencyError] File path of '/usr/lib/vmware/vmkmod/nsx-vsip' is claimed
by multiple non-overlay VIBs
Cause
Some VIBs from a previous install are still on the host, probably because a clean uninstall did not occur.
Solution
1 From the error message, get the names of VIBs that are causing the failure.
2 Use ESXi commands to uninstall the VIBs.
Incorrect NSX Controller StatusSome controllers in an NSX Controller cluster report incorrect status for one of the controllers.
Problem
After a controller is powered off and on a number of times, the other controllers report that it is inactivewhen it is up and running.
NSX-T Troubleshooting Guide
VMware, Inc. 40
Cause
An internal error involving the ZooKeeper module sometimes occurs when a controller is powered off andon and causes a communication failure between this controller and the other controllers in the cluster.
Solution
u Remove the controller node that is reported to be inactive from the cluster, remove the clusterconfiguration from the node and rejoin the node to the cluster. For more information, see the section"Replace a Member of the NSX Controller Cluster" in the NSX-T Administration Guide.
Management IPs on KVM VMs Not Reachable with IPFIXEnabledWhen IPFIX is enabled on multiple VMs on a KVM host and the sampling rate is 100%, the managementIPs on some of the VMs might intermittently be unreachable.
Problem
When you enable IPFIX for multiple VMs on the same host and you set the sampling rate to be 100%,there can be a large amount of IPFIX traffic. This can impact management traffic, causing themanagement IPs to be intermittently unreachable, even if the production traffic and management traffic gothrough different OVSes.
Cause
The workload is too stressful for the host and the VMs.
Solution
u Reduce the load on the host by reducing the number of VMs with IPFIX enabled or reducing thesampling rate.
NSX-T Troubleshooting Guide
VMware, Inc. 41


![CATÁLOGO DE CURSOS - VMware Blogs · 2019-01-08 · CATÁLOGO DE CURSOS | 5. VMWARE NSX VMware NSX NUEVO: VMware NSX-T: instalación, configuración y administración [V2.2] Este](https://img.pdfslide.us/doc/110x75/5e445c1ffe9a851c8b3eeb55/catlogo-de-cursos-vmware-blogs-2019-01-08-catlogo-de-cursos-5-vmware.jpg)