Embed Size (px)
Citation preview
BREACH DETECTION SYSTEM PRODUCT ANALYSIS
Fortinet FortiSandbox 3000D v1.2 Bhaarath Venkateswaran, Jayendra Pathak, Ahmed Garhy, Ryan Liles
NSS Labs Breach Detection Systems Product Analysis – Fortinet FortiSandbox 3000D
2
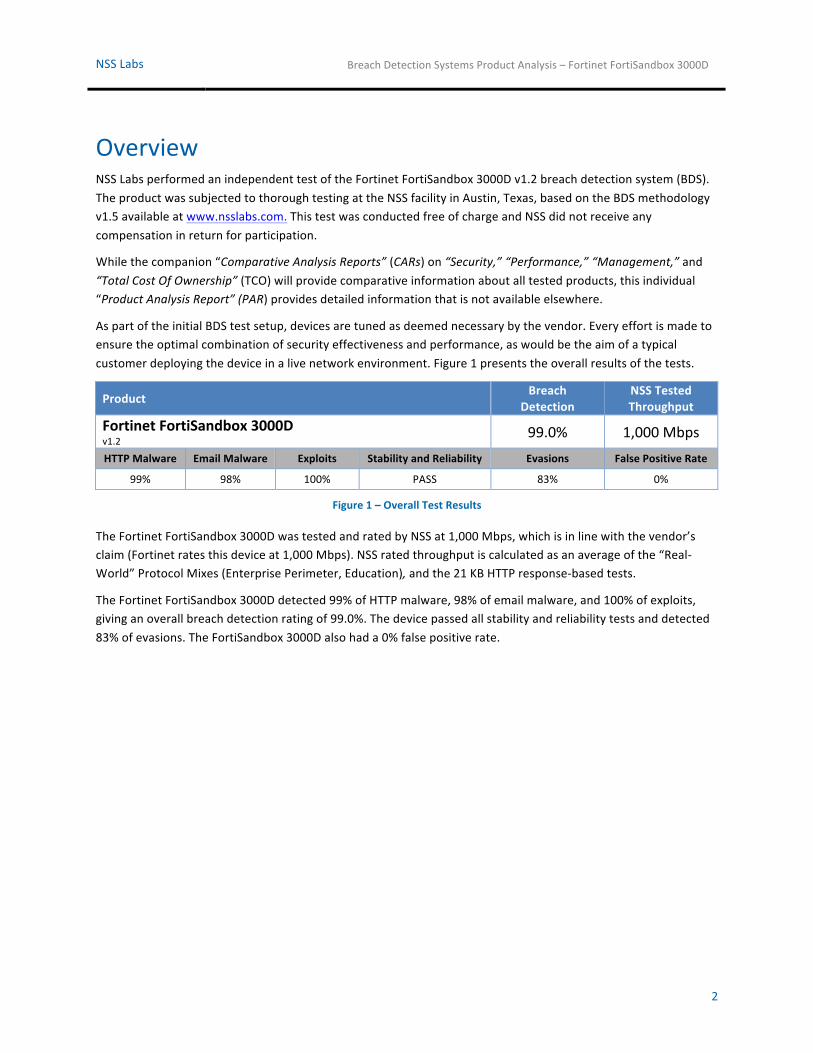
Overview NSS Labs performed an independent test of the Fortinet FortiSandbox 3000D v1.2 breach detection system (BDS). The product was subjected to thorough testing at the NSS facility in Austin, Texas, based on the BDS methodology v1.5 available at www.nsslabs.com. This test was conducted free of charge and NSS did not receive any compensation in return for participation.
While the companion “Comparative Analysis Reports” (CARs) on “Security,” “Performance,” “Management,” and “Total Cost Of Ownership” (TCO) will provide comparative information about all tested products, this individual “Product Analysis Report” (PAR) provides detailed information that is not available elsewhere.
As part of the initial BDS test setup, devices are tuned as deemed necessary by the vendor. Every effort is made to ensure the optimal combination of security effectiveness and performance, as would be the aim of a typical customer deploying the device in a live network environment. Figure 1 presents the overall results of the tests.
Product Breach
Detection NSS Tested Throughput
Fortinet FortiSandbox 3000D v1.2
99.0% 1,000 Mbps HTTP Malware Email Malware Exploits Stability and Reliability Evasions False Positive Rate
99% 98% 100% PASS 83% 0%
Figure 1 – Overall Test Results
The Fortinet FortiSandbox 3000D was tested and rated by NSS at 1,000 Mbps, which is in line with the vendor’s claim (Fortinet rates this device at 1,000 Mbps). NSS rated throughput is calculated as an average of the “Real-‐World” Protocol Mixes (Enterprise Perimeter, Education), and the 21 KB HTTP response-‐based tests.
The Fortinet FortiSandbox 3000D detected 99% of HTTP malware, 98% of email malware, and 100% of exploits, giving an overall breach detection rating of 99.0%. The device passed all stability and reliability tests and detected 83% of evasions. The FortiSandbox 3000D also had a 0% false positive rate.
NSS Labs Breach Detection Systems Product Analysis – Fortinet FortiSandbox 3000D
3
Table of Contents Overview ............................................................................................................................................. 2
Security Effectiveness .......................................................................................................................... 5 HTTP Malware .............................................................................................................................................. 5 Email Malware .............................................................................................................................................. 6 Exploits ......................................................................................................................................................... 6 Resistance to Evasion ................................................................................................................................... 7 False Positives .............................................................................................................................................. 7
Performance ........................................................................................................................................ 8 Maximum Capacity ....................................................................................................................................... 8 HTTP Capacity With No Transaction Delays ................................................................................................. 9 HTTP Capacity with Transaction Delays ..................................................................................................... 10 “Real-‐World” Traffic Mixes ......................................................................................................................... 11
Stability And Reliability ...................................................................................................................... 12
Management And Configuration ........................................................................................................ 13
Total Cost of Ownership (TCO) ........................................................................................................... 14 Installation Time ......................................................................................................................................... 14 Total Cost of Ownership (TCO) ................................................................................................................... 15 Value: Total Cost of Ownership Per Detected-‐Mbps .................................................................................. 15
Detailed Product Scorecard ................................................................................................................ 16
Test Methodology .............................................................................................................................. 18
Contact Information .......................................................................................................................... 18
NSS Labs Breach Detection Systems Product Analysis – Fortinet FortiSandbox 3000D
4
Table of Figures Figure 1 – Overall Test Results ...................................................................................................................... 2 Figure 2 – HTTP Malware Detection Over Time (Minutes) ........................................................................... 5 Figure 3 – Email Malware Detection Over Time (Minutes) .......................................................................... 6 Figure 4 – Exploit Detection Over Time (Minutes) ........................................................................................ 6 Figure 5 – Resistance To Evasion Results ...................................................................................................... 7 Figure 6 – False Positive Rate ....................................................................................................................... 7 Figure 7 – Maximum Concurrent TCP Connections And Maximum TCP Connections Per Second ................ 8 Figure 8 – Detection Under Load (HTTP Capacity With No Transaction Delay) ............................................ 9 Figure 9 – Detection Under Load (HTTP Capacity With Transaction Delay) ............................................... 10 Figure 10 – Detection Under Load (“Real World Traffic”) .......................................................................... 11 Figure 11 – Stability And Reliability Results ................................................................................................ 12 Figure 12 – Installation Time ...................................................................................................................... 14 Figure 13 – Total Cost Of Ownership (TCO) ................................................................................................ 15 Figure 14 – Total Cost Of Ownership Per Detected-‐Mbps .......................................................................... 15
NSS Labs Breach Detection Systems Product Analysis – Fortinet FortiSandbox 3000D
5
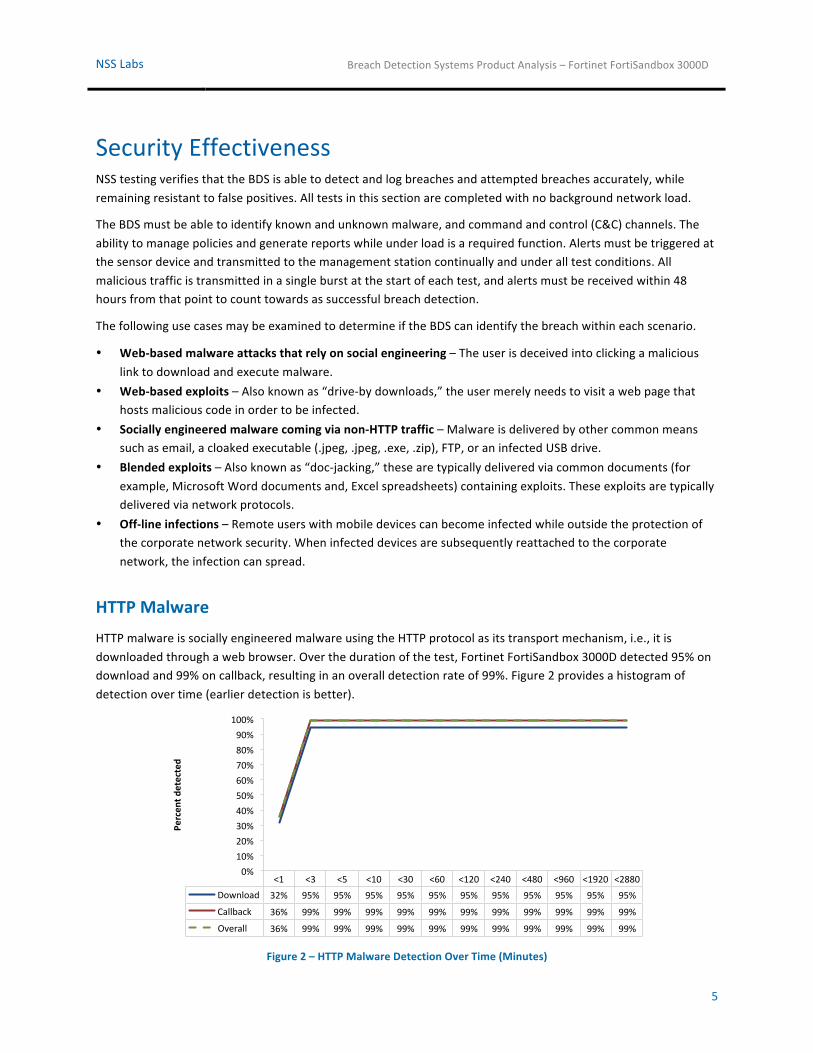
Security Effectiveness NSS testing verifies that the BDS is able to detect and log breaches and attempted breaches accurately, while remaining resistant to false positives. All tests in this section are completed with no background network load.
The BDS must be able to identify known and unknown malware, and command and control (C&C) channels. The ability to manage policies and generate reports while under load is a required function. Alerts must be triggered at the sensor device and transmitted to the management station continually and under all test conditions. All malicious traffic is transmitted in a single burst at the start of each test, and alerts must be received within 48 hours from that point to count towards as successful breach detection.
The following use cases may be examined to determine if the BDS can identify the breach within each scenario.
• Web-‐based malware attacks that rely on social engineering – The user is deceived into clicking a malicious link to download and execute malware.
• Web-‐based exploits – Also known as “drive-‐by downloads,” the user merely needs to visit a web page that hosts malicious code in order to be infected.
• Socially engineered malware coming via non-‐HTTP traffic – Malware is delivered by other common means such as email, a cloaked executable (.jpeg, .jpeg, .exe, .zip), FTP, or an infected USB drive.
• Blended exploits – Also known as “doc-‐jacking,” these are typically delivered via common documents (for example, Microsoft Word documents and, Excel spreadsheets) containing exploits. These exploits are typically delivered via network protocols.
• Off-‐line infections – Remote users with mobile devices can become infected while outside the protection of the corporate network security. When infected devices are subsequently reattached to the corporate network, the infection can spread.
HTTP Malware
HTTP malware is socially engineered malware using the HTTP protocol as its transport mechanism, i.e., it is downloaded through a web browser. Over the duration of the test, Fortinet FortiSandbox 3000D detected 95% on download and 99% on callback, resulting in an overall detection rate of 99%. Figure 2 provides a histogram of detection over time (earlier detection is better).
Figure 2 – HTTP Malware Detection Over Time (Minutes)
<1# <3# <5# <10# <30# <60# <120# <240# <480# <960# <1920# <2880#Download# 32%# 95%# 95%# 95%# 95%# 95%# 95%# 95%# 95%# 95%# 95%# 95%#
Callback# 36%# 99%# 99%# 99%# 99%# 99%# 99%# 99%# 99%# 99%# 99%# 99%#
Overall# 36%# 99%# 99%# 99%# 99%# 99%# 99%# 99%# 99%# 99%# 99%# 99%#
0%#10%#20%#30%#40%#50%#60%#70%#80%#90%#100%#
Percen
t'detected'
NSS Labs Breach Detection Systems Product Analysis – Fortinet FortiSandbox 3000D
6
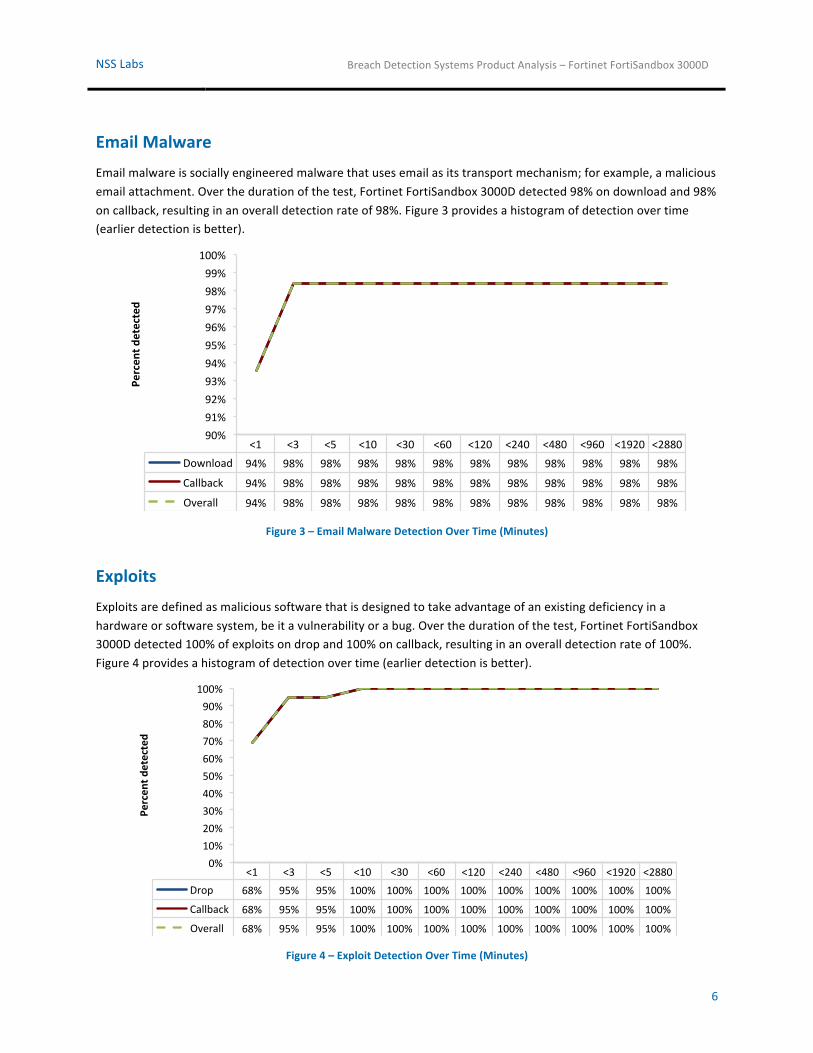
Email Malware Email malware is socially engineered malware that uses email as its transport mechanism; for example, a malicious email attachment. Over the duration of the test, Fortinet FortiSandbox 3000D detected 98% on download and 98% on callback, resulting in an overall detection rate of 98%. Figure 3 provides a histogram of detection over time (earlier detection is better).
Figure 3 – Email Malware Detection Over Time (Minutes)
Exploits Exploits are defined as malicious software that is designed to take advantage of an existing deficiency in a hardware or software system, be it a vulnerability or a bug. Over the duration of the test, Fortinet FortiSandbox 3000D detected 100% of exploits on drop and 100% on callback, resulting in an overall detection rate of 100%. Figure 4 provides a histogram of detection over time (earlier detection is better).
Figure 4 – Exploit Detection Over Time (Minutes)
<1# <3# <5# <10# <30# <60# <120# <240# <480# <960# <1920# <2880#Download# 94%# 98%# 98%# 98%# 98%# 98%# 98%# 98%# 98%# 98%# 98%# 98%#
Callback# 94%# 98%# 98%# 98%# 98%# 98%# 98%# 98%# 98%# 98%# 98%# 98%#
Overall# 94%# 98%# 98%# 98%# 98%# 98%# 98%# 98%# 98%# 98%# 98%# 98%#
90%#91%#92%#93%#94%#95%#96%#97%#98%#99%#100%#
Percen
t'detected'
<1# <3# <5# <10# <30# <60# <120# <240# <480# <960# <1920# <2880#Drop# 68%# 95%# 95%# 100%# 100%# 100%# 100%# 100%# 100%# 100%# 100%# 100%#
Callback# 68%# 95%# 95%# 100%# 100%# 100%# 100%# 100%# 100%# 100%# 100%# 100%#
Overall# 68%# 95%# 95%# 100%# 100%# 100%# 100%# 100%# 100%# 100%# 100%# 100%#
0%#10%#20%#30%#40%#50%#60%#70%#80%#90%#100%#
Percen
t'detected'
NSS Labs Breach Detection Systems Product Analysis – Fortinet FortiSandbox 3000D
7
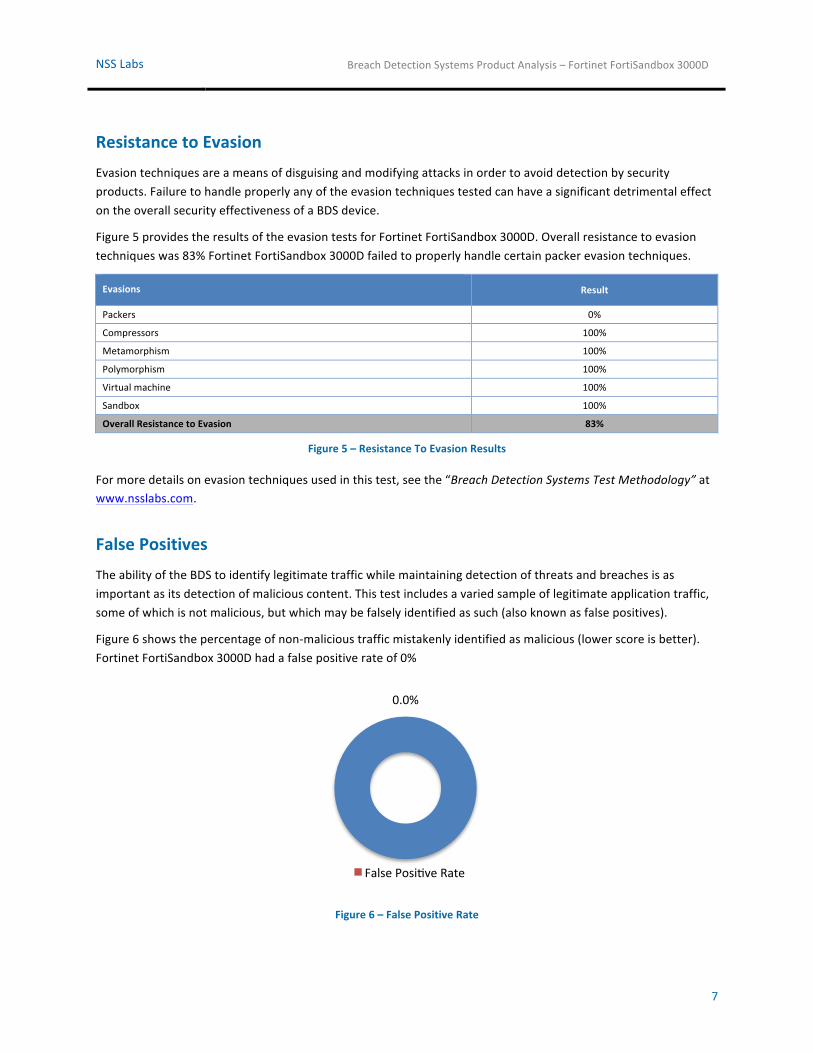
Resistance to Evasion Evasion techniques are a means of disguising and modifying attacks in order to avoid detection by security products. Failure to handle properly any of the evasion techniques tested can have a significant detrimental effect on the overall security effectiveness of a BDS device.
Figure 5 provides the results of the evasion tests for Fortinet FortiSandbox 3000D. Overall resistance to evasion techniques was 83% Fortinet FortiSandbox 3000D failed to properly handle certain packer evasion techniques.
Evasions Result
Packers 0%
Compressors 100%
Metamorphism 100%
Polymorphism 100%
Virtual machine 100%
Sandbox 100%
Overall Resistance to Evasion 83%
Figure 5 – Resistance To Evasion Results
For more details on evasion techniques used in this test, see the “Breach Detection Systems Test Methodology” at www.nsslabs.com.
False Positives The ability of the BDS to identify legitimate traffic while maintaining detection of threats and breaches is as important as its detection of malicious content. This test includes a varied sample of legitimate application traffic, some of which is not malicious, but which may be falsely identified as such (also known as false positives).
Figure 6 shows the percentage of non-‐malicious traffic mistakenly identified as malicious (lower score is better). Fortinet FortiSandbox 3000D had a false positive rate of 0%
Figure 6 – False Positive Rate
0.0%$
False$Posi-ve$Rate$
NSS Labs Breach Detection Systems Product Analysis – Fortinet FortiSandbox 3000D
8
Performance There is frequently a trade-‐off between security effectiveness and performance; a product’s security effectiveness should be evaluated within the context of its performance and vice versa. This ensures that detection does not adversely impact performance and that security shortcuts are not taken to maintain or improve performance. The NSS performance tests are designed to validate that the inspection engine can maintain its detection rate as background traffic increases.
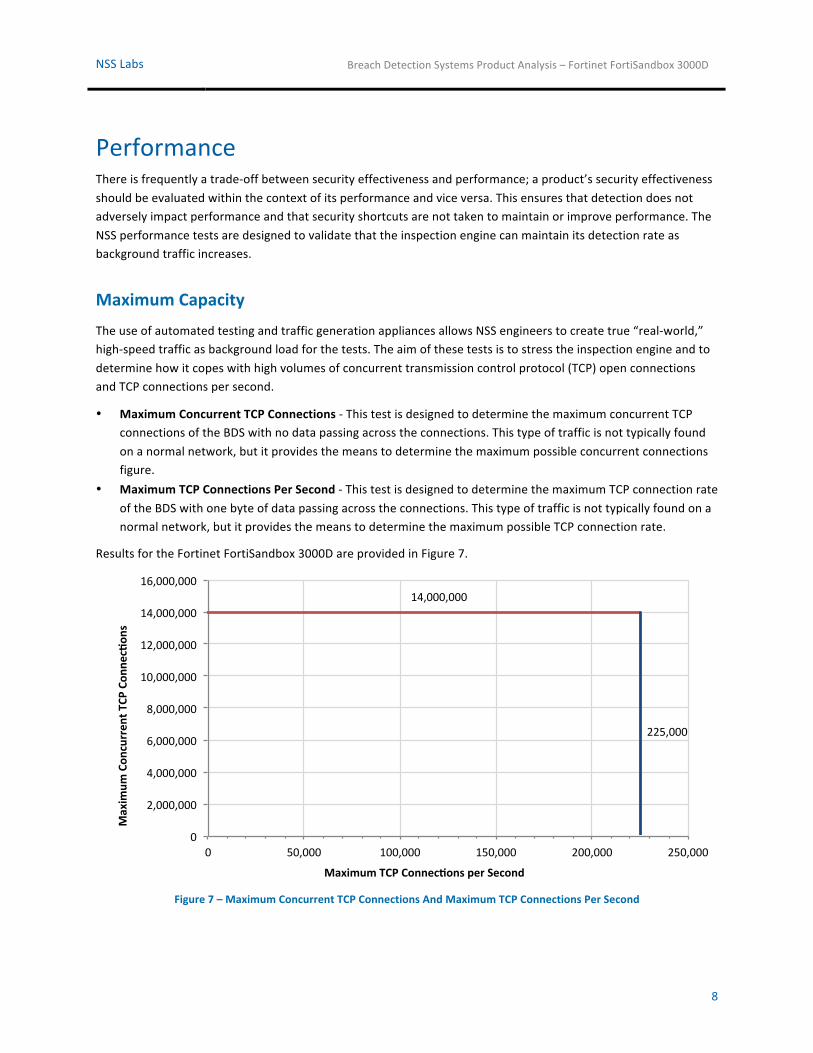
Maximum Capacity
The use of automated testing and traffic generation appliances allows NSS engineers to create true “real-‐world,” high-‐speed traffic as background load for the tests. The aim of these tests is to stress the inspection engine and to determine how it copes with high volumes of concurrent transmission control protocol (TCP) open connections and TCP connections per second.
• Maximum Concurrent TCP Connections -‐ This test is designed to determine the maximum concurrent TCP connections of the BDS with no data passing across the connections. This type of traffic is not typically found on a normal network, but it provides the means to determine the maximum possible concurrent connections figure.
• Maximum TCP Connections Per Second -‐ This test is designed to determine the maximum TCP connection rate of the BDS with one byte of data passing across the connections. This type of traffic is not typically found on a normal network, but it provides the means to determine the maximum possible TCP connection rate.
Results for the Fortinet FortiSandbox 3000D are provided in Figure 7.
Figure 7 – Maximum Concurrent TCP Connections And Maximum TCP Connections Per Second
14,000,000%
225,000%
0%
2,000,000%
4,000,000%
6,000,000%
8,000,000%
10,000,000%
12,000,000%
14,000,000%
16,000,000%
0% 50,000% 100,000% 150,000% 200,000% 250,000%
Maxim
um'Con
curren
t'TCP
'Con
nec1on
s''
Maximum'TCP'Connec1ons'per'Second'
NSS Labs Breach Detection Systems Product Analysis – Fortinet FortiSandbox 3000D
9
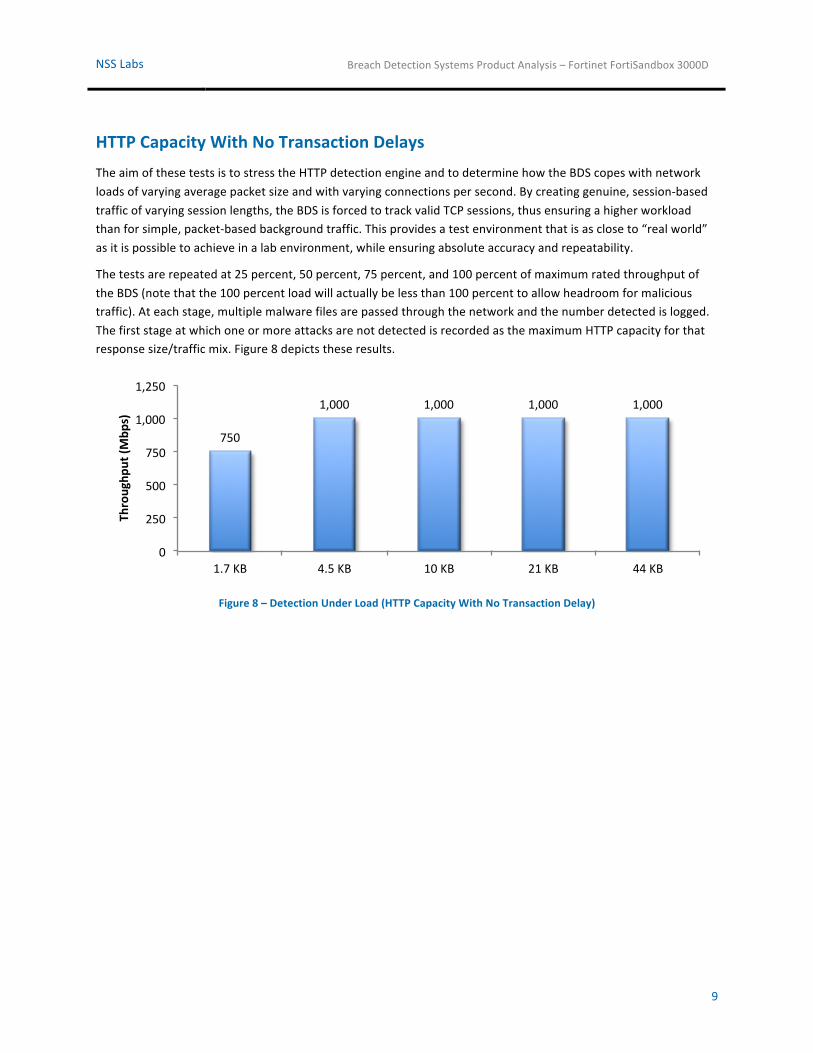
HTTP Capacity With No Transaction Delays The aim of these tests is to stress the HTTP detection engine and to determine how the BDS copes with network loads of varying average packet size and with varying connections per second. By creating genuine, session-‐based traffic of varying session lengths, the BDS is forced to track valid TCP sessions, thus ensuring a higher workload than for simple, packet-‐based background traffic. This provides a test environment that is as close to “real world” as it is possible to achieve in a lab environment, while ensuring absolute accuracy and repeatability.
The tests are repeated at 25 percent, 50 percent, 75 percent, and 100 percent of maximum rated throughput of the BDS (note that the 100 percent load will actually be less than 100 percent to allow headroom for malicious traffic). At each stage, multiple malware files are passed through the network and the number detected is logged. The first stage at which one or more attacks are not detected is recorded as the maximum HTTP capacity for that response size/traffic mix. Figure 8 depicts these results.
Figure 8 – Detection Under Load (HTTP Capacity With No Transaction Delay)
750$
1,000$ 1,000$ 1,000$ 1,000$
0$
250$
500$
750$
1,000$
1,250$
1.7$KB$ 4.5$KB$ 10$KB$ 21$KB$ 44$KB$
Throughp
ut)(M
bps))
NSS Labs Breach Detection Systems Product Analysis – Fortinet FortiSandbox 3000D
10
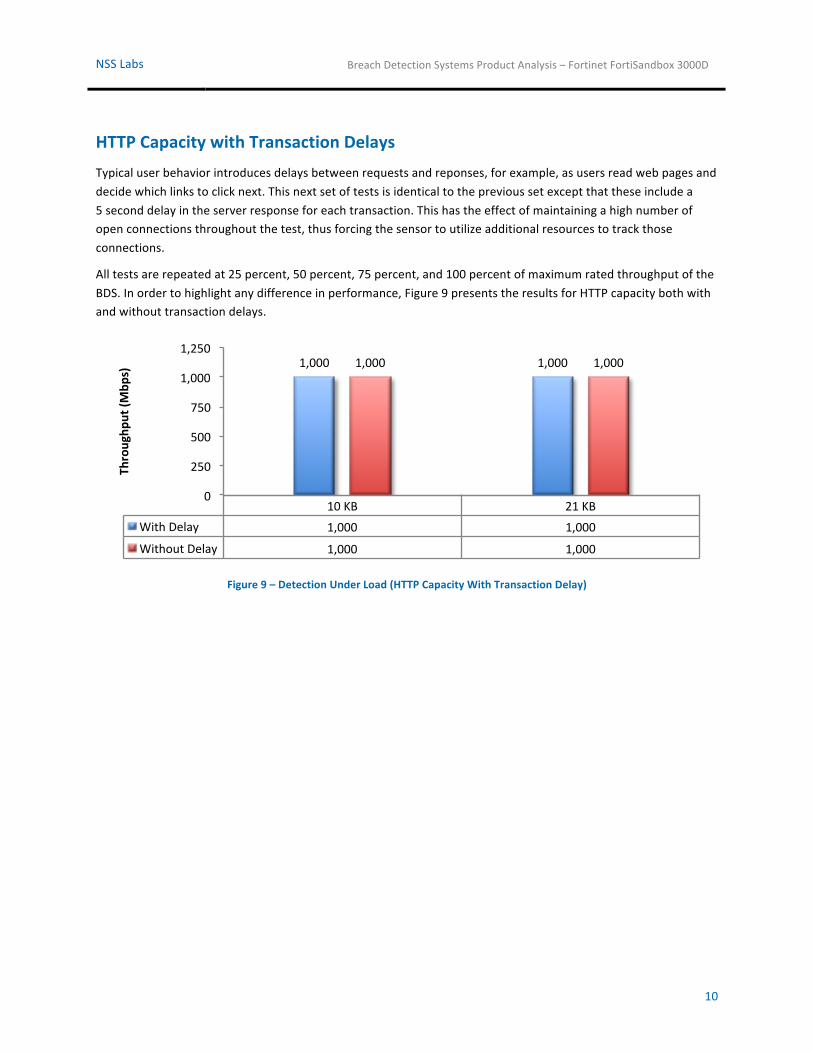
HTTP Capacity with Transaction Delays Typical user behavior introduces delays between requests and reponses, for example, as users read web pages and decide which links to click next. This next set of tests is identical to the previous set except that these include a 5 second delay in the server response for each transaction. This has the effect of maintaining a high number of open connections throughout the test, thus forcing the sensor to utilize additional resources to track those connections.
All tests are repeated at 25 percent, 50 percent, 75 percent, and 100 percent of maximum rated throughput of the BDS. In order to highlight any difference in performance, Figure 9 presents the results for HTTP capacity both with and without transaction delays.
Figure 9 – Detection Under Load (HTTP Capacity With Transaction Delay)
10#KB# 21#KB#With#Delay# 1,000# 1,000#
Without#Delay# 1,000# 1,000#
1,000# 1,000#1,000# 1,000#
0#
250#
500#
750#
1,000#
1,250#
Throughp
ut)(M
bps))
NSS Labs Breach Detection Systems Product Analysis – Fortinet FortiSandbox 3000D
11
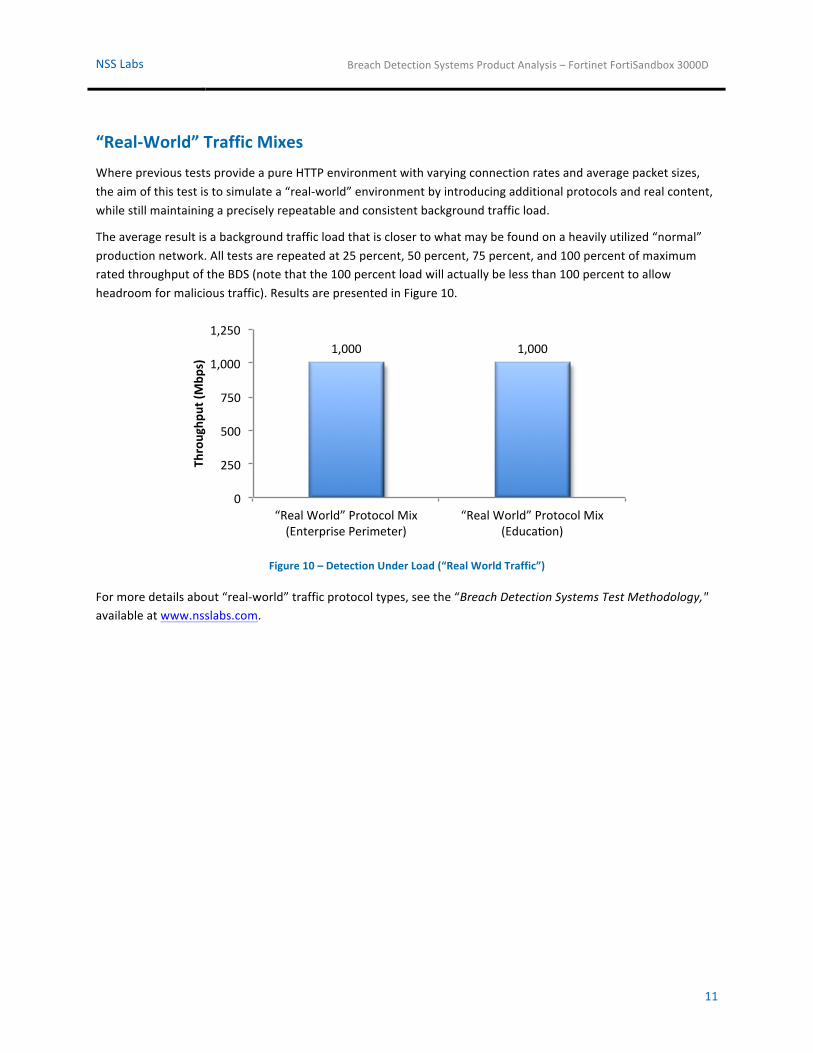
“Real-‐World” Traffic Mixes Where previous tests provide a pure HTTP environment with varying connection rates and average packet sizes, the aim of this test is to simulate a “real-‐world” environment by introducing additional protocols and real content, while still maintaining a precisely repeatable and consistent background traffic load.
The average result is a background traffic load that is closer to what may be found on a heavily utilized “normal” production network. All tests are repeated at 25 percent, 50 percent, 75 percent, and 100 percent of maximum rated throughput of the BDS (note that the 100 percent load will actually be less than 100 percent to allow headroom for malicious traffic). Results are presented in Figure 10.
Figure 10 – Detection Under Load (“Real World Traffic”)
For more details about “real-‐world” traffic protocol types, see the “Breach Detection Systems Test Methodology," available at www.nsslabs.com.
1,000$ 1,000$
0$
250$
500$
750$
1,000$
1,250$
“Real$World”$Protocol$Mix$(Enterprise$Perimeter)$
“Real$World”$Protocol$Mix$(Educa@on)$
Throughp
ut)(M
bps))
NSS Labs Breach Detection Systems Product Analysis – Fortinet FortiSandbox 3000D
12
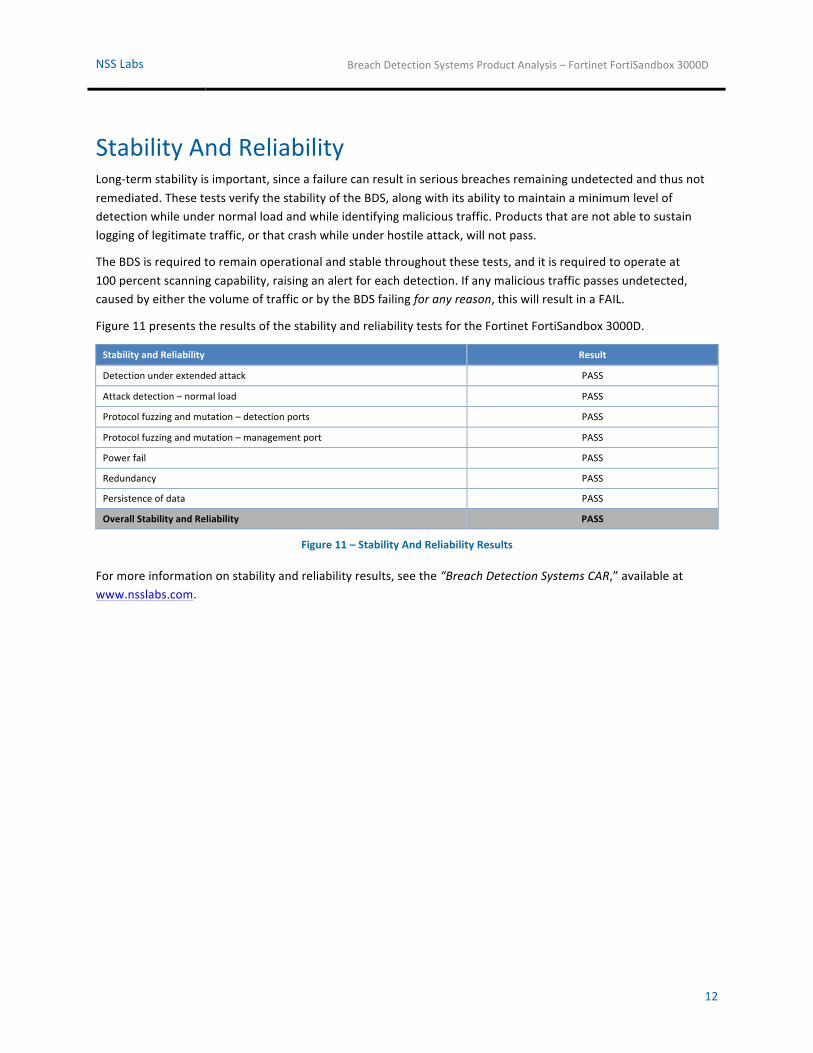
Stability And Reliability Long-‐term stability is important, since a failure can result in serious breaches remaining undetected and thus not remediated. These tests verify the stability of the BDS, along with its ability to maintain a minimum level of detection while under normal load and while identifying malicious traffic. Products that are not able to sustain logging of legitimate traffic, or that crash while under hostile attack, will not pass.
The BDS is required to remain operational and stable throughout these tests, and it is required to operate at 100 percent scanning capability, raising an alert for each detection. If any malicious traffic passes undetected, caused by either the volume of traffic or by the BDS failing for any reason, this will result in a FAIL.
Figure 11 presents the results of the stability and reliability tests for the Fortinet FortiSandbox 3000D.
Stability and Reliability Result
Detection under extended attack PASS
Attack detection – normal load PASS
Protocol fuzzing and mutation – detection ports PASS
Protocol fuzzing and mutation – management port PASS
Power fail PASS
Redundancy PASS
Persistence of data PASS
Overall Stability and Reliability PASS
Figure 11 – Stability And Reliability Results
For more information on stability and reliability results, see the “Breach Detection Systems CAR,” available at www.nsslabs.com.
NSS Labs Breach Detection Systems Product Analysis – Fortinet FortiSandbox 3000D
13
Management And Configuration Security devices are complicated to deploy, and essential systems such as centralized management console options, log aggregation, and event correlation/management systems further complicate the purchasing decision.
Understanding key comparison points allows customers to model the overall impact on network service level agreements (SLAs); estimate operational resource requirements to maintain and manage the systems; and better evaluate the required skill/competencies of staff.
As part of this test, NSS performed in-‐depth technical evaluations of the main features and capabilities of the enterprise management systems offered by each vendor, covering the following key areas:
• General Management And Configuration – How easily can devices be installed and configured, and how easily can multiple devices be deployed throughout a large enterprise network?
• Product Customization – How easily can customized configurations be created, edited, and deployed across an enterprise? Configurations may be policies, alert settings, and so on, depending on the product.
• Alert Handling – How accurate and timely is the alerting, and how easily accessible is the critical information that would be needed to remediate a security problem?
• Reporting – How effective and how easily customized is the reporting capability?
For a complete analysis of enterprise management capabilities and total cost of ownership (TCO), refer to the “Total Cost Of Ownership” and “Management” CARs available at www.nsslabs.com.
NSS Labs Breach Detection Systems Product Analysis – Fortinet FortiSandbox 3000D
14
Total Cost of Ownership (TCO) Implementation of security solutions can be complex, with several factors affecting the overall cost of deployment, maintenance fees, and upkeep. All of these factors should be considered over the course of the useful life of the solution.
• Product Purchase – The cost of acquisition. • Product Maintenance Fees – The recurring fees paid to the vendor (including software and hardware support,
maintenance and other updates). • Installation Time – The time required to take the device out of the box, configure it, put it into the network,
apply updates and patches, and set up desired logging and reporting. • Upkeep – The time required to apply periodic updates and patches from vendors, including hardware,
software, and other updates. • Management – Day-‐to-‐day management tasks including device configuration, policy updates, policy
deployment, alert handling, and so on.
For the purposes of this report, capital expenditure (CAPEX) items are included for a single device only (the cost of acquisition and installation). Operational expenditure (OPEX) items (ongoing management and labor costs) for multiple devices plus centralized management systems are modeled in the separate “Management” and “Total Cost Of Ownership” CARs, available at www.nsslabs.com.
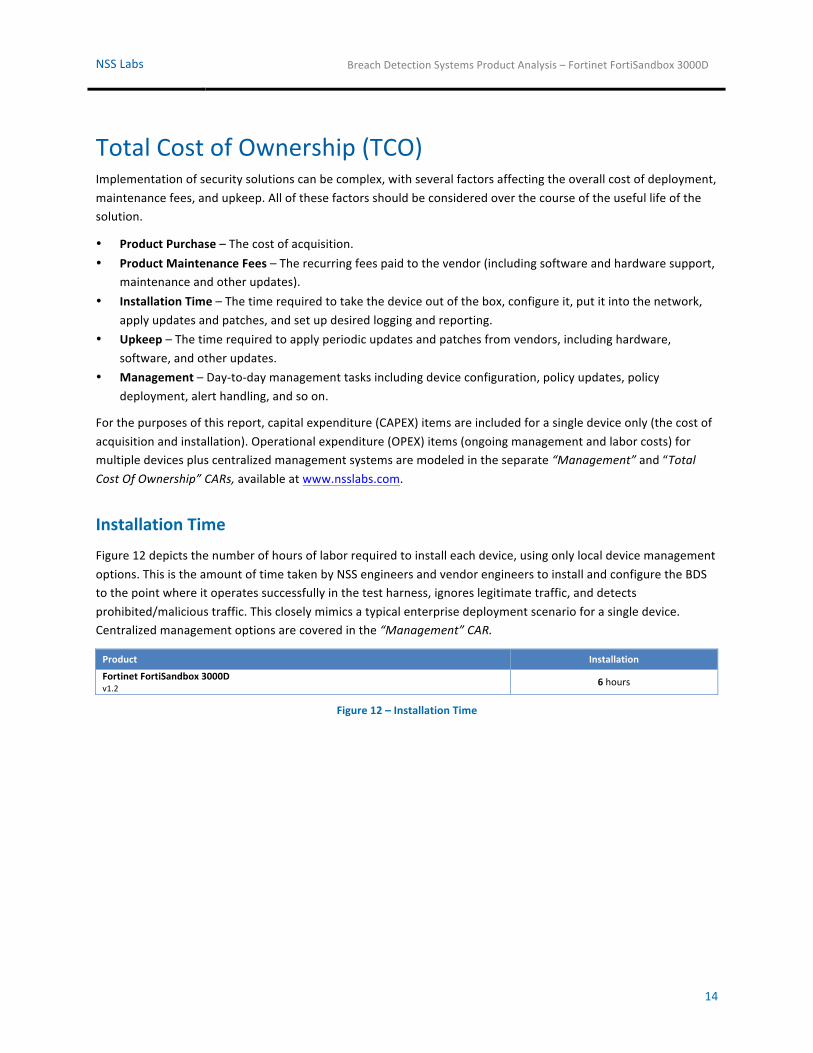
Installation Time
Figure 12 depicts the number of hours of labor required to install each device, using only local device management options. This is the amount of time taken by NSS engineers and vendor engineers to install and configure the BDS to the point where it operates successfully in the test harness, ignores legitimate traffic, and detects prohibited/malicious traffic. This closely mimics a typical enterprise deployment scenario for a single device. Centralized management options are covered in the “Management” CAR.
Product Installation
Fortinet FortiSandbox 3000D v1.2 6 hours
Figure 12 – Installation Time
NSS Labs Breach Detection Systems Product Analysis – Fortinet FortiSandbox 3000D
15
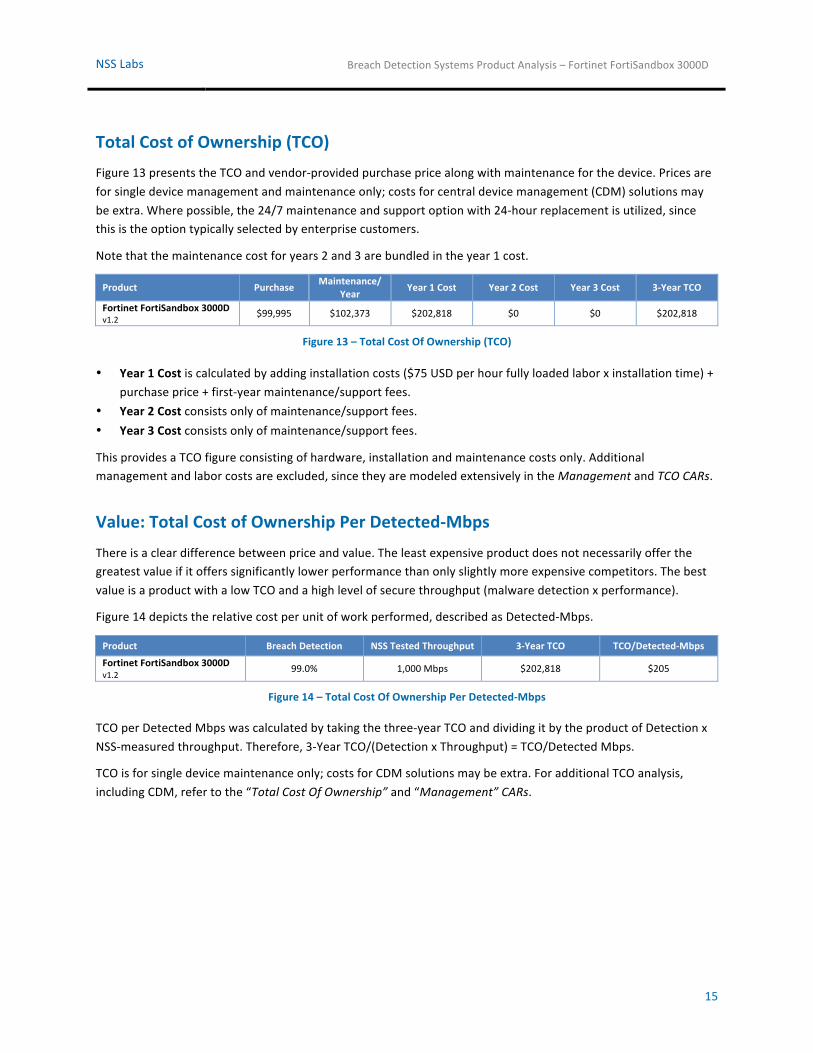
Total Cost of Ownership (TCO) Figure 13 presents the TCO and vendor-‐provided purchase price along with maintenance for the device. Prices are for single device management and maintenance only; costs for central device management (CDM) solutions may be extra. Where possible, the 24/7 maintenance and support option with 24-‐hour replacement is utilized, since this is the option typically selected by enterprise customers.
Note that the maintenance cost for years 2 and 3 are bundled in the year 1 cost.
Product Purchase Maintenance/Year
Year 1 Cost Year 2 Cost Year 3 Cost 3-‐Year TCO
Fortinet FortiSandbox 3000D v1.2
$99,995 $102,373 $202,818 $0 $0 $202,818
Figure 13 – Total Cost Of Ownership (TCO)
• Year 1 Cost is calculated by adding installation costs ($75 USD per hour fully loaded labor x installation time) + purchase price + first-‐year maintenance/support fees.
• Year 2 Cost consists only of maintenance/support fees. • Year 3 Cost consists only of maintenance/support fees.
This provides a TCO figure consisting of hardware, installation and maintenance costs only. Additional management and labor costs are excluded, since they are modeled extensively in the Management and TCO CARs.
Value: Total Cost of Ownership Per Detected-‐Mbps
There is a clear difference between price and value. The least expensive product does not necessarily offer the greatest value if it offers significantly lower performance than only slightly more expensive competitors. The best value is a product with a low TCO and a high level of secure throughput (malware detection x performance).
Figure 14 depicts the relative cost per unit of work performed, described as Detected-‐Mbps.
Product Breach Detection NSS Tested Throughput 3-‐Year TCO TCO/Detected-‐Mbps
Fortinet FortiSandbox 3000D v1.2 99.0% 1,000 Mbps $202,818 $205
Figure 14 – Total Cost Of Ownership Per Detected-‐Mbps
TCO per Detected Mbps was calculated by taking the three-‐year TCO and dividing it by the product of Detection x NSS-‐measured throughput. Therefore, 3-‐Year TCO/(Detection x Throughput) = TCO/Detected Mbps.
TCO is for single device maintenance only; costs for CDM solutions may be extra. For additional TCO analysis, including CDM, refer to the “Total Cost Of Ownership” and “Management” CARs.
NSS Labs Breach Detection Systems Product Analysis – Fortinet FortiSandbox 3000D
16
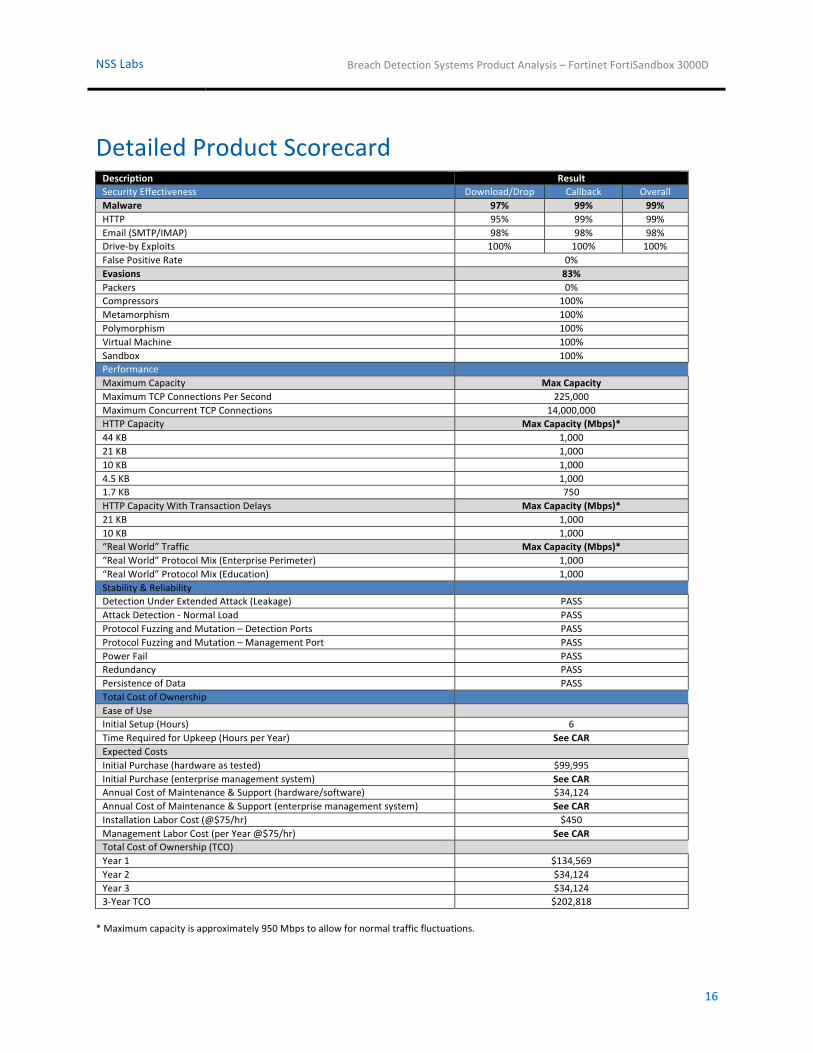
Detailed Product Scorecard Description Result Security Effectiveness Download/Drop Callback Overall Malware 97% 99% 99% HTTP 95% 99% 99% Email (SMTP/IMAP) 98% 98% 98% Drive-‐by Exploits 100% 100% 100% False Positive Rate 0% Evasions 83% Packers 0% Compressors 100% Metamorphism 100% Polymorphism 100% Virtual Machine 100% Sandbox 100% Performance
Maximum Capacity Max Capacity Maximum TCP Connections Per Second 225,000 Maximum Concurrent TCP Connections 14,000,000 HTTP Capacity Max Capacity (Mbps)* 44 KB 1,000 21 KB 1,000 10 KB 1,000 4.5 KB 1,000 1.7 KB 750 HTTP Capacity With Transaction Delays Max Capacity (Mbps)* 21 KB 1,000 10 KB 1,000 “Real World” Traffic Max Capacity (Mbps)* “Real World” Protocol Mix (Enterprise Perimeter) 1,000 “Real World” Protocol Mix (Education) 1,000 Stability & Reliability Detection Under Extended Attack (Leakage) PASS Attack Detection -‐ Normal Load PASS Protocol Fuzzing and Mutation – Detection Ports PASS Protocol Fuzzing and Mutation – Management Port PASS Power Fail PASS Redundancy PASS Persistence of Data PASS Total Cost of Ownership Ease of Use Initial Setup (Hours) 6 Time Required for Upkeep (Hours per Year) See CAR Expected Costs Initial Purchase (hardware as tested) $99,995 Initial Purchase (enterprise management system) See CAR Annual Cost of Maintenance & Support (hardware/software) $34,124 Annual Cost of Maintenance & Support (enterprise management system) See CAR Installation Labor Cost (@$75/hr) $450 Management Labor Cost (per Year @$75/hr) See CAR Total Cost of Ownership (TCO)
Year 1 $134,569 Year 2 $34,124 Year 3 $34,124 3-‐Year TCO $202,818
* Maximum capacity is approximately 950 Mbps to allow for normal traffic fluctuations.
NSS Labs Breach Detection Systems Product Analysis – Fortinet FortiSandbox 3000D
17
More detailed scorecards that include enterprise management capabilities and TCO calculations are available in the appropriate “Comparative Analysis Reports” (CARs), available at www.nsslabs.com.
NSS Labs Breach Detection Systems Product Analysis – Fortinet FortiSandbox 3000D
18
© 2014 NSS Labs, Inc. All rights reserved. No part of this publication may be reproduced, photocopied, stored on a retrieval system, or transmitted without the express written consent of the authors.
Please note that access to or use of this report is conditioned on the following:
1. The information in this report is subject to change by NSS Labs without notice.
2. The information in this report is believed by NSS Labs to be accurate and reliable at the time of publication, but is not guaranteed. All use of and reliance on this report are at the reader’s sole risk. NSS Labs is not liable or responsible for any damages, losses, or expenses arising from any error or omission in this report.
3. NO WARRANTIES, EXPRESS OR IMPLIED ARE GIVEN BY NSS LABS. ALL IMPLIED WARRANTIES, INCLUDING IMPLIED WARRANTIES OF MERCHANTABILITY, FITNESS FOR A PARTICULAR PURPOSE, AND NON-‐INFRINGEMENT ARE DISCLAIMED AND EXCLUDED BY NSS LABS. IN NO EVENT SHALL NSS LABS BE LIABLE FOR ANY CONSEQUENTIAL, INCIDENTAL OR INDIRECT DAMAGES, OR FOR ANY LOSS OF PROFIT, REVENUE, DATA, COMPUTER PROGRAMS, OR OTHER ASSETS, EVEN IF ADVISED OF THE POSSIBILITY THEREOF.
4. This report does not constitute an endorsement, recommendation, or guarantee of any of the products (hardware or software) tested or the hardware and software used in testing the products. The testing does not guarantee that there are no errors or defects in the products or that the products will meet the reader’s expectations, requirements, needs, or specifications, or that they will operate without interruption.
5. This report does not imply any endorsement, sponsorship, affiliation, or verification by or with any organizations mentioned in this report.
6. All trademarks, service marks, and trade names used in this report are the trademarks, service marks, and trade names of their respective owners.
Test Methodology
Breach Detection Systems: Test Methodology 1.5
A copy of the test methodology is available at www.nsslabs.com
Contact Information NSS Labs, Inc. 206 Wild Basin Rd. Building A, Suite 200 Austin, TX 78746 USA +1 (512) 961-‐5300 [email protected] www.nsslabs.com
This and other related documents available at: www.nsslabs.com. To receive a licensed copy or report misuse, please contact NSS Labs at +1 (512) 961-‐5300 or [email protected].


![NSS Labs Network IPS 2010 Comparative Test Results[1]](https://img.pdfslide.us/doc/110x75/5406b5f0dab5cafa7b8b47a3/nss-labs-network-ips-2010-comparative-test-results1.jpg)