Embed Size (px)
Citation preview

Not only did the Dow Jones Industrial Average (DJIA) top 14,000 for the first time since October 2007, but performance of constituents in the portfolio of our Dividend Growth Newsletter (see page 5) was even better! ConocoPhillips’ spin-off Phillips 66 (PSX) hit an all-time high and has now nearly doubled since it joined our portfolio. Johnson & Johnson (JNJ) and Procter & Gamble (PG) notched all-time highs, while Altria (MO), Kinder Morgan (KMP), and Emerson Electric (EMR) also had an excellent month!
We’ve been more than satisfied with our performance so far this year and since inception. Our Dividend Growth portfolio has now advanced over 16% for an annualized return of 15%, roughly doubling our goal of a mid-to-high single annual return over rolling 3-5 year periods. We continue to expect constituents in the portfolio of our Dividend Growth Newsletter to deliver, and while we plan to trim our weightings in a few positions in coming weeks (as a measure of prudence), we remain laser-focused on our long-term goals for members.
What a Month for Dividend Growth Investors!
Dividend Growth Newsletter portfolio holding Phillips 66 (PSX)—annual dividend yield 1.6%—announced another fantastic quarter. The company has been one of the biggest winners in the portfolio of our Dividend Growth Newsletter. Adjusted earnings per share jumped over 240% year-over-
I N S I D E T H I S I S S U E 1 What a Month for Dividend Growth
Investors!
1 Phillips 66 Caps Off 2012 with an Outstanding Fourth Quarter (ticker: PSX)
2 The Most Important Tactic in Money Management: Don’t Overreact – The Path of Republic Services (ticker: RSG)
3 Weak Holiday Sales from Hasbro are a Surprise (ticker: HAS)
4 Intel Punished for Investing in the Future (ticker: INTC)
5 Our Dividend Growth Portfolio
6 P&G Delivers Fantastic Results (ticker: PG)
7 AT&T Sells Just a few iPhones…8.6 million! (ticker: T)
9 Microsoft Remains a Terrific Company (ticker: MSFT)
10 Johnson & Johnson’s Long-term Tailwinds are Intact (ticker: JNJ)
11 Stocks with High VBI Ratings and Strong Dividend Growth Prospects (see article for tickers)
12 Our Dividend Growth Watch List
13 Yields to Avoid
15 General Electric Issues Strong Fourth-Quarter Results; Posts Largest Backlog in History (ticker: GE)
16 Bristol-Myers Squibb Beats Estimates (ticker: BMY)
17 McDonald’s Beats Estimates (ticker: MCD)
18 About Our Dividend Cushion™
21 Featured Reports: MGE Energy, Altria, Illinois Tool Works, Stanley
25 Our Valuentum Buying Index
28 Valuentum Definitions
February 1, 2013 Volume 2 Issue 2
By Brian Nelson, CFA
By RJ Towner
Please see Our Dividend Growth Portfolio on page 5
Valuentum Securities Inc. www.valuentum.com [email protected]
OUR DIVIDEND GROWTH NEWSLETTER
Brian Nelson, CFA
President, Equity Research
RJ Towner
Director, Equity Research
© 2013 Valuentum. All rights reserved.
Reproduction by any means is prohibited.
Phillips 66 Caps Off 2012 with an Outstanding Fourth Quarter
Please see Phillips 66…on page 3
*NOTE: Our Dividend Growth portfolio’s goal is to generate a mid-to-high single digit annual return over rolling 3-5 year periods. Our Best Ideas portfolio’s goal is to exceed the benchmark return (SPY) each year and to generate a positive return each year regardless of broad market conditions.
*Please see note below regarding performance measurement.
= All Time High!

Page 2 Valuentum’s Dividend Growth Newsletter
The Most Important Tactic in Money Management: Don't Overreact - The Path of Republic Services By Valuentum Analysts
Let's dig into the path of Republic Services (RSG)—annual dividend yield 3%—a holding in both the portfolio of our Best Ideas Newsletter and Dividend Growth Newsletter. The trash taker's past several months have been quite volatile due to some negative news flow, but the company has now fully recovered and is breaking out to a new 52-week high!
Though we had plans to trim our position in both of our actively-managed portfolios following its weak performance in early November of last year, we didn't move an inch as we waited for a tactical exit. In fact, in our Dividend Growth portfolio (cost basis: $27.55 per share), we still hold a full position, and we're now sitting on profits in our Best Ideas portfolio—even before considering the steady stream of growing dividends we received from the garbage hauler.
The key takeaway is that when we add a company to our actively-managed portfolios, we have conviction in our idea. When others run for the exit when news flow turns negative, we don't overreact as Mr. Market often does (at the expense of the retail investor). And in this particular example, even though we're still planning to trim our position in both of our actively-managed portfolios, patience and letting the story evolve (from Hurricane Sandy to REIT-conversion speculation) has turned a potential loss into a big winner (date referenced in picture, January 28, 2013).

Valuentum’s Dividend Growth Newsletter Page 3
year to $2.06, smashing consensus estimates. Earnings for the year jumped 50% to $8.46, highlighting the considerable operating leverage inherent to the refinery business. Shares are now up over 90% since being spun off from ConocoPhillips (COP) in 2012.
Cash flow generation was superb, as the firm raked in $1.3 billion in operating cash flow. $1 billion was used to reduce debt, leaving the firm with a debt/capital ratio of 25%. The firm also added $1 billion to its share repurchase program, and hiked its dividend 25% (it raised it to $1.25 per share for 2013)—though that figure represents a yield of less than 2% thanks to share appreciation during the past year. We love the firm’s aggressive capital management policies, which have helped the company quickly reduce debt while providing strong returns of capital to shareholders.
Phillips 66 benefitted tremendously from crude as a percentage of the mix (67% versus 57%), and shale oil processing, where barrels per day increased 97% from the same period a year ago. Refining and marketing earnings, adjusted for a large impairment in the company’s Melaka Refinery, jumped 18% year-over-year to $1.1 billion, even though utilization was 300 basis points lower at 91%. Export volumes also helped boost earnings, jumping 5% compared to the prior year. Even while crack spreads declined 33% sequentially, refinery market capture increased to 95% (was 79%).
Midstream earnings weren’t as strong, falling nearly 50% to $62 million on an adjusted basis. Lower natural gas prices weighed on earnings, and with a relatively warm winter and increasing supplies, we doubt the midstream segment will see a quick turnaround in profitability. Chemical earnings surged over 150% to $246 million, as segment margins improved. Olefins and polymers volumes increased 8% year-over-year, and the company remains exposed to a favorable chemical mix.
While the company doesn’t give specific financial guidance for 2013, we think the year features some strong fundamental catalysts. Phillips 66 will add additional refining export capacity, and it expects to refine 200,000 barrels per day of shale oil during 2013, well above its current run-rate of 112,000 barrels per day. We also expect the firm to file for a master limited partnership, which should hit the market in the second half of 2013.
Overall, we’re feeling confident holding shares of Phillips 66, and we could not be happier with the results of this spinoff. We see modest upside valuation from current levels, and we believe the company will continue its generous capital allocation strategies. Still, we may trim our position in the coming weeks given the huge price advance (as a measure of prudence).
Phillips 66… from page 1
Weak Holiday Sales from Hasbro Are a Surprise By Valuentum Analysts
After NPD reported solid toy sales during December, we thought the holiday season might be relatively strong for the major toymakers—including Lego, Hasbro (HAS), and Mattel (MAT). However, Hasbro announced that its fourth quarter revenue will be approximately $1.3 billion, below the consensus expectation of $1.4 billion. Earnings, net of restructuring charges, will be $2.73-$2.75 per share, well below the consensus estimate of $2.85 per share.
We won’t know until the firm announces its results in February what caused the weakness, but we like the firm’s decision to reduce annual operating expenses by $100 million over the next three years.
Since December seemed like a relatively strong month for the toy industry as a whole, we assume the season may have gotten off to a sluggish start. We’ll be monitoring the news when the company reports final results, but we aren’t too worried at this point. Excluding foreign exchange headwinds, the firm’s sales were roughly flat compared to the fourth quarter of 2011, and we think the company is doing a good job of maintaining sales as it battles macroeconomic headwinds and changing industry dynamics.
At this point, we think Hasbro remains a solid dividend growth idea, so we won’t be removing shares from the portfolio at this juncture. The firm maintains an annual dividend yield of 3.9% at the time of publication.

Page 4 Valuentum’s Dividend Growth Newsletter
Semiconductor giant Intel (INTC)—4.2% annual dividend yield—reported better than expected fourth quarter results. Revenue declined 3% year-over-year to $13.5 billion, roughly in-line with consensus expectations. Earnings easily exceeded modest estimates, falling 25% year-over-year to $0.48 per share.
Due to the weak PC market and the firm’s desire to clear inventories, gross margins were down significantly in the fourth quarter, falling 650 basis points year-over-year to 58%. Gross margin declines were the primary driver behind the lapse in profitability, but research & development costs increased $300 million compared to the same period of 2011 to 19.5% of sales (up 290 bps Y/Y).
On a segment basis, the PC Client Group, not surprisingly, drove the majority of revenue weakness, as Intel’s largest segment experienced a 6% decline in revenue to $8.5 billion. Profitability suffered even more, falling 29% year-over-year to $2.8 billion. It goes without saying that the PC market was weak in 2012, but we think some new product introductions such as all-in-one computers could spike interest in PCs going into 2013. Windows 8 hasn’t been the success Microsoft(MSFT) promised it would be, but its touch interface still has the potential to gain some market share.
Data Center Group revenue ticked up 4% year-over-year to $2.8 billion. Gross margins were about equal to the previous year, but the company has been investing heavily in increasing capacity for its cloud services. We think a 4% growth rate, while not the double digit growth we saw in 2011, is a solid figure considering the
By Valuentum Analysts
Intel Punished for Investing in the Future
broader economic landscape. Not only was the global macro outlook choppy, but the US was dealing with the fiscal cliff fiasco that resulted in a hiring and investment freeze. Regardless, CFO Stacy Smith provided some positive commentary on the conference call heading into 2013:
“…we expect the data center group to return to double-digit revenue growth and diving into that, it's the cloud data center plus our participation in portions of the market like storage and some of the networking sections of the market. It's both unit and ASP based on the strength of our product line and follow-up.”
Software and Services, driven primarily by McAfee, grew 10% year-over-year to $600 million. Several “old” tech companies such as Dell (DELL) and HP (HPQ) are focusing on becoming software driven enterprises, but we do not think Intel has to follow the same path. Intel’s current hardware offerings
Please see Intel Punished… on page 6

Valuentum’s Dividend Growth Newsletter Page 5
Our Dividend Growth Portfolio
Standard Disclaimer: Our Dividend Growth portfolio is for information purposes only and should not be considered a solicitation to buy or sell any security. Valuentum is not responsible for any errors or omissions or for results obtained from the use of our Dividend Growth Newsletter and accepts no liability for how readers may choose to utilize the content.
DIVIDEND GROWTH PORTFOLIO -- as of February 1, 2013 D iv id e nd Gro w t h P o rt f o lio Inc e p t io n D a t e : Ja nuary 1, 2 0 12
Co mpany Name Firs t P urchas e Avg Co s t ($ ) # o f Shares To ta l Co s t ($ ) Las t C lo s e Current Va lue ($ ) % o f P o rtfo lio Exp. Yrly Div's ($ )
Altria (MO) 12/30/2011 29.65 202 5,996.30 34.20 6,908.40 5.9% 355.52
Chevro n (CVX) 12/30/2011 106.40 56 5,965.40 116.50 6,524.00 5.6% 201.60
Co no co P hillips (COP ) 12/30/2011 72.87 89 6,492.43 58.82 5,234.98 4.5% 234.96
Emers o n Elec tric (EMR) 12/30/2011 46.59 97 4,526.23 58.08 5,633.76 4.8% 159.08
Energy Trans fer (ETP ) 12/30/2011 45.85 142 6,517.70 47.05 6,681.10 5.7% 508.36
Has bro (HAS) 12/30/2011 31.89 220 7,022.80 37.65 8,283.00 7.1% 316.80
Inte l (INTC) 12/30/2011 24.25 289 7,015.25 21.36 6,173.04 5.3% 260.10
J o hns o n & J o hns o n (J NJ ) 12/30/2011 65.58 107 7,024.06 74.18 7,937.26 6.8% 261.08
Kinder Mo rgan (KMP ) 12/30/2011 84.95 65 5,528.75 88.92 5,779.80 5.0% 335.40
Medtro nic (MDT) 12/30/2011 38.25 157 6,012.25 46.92 7,366.44 6.3% 163.28
Micro s o ft (MSFT) 12/30/2011 25.96 308 8,002.68 27.93 8,602.44 7.4% 283.36
P ro c to r & Gamble (P G) 12/30/2011 66.71 105 7,011.55 75.92 7,971.60 6.8% 236.25
P P &L (P P L) 12/30/2011 29.42 238 7,008.96 30.37 7,228.06 6.2% 342.72
P hillips 66 (P SX) 5/1/2011 Spin Off 44 Spin Off 62.75 2,761.00 2.4% 55.00
Republic Services (RSG) 12/30/2011 27.55 236 6,508.80 31.82 7,509.52 6.5% 221.84
Superio r Indus tries (SUP ) 12/30/2011 16.54 423 7,003.42 20.85 8,819.55 7.6% 270.72
Cas h 2,363.42 6,965.01 6.0% 4,206.07
D iv ide nd Gro wth P o rt fo lio 100,000.00 116 ,3 7 8 .9 6 100.0% 3 .6 1%
B e nc hm a rk: D o w J o ne s S e le c t D iv ide nd Inde x (D VY) 100,000.00 60.57 116 ,5 8 9 .18 3 .4 8 %****
UR = Und er Review
** Up per bo und o f fair value rang e no ted .
**** The yield an inves to r would have received if they had held the fund o ver the las t 12 months assuming the mos t recent NAV.
This po rt fo lio is no t a real money po rt fo lio . Data as o f February 1, 20 13 . Cos t bas is includes co mmiss ions . Results includ e d ivd ends , b ut no interes t received on cash balance.
DIVIDEND GROWTH PORTFOLIO -- as of February 1, 2013
Co mpany Name Yrly Div's P aid ($ ) / Shr Div Yield % Ex Div Da te Next P ay Da te (cyc l) Div Cus hio n™ Div Safe ty Div Gro wth Fair Value VBI Sco re P rice /Fa ir Va lue
Altria (MO) 1.76 5.15% mid-Mar 2013 mid Apr 2013 (quart) 1.3 GOOD EXCELLENT $ 43.00 9 0.80
Chevro n (CVX) 3.60 3.09% mid-Feb 2013 early Mar 2013 (quart) 2.6 GOOD EXCELLENT $ 110.00 3 1.06
Co no co P hillips (COP ) 2.64 4.49% early-Feb 2013 la te Feb 2013 (quart) 1.4 GOOD EXCELLENT $ 58.00 3 1.01
Emers o n Elec tric (EMR) 1.64 2.82% mid Feb 2013 early Mar 2013 (quart) 2.1 GOOD EXCELLENT $ 56.00 6 1.04
Energy Trans fe r (ETP ) 3.58 7.61% early Feb 2013 Feb 2013 (quart) 1.7 GOOD GOOD $ 52.00 3 0.90
Has bro (HAS) 1.44 3.82% la te Apr 2013 mid-May 2013 (quart) 1.6 GOOD EXCELLENT $ 49.00 3 0.77
Inte l (INTC) 0.90 4.21% early Feb 2013 early Mar 2013 (quart) 2.3 GOOD EXCELLENT $ 28.00 3 0.76
J o hns o n & J o hns o n (J NJ ) 2.44 3.29% la te Feb 2013 early Mar 2013 (quart) 2.6 GOOD EXCELLENT $ 90.00 9 0.82
Kinder Mo rgan (KMP ) 5.16 5.80% la te Apr 2013 mid May 2013 (quart) 1.4 GOOD EXCELLENT $ 92.00 6 0.97
Medtro nic (MDT) 1.04 2.22% early Apr 2013 la te Apr 2013 (quart) 2.7 GOOD EXCELLENT $ 49.00 6 0.96
Micro s o ft (MSFT) 0.92 3.29% mid Feb 2013 mid Mar 2013 (quart) 4.1 EXCELLENT EXCELLENT $ 47.00 6 0.59
P ro c to r & Gamble (P G) 2.25 2.96% la te Apr 2013 mid May 2013 (quart) 1.4 GOOD EXCELLENT $ 69.00 5 1.10
P P &L (P P L) 1.44 4.74% early Mar 2013 early Apr 2012 (quart) -0.5 VERY P OOR VERY P OOR $ 34.00 6 0.89
P hillips 66 (P SX) 1.25 1.99% early-Feb 2013 la te Feb 2013 (quart) UR UR UR $ 67.00 5 0.94
Republic Services (RSG) 0.94 2.95% la te Mar 2013 mid Apr 2013 (quart) 1.0 P OOR VERY P OOR $ 32.00 6 0.99
Superio r Indus tries (SUP ) 0.64 3.07% tba tba tba EXCELLENT GOOD $ 22.00 6 0.95
= All Time High!

Page 6 Valuentum’s Dividend Growth Newsletter
are less commoditized and are more of a value-add than the traditional PC OEMs thanks to the company’s manufacturing prowess.
Speaking of manufacturing, the company recently landed a deal with Cisco (CSCO) to produce made-to-order networking chips at its foundries. Intel is lauded for its manufacturing excellence, and we like the move as a way for Intel to diversify away from the PC business. If the deal proves to be a success, Intel’s foundry business could add solid incremental revenue growth.
Still, all eyes remain locked on the company’s decision to elevate capital expenditures and operating expenses in 2013. The company forecasts low-single-digit revenue growth in 2013, but operating expenses will increase 4%-6%, to $18.9 billion, and capital investment is expected to come in at $13 billion. Much of the elevated level is due to investment in brick-and-mortar facilities and capacity expansion, which we believe, will not be recurring once completed. In 2013, this could pressure earnings, especially if margins remain subdued (forecasted at a flattish 60%). However, the company’s decision to raise debt and likely repurchase stock should mitigate some of the earnings per share impact. Further, given departing CEO Paul Otellini’s and CFO Stacy Smith’s solid track record of capital allocation during their time at the helm, we have faith that management is making solid investments for the future.
We think it’s important to remember how transformative building a great mobile business could be for Intel. Apple (AAPL) wants nothing more than to replace Samsung in its existing iPhone package, but it won’t change suppliers until a new company makes a better chip. Over the past several decades, Intel has shown that it’s more than capable of building the best chip in the industry. If Intel is able to create the pre-eminent mobile chips, we think other industry players such as RIM (RIMM) and Motorola Mobility (GOOG) would consider more extensive relationships.
Overall, we thought the fourth quarter was stronger than anticipated, and we believe guidance for 2013 is decent and conservative. Revenue in the first quarter is expected to be $12.7 billion plus or minus $500 million, with gross margins remaining relatively low at 58%. With the Street largely disappointed in the higher levels of investment, we could see shares pull back materially yet again. However, we think plenty of upside remains, with several potential catalysts in 2013 and the first half of 2014. Though price action has been disappointing, fundamentals remain solid.
Intel Punished… from page 4
P&G Delivers Fantastic Results By Valuentum Analysts
After sputtering along for the past few years, consumer product giant Procter & Gamble (PG)—annual dividend yield 3%—has returned to solid growth, reporting strong second-quarter results for its 2013 fiscal year. Revenue rose 3% year-over-year to $22.2 billion, handily beating consensus expectations. Earnings growth was also fantastic, with core earnings per share jumping 12% compared to the year-ago period to $1.22, a stark advance from its prior lackluster growth.
The firm’s gross margin in the quarter expanded 80 basis points year-over-year to 50.9% as the company benefits from relatively flat cost inflation and incremental price increases. SG&A grew about 2% year-over-year, but the cost item remained flat as a percentage of sales. Since P&G lapped a quarter in which it took a large goodwill impairment charge, the firm’s operating margin increased 800 basis points year-over-year to 20.3%, helping deliver the impressive earnings growth.
On a segment basis, beauty & grooming continued to be a solid performer, with sales of beauty products growing 3% and grooming sales increasing 2%. It seems as though European consumers have continued to trade down in the razor-blade market as the EU deals with varying economic growth rates. We think this segment will return to solid GDP-like growth in Europe when economic conditions improve.
Please see P&G Delivers Fantastic Results on page 8
Valuentum’s Dividend Growth Newsletter Page 7
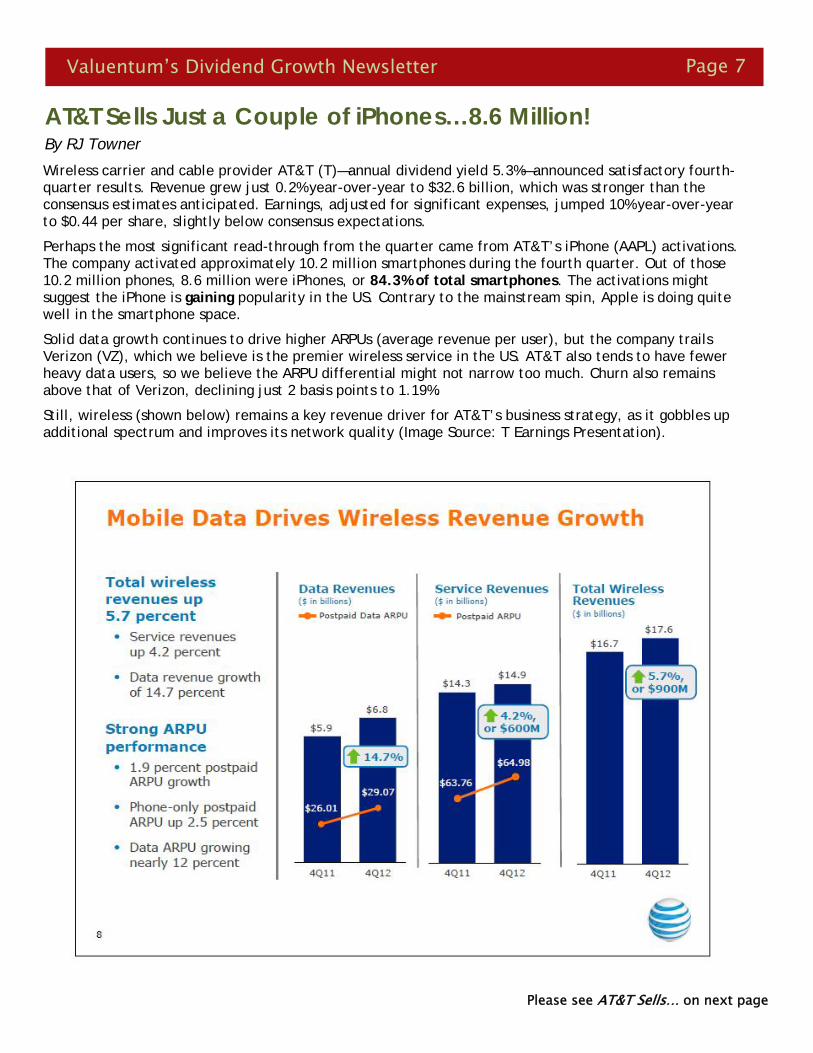
AT&T Sells Just a Couple of iPhones…8.6 Million! By RJ Towner
Wireless carrier and cable provider AT&T (T)—annual dividend yield 5.3%—announced satisfactory fourth-quarter results. Revenue grew just 0.2% year-over-year to $32.6 billion, which was stronger than the consensus estimates anticipated. Earnings, adjusted for significant expenses, jumped 10% year-over-year to $0.44 per share, slightly below consensus expectations.
Perhaps the most significant read-through from the quarter came from AT&T’s iPhone (AAPL) activations. The company activated approximately 10.2 million smartphones during the fourth quarter. Out of those 10.2 million phones, 8.6 million were iPhones, or 84.3% of total smartphones. The activations might suggest the iPhone is gaining popularity in the US. Contrary to the mainstream spin, Apple is doing quite well in the smartphone space.
Solid data growth continues to drive higher ARPUs (average revenue per user), but the company trails Verizon (VZ), which we believe is the premier wireless service in the US. AT&T also tends to have fewer heavy data users, so we believe the ARPU differential might not narrow too much. Churn also remains above that of Verizon, declining just 2 basis points to 1.19%.
Still, wireless (shown below) remains a key revenue driver for AT&T’s business strategy, as it gobbles up additional spectrum and improves its network quality (Image Source: T Earnings Presentation).
Please see AT&T Sells… on next page

Page 8 Valuentum’s Dividend Growth Newsletter
AT&T Sells… from previous page
AT&T’s legacy wireline business keeps plugging along, though revenue growth actually accelerated compared to past periods. Without question, we expect wireless to be much more important to the firm’s future, but having a solid cash generator to help grow the rest of the business is never a bad thing.
The company was a cash-flow machine in 2012, generating $19.4 billion in free cash flow during the year, though the company anticipates that number will fall in 2013. AT&T will be investing heavily in its 4G LTE network in 2013, which we think is a fantastic move for the long-term health of the business. The company also predicts wireless margin expansion, which is possible considering the continued growth in data usage as well as growth in smartphone plan mix.
Overall, we like the future of the wireless industry thanks to increasing consolidation and strong data consumption growth, but we think shares of AT&T look fairly valued. Although we’re not predicting a cut in its dividend anytime soon, we aren’t too bullish on the firm’s dividend growth profile at this time (due to its heavy debt burden), so we won’t be adding the name to the portfolio of our Dividend Growth Newsletter.
Oral care is driving expansion in P&G’s health care products segment, where organic sales increased 4% year-over-year. However, supply-chain investments and marketing spending weighed on profitability in the segment, which declined 5%.
The fabric & home care segment, thanks to demand for batteries and improved pricing, was the company’s standout performer. After-tax earnings jumped 21% year-over-year, even though organic sales only increased 3% year-over-year. Commodity price increases were not nearly material enough to weigh on earnings, but the company did attribute some of the strength in the segment to Hurricane Sandy. This could set up a difficult comparison during fiscal year 2014, but we think the company’s market share gains suggest its brands are strengthening regardless.
Baby & family care also posted fantastic results, despite losing a small amount of global market share (Image Source: P&G Earnings Presentation, right). The company’s increased exposure to developing markets with strong growth rates could help the firm offset the impact of declining birth rates in developed nations. Further, birth rates may continue to decline, but because population growth has been strong, the absolute number of babies
P&G Deliver Fantastic Results from page 6
looks poised to continue growing (3 billion families having 1 baby exceeds 1 billion families having 2 babies). After-tax earnings jumped 18%, suggesting the company’s brands are having little trouble resonating with consumers. We like the long-term growth profile of the segment.
Overall, we saw fantastic profitability growth at P&G thanks to its cost-savings initiatives and solid price increases. P&G boosted its share repurchase range to $5-$6 billion (was $4-$6 billion). Reported earnings per share are expected to increase 10% to 17% year-over-year during the fiscal third quarter (ends March), while core EPS is anticipated at +/- 3%. The company’s valuation continues to look attractive at current levels, and we continue to hold steady with our position in the portfolio of our Dividend Growth Newsletter.

Valuentum’s Dividend Growth Newsletter Page 9
Dividend Growth Newsletter portfolio holding Microsoft (MSFT)—3.3% annual dividend yield—reported solid second-quarter fiscal 2013 results. Revenue jumped 3% year-over-year (5% non-GAAP) to $21.5 billion, roughly in line with consensus figures. Earnings per share declined 3% year-over-year (+4% non-GAAP) to $0.76 per share, a penny better than the consensus estimate.
The performance from the Windows Division was relatively strong, in our view. 60 million Windows 8 licenses sold is a pretty solid number (as the image below shows), though we think the company (and the industry) would have liked to see the new operating system perform better (Image Source: Microsoft 2Q Earnings Presentation).
We place a lot of the blame on the OEMs such as Dell (DELL) and HP (HPQ) for largely not having ample product rollouts soon enough. We think Microsoft and Intel (INTC) are far more concerned about maintaining a strong position in the PC industry (which isn’t going to 0) as the traditional OEM partners worry about transforming into software companies. This might be part of the reason why Microsoft could end up financing some of the Dell deal to go private. Microsoft would like to keep Dell fully engaged in the PC industry until Microsoft is able to build its own machines. Notice in the slide above the company broke out non-OEM revenues to show it plans on reducing its dependence on the other OEMs. However, seeing Microsoft not break out Surface sales seems a little bit suspicious, but we assume this is due to lackluster performance that put the device to shame compared to Apple’s iPad (AAPL).
The firm’s Servers & Tools revenue growth was strong, up 9% year-over-year, with bookings advancing 15%. This segment remains one of Microsoft’s key growth drivers, as well as a division that gets little acknowledgement from the market.
Microsoft Remains a Terrific Company By RJ Towner
Please see Microsoft Remains a Terrific Company on page 14

Page 10 Valuentum’s Dividend Growth Newsletter
Diversified medical and consumer products firm Johnson & Johnson (JNJ)—3.3% annual dividend yield—reported solid fourth-quarter results. Sales jumped 8% year-over-year to $17.6 billion, roughly in-line with consensus expectations. Earnings were slightly better than anticipated, growing 5.3% year-over-year to $1.19 per share—after adjusting for several special items.
Johnson & Johnson's international expansion outpaced its domestic growth, with international sales jumping 8.9% on a reported basis (11.2% excluding currency) while its domestic business grew 6.8%. The acquisition of Synthes was the big needle-mover in the period, as it was responsible for 5.6 percentage points of the total sales increase. For the year, the growth rate of the firm’s Medical Devices and Diagnostics’ segment exceeded that of other segments, though pharmaceutical results were also strong. Though the firm isn’t a pure play on devices and diagnostics like other companies, including Dividend Growth portfolio holding Medtronic (MDT), Johnson & Johnson has become the biggest devices and diagnostics firm in the world.
Important demographic trends, including that people are living longer (and sometimes living unhealthier lifestyles), offer powerful tailwinds that we think will help propel future expansion at J&J. Although some may see the drive of the US government to lower healthcare expenditures as an impediment to the firm’s growth, we think the rest of the world—primarily fast-growing countries such as China and Brazil—have a long way to go to achieve similar healthcare demands as those of the US (Image Source: JNJ Earnings Presentation).
The chart above reveals the projected increase in global disease incidence through 2022, which could help J&J’s pharmaceutical business (and its consumer products business, which focuses on healthier alternatives). If such projections prove to be in the ballpark, we think J&J, as well as the entire medical space, will benefit significantly in the years to come. In particular, the company’s projections for increased incidence of diabetes could mean that big returns are in store for those that cater to this need. We continue to hold shares of J&J, and we expect increasing dividends to remain the norm.
Johnson & Johnson’s Long-term Tailwinds Are Intact By Valuentum Analysts

Valuentum’s Dividend Growth Newsletter Page 11
Stocks with High VBI Ratings and Strong Dividend Growth Prospects By Valuentum Analysts
The table below showcases firms in our coverage universe that have high Valuentum Buying Index™ ratings and strong dividend growth prospects. The table represents a list of interesting dividend-paying stocks that are among the most timely investment opportunities based on our stock-selection methodology. You’ll see that many of them are already holdings in our Dividend Growth portfolio (see page 5).
Though our dividend-growth portfolio is near fully-invested, we may swap in firms on this list or firms on our dividend-growth watch list (see the next page) at the right price or if our analyst team determines that a new add has more potential total return opportunity than a current holding.
Page 12 Valuentum’s Dividend Growth Newsletter
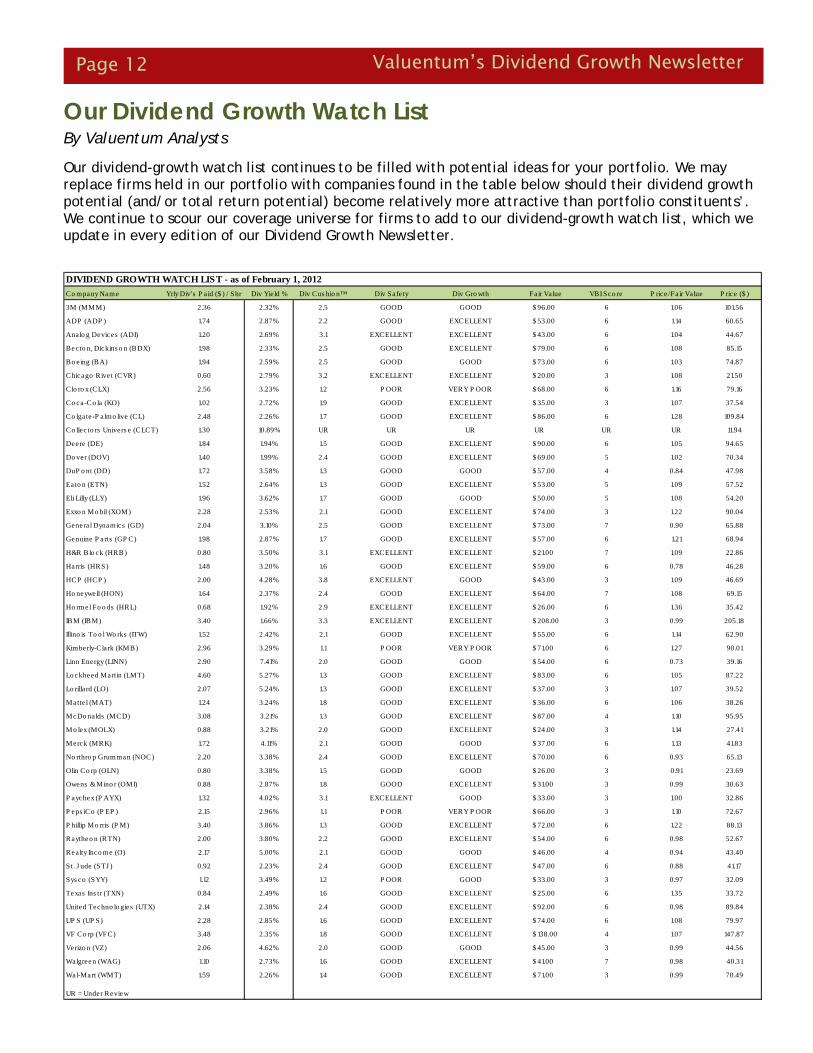
Our Dividend Growth Watch List By Valuentum Analysts
Our dividend-growth watch list continues to be filled with potential ideas for your portfolio. We may replace firms held in our portfolio with companies found in the table below should their dividend growth potential (and/or total return potential) become relatively more attractive than portfolio constituents’. We continue to scour our coverage universe for firms to add to our dividend-growth watch list, which we update in every edition of our Dividend Growth Newsletter.
DIVIDEND GROWTH WATCH LIST - as of February 1, 2012
Co mpany Name Yrly Div's P a id ($ ) / Shr Div Yie ld % Div Cus hio n™ Div Sa fe ty Div Gro wth Fa ir Va lue VBI Sco re P rice /Fair Value P rice ($ )
3M (MMM) 2.36 2.32% 2.5 GOOD GOOD $ 96.00 6 1.06 101.56
ADP (ADP ) 1.74 2.87% 2.2 GOOD EXCELLENT $ 53.00 6 1.14 60.65
Analo g Devices (ADI) 1.20 2.69% 3.1 EXCELLENT EXCELLENT $ 43.00 6 1.04 44.67
Becto n, Dickins o n (BDX) 1.98 2.33% 2.5 GOOD EXCELLENT $ 79.00 6 1.08 85.15
Bo eing (BA) 1.94 2.59% 2.5 GOOD GOOD $ 73.00 6 1.03 74.87
Chicago Rive t (CVR) 0.60 2.79% 3.2 EXCELLENT EXCELLENT $ 20.00 3 1.08 21.50
Clo ro x (CLX) 2.56 3.23% 1.2 P OOR VERY P OOR $ 68.00 6 1.16 79.16
Co ca-Co la (KO) 1.02 2.72% 1.9 GOOD EXCELLENT $ 35.00 3 1.07 37.54
Co lgate -P almo live (CL) 2.48 2.26% 1.7 GOOD EXCELLENT $ 86.00 6 1.28 109.84
Co llec to rs Univers e (CLCT) 1.30 10.89% UR UR UR UR UR UR 11.94
Deere (DE) 1.84 1.94% 1.5 GOOD EXCELLENT $ 90.00 6 1.05 94.65
Do ver (DOV) 1.40 1.99% 2.4 GOOD EXCELLENT $ 69.00 5 1.02 70.34
DuP o nt (DD) 1.72 3.58% 1.3 GOOD GOOD $ 57.00 4 0.84 47.98
Ea to n (ETN) 1.52 2.64% 1.3 GOOD EXCELLENT $ 53.00 5 1.09 57.52
Eli Lilly (LLY) 1.96 3.62% 1.7 GOOD GOOD $ 50.00 5 1.08 54.20
Exxo n Mo bil (XOM) 2.28 2.53% 2.1 GOOD EXCELLENT $ 74.00 3 1.22 90.04
Genera l Dynamics (GD) 2.04 3.10% 2.5 GOOD EXCELLENT $ 73.00 7 0.90 65.88
Genuine P arts (GP C) 1.98 2.87% 1.7 GOOD EXCELLENT $ 57.00 6 1.21 68.94
H&R Blo ck (HRB) 0.80 3.50% 3.1 EXCELLENT EXCELLENT $ 21.00 7 1.09 22.86
Harris (HRS) 1.48 3.20% 1.6 GOOD EXCELLENT $ 59.00 6 0.78 46.28
HCP (HCP ) 2.00 4.28% 3.8 EXCELLENT GOOD $ 43.00 3 1.09 46.69
Ho neywell (HON) 1.64 2.37% 2.4 GOOD EXCELLENT $ 64.00 7 1.08 69.15
Ho rmel Fo o ds (HRL) 0.68 1.92% 2.9 EXCELLENT EXCELLENT $ 26.00 6 1.36 35.42
IBM (IBM) 3.40 1.66% 3.3 EXCELLENT EXCELLENT $ 208.00 3 0.99 205.18
Illino is To o l Wo rks (ITW) 1.52 2.42% 2.1 GOOD EXCELLENT $ 55.00 6 1.14 62.90
Kimberly-Cla rk (KMB) 2.96 3.29% 1.1 P OOR VERY P OOR $ 71.00 6 1.27 90.01
Linn Energy (LINN) 2.90 7.41% 2.0 GOOD GOOD $ 54.00 6 0.73 39.16
Lo ckheed Martin (LMT) 4.60 5.27% 1.3 GOOD EXCELLENT $ 83.00 6 1.05 87.22
Lo rilla rd (LO) 2.07 5.24% 1.3 GOOD EXCELLENT $ 37.00 3 1.07 39.52
Matte l (MAT) 1.24 3.24% 1.8 GOOD EXCELLENT $ 36.00 6 1.06 38.26
McDo nalds (MCD) 3.08 3.21% 1.3 GOOD EXCELLENT $ 87.00 4 1.10 95.95
Mo lex (MOLX) 0.88 3.21% 2.0 GOOD EXCELLENT $ 24.00 3 1.14 27.41
Merck (MRK) 1.72 4.11% 2.1 GOOD GOOD $ 37.00 6 1.13 41.83
No rthro p Grumman (NOC) 2.20 3.38% 2.4 GOOD EXCELLENT $ 70.00 6 0.93 65.13
Olin Co rp (OLN) 0.80 3.38% 1.5 GOOD GOOD $ 26.00 3 0.91 23.69
Owens & Mino r (OMI) 0.88 2.87% 1.8 GOOD EXCELLENT $ 31.00 3 0.99 30.63
P aychex (P AYX) 1.32 4.02% 3.1 EXCELLENT GOOD $ 33.00 3 1.00 32.86
P eps iCo (P EP ) 2.15 2.96% 1.1 P OOR VERY P OOR $ 66.00 3 1.10 72.67
P hillip Mo rris (P M) 3.40 3.86% 1.3 GOOD EXCELLENT $ 72.00 6 1.22 88.13
Raytheo n (RTN) 2.00 3.80% 2.2 GOOD EXCELLENT $ 54.00 6 0.98 52.67
Realty Inco me (O) 2.17 5.00% 2.1 GOOD GOOD $ 46.00 4 0.94 43.40
St. J ude (STJ ) 0.92 2.23% 2.4 GOOD EXCELLENT $ 47.00 6 0.88 41.17
Sys co (SYY) 1.12 3.49% 1.2 P OOR GOOD $ 33.00 3 0.97 32.09
Texas Ins tr (TXN) 0.84 2.49% 1.6 GOOD EXCELLENT $ 25.00 6 1.35 33.72
United Techno lo gies (UTX) 2.14 2.38% 2.4 GOOD EXCELLENT $ 92.00 6 0.98 89.84
UP S (UP S) 2.28 2.85% 1.6 GOOD EXCELLENT $ 74.00 6 1.08 79.97
VF Co rp (VFC) 3.48 2.35% 1.8 GOOD EXCELLENT $ 138.00 4 1.07 147.87
Verizo n (VZ) 2.06 4.62% 2.0 GOOD GOOD $ 45.00 3 0.99 44.56
Walgreen (WAG) 1.10 2.73% 1.6 GOOD EXCELLENT $ 41.00 7 0.98 40.31
Wal-Mart (WMT) 1.59 2.26% 1.4 GOOD EXCELLENT $ 71.00 3 0.99 70.49
UR = Under Review

Valuentum’s Dividend Growth Newsletter Page 13
Yields to Avoid By Valuentum Analysts
As many investors know, firms can often become cheap for good reasons. That is, they are not trading cheaply because of Mr. Market’s irrational behavior, but instead are trading at depressed levels due to deteriorating underlying fundamental characteristics that actually justify its current share price, even if traditional valuation techniques (read multiple analysis) suggest the firm’s shares are inexpensive. On a similar note, firms that boast high dividend yields may do so because the market has little confidence in the sustainability of its dividend and believes a cut may be just around the corner.
Though we fall short of saying the following list of firms will slash their respective dividends anytime soon, our dividend-cut predictive indicator—the Valuentum Dividend Cushion™--indicates that the firms below are at significant risk for a dividend cut in coming years. We think the dividend-growth investor should steer clear of the following firms’ shares:
The Valuentum Dividend Cushion™ predicted Roundy’s dividend cut – highlighted in yellow above.
Name Symbol Industry Dividend Yield Div Safety Div CushionCablevision CVC Media - CATV 4.3% VERY POOR -9.5Peabody Energy BTU Industrial Minerals 1.3% VERY POOR -9.4Hess HES Refiners 0.7% VERY POOR -8.9Universal Health UHS Hospitals 0.4% VERY POOR -7.9Manitowoc MTW Machinery - agriculture 0.6% VERY POOR -7.8Royal Caribbean RCL Leisure 1.4% VERY POOR -7.3Ryder System R Rental and Leasing 2.7% VERY POOR -7.1Roundy's Inc RNDY Food Retailers 10.3% VERY POOR -6.6Sealed Air SEE Containers & Packaging 2.9% VERY POOR -5.7United States Steel X Metals & Mining - steel 0.8% VERY POOR -5.0Chesapeake CHK Independent Oil & Gas 1.7% VERY POOR -4.8CONSOL Energy CNX Industrial Minerals 1.6% VERY POOR -4.5Standard Pacific SPF Homebuilders 2.3% VERY POOR -4.0AAR Corp AIR A&D Suppliers 2.1% VERY POOR -4.0Anadarko APC Independent Oil & Gas 0.5% VERY POOR -3.7TAL Intl TAL Rental and Leasing 7.6% VERY POOR -3.5QEP Resources QEP Energy Equipment 0.3% VERY POOR -2.5Frontier Comm FTR Telecom Services - diversified 8.7% VERY POOR -2.4Lufkin LUFK Energy Equipment 0.9% VERY POOR -2.2Windstream WIN Telecom Services - diversified 11.5% VERY POOR -2.0Patterson-UTI PTEN Energy Equipment 1.1% VERY POOR -2.0Ecolab ECL Chemicals - broad 1.1% VERY POOR -1.9SL Green SLG REIT - Retail 1.4% VERY POOR -1.7Cedar Fair FUN Leisure 4.8% VERY POOR -1.7Noble Corp NE Energy Equipment 1.5% VERY POOR -1.6Time Warner Cable TWC Media - CATV 2.4% VERY POOR -1.6Service Corp Intl SCI Personal Services 1.7% VERY POOR -1.6Toyota TM Auto Manufacturers 1.8% VERY POOR -1.4POSCO PKX Metals & Mining - steel 0.9% VERY POOR -1.3Centerpoint CNP Utilities 3.8% VERY POOR -1.1Allegheny Technologies ATI Aluminum 2.7% VERY POOR -1.0CMS Energy CMS Utilities 4.0% VERY POOR -1.0

Page 14 Valuentum’s Dividend Growth Newsletter
While all eyes are on Dell and HP as both try to build successful enterprise and data businesses, Microsoft already owns a strong datacenter business that we think would garner a double-digit price-to-earnings multiple were it a separate company (we do not think Microsoft should break up, however). Although many of Microsoft’s consumer products are plagued by mediocre perception, SQL and other products have a strong reputation and are known as market-leading products.
Microsoft Business Division posted modest non-GAAP revenue growth of 4% year-over-year, though it mentioned retention rates are nearing all-time highs, and its new recurring revenue stream via Office 2013 should help increase (and smooth) total revenue. Bookings were up sharply, increasing 18% during the quarter, and the firm had strong growth across both developed and emerging markets. Google’s (GOOG) assault on Microsoft’s document / spreadsheet / slideshow dominance is certainly real, but we think Microsoft’s introduction of cloud services will help maintain market share. Nevertheless, we know Google doesn’t mind lowering overall industry profits and will attempt to undercut Microsoft on pricing, so we do view it as a modest competitive threat.
The online business continues to hemorrhage money, but its operating loss narrowed during the quarter thanks to 15% advertising revenue growth. Bing continues to take search market share, albeit at a very modest pace. Entertainment, on the other hand, posted a fairly weak quarter as the Xbox 360 ages. We’re fairly excited about the opportunity for Xbox 720 to revive console gaming, but the video game market remains weak at this time. Skype consumption continues to grow, but monetization efforts are still relatively unclear, though it does now charge for some of its features.
Microsoft’s outlook going into the back half of its fiscal year 2013 remains solid, but we aren’t anticipating a huge beat in the second half. Cost containment looks pretty strong, and the firm maintains a jaw-dropping cash balance that we expect to see returned to shareholders via increased dividends and share repurchases.
While we believe the firm’s quarter was relatively solid, Microsoft largely remains a “show-me” story in the eyes of many investors that are awaiting evidence revealing it can successfully navigate the shift in the PC landscape to a new normal. Still, the company has a dirt-cheap valuation and generates fantastic cash flow, giving us all of the confidence we need to maintain our stake in the firm in the portfolio of our Dividend Growth Newsletter. The market may continue to ignore Microsoft’s excellent core businesses and favorable capital structure, but in the meantime, we’ll continue to clip ever-increasing dividend coupons.
Microsoft Remains a Terrific Company from page 9

Valuentum’s Dividend Growth Newsletter Page 15
General Electric Issues Strong Fourth-Quarter Results; Posts Largest Backlog in History By Valuentum Analysts
General Electric (GE)—3.4% annual dividend yield—reported solid fourth-quarter results across the board.
Total revenue advanced 4% as industrial organic expansion increased at a similar rate. Adjusted orders jumped 7% in the quarter, and the company’s backlog swelled to $210 billion, a new record (Image Source: GE 4Q Earnings Presentation). GE’s operating margins increased 120 basis points during the period, and fourth-quarter operating earnings per share expanded 13% from the same quarter a year ago. All of its industrial segments experienced earnings with five of the seven industrial segments putting up double-digit bottom-line expansion. GE Capital posted $1.8 billion in earnings during the quarter, and its Tier I common ratio came in at a healthy 10.2%. The industrial powerhouse continues to be a cash cow, as it hauled in roughly $17.8 billion in cash from operating activities during the year. GE now holds $77 billion of consolidated cash and cash equivalents, offering substantial support for share repurchases and increased dividend payments. During 2012, GE bought back roughly $5.2 billion in stock, and just last month, it raised its quarterly dividend 12%, to $0.19 per share—its fifth increase in three years.
GE is perhaps the most important indicator of the health of the industrials end market, where segment revenue advanced 9% in the quarter, excluding currency. As far as assessing the ongoing strength of the sector, the firm’s all-time high backlog is quite telling. Though there was weakness in wind turbine orders during the period, the ratio of equipment orders received to orders billed (or its book-to-bill ratio) came in at a healthy 1.2. Such performance bodes well for many industrial firms, especially when viewed in conjunction with the ~1.5 book-to-bill ratio recorded during 2012 at the airframe makers, Boeing (BA) and Airbus. During the quarter, CFM International (a 50/50 joint venture between GE and Snecma) announced a commitment from Alaska Airlines (ALK) for the purchase of CFM engines to power 50 new Boeing 737 aircraft, and we’re fans of GE’s agreement to purchase the aviation business of Avio S.p.A. The Italy-based company will complement GE’s position in aviation and other engine components, and we have no qualms with the purchase price (8.5 times EBITDA). Overall, we think GE’s increasing exposure to aerospace is a distinct positive.
Looking ahead, GE indicated that it remains on track to achieve its 2013 goals: “double-digit earnings growth and solid organic revenue growth for the industrial segment [5-9% excluding wind], significant cash returned to the parent company from GE Capital, further margin expansion [70 basis points], and returning cash to shareholders [$12 billion+].” We are strongly considering the firm for addition to the portfolio of our Dividend Growth Newsletter.

Page 16 Valuentum’s Dividend Growth Newsletter
Bristol-Myers Squibb Beats Estimates By RJ Towner
Despite facing a steep patent cliff, pharmaceutical firm Bristol-Myers Squibb (BMY)—3.8% annual dividend yield—posted decent fourth-quarter results. Revenue declined 23% year-over-year to $4.2 billion, slightly better than the consensus prediction. Operating earnings per share declined 11% year-over-year to $0.47, which was also better than consensus estimates.
2012 was expected to be a tough year for the company, as it had US patents expire on Plavix and Avapro/Avalide, and total sales fell 23% for the quarter. However, strong international growth of 6% allowed the company to achieve 12% revenue expansion, excluding the aforementioned drugs. Costs were also reduced substantially, as the firm cut advertising and product-promotion spending 26% year-over-year to $212 million and slashed SG&A spending 6% year-over-year to $1.1 billion.
There weren’t too many new updates on the product pipeline. Eliquis was approved by the FDA to reduce the risk of stroke in patients with nonvalvular atrial fibrillation, and Forxiga was approved in the EU for treatment of Type-2 diabetes—one of the world’s fastest growing health issues, which we highlighted in our piece on Johnson & Johnson (JNJ). The company mentioned that 30-40% of its R&D budget in 2013 will be spent on late-stage drug development and that R&D spending will grow at a low-single-digit pace in 2013. Bristol-Myers expects earnings per share of $1.78-$1.88 in 2013, roughly in line with consensus, on sales of $16.5-$17 billion, also in line with consensus.
We like the firm’s juicy annual dividend yield of 3.8% at current levels, as well as its commitment to growing its payout. We also think the firm will tap its buyback program, re-affirming its desire to return cash to shareholders. We’re strongly considering adding shares of the company to the portfolio of our Dividend Growth Newsletter, but we’re waiting for a more attractive valuation.

Valuentum’s Dividend Growth Newsletter Page 17
McDonald’s Beats EstimatesBy Valuentum Analysts
Fast-food goliath McDonald’s (MCD)—3.3% annual dividend yield—announced slightly better-than-expected fourth quarter results Wednesday morning. Revenue grew 2% year-over-year to $7 billion, a touch better than consensus expectations. Earnings, which have seen estimates slashed during the past several months, were a few pennies better than anticipated, growing 4% year-over-year to $1.38 per share.
We’re not too fixated on the “beat,” but rather the weakness we are seeing at the core business. Global same-store sales increased just 0.1% during the quarter—McDonald’s worst in years! Same-store sales in the US jumped 0.3% year-over-year in the fourth quarter with flat operating income—the top-line was better than the rest of the company, but certainly is not a strong figure. McDonald’s continues to focus on value offerings and has some new products coming, including the recently released Mighty Wings, the Fish McBites, and the grilled onion cheddar burger.
Unfortunately, we think McDonald’s focus on value is hurting its other products and making consumers less likely to purchase higher-ticket items. While conditioning consumers to pay less for food, the company has also squeezed its own margins, as well as those of its operators, which we think could have a negative impact on the long-term operations. CEO Don Thompson certainly has his work cut out for him with the domestic business. Increased competition in the value market from competitors such as Wendy’s (WEN) only makes growing the US business more difficult.
In Europe, same-store sales declined 0.6%, but operating income grew 7%, excluding currency. Obviously the European economy is softer than the US, so we’re actually pleased with how well sales have held up. If negative guest counts can be reversed, we could see a decent year for McDonald’s in Europe. Operating margins for the year only fell 10 basis points to 19.1%. Margins still significantly trail the US business, and this trend could continue if the firm sees its commodity basket price rise 3%-4% as it expects.
Performance in Asia-Pacific, Middle East, and Africa (APMEA) was weak during the fourth quarter, with same-store sales tumbling 1.7% year-over-year and operating income falling 1%, excluding currency. The segment continues to be dwarfed by the larger US and European segments, but China could eventually become a real profit center. However, we’ve yet to see the firm achieve substantial scale to boost operating margins, and performance in the broader Chinese fast-food sector has been mediocre as of late. If McDonald’s hopes to hit its annual operating income growth of 6-7% with sales growth of 2-3%, it will need to experience better results in China, and Asia as a whole.
Overall, we thought McDonald’s fourth-quarter performance was mediocre. While some positive product launches could help reinvigorate the brand in the US heading into 2013, the days of massive product innovations (like McCafe under previous CEO Jim Skinner) look a long ways in the future. We wouldn’t go as far as to blame Thompson. Skinner may simply have left when the product pipeline was empty. We also do not believe the days of its product innovation are over, but it’s clear the company has hit a bit of a rough patch in terms of innovation. We’re still waiting patiently to open up a position in the company in our Dividend Growth portfolio.

Page 18 Valuentum’s Dividend Growth Newsletter
History has revealed that the best performing stocks during the previous decades have been those that shelled out ever-increasing cash to shareholders in the form of dividends. In a recent study, S&P 500 stocks that initiated dividends or grew them over time registered roughly a 9.6% annualized return since 1972 (through 2010), while stocks that did not pay out dividends or cut them performed poorly over the same time period.
Such analysis is difficult to ignore, and we believe investors may be well-rewarded in future periods by finding the best dividend-growth stocks out there. As such, we've developed a rigorous dividend investment methodology that uncovers firms that not only have the safest dividends but also ones that are poised to grow them long into the future.
How did we do this? Well, first of all, we scoured our stock universe for firms that have cut their dividends in the past to uncover the major drivers behind the dividend cut. This is what we found out: The major reasons why firms cut their dividend had to do with preserving cash in the midst of a secular or cyclical downturn in demand for their products/services or when faced with excessive leverage (how much debt they held on their respective balance sheets).
The Importance of Forward-Looking Dividend Analysis
Armed with this knowledge, we developed the forward-looking Valuentum Dividend Cushion™, which is a ratio that gauges the safety of a dividend over time.
Most dividend analysis that we’ve seen out there is backward-looking – meaning it rests on what the firm has done in the past. Although analyzing historical trends is important, we think assessing what may happen in the future is even more important. The S&P 500 Dividend Aristocrat List, or a grouping of firms that have raised their dividends for the past 25 years, is a great example of why backward-looking analysis can be painful.
In fact, one only has to look over the past few years to see the removal of such big names from the Dividend Aristocrat List like General Electric (GE) and Pfizer (PFE) to understand that backward-looking analysis is hardly worth your time. After all, you’re investing for the future, so the future is all you should care about. We want to find the stocks that will increase their dividends for 25 years into the future, not use a rear-view mirror to build a portfolio of names that may already be past their prime dividend growth years.
About Our Valuentum Dividend Cushion™ By Valuentum Analysts
Please see About Our Valuentum Dividend Cushion…on next page

Valuentum’s Dividend Growth Newsletter Page 19
The Valuentum Dividend Cushion™ measures just how safe the dividend is in the future. It considers the firm’s net cash on its balance sheet and adds that to its forecasted future free cash flows and divides that sum by the firm’s future expected dividend payments. At its core, it tells investors whether the firm has enough cash to pay out its dividends in the future, while considering its debt load. If a firm has a Valuentum Dividend Cushion™ above 1, it can cover its dividend, but if it falls below 1, trouble may be on the horizon.
In fact, the Valuentum Dividend Cushion™ would have caught every dividend cut made by a non-financial, operating firm that we have in our database, except for one (Marriott). But interestingly, our Valuentum Dividend Cushion™ indicated that Marriott should have never cut its dividend, and sure enough, two years after the firm did so, it raised it to levels that were higher than before the cut.
Here are the results of our study (a Valuentum Dividend Cushion™ below 1 indicates the dividend may be in trouble). The Valuentum Dividend Cushion™ score shown in the table below is the measure in the year before the firm cut its dividend, so it represents a predictive indicator:
At the very least, using the Valuentum Dividend Cushion™ can help you avoid firms that are at risk of cutting their dividends in the future. And we are the only firm out there that does this type of in-depth analysis for you. Plus, we not only provide the actual Valuentum Dividend Cushion™ number for our subscribers in our dividend reports and newsletter, but we also scale the safety of a firm’s dividend in simple terms: Excellent, Good, Poor, Very Poor.
About Our Valuentum Dividend Cushion… from previous page
Please see About Our Valuentum Dividend Cushion…on next page

Page 20 Valuentum’s Dividend Growth Newsletter
But What about the Growth of a Firm’s Dividend?
It takes time to accumulate wealth through dividends, so dividend growth investing requires a long-term perspective. As a result, we assess the long-term future growth potential of a firm’s dividend. And we don’t just take management’s word for what they will do with their dividend. Instead, we dive into the financial statements and make our own forecasts of the future to see if what they’re saying is actually achievable. We use our Valuentum Dividend Cushion™ as a way to judge the capacity for management to raise its dividend – how much cushion it has – and we couple that assessment with the firm’s dividend track record, or management’s willingness to raise the dividend.
In many cases, we may have a different view of a firm’s dividend growth potential than what may be widely held in the investment community. That’s fine by us, as our dividend-growth investment horizon is often longer than others. We want to make sure that the firm has the capacity and willingness to increase the dividend years into the future and will not be weighed down by an excessive debt load or cyclical or secular problems in fundamental demand for their products/services.
Plus, we don’t use fancy language for what we think of its future growth. We scale our assessment in an easily-interpreted fashion: Excellent, Good, Poor, Very Poor.
What are the Dividend Ideas We Seek to Deliver to You in Our Newsletter?
First of all, we’re looking for stocks with dividend yields that are greater than the average of the S&P 500, or about 2% (but preferably north of 3%). This excludes many names, but we think such a cutoff eliminates firms whose dividend streams aren’t yet large enough to generate sufficient income. Second, we’re looking for firms that register an 'EXCELLENT' or 'GOOD' rating on our scale for both safety and future potential growth. And third, we’re looking for firms that have a relatively lower risk of capital loss, as measured by our estimate of the company’s fair value.
About Our Valuentum Dividend Cushion… from previous page

Valuentum’s Dividend Growth Newsletter Page 21
Please select the following link to view the full 16-page report: http://www.valuentum.com/categories/20110609

Page 22 Valuentum’s Dividend Growth Newsletter
Please select the following link to view the full 16-page report: http://www.valuentum.com/categories/20110609

Valuentum’s Dividend Growth Newsletter Page 23
Please select the following link to view the full 16-page report: http://www.valuentum.com/categories/20110609

Page 24 Valuentum’s Dividend Growth Newsletter
Please select the following link to view the full 16-page report: http://www.valuentum.com/categories/20110609

Valuentum’s Dividend Growth Newsletter Page 25
But how, you will ask, does one decide what [stocks are] "attractive"? Most analysts feel they must choose between two approaches customarily thought to be in opposition: "value" and "growth,"...We view that as fuzzy thinking...Growth is always a component of value [and] the very term "value investing" is redundant.
-- Warren Buffett, Berkshire Hathaway annual report, 1993
At Valuentum, we take Buffett's thoughts one step further. We think the best opportunities arise from a complete understanding of all investing disciplines in order to identify the most attractive stocks at any given time. Valuentum therefore analyzes each stock across a wide spectrum of philosophies, from deep value through momentum investing. We think companies that are attractive from a number of investment perspectives--whether it be growth, value, income, momentum, etc.--have the greatest probability of capital appreciation and relative outperformance. The more deep-pocketed institutional investors that are interested in the stock for reasons based on their respective investment mandates, the more likely it will be bought and the more likely the price will move higher to reflect its true intrinsic value (buying a stock pushes its price higher). On the other hand, we think the worst stocks will be shunned by most investment disciplines and display expensive valuations, poor technicals and deteriorating momentum indicators.
As such, the Valuentum Buying Index (VBI) combines rigorous financial and valuation analysis with an evaluation of a firm's technicals and momentum indicators to derive a score between 1 and 10 for each company (10=best). The VBI places considerable emphasis on a firm's DCF valuation, its relative valuation versus peers (both forward PE and PEG ratios), as well as its technicals in order to help investors pick the best entry and exit points on the most interesting stocks. We believe our methodology helps identify the most attractive stocks at the best time to buy, helping to avoid value traps and lagging performance due to the opportunity cost of holding a stock with great potential but at an inopportune time.
A Rigorous, Discounted Cash Flow Valuation Assessment
Our methodology starts with in-depth financial statement analysis, where we derive our ValueCreation, ValueRisk, and ValueTrend ratings, which together provide a quantitative assessment of the strength of a firm's competitive advantages. After evaluating historical trends, we then make full annual forecasts for each item on a company's income statement and balance sheet to arrive at a firm's future free cash flows. We derive a company-specific cost of equity (using a fundamental beta based on the expected uncertainty of key valuation drivers) and a cost of debt (considering the firm's capital structure and synthetic credit spread over the risk-free rate), culminating in our estimate of a company's weighted average cost of capital (WACC). We don't use a market price-derived beta, as we embrace market volatility, which provides investors with opportunities to buy attractive stocks at bargain-basement levels.
We assess each company within our complete three-stage free cash flow to the firm (enterprise cash flow) valuation model, which generates an estimate of a company's equity value per share based on its discounted future free cash flows and the company's net balance sheet impact, including other adjustments to equity value (namely pension and OPEB adjustments). Our ValueRisk rating, which considers the underlying uncertainty of the capacity of the firm to continue to generate value for shareholders, sets the margin of safety bands around this fair value estimate. For firms that are trading below the lower bound of our margin of safety band, we consider these companies undervalued based on our DCF process. For firms that are trading above the higher bound of our margin of safety band, we consider these companies overvalued based on our DCF process.
Our Methodology – The Valuentum Buying Index By Valuentum Analysts
Our Methodology – The Valuentum Buying Index continued on next page

Page 26 Valuentum’s Dividend Growth Newsletter
Our Methodology – The Valuentum Buying Index (cont.) A Forward-Looking Relative Value Assessment
Our discounted cash-flow process allows us to arrive at an absolute view of the firm's intrinsic value. However, we also understand the critical importance of assessing firms on a relative value basis, versus both their industry and peers. Many institutional money-managers--those that drive stock prices—pay attention to a company's price-to-earnings (PE) ratio and price-earning-to-growth (PEG) ratio in making buy/sell decisions. With this in mind, we have included a forward-looking relative value assessment in our process to further augment our rigorous discounted cash-flow process. If a company is undervalued on both a price-to-earnings ratio and a price-earnings-to-growth (PEG) ratio versus industry peers, we would consider the firm to be attractive from a relative value standpoint.
Avoiding Value Traps and Opportunity Cost
Once we have estimated a firm's intrinsic value on the basis of our discounted cash-flow process, determined if it is undervalued according to its firm-specific margin of safety bands, and assessed whether it has relative value versus industry peers, we then evaluate the company's technical and momentum indicators to pin-point the best entry and exit points on the stock (but only after it meets our stringent valuation criteria). Rigorous valuation analysis and technical analysis are not mutually exclusive, and we believe both can be used together to bolster returns. An evaluation of a stock's moving averages, relative strength, upside-downside volume, and money flow index are but a few considerations we look at with respect to our technical and momentum assessment of a company's stock. We embrace the idea that the future is inherently unpredictable and that not all fundamental factors can be included in a valuation model. By extension, we use technical and momentum analysis to help safeguard us against value traps, falling knives, and the opportunity cost of holding an undervalued equity for years before it converges to fair value. Other research firms do not consider opportunity cost as a legitimate expense for investors.
Putting It All Together - the Valuentum Buying Index
Let's follow the red line on the flow chart on the next page to see how a firm can score a 10, the best mark on our index (a "Top Pick"). First, the company would need to be 'UNDERVALUED' on a DCF basis and 'ATTRACTIVE' on a relative value basis. The stock would also have to be exhibiting 'BULLISH' technicals. The firm would need a ValueCreation rating of 'GOOD' or 'EXCELLENT', exhibit 'HIGH' or 'AGGRESSIVE' growth prospects, and generate at least a 'MEDIUM' or 'NEUTRAL' assessment for cash flow generation, financial leverage, and relative price strength.
This is a tall order for any company, but we're looking to deliver the very best of ideas to our clients and subscribers. Firms that don't make the cut for a 10 are ranked accordingly, with the least attractive stocks garnering a score of 1 ("We'd sell"). Most of our coverage universe falls between 3 and 7, but at any given time there could be large number of companies garnering either high or low scores, especially at market lows or tops, respectively.

Valuentum’s Dividend Growth Newsletter Page 27
Our Methodology – The Valuentum Buying Index (cont.)

Page 28 Valuentum’s Dividend Growth Newsletter
Valuentum Dividend Growth Newsletter: Volume 2, Issue 2
Valuentum’s Dividend Growth Newsletter is published monthly. To
receive this newletter on a monthly basis, please subscribe to
Valuentum by visiting our website at http://www.valuentum.com.
Or contact us at [email protected].
© Valuentum Securities, Inc. All rights Reserved. The information contained in this report is not
represented or warranted to be accurate, correct, complete, or timely. This report is for informational
and educational purposes only and should not be considered a solicitation to buy or sell any security.
The securities mentioned herein may not be suitable for all types of investors. The information
contained in this report does not constitute any investment advice, but especially on the tax
consequences of making any particular investment decision. This material is not intended for any
specific type of investor and does not take into account an investor's particular investment objectives,
financial situation or needs.
This report is not intended as a recommendation of the securities highlighted or any particular
investment strategy. Before acting on any information found in this report, readers should consider
whether such an investment is suitable for their particular circumstances, perform their own due-
diligence, and if necessary, seek professional advice. This report has not been tailored to suit any
particular person’s portfolio or holdings.
Assumptions, opinions, and estimates are based on our judgment as of the date of the report and are
subject to change without notice. Valuentum is not responsible for any errors or omissions or for results
obtained from the use of this report and accepts no liability for how readers may choose to utilize the
content. In no event shall Valuentum be liable to any party for any direct, indirect, incidental,
exemplary, compensatory, punitive, special or consequential damages, costs, expenses, legal fees, or
losses (including, without limitation, lost income or lost profits and opportunity costs) in connection
with any use of the information contained in this document. Investors should consider this report as only
a single factor in making their investment decision. Redistribution is prohibited without written
permission.
Valuentum is not a registered investment advisor, has not given its consent to be deemed an “expert”
under the Federal Securities Act of 1933, does not offer brokerage or investment banking services, and
adheres to professional standards and abides by formal codes of ethics that put the interests of clients
and subscribers ahead of their own. As of the date of this report, Valuentum has not received any
compensation from companies highlighted in this report. Valuentum, its employees, and affiliates may
have long, short or derivative positions in the stock or stocks mentioned herein.
No warranty is made regarding the accuracy of any data or any opinions. The portfolio in the
Valuentum Dividend Growth Newsletter is hypothetical and does not represent real money.
Performance assessment of the Valuentum Buying Index™ is currently ongoing, and we intend to
update investors as soon as such results are available. Past performance is not a guarantee of future
results.
For general information about Valuentum's products and services, please contact us at