Embed Size (px)
Citation preview

1
NSE-IFMR
‘Financial Inclusion’
Research Initiative
NSE Working Paper Series1
The Role of Transaction Costs in
Access to Savings and Credit
Amy Jensen Mowl
1 This working paper is part of a research initiative on ‗Financial Inclusion‘ carried out jointly by NSE and the
Institute for Financial Management and Research (IFMR), Chennai. The views expressed in this Working
Paper are those of the author(s) and do not necessarily represent those of NSE or IFMR.
2
The Role of Transaction Costs in
Access to Savings and Credit
Prepared by: Amy Jensen Mowl2
Abstract
Most Indian households lack access to basic formal financial services. This leaves the majority of
India‘s high personal savings invested in physical assets, and the majority of its borrowing relegated
to the informal credit market. The objective of this research is to identify and quantify the transaction
costs of formal savings and credit services to assess whether or not these costs help explain the low
use of financial services. To answer these questions, we conducted quantitative and qualitative
surveys among 240 households and 6 focus groups in two villages and one urban neighborhood in
Tamil Nadu, India, to gather detailed information about the costs incurred for nearly 400 savings
accounts and 70 loans. For savings and loan products, we find that opportunity cost of time lost to
travel and waiting is high and customers are sensitive to this time loss; documentation requirements
are a substantial burden, and that transaction costs raise the overall price of financial services and may
help to explain low demand. However, in the case of savings products, we also find that customers
highly value the account as a means of preventing ―impulse spending,‖ and incurring a positive
transaction cost to access funds may be a desirable product feature. These results imply that
improving the design of transaction costs to increase demand for financial services would require a
strong role for product design innovation, as well as supportive policy and the utilization of
appropriate technologies. Future supply-side studies could focus more precisely on the design features
of formal and informal savings products in order to highlight commitment mechanisms and
transaction costs faced by customers.
2 Professor at the Institute for Financial Management and Research (IFMR), Email: [email protected]. This
research was made possible by the generous support of the National Stock Exchange (NSE). I thank the
participants at the 2012 NSE–IFMR Round Table Conference on Financial Inclusion for their many useful
comments on an earlier draft of this paper. This paper benefited from many helpful discussions with Dr. Ajay
Tannirkulam and Ms. Vaishnavi Prathap. Ms. Sneha Kumar provided outstanding research assistance. I also
thank Mr. A. Kaliamoorthy for managing all aspects of data collection extremely well.
3
CONTENTS
Section 1 Introduction 6
1.1 State of financial access in India 6
1.2 Access vs. use of financial services 6
1.3 Puzzle of savings in India 7
Section 2 Motivation 7
Section 3 Background 7
3.1 Transaction costs of money transfers 8
3.2 Transaction costs of credit 8
3.2.1 Formal vs. informal borrowing 8
3.2.2 Group lending model 9
3.2.3 Critique of interest rates as unit of comparison 9
3.3 Transaction costs of savings 9
3.3.1 Effects of lower transaction costs 9
3.3.2 Effects of higher transaction costs 10
Section 4 Methodology 11
4.1 Sampling 11
4.1.1 First stage 11
4.1.2 Second stage 12
4.2 Survey instruments 12
4.2.1 Qualitative instruments 12
4.2.2 Quantitative instruments 13
Section 5 Results 13
5.1 Savings 13
5.1.1 Costs of opening a savings account 16
5.1.2 Costs of operating a savings account 19
5.2 Credit 22
Section 6 Implications 25
6.1 Regulatory reforms 25
6.1.1 Flexibility in banking outlets 25
6.1.2 Reducing documentation requirements 25
6.1.3 Allowing greater savings product innovation 26
6.2 Use of technology 26
6.3 Product design 26
4
Section 7 Limitations of the study and suggestions for further research 27
7.1 Limitations 27
7.2 Areas of further research 27
List of Tables
Table 1: Use of Financial services in Tamil Nadu 11
Table 2: Average number of accounts per household 14
Table 3: Percentage of savings accounts, by primary purpose of account and by region 14
Table 4: Percentage of savings accounts, by bank type and region 14
Table 5: Average age of account (in years, as of 2012), by bank type and region 15
Table 6: Reasons for opening an account 15
Table 7: Average annual interest earned per account, by bank type and region 16
Table 8: Average number of visits to open an account, by type of bank 16
Table 9: Account opening cost (INR) incurred per account, by expense and bank type 17
Table 10: Time (hours) spent to open account, by bank type 17
Table 11: Percentage of savings accounts, by kind of documentation required to open
accounts and by region 18
Table 12: Summary of documentation requirements for opening a savings account 19
Table 13: Delay (in days) between when account promised to be opened and when it was
actually opened, by bank type 19
Table 14: Percentage of savings accounts used for various banking services in the past
12 months, by bank type 20
Table 15: Cost incurred during most recent visit to bank, by expense type and bank type 21
Table 16: Time (hours) spent on most recent visit to bank, by bank type 21
Table 17: Transaction costs of formal savings, by socioeconomic status 22
Table 18: Loan Characteristics 22
Table 19: Percentage of loans by primary purpose for taking the loan (by region) 23
Table 20: Average cost (INR) incurred for loan approval, by expense type and region 23
Table 21: Average time (hours) spent for loan approval, by region 24
Table 22: Percentage of loans by documentation required for loan and by region 24
Table 23: Documentation requirements for a loan, by region 25
5
The Role of Transaction Costs in Access to Savings and Credit
1. Introduction
1.1 State of financial access in India
Low levels of financial inclusion have been reported in nationally-representative household-
level surveys for decades, most prominently by the National Sample Survey Organization‘s
(NSSO) decennial All India Debt and Investment Surveys (AIDIS). Data from the 2002
AIDIS revealed that despite India‘s vast network of bank branches and credit cooperatives,
less than 27% of farm households utilized formal credit (Rangarajan, 2009). New nationally-
representative data from the 2012 Global Financial Inclusion (Findex) database revealed that
only 35% of all adults in India have an account at a formal financial institution (Demirguc-
Kunt and Klapper, 2012). Moreover, the average account holder makes 1–2 deposits and
withdrawals per month and tends to use bank tellers as their method of withdrawal, imposing
high transaction costs on banks as well as clients. According to the Findex data, although
22% of adults reported having saved in the past year (2012), only 12% saved in a formal
financial institution, and less than 8% of adults used formal credit in 2012.
1.2 Access vs. use of financial services
Measuring the extent of financial exclusion is complicated by the difficulty in distinguishing
between access and use of financial services. ―Financial exclusion‖ consists of both
involuntary as well as voluntary financial exclusion. The ―involuntarily excluded‖ are those
who demand financial services but are unable to access those services. The reasons for such
lack of access include discrimination on social, religious, or political grounds, contractual
information that prevents institutions from profitably servicing clients, high prices or terms of
contract that make products unaffordable, and lack of appropriate products and services (for
example, people may demand simple transaction accounts, or be unable/unwilling to pledge
collateral). In contrast, the ―voluntarily excluded‖ are those who have access to financial
services but have no demand for them. This may include individuals who prefer cash or
savings in non-financial assets (such as gold or property), who lack awareness of financial
products, as well as those who may be using formal finance indirectly, such as through a
family member. From a policy perspective, it is important to target the involuntarily excluded
group, as their lack of access is not driven by lack of demand but by supply-side
considerations (World Bank, 2008).
6
1.3 Puzzle of savings in India
Despite the low levels of financial inclusion and low per capita income, India has a very high
savings rate, with savings and investment as a percentage of GDP rising above 30% over the
last five years (Nagarajan, 2012). Surprisingly, a large proportion of Indian households
neither uses formal savings options nor participates in financial markets. As reported by the
National Council of Applied Economic Research (NCAER) in 2012, only 11% of Indian
households are classified as investor households. The majority of households prefer to save in
physical assets such as business assets, gold, and property. This pattern of savings presents a
puzzle: why do individuals decline returns from saving in formal financial instruments in
favor of more illiquid savings mechanisms where they earn zero or even a negative real
return?
2. Motivation
This research aims to contribute to the growing body of work on financial access by focusing
on one particular aspect of accessing financial services—transaction costs—and examining
the effect it has on the demand for those services.
These findings could be useful to formal financial institutions in designing appropriate
savings and investment products, such as small money market mutual funds, that meet
regulatory requirements and are appropriate to client needs. Product innovations that
encourage households to move their savings from physical assets into financial assets would
strengthen capital markets, promote financial inclusion, and give households the benefits of a
positive return on their savings and a reduction in risk.
This study examines the hypothesis that transaction costs impose a significant cost in
accessing formal savings and credit services.
3. Background
For the users of financial services, transaction costs consist of direct and indirect costs. Direct
transaction costs include interest charges, service charges, and other charges levied by the
provider. Indirect transaction costs include explicit costs such as transportation and incidental

7
expenses, photocopy and documentation charges, as well as implicit costs such as the
opportunity cost of lost wages. There is evidence that the high, unstated transaction costs in
the formal financial sector account for the continued persistence of the informal financial
sector, even in economies with highly developed formal financial markets (Guirkinger,
2006).
3.1 Transaction costs of money transfers
Recent empirical work by the Centre for Microfinance (CMF) at the Institute for Financial
Management and Research (IFMR) examined transaction costs for formal and informal
remittance channels used by migrant workers. Gopinath et al. (2010) studied the conditions
under which approximately 300 Indian migrants transferred money along four major migrant
corridors. They found that 57% of the respondents most recently used an informal remittance
service and only 30% of the respondents ever used formal payment services. These findings
were initially surprising, as nominal rates were lower with formal providers and the majority
of the migrants reported a preference for formal providers due to perceived safety and
security. However, when the researchers quantified the opportunity costs of travel and
waiting time, the informal transfer methods were found to be significantly cheaper than the
formal transfer methods. Customers were very sensitive to the opportunity costs of time lost
due to travel and waiting, and the nominal price was a secondary factor in deciding between
different financial transfer methods.
3.2 Transaction costs of credit
Transaction costs of borrowing have been well-examined across multiple countries. Studies
have consistently demonstrated that the effective interest rate, i.e., the nominal interest rate
plus transaction costs, is the most relevant measure of the cost of credit.
3.2.1 Formal vs. informal borrowing
Ahmed (1989), building on the work of Gonzalez-Vega (1976) and Adams and Nehman
(1979), examined the cost of credit for households in Bangladesh, and found that only half of
the households studied borrowed from formal sources, despite the nominal rate on formal
loans being 70% less than the rate of informal loans. Since the demand for credit is a function
of the total cost of credit, the low uptake of formal credit might be explained by the higher
transaction costs of formal loans. Ahmed‘s (1989) principal findings are that (1) the
8
transaction costs for the formal sector are greater than those in the informal sector, leading to
an effective interest rate of approximately 100% for formal loans vs. 50% for informal loans,
and (2) for small loans, the effective cost of borrowing from a formal institution is relatively
higher. Moreover, lenders may be imposing high transaction costs as a means of credit
rationing. Cuevas‘ (1988) comparative analysis of rural credit in eight countries from 1981–
1988, de Guia-Abiad‘s (1993) study of the Philippine rural credit market from 1970–1980,
and Hosseini et al.‘s (2012) study of credit markets in Iran further support Ahmed‘s principal
findings.
3.2.2 Group lending model
Karduck and Seibel (2004), Dehem and Hudon (2011), and Swamy and Tulasimala (2011)
extended this analysis by comparing transaction costs for low-income households in South
India that borrowed directly from banks and through self-help groups (SHGs). They found
that the transaction cost for borrowing through SHGs was approximately one-fourth the cost
of borrowing from banks, with the majority of transaction costs of using banks due to long
and frequent visits to bank branches.
3.2.3 Critique of interest rates as unit of comparison
Other recent work (Collins et al., 2009) criticized the standard methodology of translating all
implicit and explicit costs into a single fee and converting to an annualized percentage rate
(APR), since an APR exaggerates the actual cost paid by users of financial services. It has
been proposed that the charges for small, short-term financial transactions would be best
interpreted as ―fees.‖
3.3 Transaction costs of savings
3.3.1 Effects of lower transaction costs
Making formal savings accounts cheaper and more easily available is typically expected to
result in greater use of savings accounts and greater savings mobilization; this is the rationale
behind many of the supply-side banking initiatives in developing countries. Evidence from
bank expansions in developing countries confirms this theory. Nwuke (1997) analyzed
savings behavior in six sub-Saharan African countries to examine how reducing transaction
costs can mobilize savings. He found that bank density and urbanization have a positive
effect on savings mobilization, and concluded that policies that reduce transaction costs—
9
such as rural and mobile banking—are likely to increase savings. These findings are
supported by Aportela (1999), who found that the expansion of a national savings program in
Mexico increased the savings rate by 7 percentage points for low-income households. Bank
expansions in India and Thailand have had similar positive results on savings mobilization
(Burgess et al , 2004, Kaboski and Townsend 2007).
However, while analyzing the implementation of a massive financial inclusion initiative in
one district in India, Ramji (2009) found that the proliferation of ―no-frills,‖ low-cost
accounts did not increase formal savings among the intended beneficiaries. Simply providing
access to the savings service will not guarantee its use unless the products are useful and
appropriate to customer needs.
3.3.2 Effects of higher transaction costs
A growing body of literature on behavioral and experimental economics suggests that
individuals actively seek constraints (such as fees or restrictions) on access to liquidity in
order to increase savings. Research findings suggest that individuals have time-inconsistent
preferences (Loewenstein and Thaler, 1992) and seek commitment mechanisms that bind
their future actions (Ashraf et al., 2006a). Individuals may prefer to store their money in an
account that is costly to access in order to prevent impulse spending (Banerjee and
Mullainathan, 2010; Beshears et al., 2011; Rutherford, 1999). From such a perspective, high
transaction costs of operating a saving account are a positive feature, insofar as the
transaction costs reduce the likelihood of spending.
In addition to traditional savings devices such as money guards and lock boxes, deposit
collection services have been well documented throughout Africa, India, and Bangladesh
(Collins et al., 2009). Ashraf et al. (2006b) find that offering a deposit collection service in
the Philippines had a significant positive effect on savings, and suggested that the service
might have increased savings through several mechanisms, such as decreasing the transaction
costs of making deposits, providing a public-commitment device for savings, providing a
means of impulse control, preventing family members from using savings, and so on.
This study contributes to the existing research on the transactions costs faced by users of
formal and informal credit and remittance products in two ways: first, by examining how the
demand for formal savings services is impacted by transactions costs of opening and
10
operating a savings account, and second, by exploring the transaction costs of formal loans
taken out by the households that participated in the survey, although the primary focus of the
study is on savings.
4. Methodology
4.1 Sampling
The sample was not designed to be a representative sample of the costs of access to finance
faced by all individuals in India. Rather, it was designed to be indicative of a wide range of
experiences faced by low- to middle-income borrowers and savers, and to suggest further
areas of research as well as provide inputs into discussions among policymakers and financial
service providers. In aiming for depth over breadth of experience, the study was restricted to
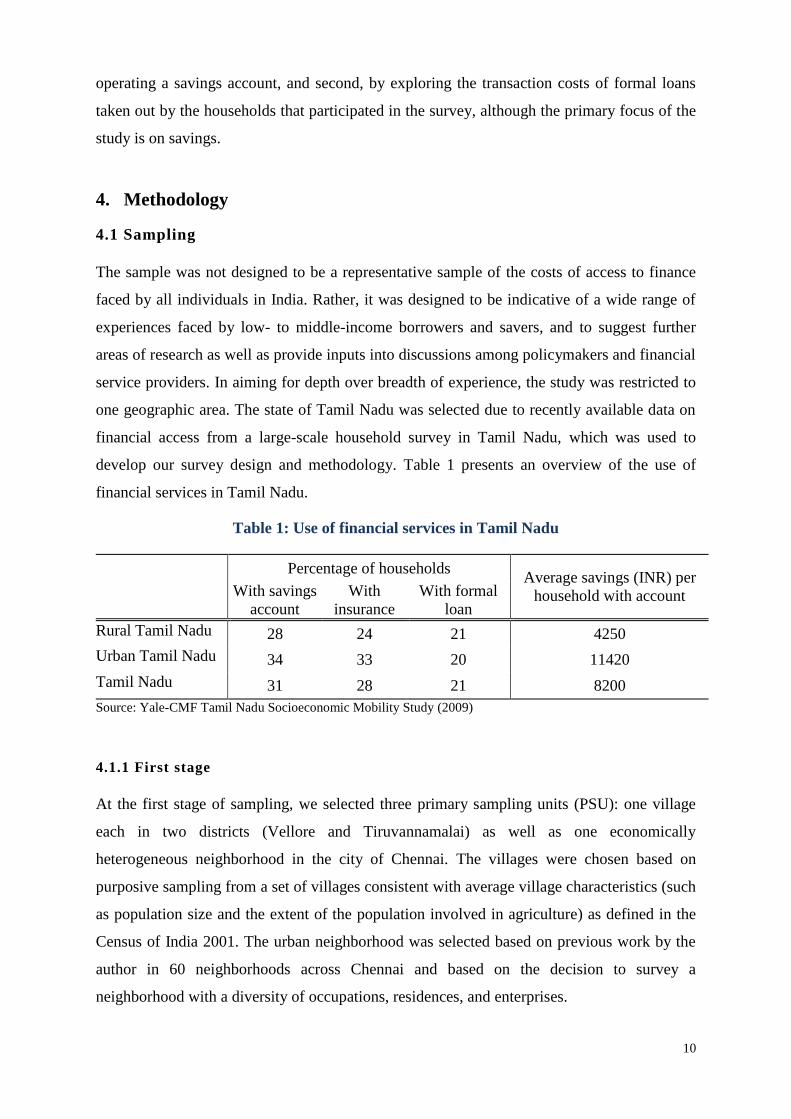
one geographic area. The state of Tamil Nadu was selected due to recently available data on
financial access from a large-scale household survey in Tamil Nadu, which was used to
develop our survey design and methodology. Table 1 presents an overview of the use of
financial services in Tamil Nadu.
Table 1: Use of financial services in Tamil Nadu
Percentage of households Average savings (INR) per
household with account With savings
account
With
insurance
With formal
loan
Rural Tamil Nadu 28 24 21 4250
Urban Tamil Nadu 34 33 20 11420
Tamil Nadu 31 28 21 8200
Source: Yale-CMF Tamil Nadu Socioeconomic Mobility Study (2009)
4.1.1 First stage
At the first stage of sampling, we selected three primary sampling units (PSU): one village
each in two districts (Vellore and Tiruvannamalai) as well as one economically
heterogeneous neighborhood in the city of Chennai. The villages were chosen based on
purposive sampling from a set of villages consistent with average village characteristics (such
as population size and the extent of the population involved in agriculture) as defined in the
Census of India 2001. The urban neighborhood was selected based on previous work by the
author in 60 neighborhoods across Chennai and based on the decision to survey a
neighborhood with a diversity of occupations, residences, and enterprises.
11
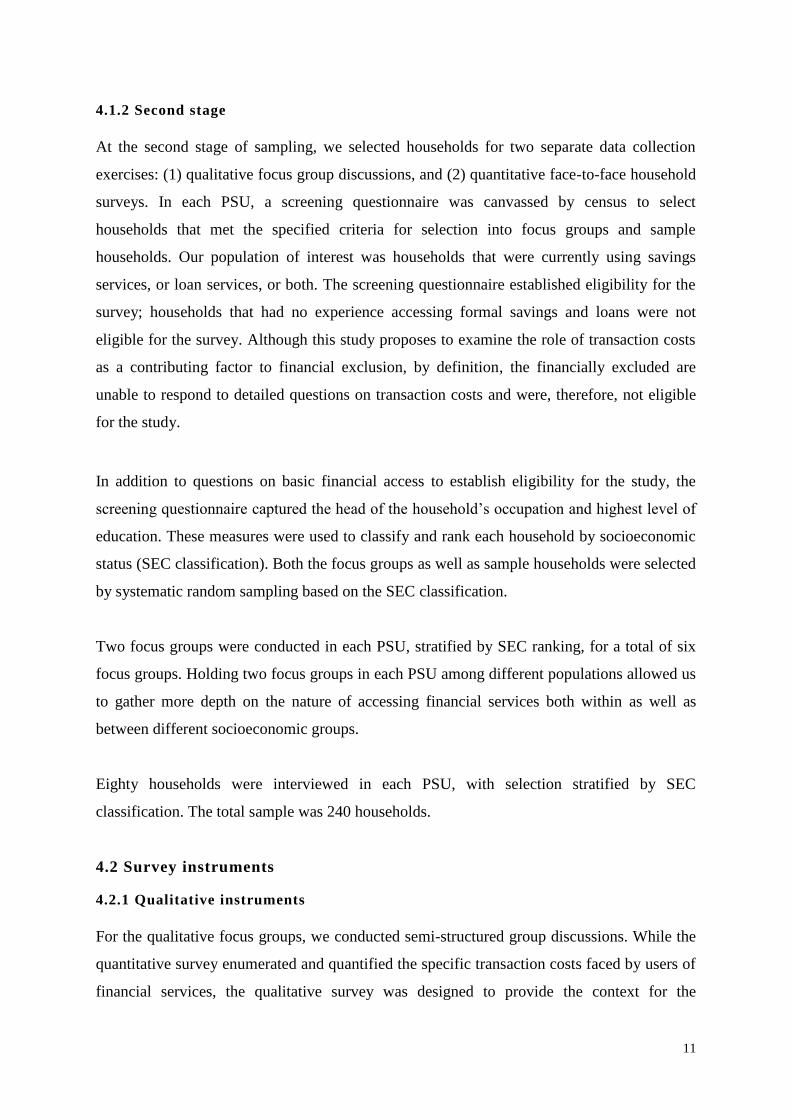
4.1.2 Second stage
At the second stage of sampling, we selected households for two separate data collection
exercises: (1) qualitative focus group discussions, and (2) quantitative face-to-face household
surveys. In each PSU, a screening questionnaire was canvassed by census to select
households that met the specified criteria for selection into focus groups and sample
households. Our population of interest was households that were currently using savings
services, or loan services, or both. The screening questionnaire established eligibility for the
survey; households that had no experience accessing formal savings and loans were not
eligible for the survey. Although this study proposes to examine the role of transaction costs
as a contributing factor to financial exclusion, by definition, the financially excluded are
unable to respond to detailed questions on transaction costs and were, therefore, not eligible
for the study.
In addition to questions on basic financial access to establish eligibility for the study, the
screening questionnaire captured the head of the household‘s occupation and highest level of
education. These measures were used to classify and rank each household by socioeconomic
status (SEC classification). Both the focus groups as well as sample households were selected
by systematic random sampling based on the SEC classification.
Two focus groups were conducted in each PSU, stratified by SEC ranking, for a total of six
focus groups. Holding two focus groups in each PSU among different populations allowed us
to gather more depth on the nature of accessing financial services both within as well as
between different socioeconomic groups.
Eighty households were interviewed in each PSU, with selection stratified by SEC
classification. The total sample was 240 households.
4.2 Survey instruments
4.2.1 Qualitative instruments
For the qualitative focus groups, we conducted semi-structured group discussions. While the
quantitative survey enumerated and quantified the specific transaction costs faced by users of
financial services, the qualitative survey was designed to provide the context for the

12
quantitative data, to encourage discussions about the motivations and reasoning behind
financial decisions, and to allow for unexpected insights and observations to emerge through
the focus group discussions. The survey moderator was provided an interview guide. Each
focus group discussion was fully transcribed and translated into English, and content analysis
was performed to summarize the key differences and the observations of each focus group.
All the focus group discussions were audited by an IFMR quality control monitor.
4.2.2 Quantitative instruments
For the quantitative household questionnaires, we used a structured, pre-coded questionnaire.
An exploratory focus group discussion was conducted during the survey planning in April
2012 to provide inputs into the questionnaire development. Household questionnaires were
extensively piloted. A two-day training session on the quantitative questionnaire (including
mock calls) was conducted for the data collection teams. All the questionnaires were
scrutinized on-site for errors and inconsistencies by a team supervisor; another 30% of the
households were selected for spot checks for inconsistency/errors by IFMR‘s chief quality
control monitor. Specialized software was designed for data entry; the questionnaires were
double-entered to minimize data entry error.
5. Results
5.1 Savings
Overall, data on nearly 400 savings accounts was collected. Account information was
captured at the household level. The average household had more than one account. On
average, rural and urban households had the same number of accounts.
Multiple accounts in a single household could be due to accounts held by different household
members, due to the existence of unused or ―dormant‖ accounts, or due to the use of accounts
for different purposes. During focus group discussions, participants expressed hesitation to
close ―old‖ or unused accounts. One participant expressed reluctance to close an SBI account
he no longer used, stating that as it was his first bank account, he wanted to keep it for
―sentimental reasons.‖ Participants with their own enterprises typically reported owning
between three and five separate accounts. Table 2 lists the average number of accounts per
household in the population that was studied.

13
Table 2: Average number of accounts per household
Rural Urban Average
Number of accounts per household 1.6 1.6 1.6
Multiple accounts per household can be explained by the primary purpose of the accounts
held. A single household will use one account for personal transactions and a second account
for business transactions. Overwhelmingly however, accounts were used for personal
transactions, and a much higher proportion of accounts was used for business in our urban
sample than in our rural sample, as shown in Table 3.
Table 3: Percentage of savings accounts, by primary purpose of account and by region
Purpose of account Rural (%) Urban (%) Average (%)
Personal transactions 87.0 84.4 86.2
Business transactions 2.3 11.7 5.4
Receiving government payments 2.3 2.3 2.3
Other 13.0 0.8 9.0
. By an overwhelming margin, accounts at nationalized banks were the most common type of
account in both our urban and rural sample. In our urban sample, nearly three times as many
accounts were with private/foreign banks as compared to our rural sample (Table 4).
Table 4: Percentage of savings accounts, by bank type and region
Type of bank Rural (%) Urban (%) Average (%)
Nationalized 86.6 77.3 83.6
Private/foreign 6.5 17.2 10.0
Grameen/Regional Rural Bank 6.1 0.8 4.4
In both rural as well as urban areas, accounts with nationalized banks had been open much
longer (on average) than accounts with Regional Rural Banks (RRBs) or private/foreign
banks (Table 5).
14
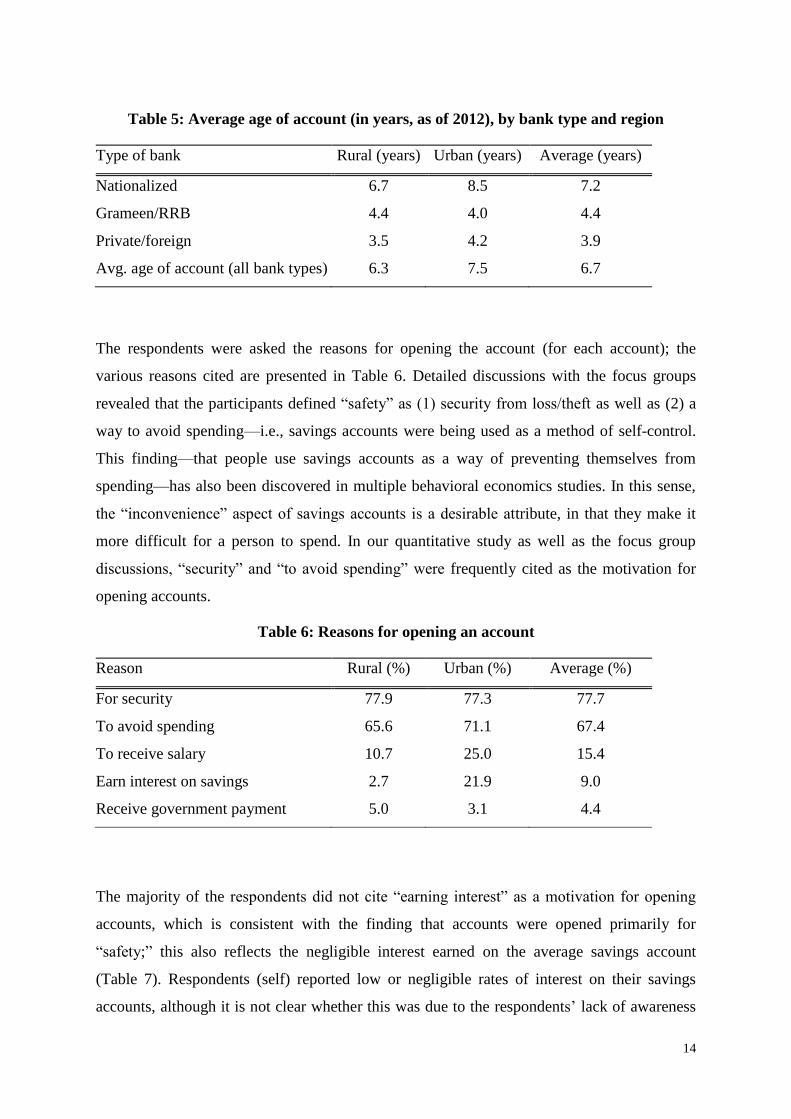
Table 5: Average age of account (in years, as of 2012), by bank type and region
Type of bank Rural (years) Urban (years) Average (years)
Nationalized 6.7 8.5 7.2
Grameen/RRB 4.4 4.0 4.4
Private/foreign 3.5 4.2 3.9
Avg. age of account (all bank types) 6.3 7.5 6.7
The respondents were asked the reasons for opening the account (for each account); the
various reasons cited are presented in Table 6. Detailed discussions with the focus groups
revealed that the participants defined ―safety‖ as (1) security from loss/theft as well as (2) a
way to avoid spending—i.e., savings accounts were being used as a method of self-control.
This finding—that people use savings accounts as a way of preventing themselves from
spending—has also been discovered in multiple behavioral economics studies. In this sense,
the ―inconvenience‖ aspect of savings accounts is a desirable attribute, in that they make it
more difficult for a person to spend. In our quantitative study as well as the focus group
discussions, ―security‖ and ―to avoid spending‖ were frequently cited as the motivation for
opening accounts.
Table 6: Reasons for opening an account
Reason Rural (%) Urban (%) Average (%)
For security 77.9 77.3 77.7
To avoid spending 65.6 71.1 67.4
To receive salary 10.7 25.0 15.4
Earn interest on savings 2.7 21.9 9.0
Receive government payment 5.0 3.1 4.4
The majority of the respondents did not cite ―earning interest‖ as a motivation for opening
accounts, which is consistent with the finding that accounts were opened primarily for
―safety;‖ this also reflects the negligible interest earned on the average savings account
(Table 7). Respondents (self) reported low or negligible rates of interest on their savings
accounts, although it is not clear whether this was due to the respondents‘ lack of awareness
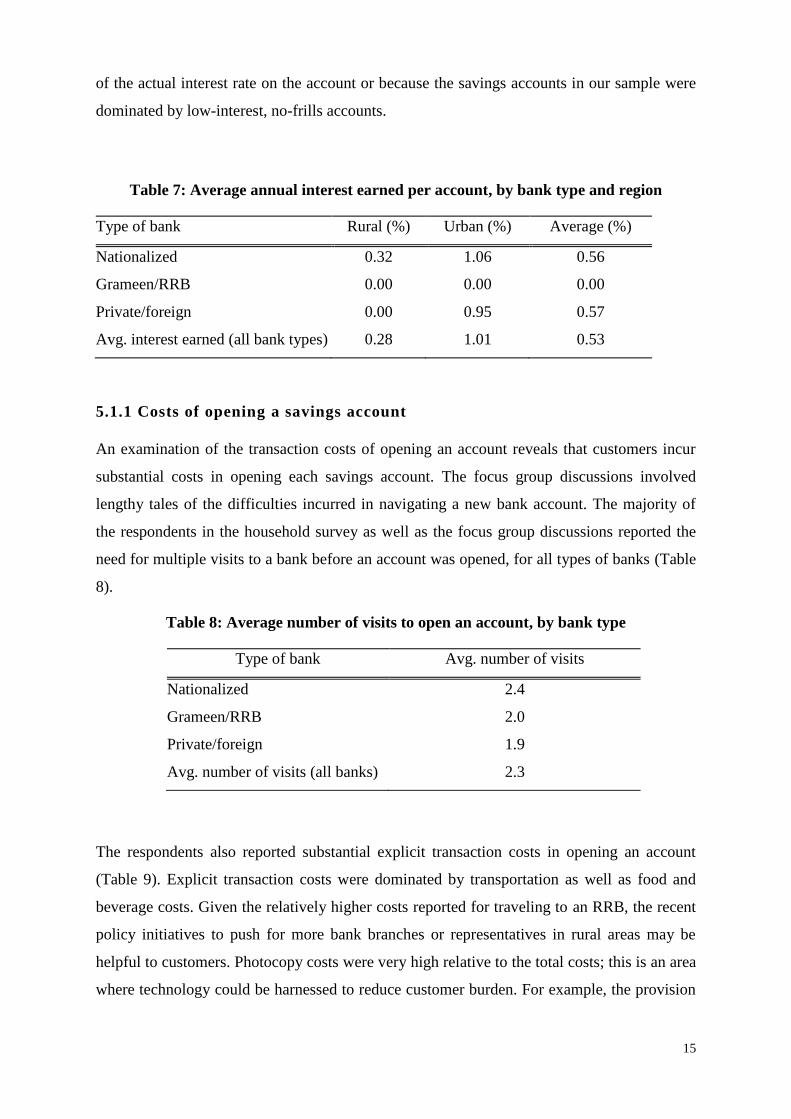
15
of the actual interest rate on the account or because the savings accounts in our sample were
dominated by low-interest, no-frills accounts.
Table 7: Average annual interest earned per account, by bank type and region
Type of bank Rural (%) Urban (%) Average (%)
Nationalized 0.32 1.06 0.56
Grameen/RRB 0.00 0.00 0.00
Private/foreign 0.00 0.95 0.57
Avg. interest earned (all bank types) 0.28 1.01 0.53
5.1.1 Costs of opening a savings account
An examination of the transaction costs of opening an account reveals that customers incur
substantial costs in opening each savings account. The focus group discussions involved
lengthy tales of the difficulties incurred in navigating a new bank account. The majority of
the respondents in the household survey as well as the focus group discussions reported the
need for multiple visits to a bank before an account was opened, for all types of banks (Table
8).
Table 8: Average number of visits to open an account, by bank type
Type of bank Avg. number of visits
Nationalized 2.4
Grameen/RRB 2.0
Private/foreign 1.9
Avg. number of visits (all banks) 2.3
The respondents also reported substantial explicit transaction costs in opening an account
(Table 9). Explicit transaction costs were dominated by transportation as well as food and
beverage costs. Given the relatively higher costs reported for traveling to an RRB, the recent
policy initiatives to push for more bank branches or representatives in rural areas may be
helpful to customers. Photocopy costs were very high relative to the total costs; this is an area
where technology could be harnessed to reduce customer burden. For example, the provision

16
of very basic photocopy instruments at financial institutions, or use of simple scanners, could
reduce or eliminate this cost to customers. Though private banks are widely perceived–
particularly by the participants in focus groups–to be more expensive than nationalized and
Grameen banks, total explicit costs were lowest for private and foreign banks, largely through
low cost of incidentals.
Table 9: Account opening cost (Rs) incurred by expense type and bank type
Expense Type Nationalized
(Rs.)
Grameen/RRB
(Rs.)
Private/foreign
(Rs.)
Transportation cost 54 91 52
Photocopy cost 45 37 43
Food, beverage, incidentals 27 62 16
Application processing fee 0 0 1
Revenue stamps/paper 1 3 2
Assistance for paperwork 1 0 0
Total 128 192 112
When examining implicit transaction costs—the opportunity cost of time spent to open a
bank account—we see that total predominantly involved time spent gathering the
documentation required to open an account; the time spent on documentation was highest for
private and foreign banks, as shown in Table 10.
Table 10: Time (hours) spent to open account, by bank type
Nationalized
(hours)
Grameen/RRB
(hours)
Private/foreign
(hours)
Avg. time
(hours)
Documentation 4.6 6.8 10.6 5.3
Waiting time 1.6 1.5 1.2 1.5
Travel time 1.4 1.2 1.5 1.4
Total 7.6 9.5 13.2 8.2
The opportunity costs associated with the time spent for documentation deserves further
examination, as this requires significant effort by a client attempting to open a new account.
For all banks, multiple forms of documentation of identity and residence were required.
Documentation requirements are higher in urban than in rural areas—more than half of the
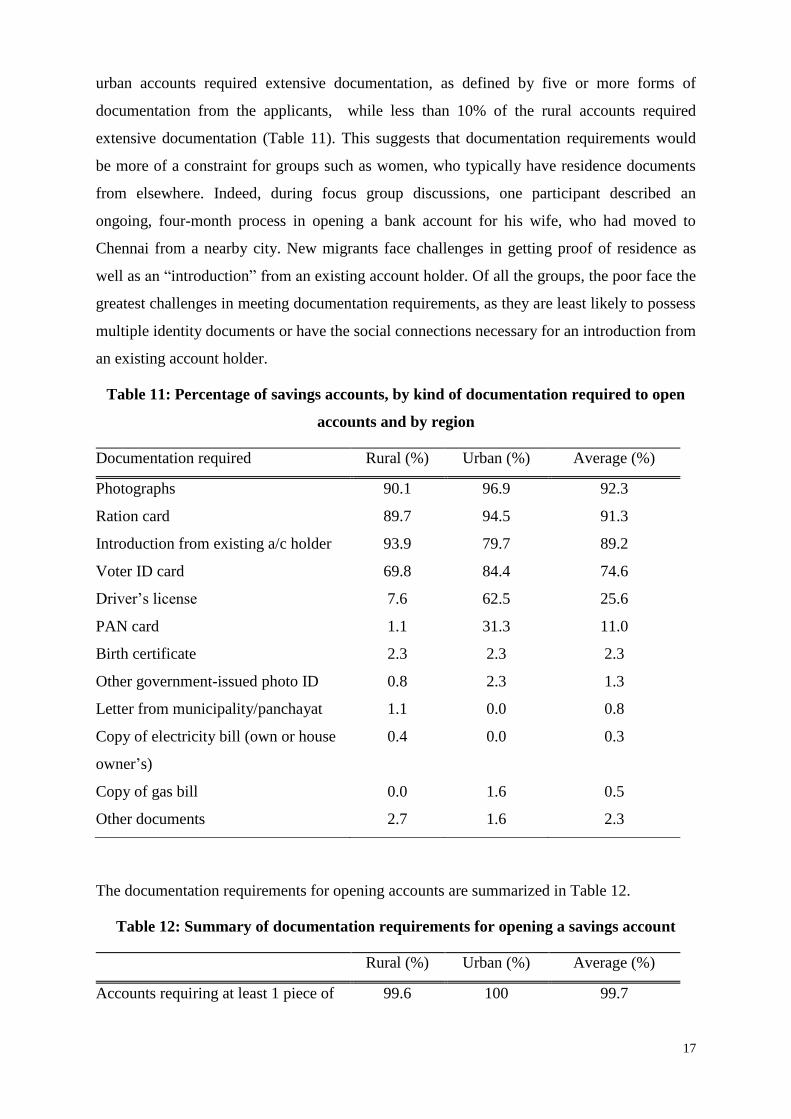
17
urban accounts required extensive documentation, as defined by five or more forms of
documentation from the applicants, while less than 10% of the rural accounts required
extensive documentation (Table 11). This suggests that documentation requirements would
be more of a constraint for groups such as women, who typically have residence documents
from elsewhere. Indeed, during focus group discussions, one participant described an
ongoing, four-month process in opening a bank account for his wife, who had moved to
Chennai from a nearby city. New migrants face challenges in getting proof of residence as
well as an ―introduction‖ from an existing account holder. Of all the groups, the poor face the
greatest challenges in meeting documentation requirements, as they are least likely to possess
multiple identity documents or have the social connections necessary for an introduction from
an existing account holder.
Table 11: Percentage of savings accounts, by kind of documentation required to open
accounts and by region
Documentation required Rural (%) Urban (%) Average (%)
Photographs 90.1 96.9 92.3
Ration card 89.7 94.5 91.3
Introduction from existing a/c holder 93.9 79.7 89.2
Voter ID card 69.8 84.4 74.6
Driver‘s license 7.6 62.5 25.6
PAN card 1.1 31.3 11.0
Birth certificate 2.3 2.3 2.3
Other government-issued photo ID 0.8 2.3 1.3
Letter from municipality/panchayat 1.1 0.0 0.8
Copy of electricity bill (own or house
owner‘s)
0.4 0.0 0.3
Copy of gas bill 0.0 1.6 0.5
Other documents 2.7 1.6 2.3
The documentation requirements for opening accounts are summarized in Table 12.
Table 12: Summary of documentation requirements for opening a savings account
Rural (%) Urban (%) Average (%)
Accounts requiring at least 1 piece of 99.6 100 99.7

18
documentation
Accounts requiring at least 3 pieces of
documentation
89.3 95.3 91.3
Accounts requiring at least 5 pieces of
documentation
8.0 54.7 23.3
The focus group discussions revealed that clients with experience at all types of banks felt
that despite the increased time requirements and other barriers, opening a private or foreign
bank account was a good move, in part because of the ―more polite staff‖ at these institutions
and also because of the faster processing time (as confirmed by our household surveys).
Table 13 presents the data for one indicator—the delay (in days) between when the bank
guaranteed the account would be opened and when the account was really opened; private
banks performed better compared to the other bank types in this regard.
Table 13: Delay (in days) between when account was promised to be opened and when it
was actually opened, by bank type
Nationalized
(days)
Grameen/RRB
(days)
Private/foreign
(days)
Avg. delay
(days)
Delay per account 3.3 0.2 (1.8) 2.6
5.1.2 Costs of operating a savings account
In addition to the transaction costs of opening an account, individuals were asked about their
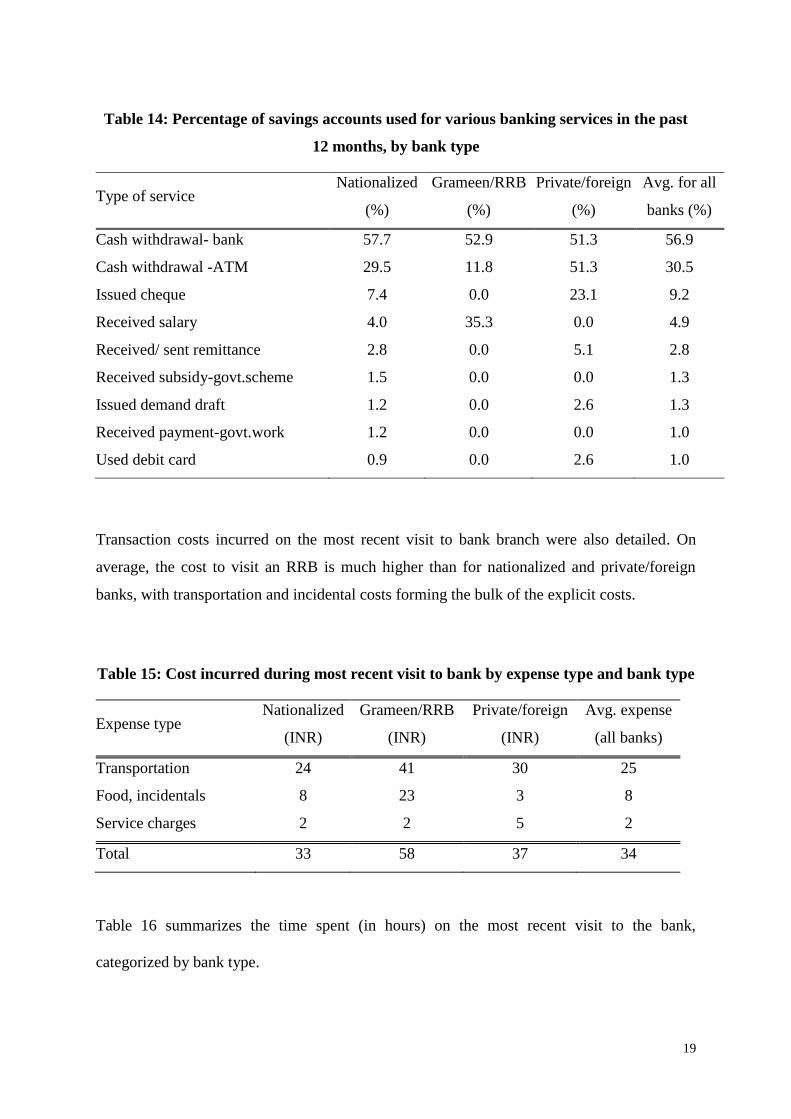
current use of each account. Of the various services presented in Table 14, the respondents
were asked which services they had used for their accounts in the previous 12 months. Cash
withdrawal from banks and ATMs were the most commonly used services; however, for
nationalized and Grameen banks, withdrawals were done at the branch level more often. In
the focus group discussions, it was widely agreed that ATMs were a convenient way to make
deposits and withdrawals. However, the unreliability of ATMs was a frequent item of
discussion; ATMs lacking cash was also commonly mentioned. Mechanical problems—
where the client attempted to withdraw cash and cash was not dispensed by the machine, but
the amount was debited to the customer‘s account—were heatedly discussed, with several
participants stating that it took ―months‖ for the bank to correct such errors.
19
Table 14: Percentage of savings accounts used for various banking services in the past
12 months, by bank type
Type of service Nationalized
(%)
Grameen/RRB
(%)
Private/foreign
(%)
Avg. for all
banks (%)
Cash withdrawal- bank 57.7 52.9 51.3 56.9
Cash withdrawal -ATM 29.5 11.8 51.3 30.5
Issued cheque 7.4 0.0 23.1 9.2
Received salary 4.0 35.3 0.0 4.9
Received/ sent remittance 2.8 0.0 5.1 2.8
Received subsidy-govt.scheme 1.5 0.0 0.0 1.3
Issued demand draft 1.2 0.0 2.6 1.3
Received payment-govt.work 1.2 0.0 0.0 1.0
Used debit card 0.9 0.0 2.6 1.0
Transaction costs incurred on the most recent visit to bank branch were also detailed. On
average, the cost to visit an RRB is much higher than for nationalized and private/foreign
banks, with transportation and incidental costs forming the bulk of the explicit costs.
Table 15: Cost incurred during most recent visit to bank by expense type and bank type
Expense type Nationalized
(INR)
Grameen/RRB
(INR)
Private/foreign
(INR)
Avg. expense
(all banks)
Transportation 24 41 30 25
Food, incidentals 8 23 3 8
Service charges 2 2 5 2
Total 33 58 37 34
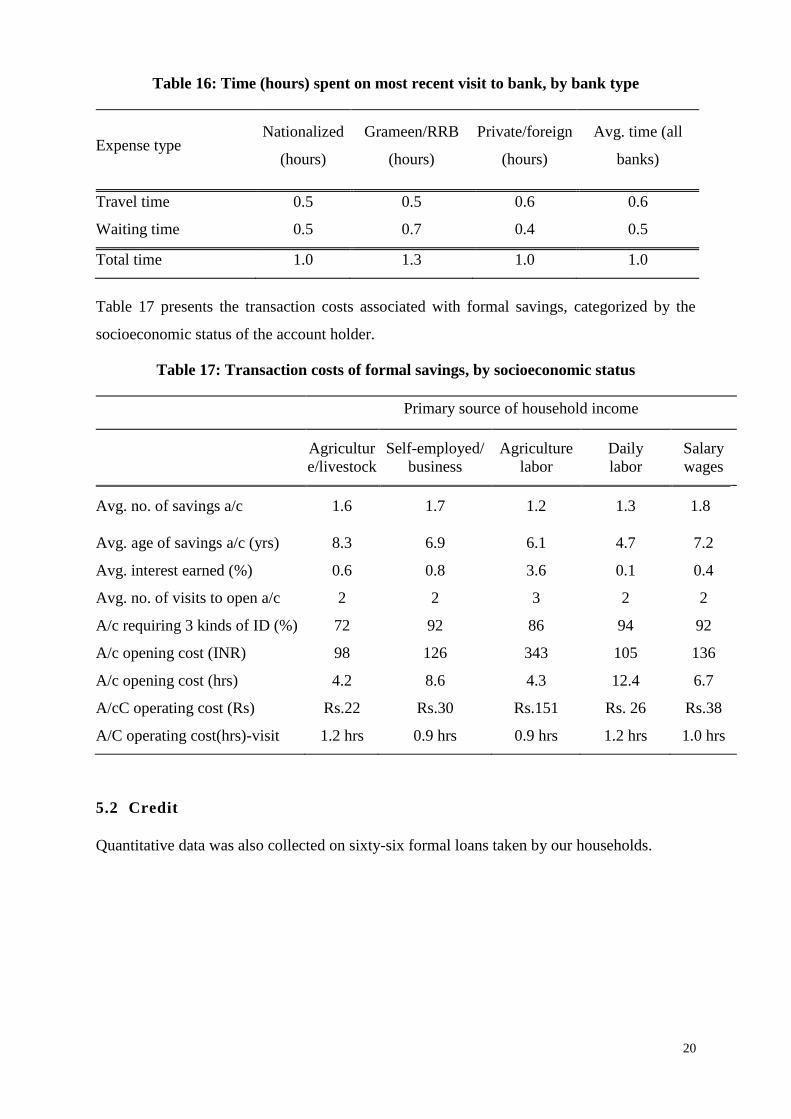
Table 16 summarizes the time spent (in hours) on the most recent visit to the bank,
categorized by bank type.
20
Table 16: Time (hours) spent on most recent visit to bank, by bank type
Expense type Nationalized
(hours)
Grameen/RRB
(hours)
Private/foreign
(hours)
Avg. time (all
banks)
Travel time 0.5 0.5 0.6 0.6
Waiting time 0.5 0.7 0.4 0.5
Total time 1.0 1.3 1.0 1.0
Table 17 presents the transaction costs associated with formal savings, categorized by the
socioeconomic status of the account holder.
Table 17: Transaction costs of formal savings, by socioeconomic status
Primary source of household income
Agricultur
e/livestock
Self-employed/
business
Agriculture
labor
Daily
labor
Salary
wages
Avg. no. of savings a/c 1.6 1.7 1.2 1.3 1.8
Avg. age of savings a/c (yrs) 8.3 6.9 6.1 4.7 7.2
Avg. interest earned (%) 0.6 0.8 3.6 0.1 0.4
Avg. no. of visits to open a/c 2 2 3 2 2
A/c requiring 3 kinds of ID (%) 72 92 86 94 92
A/c opening cost (INR) 98 126 343 105 136
A/c opening cost (hrs) 4.2 8.6 4.3 12.4 6.7
A/cC operating cost (Rs) Rs.22 Rs.30 Rs.151 Rs. 26 Rs.38
A/C operating cost(hrs)-visit 1.2 hrs 0.9 hrs 0.9 hrs 1.2 hrs 1.0 hrs
5.2 Credit
Quantitative data was also collected on sixty-six formal loans taken by our households.

21
Table 18: Loan Characteristics
Rural Urban Average
Average age of the loan (years) 1.7 2.6 1.9
Average loan tenure (years) 2.4 1.2 2.3
Effective annual interest rate (%) 11.0 12.1 11.2
Difference between loan amount
requested and amount given (Rs.)
8,749
5,000
8,011
As noted below, major purposes of loans across both rural and urban areas included
education, home construction/improvement, or starting/expanding a business.
Table 19: Percentage of loans by primary purpose for taking the loan, by region
Purpose of loan Rural (%) Urban (%) Average (%)
Education 20.8 38.5 24.2
Home construction/improvement 18.9 15.4 18.2
Jewelry 17 0 13.6
Start or expand business 9.4 23.1 12.1
Agriculture/Livestock working capital 7.5 0 6.1
Repay debt 3.8 0 3
Festival/function 3.8 0 3
Emergency/temporary difficulty 1.9 7.7 3
Land purchase 1.9 0 1.5
Household durables 1.9 0 1.5
Other 13.2 15.4 13.6
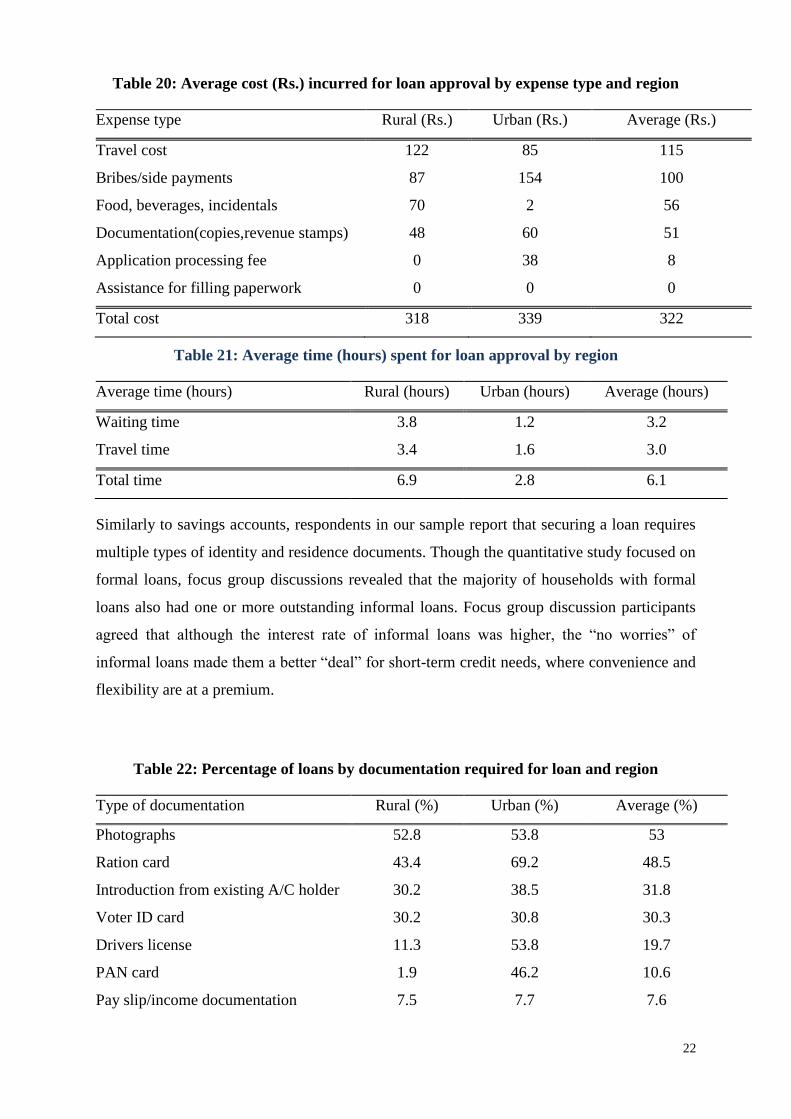
Transaction costs of credit directly impact the effective interest rate. Calculating the effective
rate of interest requires deducting transaction costs from the total stated amount of the loan.
As with savings accounts, our sample households report significant explicit and implicit costs
in securing a formal loan.
22
Table 20: Average cost (Rs.) incurred for loan approval by expense type and region
Expense type Rural (Rs.) Urban (Rs.) Average (Rs.)
Travel cost 122 85 115
Bribes/side payments 87 154 100
Food, beverages, incidentals 70 2 56
Documentation(copies,revenue stamps) 48 60 51
Application processing fee 0 38 8
Assistance for filling paperwork 0 0 0
Total cost 318 339 322
Table 21: Average time (hours) spent for loan approval by region
Average time (hours) Rural (hours) Urban (hours) Average (hours)
Waiting time 3.8 1.2 3.2
Travel time 3.4 1.6 3.0
Total time 6.9 2.8 6.1
Similarly to savings accounts, respondents in our sample report that securing a loan requires
multiple types of identity and residence documents. Though the quantitative study focused on
formal loans, focus group discussions revealed that the majority of households with formal
loans also had one or more outstanding informal loans. Focus group discussion participants
agreed that although the interest rate of informal loans was higher, the ―no worries‖ of
informal loans made them a better ―deal‖ for short-term credit needs, where convenience and
flexibility are at a premium.
Table 22: Percentage of loans by documentation required for loan and region
Type of documentation Rural (%) Urban (%) Average (%)
Photographs 52.8 53.8 53
Ration card 43.4 69.2 48.5
Introduction from existing A/C holder 30.2 38.5 31.8
Voter ID card 30.2 30.8 30.3
Drivers license 11.3 53.8 19.7
PAN card 1.9 46.2 10.6
Pay slip/income documentation 7.5 7.7 7.6
23
Birth certificate 1.9 0 1.5
Electricity bill 0 0 0
Gas bill 0 0 0
Confirmation from city/panchayat 0 0 0
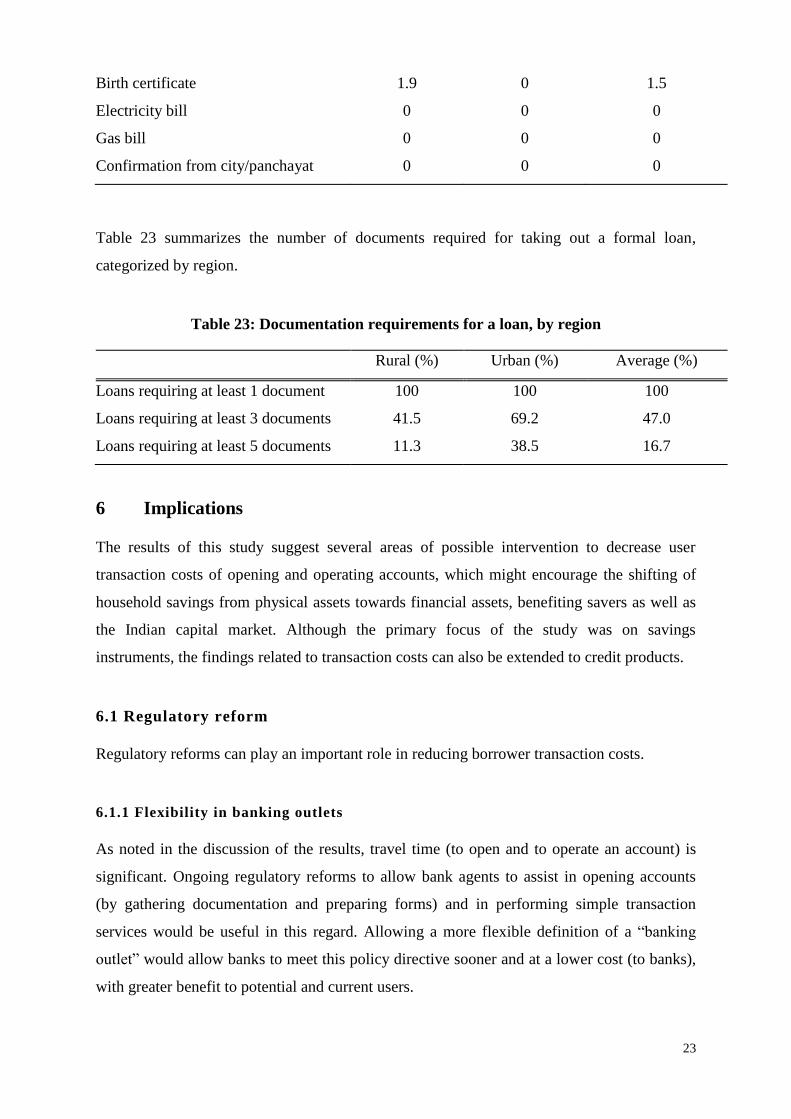
Table 23 summarizes the number of documents required for taking out a formal loan,
categorized by region.
Table 23: Documentation requirements for a loan, by region
Rural (%) Urban (%) Average (%)
Loans requiring at least 1 document 100 100 100
Loans requiring at least 3 documents 41.5 69.2 47.0
Loans requiring at least 5 documents 11.3 38.5 16.7
6 Implications
The results of this study suggest several areas of possible intervention to decrease user
transaction costs of opening and operating accounts, which might encourage the shifting of
household savings from physical assets towards financial assets, benefiting savers as well as
the Indian capital market. Although the primary focus of the study was on savings
instruments, the findings related to transaction costs can also be extended to credit products.
6.1 Regulatory reform
Regulatory reforms can play an important role in reducing borrower transaction costs.
6.1.1 Flexibility in banking outlets
As noted in the discussion of the results, travel time (to open and to operate an account) is
significant. Ongoing regulatory reforms to allow bank agents to assist in opening accounts
(by gathering documentation and preparing forms) and in performing simple transaction
services would be useful in this regard. Allowing a more flexible definition of a ―banking
outlet‖ would allow banks to meet this policy directive sooner and at a lower cost (to banks),
with greater benefit to potential and current users.

24
6.1.2 Reducing documentation requirements
Even assuming a policy target of a complete banking outlet in every village and
neighborhood, the results of the study suggest that the documentation requirements may pose
a barrier to financial access for certain groups—particularly for women, low-income
individuals, and new migrants. Even for those individuals who are able to meet the
documentation requirements, the cost associated with the time assembling documentation as
well as costs for photocopies is a major driver of high transaction costs of opening a new
account. Policy changes to reduce and/or streamline documentation requirements could
become a major driver of financial inclusion. Even in the absence of a policy change to
reduce the number of documents required, a simple technology like low-cost, low-resolution
copying or scanning devices at a banking outlet would be useful in reducing transaction cost
associated with opening an account or getting approval for a loan.
6.1.3 Allowing greater savings product innovation
Given the demand for savings among customers as well as the tendency of customers to view
barriers to withdrawal as a positive feature, policy reform to encourage product innovations
and experimentation (discussed below) would be very helpful.
6.2 Use of technology
As mentioned earlier, even simple reforms such as mandating a low-cost copying device for
each banking outlet would reduce the transaction costs of access. The increased presence of
ATMs would reduce transaction costs (for providers as well as users) of operating existing
accounts, particularly those involving low-value, high-volume deposits and withdrawals. It is
important to note that care must be taken to ensure the reliability of technologies such as
ATMs. As was discussed, the customers‘ satisfaction with their financial providers is quickly
eroded when technologies fail. Moreover, the costs of such failure are passed on to
customers; for example, customers face a significant time burden in terms of the opportunity
cost of lost wages while attempting to rectify errors caused by ATM failures.

25
6.3 Product design
One of the more interesting implications of this study is in the area of product design. In line
with other work, this study suggests that some individuals highly value the illiquid features of
savings accounts. Customers view certain types of transaction costs—such as barriers to
withdrawal—as desirable product features; this raises the question as to whether or not
transaction costs can be tailored to account for household preferences. Our research suggests
that there is scope for new savings products where the transaction costs to open an account
(or take up a product) and to deposit savings are low or subsidized, while the cost of
withdrawing savings are imposed on the customer. Product innovations in other countries
have proven to be successful, although designing new products that meet the regulatory
requirements would be a challenge. Product design innovations, together with regulatory
support and the utilization of appropriate technologies, can be expected to trigger a shift in
savings from physical to financial assets, bringing savers a greater return on their savings as
well as benefiting Indian capital markets.
7. Limitations of the study and suggestions for further research
7.1 Limitations
First, due to the difficulties in measuring financial access, this study examined only the
transaction costs faced by households that were currently using savings services, loans, or
both. Our analysis was based on the broad assumptions that the transaction costs faced by
user households would be similar to those faced by non-user households and that transaction
costs partly explained the lack of demand for financial services by non-user households.
Although we believe these assumptions to be reasonable, both deserve further examination.
In addition (as mentioned in Section 4), this study was not designed to be a representative
survey, and its findings cannot be generalized.
Second, our methodology for quantifying transaction costs quite likely understated the
opportunity cost of the user‘s time. Early in the data collection process, it became clear that
the opportunity cost of wages lost during financial transactions dominated the discussions on
transactions costs. Quantifying the exact transaction costs requires income and wage
information, which is notoriously difficult to capture. The existing methodologies to quantify
the opportunity cost of time (such as the one used by Ahmed, 1989) used crude measures of
26
per-day earnings (such as average daily wage in the village). However, if users increasingly
report that ―convenience‖ is the most important aspect in a financial service, it is critical to
account for wage and income differences of individual users in calculating the opportunity
cost of lost wages. This methodology should be improved, and is an area for further research.
Third, due to policy changes in the documentation requirements for opening accounts and due
to the fact that the majority of the savings accounts in our study were opened prior to these
changes in documentation requirements, our findings could be overstating the transaction
costs associated with opening an account today. Ideally, we would have examined the
difference in costs of opening accounts before and after the policy changes, but we lacked the
sample size to support this analysis.
7.2 Areas of further research
This study raises several areas of possible research, three of which were highlighted in the
previous section—examining the differences between user and non-user households,
methodological improvements in calculating opportunity cost of lost wages, and measuring
the difference between documentation costs to open an account before and after a policy
change.
However, we believe that a supply-side survey detailing several dozen formal and informal
savings products in Tamil Nadu—with a focus on product design features and commitment
mechanisms—holds the most exciting potential for further research; this would complement
the demand-side data collected and analyzed here. During our qualitative interviews, we
heard reports of several interesting savings products, but were unable to determine the exact
product features as we were limited by the respondents‘ own knowledge. For example, a
focus group in one village told us of a popular scheme organized by a local bank, in which a
bank agent from the nearby town visited the village once a week to collect cash deposits.
Account-holders were free to deposit any amount above a fixed minimum of INR 100. To
withdraw money, however, the villagers had to visit the bank branch in person, which
imposed a degree of control on impulse spending by the account holders and reduced costs
for the bank. Several of the focus group members participated in this savings scheme and
were enthusiastic about the product. However, adequately documenting this product and

27
others like it would require visits to the service providers. The supply-side survey could also
be extended to several key non-financial assets.

28
References
1. Adams, D.W. and Nehman, G.I. ―Borrowing costs and the demand for rural credit,‖
Journal for Development Studies (Vol. 15: No. 2), 1979, pp.165-176.
2. Ahmed, Z. U. "Effective Costs of Rural Loans in Bangladesh," World Development
(Vol. 17:No. 3), 1989, pp. 357 - 363.
3. Aportela, F. "Effects of Financial Access on Savings by Low-Income People," Banco
de Mexico, Research Department, 1999.
4. Ashraf, N., Karlan, D. and Yin, W. "Typing Odysseus to the Mast: Evidence from a
Commitment Savings Product in the Philippines," The Quarterly Journal of
Economics, 2006a, pp. 635 - 672.
5. Ashraf, N., Karlan, D. and Yin, W. "Deposit Collectors," Innovations for Poverty
Action, Financial Access Initiative (Vol. 6, Issue 2), 2006b.
6. Banerjee, A. V. and Mullainathan, S. "The Shape of Temptation: Implications for the
Economic Lives of the Poor," 2010.
7. Beshears, J., Choi, J. J., Laibson, D. and Madrian, B. C. "Self Control and Liquidity:
How to Design a Commitment Contract," 2011.
8. Burgess, R., Pande, R. and Wong, G. "Banking for the Poor: Evidence from India,"
2004.
9. Collins, D., Morduch, J., Rutherford, S. and Ruthven, O. Portfolios of the Poor.,
Princeton University Press, 2009.
10. Cuevas, C. E. "Transaction Costs of Borrowing and Credit Rationing in Developing
Countries," Economics and Sociology, The Ohio State University (Occasional Paper
No. 1470), 1988.
11. Dehem, T. and Hudon, M. "Microfinance from a Client-perspective: An Empirical
Enquiry on Transaction Costs in Urban and Rural India", Second European Research
Conference in Microfinance, Groningen, The Netherlands, 2011.
12. Demirguc-Kunt, A. and Klapper, L. "Measuring Financial Inclusion: The Global
Findex Database," Development Research Group, The World Bank (Policy Research
Working Paper 6025), 2012.
13. Gopinath, S., Oliver, J. and Tannirkulam, A. "Putting Money in Motion: How Much
Do Migrants Pay for Domestic Transfers?" Centre for Microfinance, IFMR`
Research, 2010, pp. 1 - 25.
29
14. Gonzalez-Vega, C. On the Iron Law of Interest Rate Restrictions: Agricultural Credit
Policies in Costa Rica and Less Developed Countries, Unpublished PhD dissertation,
1976, (Palo Alto, CA: Stanford University, Department of Economics)
15. de Guia-Abiad, V. "Borrower Transaction Costs and Credit Rationing in Rural
Financial Markets: The Philippine Case," The Developing Economies (Vol. 31:No.
2), 1993.
16. Guirkinger, C. "Understanding the Coexistence of Formal and Informal Credit
Markets in Piura, Peru," Center for Research in Economic Development, University
of Namur, Belgium, 2006.
17. Hosseini, S. S., Khaledi, M., Ghorbani, M. and Brewin, D. "An Analysis of
Transaction Costs of Obtaining Credit in Rural Iran," J. Agr. Sci. Tech. (Vol. 14),
2012, pp. 243 - 256.
18. Kaboski, J. P. and Townsend, R. M. "The Impacts of Credit on Village Economies,"
2007.
19. Karduck, S. and Seibel, H. D. "Transaction Costs of Self-Help Groups: A Study of
NABARD‘s SHG Banking Programme in India," 2004.
20. Loewenstein, G. and Thaler, R. H. "Anomalies: intertemporal choice," The Journal of
Economic Perspectives (Vol. 3:No. 4), 1989, pp. 181 - 193.
21. Nagarajan, H. K., Sethi, D., Pradhan, K. C., Mukherjee, S. and K. Singh, S. "How
Households Save and Invest : Evidence from NCAER Household Survey," National
Council of Applied Economic Research, 2011.
22. Nwuke, K. "Transactions Cost and Savings Mobilization: Evidence from Six Sub-
Saharan African Countries", UNECA, 1997.
23. Ramji, M. "Financial Inclusion in Gulbarga: Finding Usage in Access," Centre for
Microfinance, IFMR Research (Working Paper Series No. 26), 2009.
24. Rangarajan, C. "Report of the Committee on Financial Inclusion," 2009.
25. Rutherford, S. "The Poor and their Money," Institute for Development Policy and
Management, University of Manchester, 1999.
26. Swamy, V. and Tulasimala, B. "Financial Intermediaries and Economic Development:
Evidence on Transaction Costs of Borrowing by the Poor," International Journal of
Banking and Finance (Vol. 8:No. 3), 2011.
27. "Yale Economic Growth Center - CMF Tamil Nadu Socioeconomic Mobility
Survey", 2009.

30
28. "Finance For All - Policies and Pitfalls in Expanding Access," World Bank Policy
Research Report, 2008.

31
About Institute for Financial Management and Research
The Institute for Financial Management and Research (IFMR), Chennai, is one of India‘s most prestigious
business schools and academic institutions. Established in 1970, it has been recognized as an Institution of
National Importance by the Ministry of Finance. Since its inception, IFMR‘s mission has been to contribute to
the growth and development efforts in India with an emphasis on finance and research. The IFMR also has
several key partnerships with some of the leading academic institutions worldwide and offers a stimulating and
world-class environment to faculty and students alike.
About National Stock Exchange of India
The National Stock Exchange (NSE) is India's leading stock exchange covering various cities and towns across
the country. The NSE was set up by leading institutions to provide a modern, fully-automated, screen-based
trading system with national reach. The Exchange has brought about unparalleled transparency, speed and
efficiency, safety, and market integrity. It has set up facilities that serve as a model for the securities industry in
terms of systems, practices, and procedures. The NSE has played a catalytic role in reforming the Indian
securities market in terms of microstructure, market practices, and trading volumes. The market today uses
state-of-the-art information technology to provide an efficient and transparent trading, clearing, and settlement
mechanism, and has witnessed several innovations in products and services, namely, the demutualization of
stock exchange governance, the use of screen-based trading, the compression of settlement cycles, the
dematerialization and electronic transfer of securities, securities lending and borrowing, the professionalization
of trading members, the use of fine-tuned risk management systems, the emergence of clearing corporations to
assume counterparty risks, the marketing of debt and derivative instruments, and the intensive use of
information technology.