Embed Size (px)
Citation preview
NRL RESEARCH FROM TPARC/TCS-08
C. Reynolds, J. Doyle, R. Langland, J. Goerss, J. McLay and E. SerraMarine Meteorology Division, Naval Research Laboratory, Monterey, CA
A. Snyder and Z. Pu, University of Utah, Salt Lake City, UtahC. Velden and H. Berger, CIMSS, University of Wisconsin, Madison, WI.
Thanks Very Much to JMA and OPRF
OUTLINE:
Real-time Products
Nuri Data Denial Experiments
NOGAPS Ensembles Experiments
COAMPS Adjoint Experiments
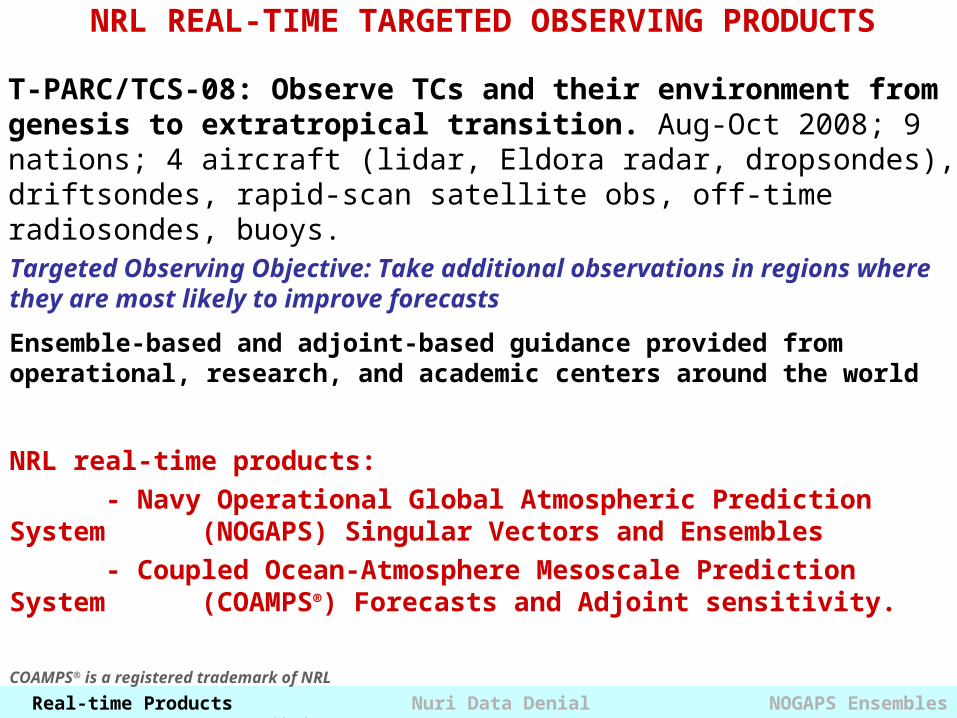
NRL REAL-TIME TARGETED OBSERVING PRODUCTS
T-PARC/TCS-08: Observe TCs and their environment from genesis to extratropical transition. Aug-Oct 2008; 9 nations; 4 aircraft (lidar, Eldora radar, dropsondes), driftsondes, rapid-scan satellite obs, off-time radiosondes, buoys.
Targeted Observing Objective: Take additional observations in regions where they are most likely to improve forecasts
Ensemble-based and adjoint-based guidance provided from operational, research, and academic centers around the world
NRL real-time products:
- Navy Operational Global Atmospheric Prediction System (NOGAPS) Singular Vectors and Ensembles
- Coupled Ocean-Atmosphere Mesoscale Prediction System (COAMPS®) Forecasts and Adjoint sensitivity.
Real-time Products Nuri Data Denial NOGAPS Ensembles COAMPS Adjoint
COAMPS® is a registered trademark of NRL
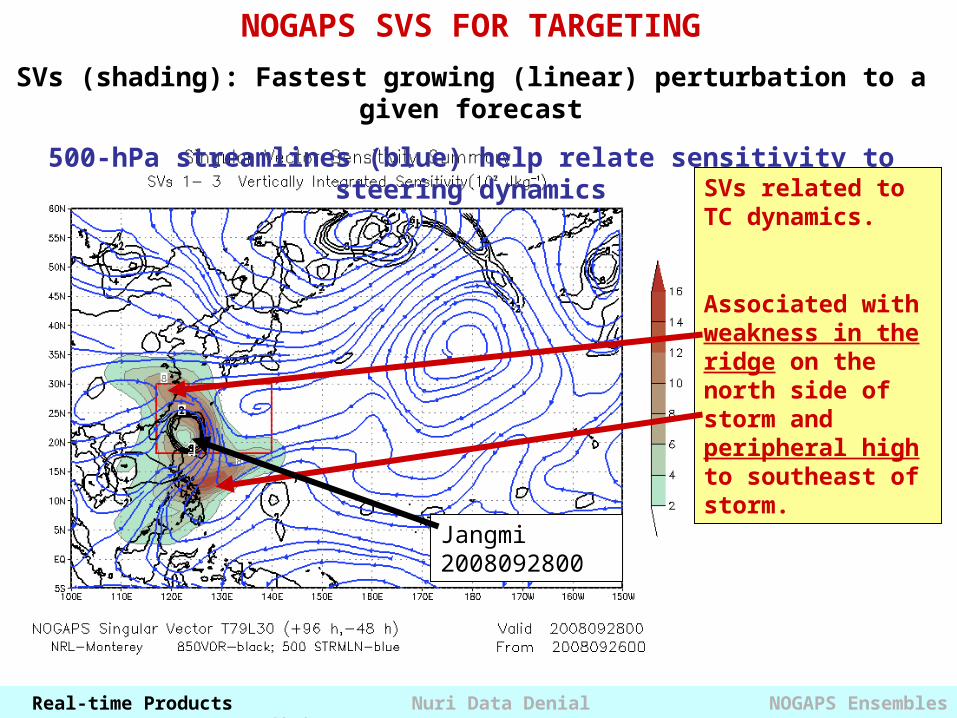
NOGAPS SVS FOR TARGETING
SVs (shading): Fastest growing (linear) perturbation to a given forecast
500-hPa streamlines (blue) help relate sensitivity to steering dynamics
SVs related to TC dynamics.
Associated with weakness in the ridge on the north side of storm and peripheral high to southeast of storm.
Real-time Products Nuri Data Denial NOGAPS Ensembles COAMPS Adjoint
Jangmi 2008092800
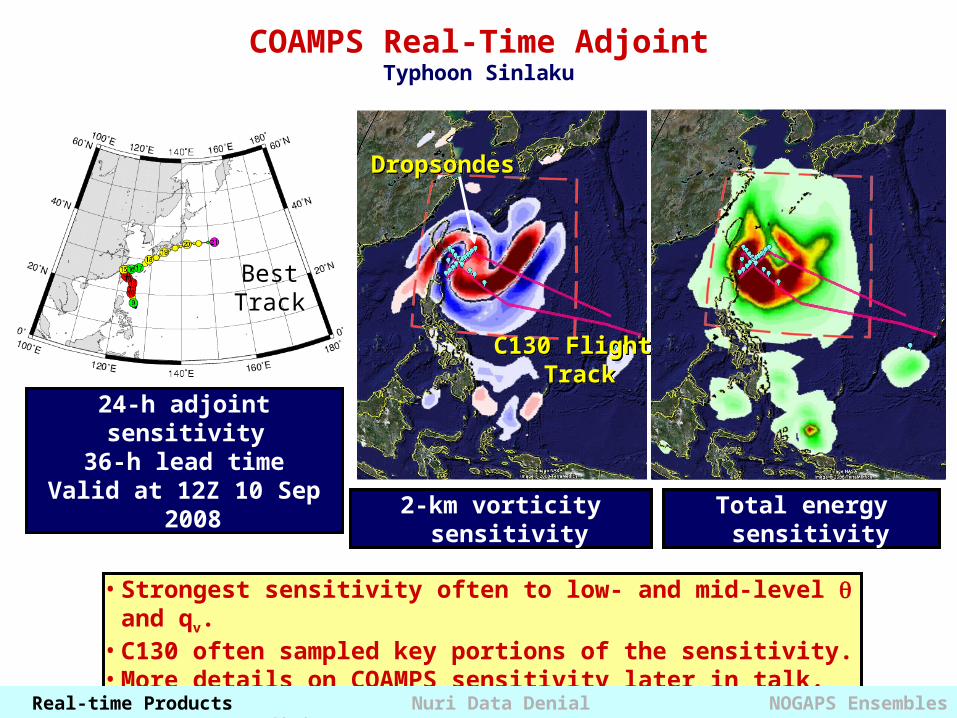
• Strongest sensitivity often to low- and mid-level and qv.• C130 often sampled key portions of the sensitivity.• More details on COAMPS sensitivity later in talk.
24-h adjoint sensitivity 36-h lead time
Valid at 12Z 10 Sep 2008
2-km vorticity sensitivity Total energy sensitivity
C130 Flight Track
C130 Flight Track
DropsondesDropsondes
Best Track
COAMPS Real-Time AdjointTyphoon Sinlaku
Real-time Products Nuri Data Denial NOGAPS Ensembles COAMPS Adjoint
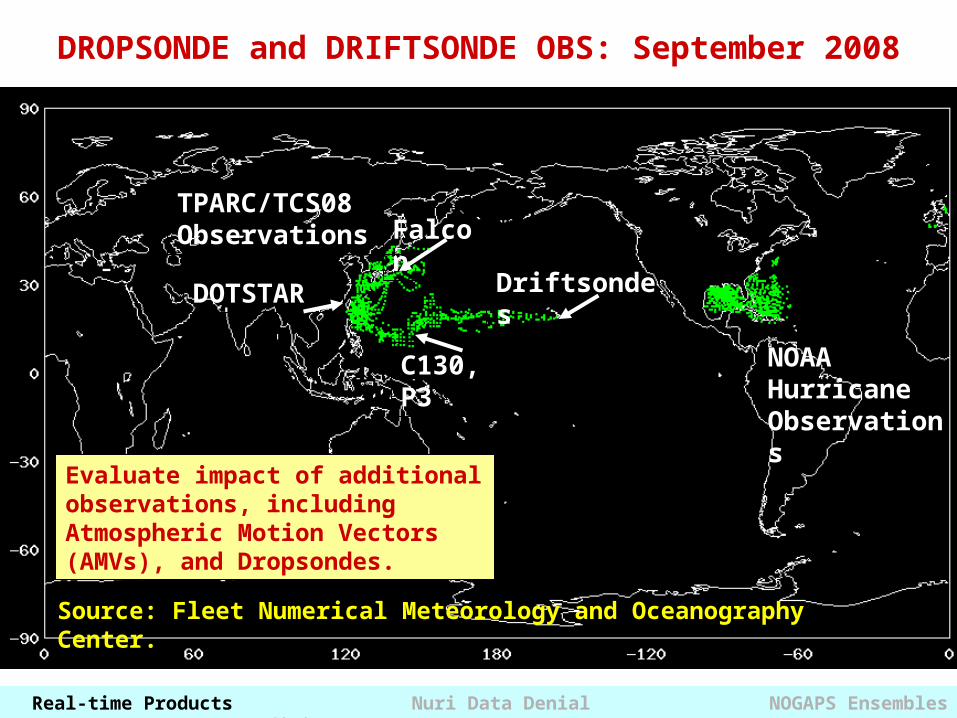
DROPSONDE and DRIFTSONDE OBS: September 2008
TPARC/TCS08 Observations
Source: Fleet Numerical Meteorology and Oceanography Center.
NOAA Hurricane Observations
DOTSTAR
Falcon
C130, P3
Driftsondes
Real-time Products Nuri Data Denial NOGAPS Ensembles COAMPS Adjoint
Evaluate impact of additional observations, including Atmospheric Motion Vectors (AMVs), and Dropsondes.
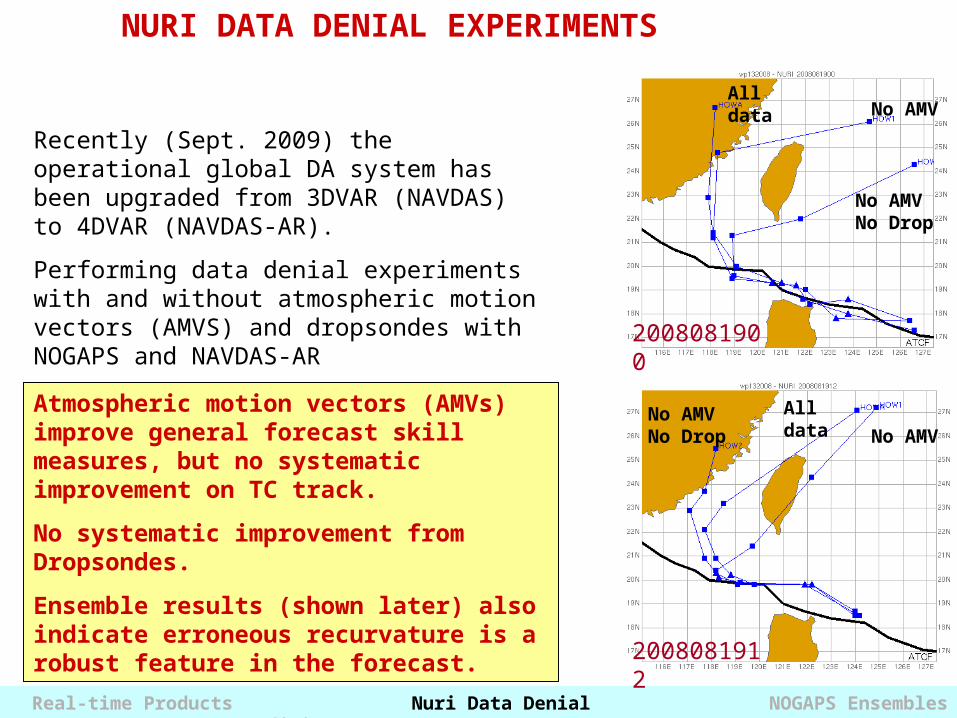
Recently (Sept. 2009) the operational global DA system has been upgraded from 3DVAR (NAVDAS) to 4DVAR (NAVDAS-AR).
Performing data denial experiments with and without atmospheric motion vectors (AMVS) and dropsondes with NOGAPS and NAVDAS-AR
Real-time Products Nuri Data Denial NOGAPS Ensembles COAMPS Adjoint
NURI DATA DENIAL EXPERIMENTS
Atmospheric motion vectors (AMVs) improve general forecast skill measures, but no systematic improvement on TC track.
No systematic improvement from Dropsondes.
Ensemble results (shown later) also indicate erroneous recurvature is a robust feature in the forecast.
All dataNo AMV
No AMV No Drop
2008081900
All data
No AMVNo AMV No Drop
2008081912
Verifying
Analysis
With Drops
No AMVs
With Drops
With AMVs
No Drops
No AMVs
Real-time Products Nuri Data Denial NOGAPS Ensembles COAMPS Adjoint
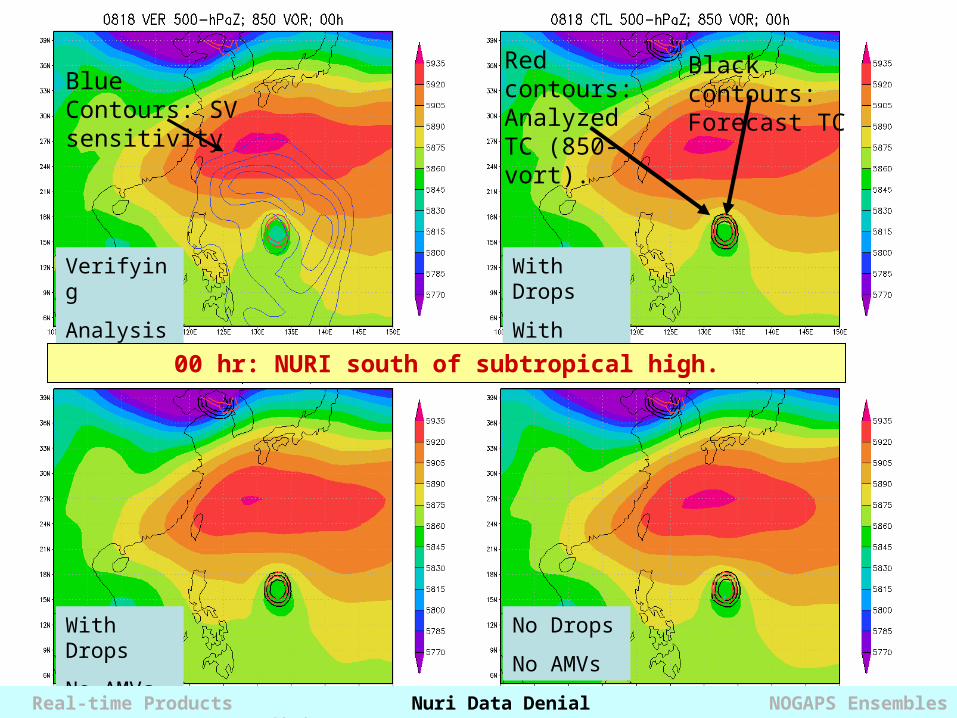
00 hr: NURI south of subtropical high.
Black contours: Forecast TCBlue Contours:
SV sensitivity
Red contours: Analyzed TC (850-vort).
Verifying
Analysis
With Drops
No AMVs
With Drops
With AMVs
No Drops
No AMVs
Real-time Products Nuri Data Denial NOGAPS Ensembles COAMPS Adjoint
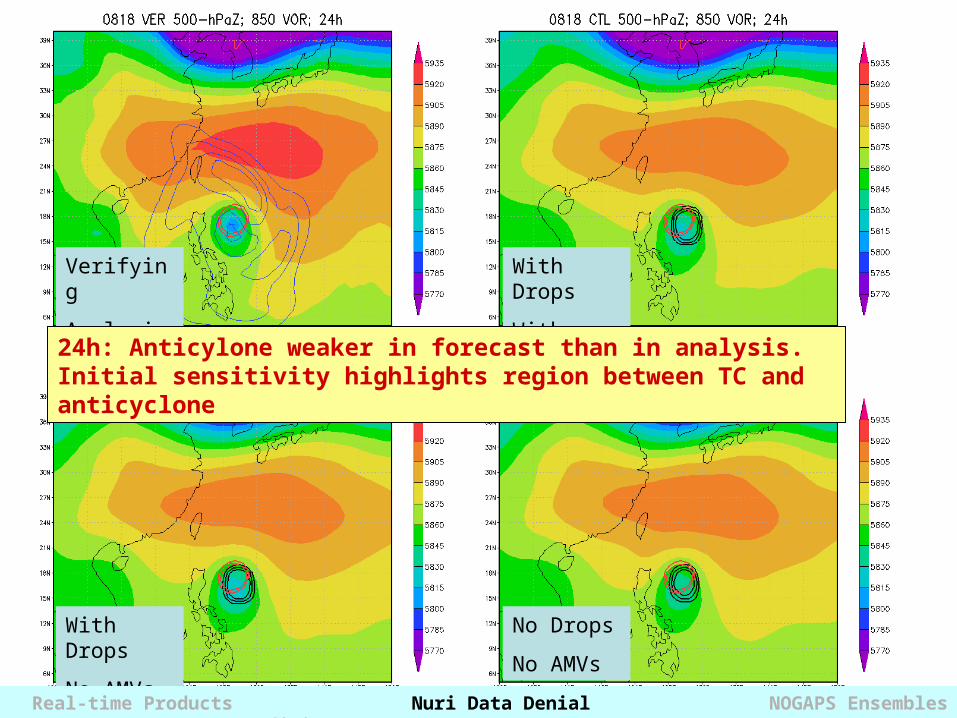
24h: Anticylone weaker in forecast than in analysis. Initial sensitivity highlights region between TC and anticyclone
Verifying
Analysis
With Drops
No AMVs
With Drops
With AMVs
No Drops
No AMVs
Real-time Products Nuri Data Denial NOGAPS Ensembles COAMPS Adjoint
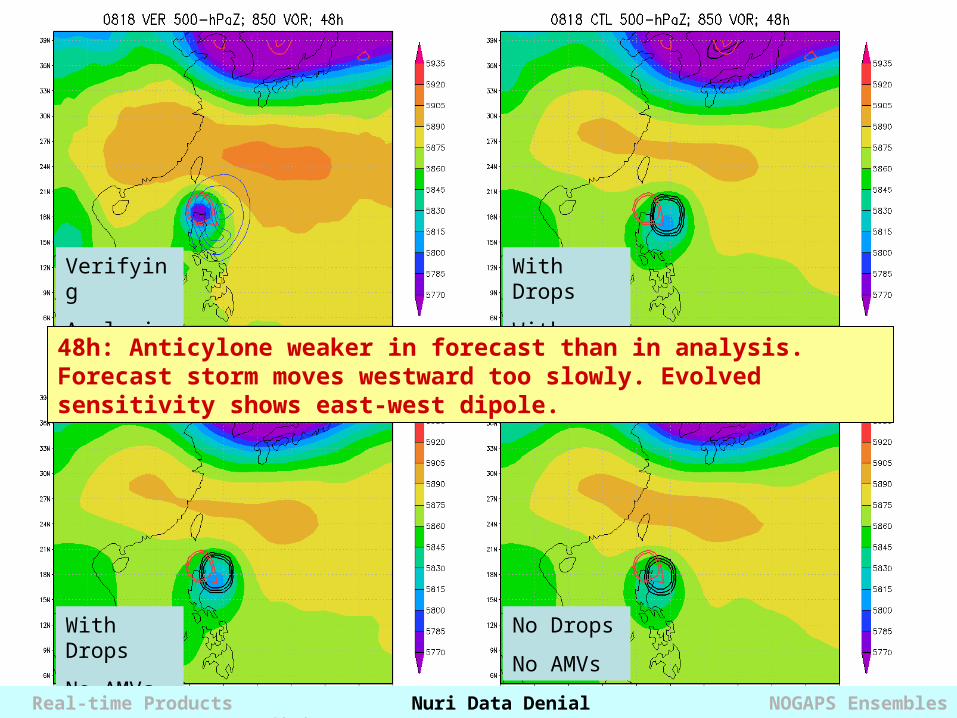
48h: Anticylone weaker in forecast than in analysis. Forecast storm moves westward too slowly. Evolved sensitivity shows east-west dipole.
Verifying
Analysis
With Drops
No AMVs
With Drops
With AMVs
No Drops
No AMVs
Real-time Products Nuri Data Denial NOGAPS Ensembles COAMPS Adjoint
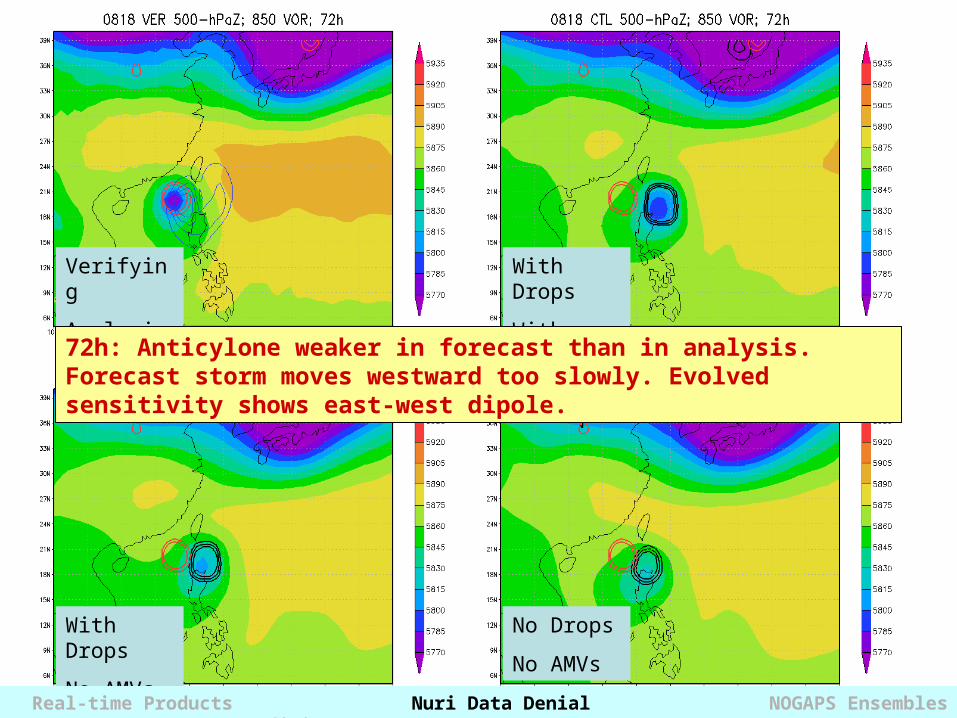
72h: Anticylone weaker in forecast than in analysis. Forecast storm moves westward too slowly. Evolved sensitivity shows east-west dipole.
Verifying
Analysis
With Drops
No AMVs
With Drops
With AMVs
No Drops
No AMVs
Real-time Products Nuri Data Denial NOGAPS Ensembles COAMPS Adjoint
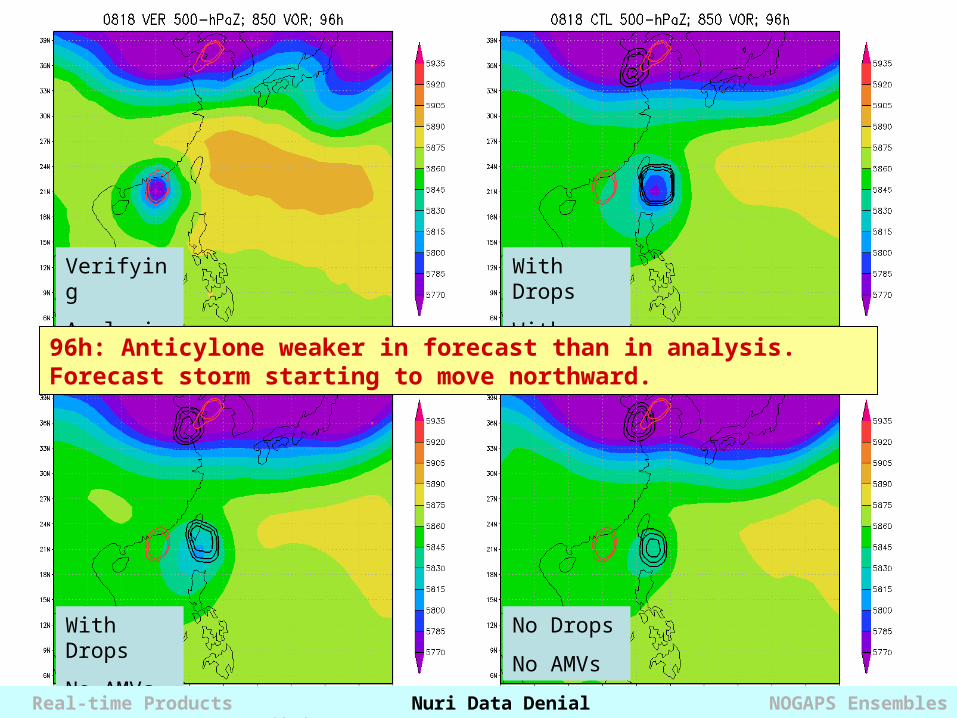
96h: Anticylone weaker in forecast than in analysis. Forecast storm starting to move northward.
Verifying
Analysis
With Drops
No AMVs
With Drops
With AMVs
No Drops
No AMVs
Real-time Products Nuri Data Denial NOGAPS Ensembles COAMPS Adjoint
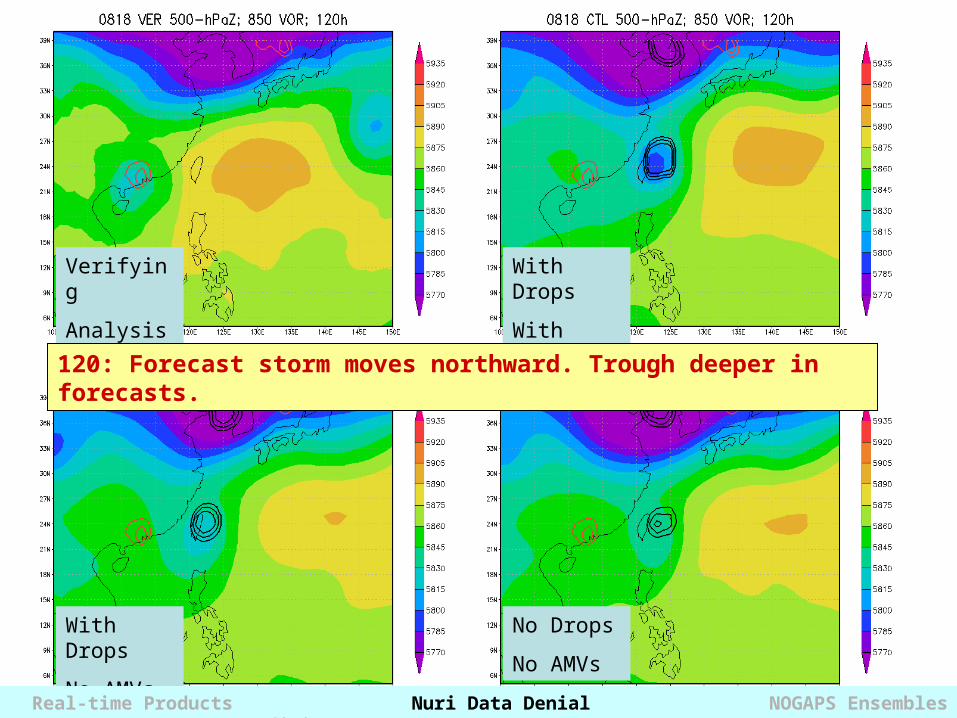
120: Forecast storm moves northward. Trough deeper in forecasts.
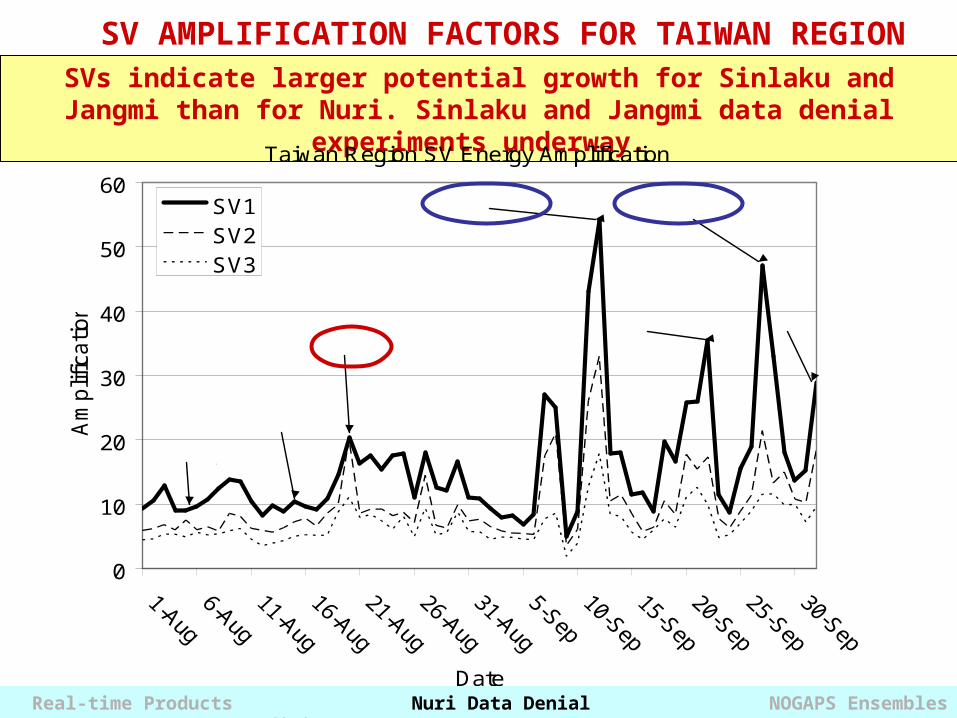
SVs indicate larger potential growth for Sinlaku and Jangmi than for Nuri. Sinlaku and Jangmi data denial experiments underway.
Taiwan Region SV Energy Amplification
0
10
20
30
40
50
60
Date
Am
plif
ica
tion
SV1SV2SV3
Kamuri
Vongfong
Nuri
Sinlaku
Hagupit
Jangmi
Higos
Real-time Products Nuri Data Denial NOGAPS Ensembles COAMPS Adjoint
SV AMPLIFICATION FACTORS FOR TAIWAN REGION
Forecasts• NOGAPS global ensemble forecasts during August-September
2008 in West Pacific Basin • 32 ensemble members plus control at 00Z, T119L30• CTL: Ensemble Transform (ET, McLay et al 2008) initial
perturbations• STO: Stochastic convection perturbations (Teixeira and
Reynolds 2008, Reynolds et al 2008) and ET perturbations• Forecast tracks compared to the Joint Typhoon Warning
Center (JTWC) warning data
Objectives• Qualitative assessment of ensemble’s ability to capture TC genesis • Assess spread-skill relationship for ensemble mean TC track errors
Real-time Products Nuri Data Denial NOGAPS Ensembles COAMPS Adjoint
NOGAPS ENSEMBLE FORECASTS
TRACKING METHOD AND GENESIS CRITERIA
• Each ensemble forecast was tracked manually on a plan-view map, both before and after genesis.
• Three 850-hPa variables used for tracking: geopotential height, vorticity, and wind vectors. Using all three variables best represents the features of the storm and helps identify weaker systems.
•Genesis Criteria (examined analysis when system was declared TD)-Multiple closed height lines (at 10 m interval) within 5o of center -Closed circulation in the wind field-Vorticity greater than 1 x 10⁻⁴ s-1
• If only one or two of the above criteria were met, the system was labeled “vortex-like”
Real-time Products Nuri Data Denial NOGAPS Ensembles COAMPS Adjoint
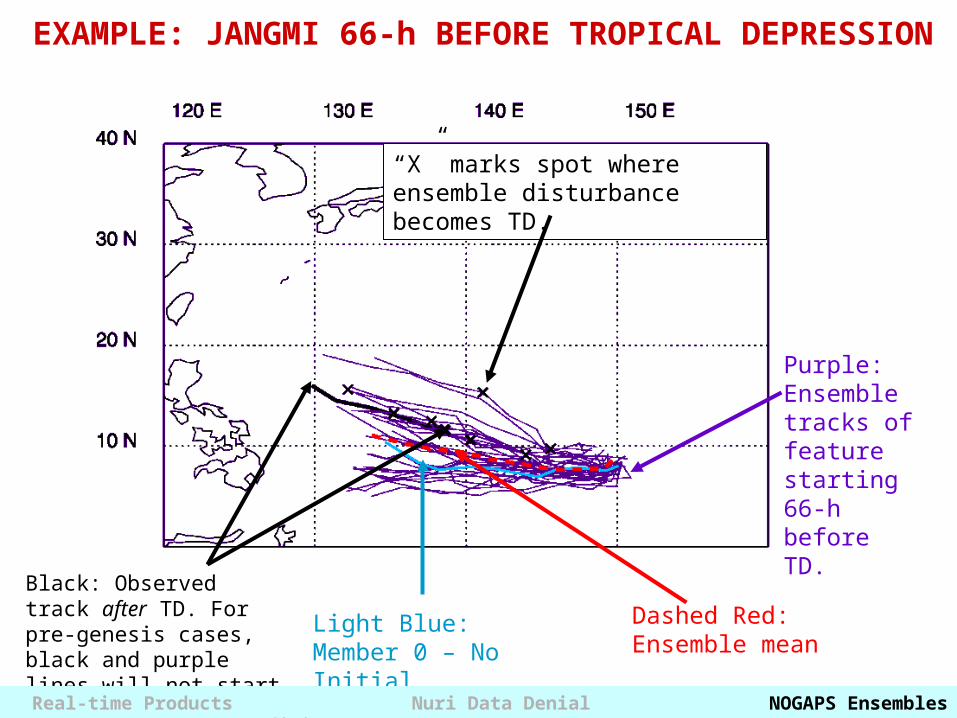
EXAMPLE: JANGMI 66-h BEFORE TROPICAL DEPRESSION
“X” marks spot where ensemble disturbance becomes TD.
Purple: Ensemble tracks of feature starting 66-h before TD.
Black: Observed track after TD. For pre-genesis cases, black and purple lines will not start at same point.
Light Blue: Member 0 – No Initial Perturbation
Dashed Red: Ensemble mean
Real-time Products Nuri Data Denial NOGAPS Ensembles COAMPS Adjoint
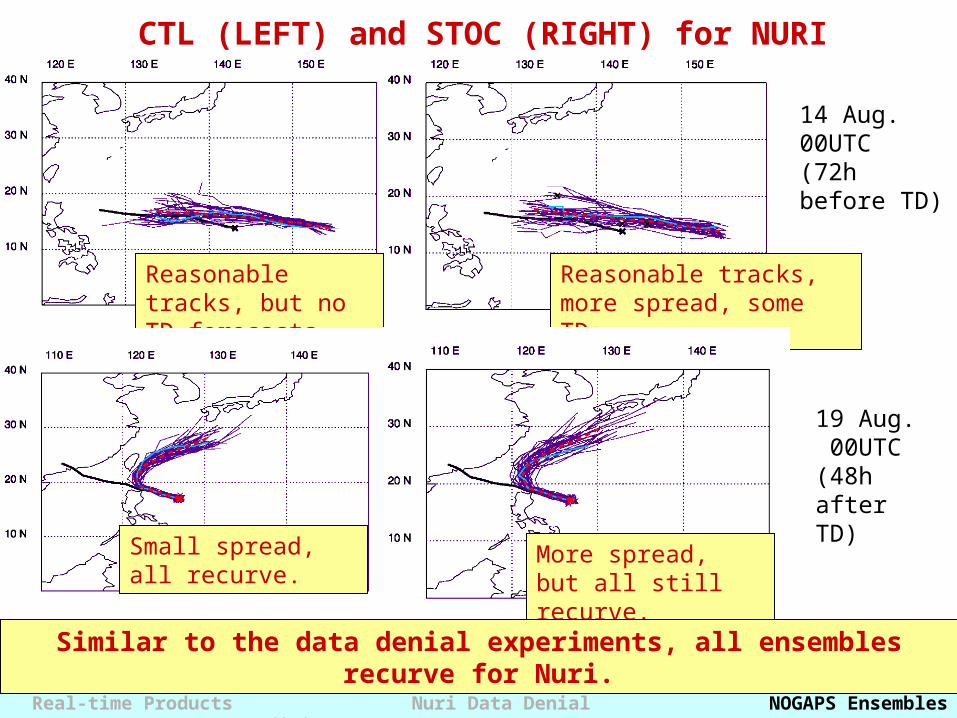
14 Aug. 00UTC (72h before TD)
Reasonable tracks, but no TD forecasts
Reasonable tracks, more spread, some TDs.
19 Aug. 00UTC(48h after TD)Small spread, all
recurve.More spread, but all still recurve.
Real-time Products Nuri Data Denial NOGAPS Ensembles COAMPS Adjoint
CTL (LEFT) and STOC (RIGHT) for NURI
Similar to the data denial experiments, all ensembles recurve for Nuri.
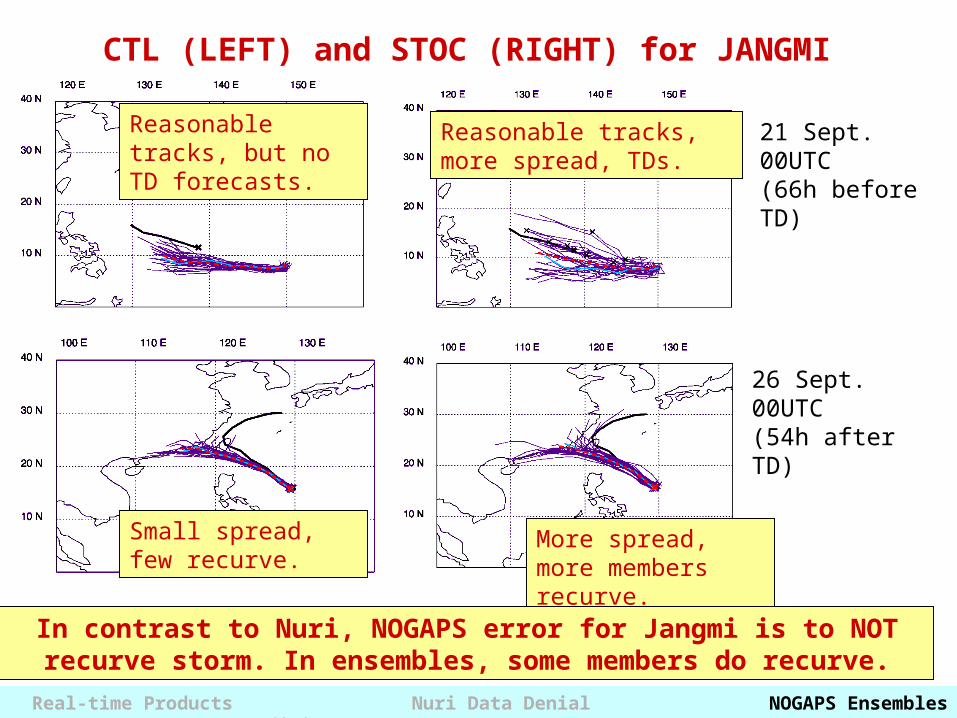
21 Sept. 00UTC(66h before TD)
Reasonable tracks, but no TD forecasts.
Reasonable tracks, more spread, TDs.
26 Sept. 00UTC(54h after TD)
Small spread, few recurve.
More spread, more members recurve.
Real-time Products Nuri Data Denial NOGAPS Ensembles COAMPS Adjoint
CTL (LEFT) and STOC (RIGHT) for JANGMI
In contrast to Nuri, NOGAPS error for Jangmi is to NOT recurve storm. In ensembles, some members do recurve.
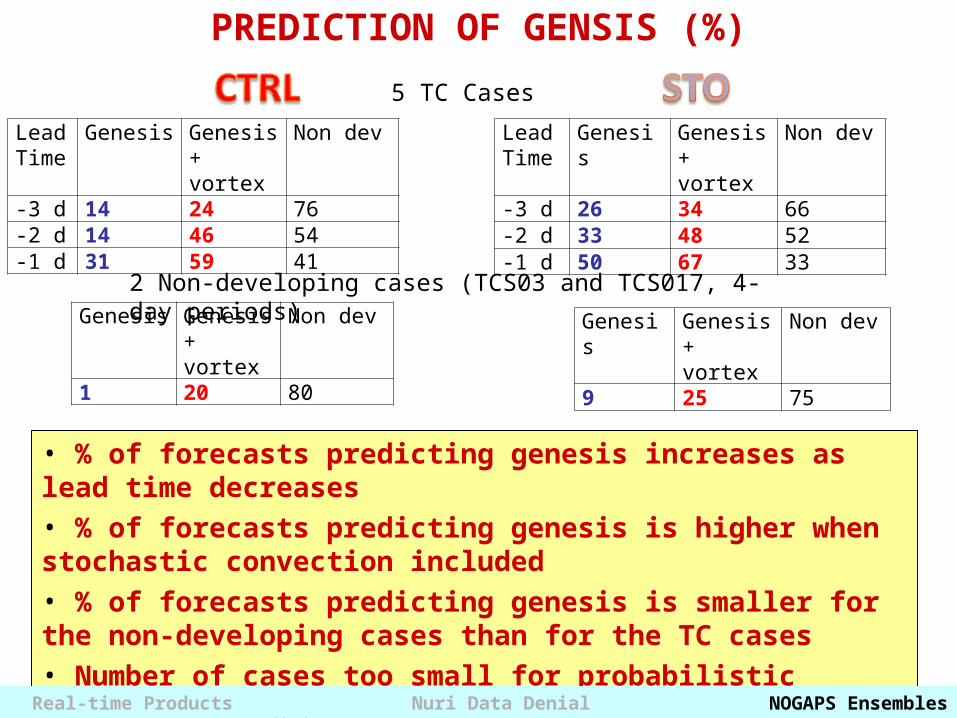
PREDICTION OF GENSIS (%)
Lead Time
Genesis Genesis + vortex
Non dev
-3 d 14 24 76-2 d 14 46 54-1 d 31 59 41
Lead Time
Genesis Genesis + vortex
Non dev
-3 d 26 34 66-2 d 33 48 52-1 d 50 67 33
• % of forecasts predicting genesis increases as lead time decreases• % of forecasts predicting genesis is higher when stochastic convection included• % of forecasts predicting genesis is smaller for the non-developing cases than for the TC cases• Number of cases too small for probabilistic verification. Real-time Products Nuri Data Denial NOGAPS Ensembles COAMPS Adjoint
5 TC Cases
2 Non-developing cases (TCS03 and TCS017, 4-day periods)Genesis Genesis
+ vortexNon dev
1 20 80
Genesis Genesis + vortex
Non dev
9 25 75
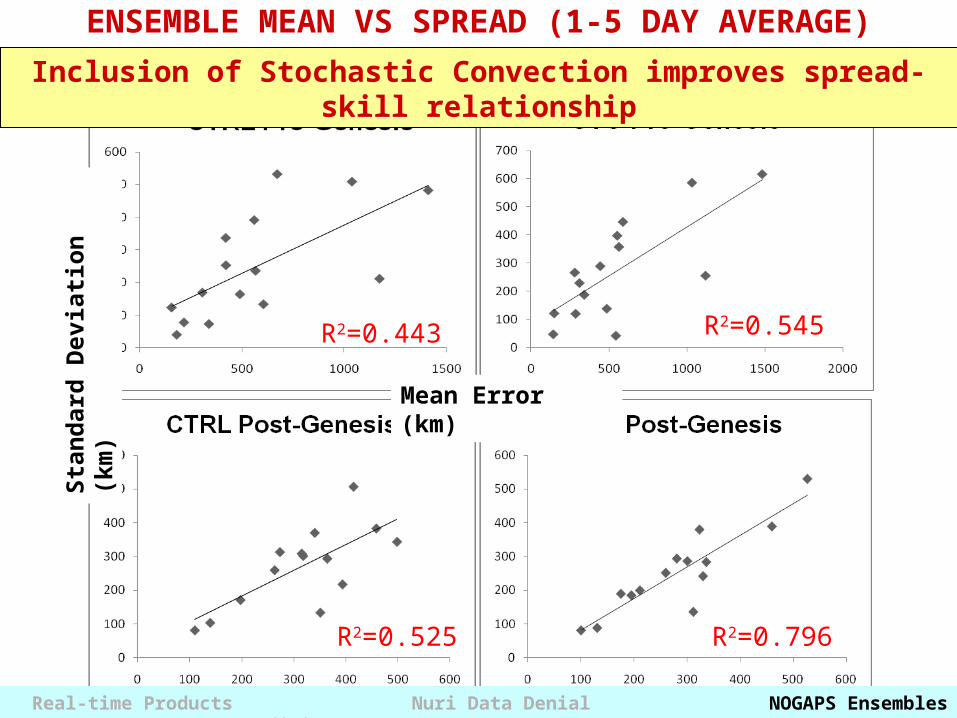
ENSEMBLE MEAN VS SPREAD (1-5 DAY AVERAGE)
R2=0.443 R2=0.545
R2=0.525 R2=0.796
Mean Error (km)
Sta
nd
ard
Devi
ati
on
(k
m)
Real-time Products Nuri Data Denial NOGAPS Ensembles COAMPS Adjoint
Inclusion of Stochastic Convection improves spread-skill relationship
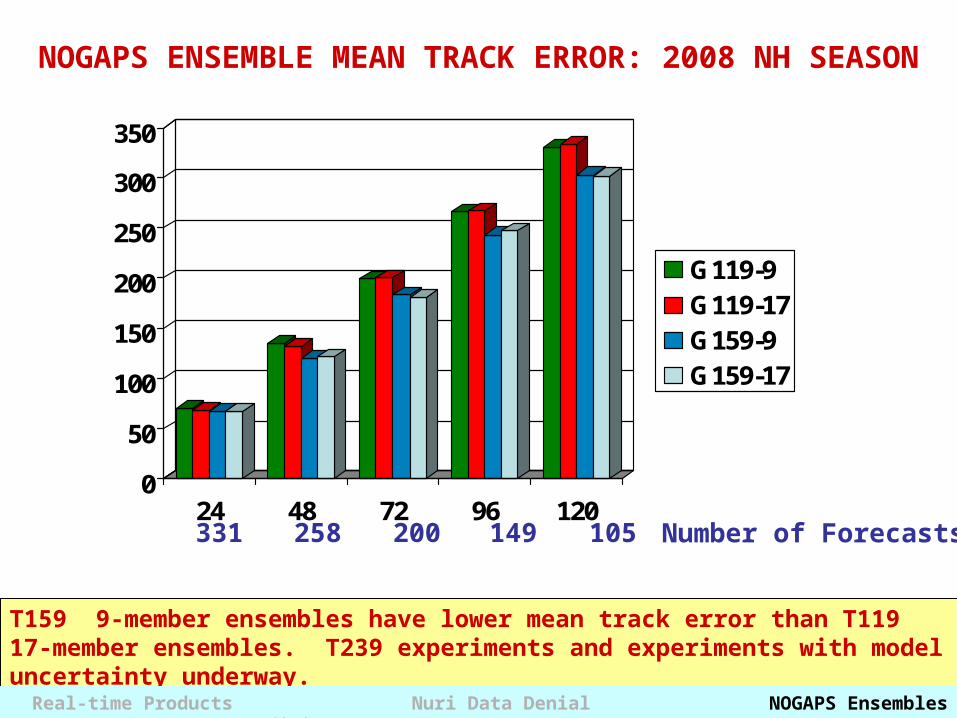
NOGAPS ENSEMBLE MEAN TRACK ERROR: 2008 NH SEASON
0
50
100
150
200
250
300
350
24 48 72 96 120
G119-9G119-17G159-9G159-17
331 258 200 Number of Forecasts149 105
T159 9-member ensembles have lower mean track error than T119 17-member ensembles. T239 experiments and experiments with model uncertainty underway.
Real-time Products Nuri Data Denial NOGAPS Ensembles COAMPS Adjoint
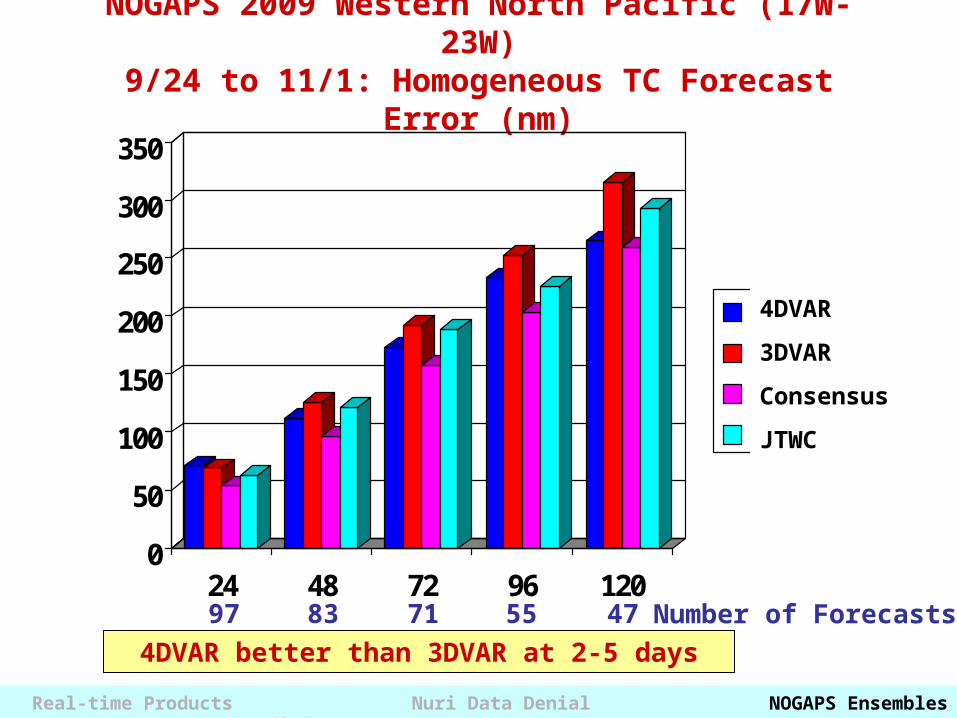
NOGAPS 2009 Western North Pacific (17W-23W)9/24 to 11/1: Homogeneous TC Forecast Error (nm)
0
50
100
150
200
250
300
350
24 48 72 96 120
AR3DVARCONWJTWC
97 83 71 Number of Forecasts55 47
4DVAR
3DVAR
Consensus
JTWC
4DVAR better than 3DVAR at 2-5 days
Real-time Products Nuri Data Denial NOGAPS Ensembles COAMPS Adjoint
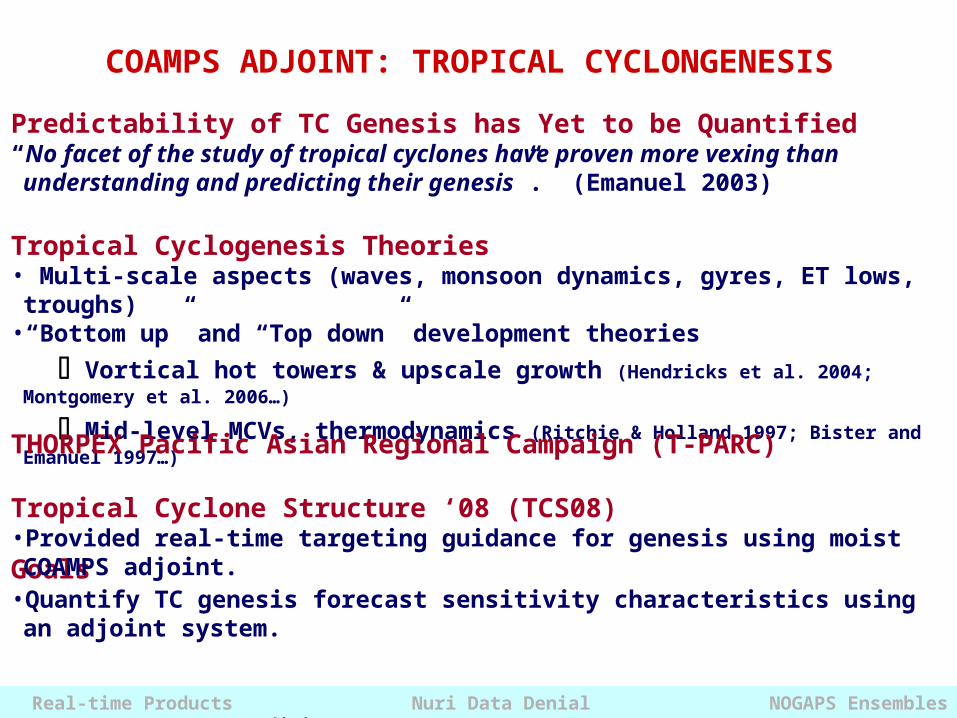
Tropical Cyclogenesis Theories• Multi-scale aspects (waves, monsoon dynamics, gyres, ET lows, troughs)• “Bottom up” and “Top down” development theories
Vortical hot towers & upscale growth (Hendricks et al. 2004; Montgomery et al. 2006…)
Mid-level MCVs, thermodynamics (Ritchie & Holland 1997; Bister and Emanuel 1997…)
Predictability of TC Genesis has Yet to be Quantified“No facet of the study of tropical cyclones have proven more vexing than understanding and predicting their genesis”. (Emanuel 2003)
COAMPS ADJOINT: TROPICAL CYCLONGENESIS
Goals• Quantify TC genesis forecast sensitivity characteristics using an adjoint system.
THORPEX Pacific Asian Regional Campaign (T-PARC) Tropical Cyclone Structure ‘08 (TCS08)• Provided real-time targeting guidance for genesis using moist COAMPS adjoint.
Real-time Products Nuri Data Denial NOGAPS Ensembles COAMPS Adjoint
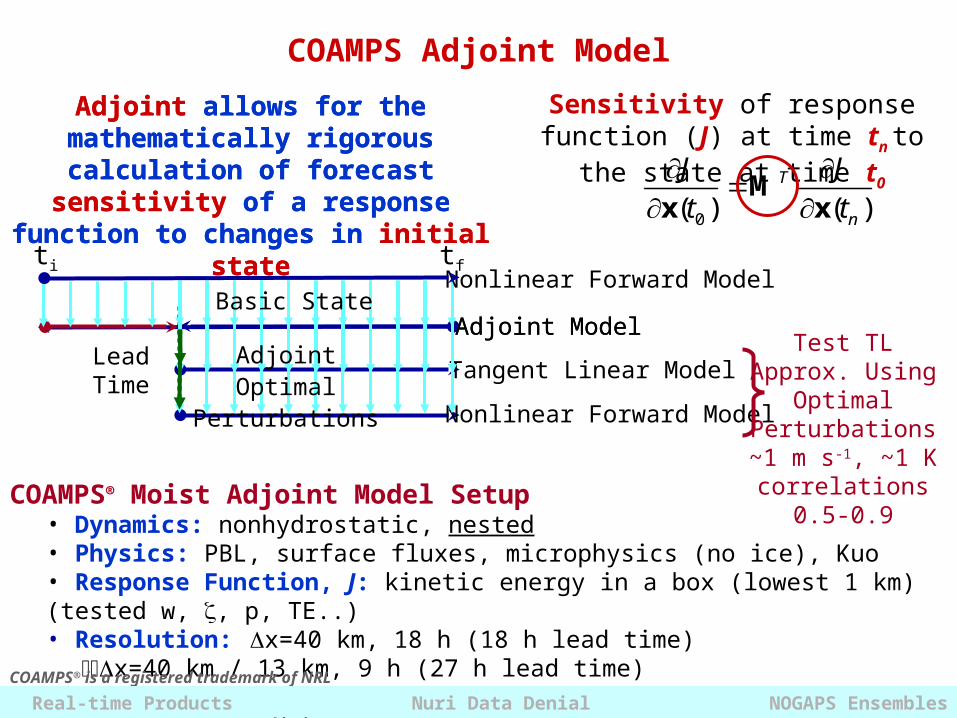
COAMPS® Moist Adjoint Model Setup• Dynamics: nonhydrostatic, nested• Physics: PBL, surface fluxes, microphysics (no ice), Kuo• Response Function, J: kinetic energy in a box (lowest 1 km) (tested w, , p, TE..)• Resolution: x=40 km, 18 h (18 h lead time)
x=40 km / 13 km, 9 h (27 h lead time)
COAMPS Adjoint Model
LeadTime
Adjoint Model
Tangent Linear Model
Nonlinear Forward Model
Adjoint ModelTest TL Approx. Using Optimal Perturbations~1 m s-1, ~1 K
correlations 0.5-0.9
Adjoint allows for the mathematically rigorous calculation of forecast
sensitivity of a response function to changes in initial state
Sensitivity of response function (J) at time tn to the state at time t0
0( ) ( )T
n
J J
t t
M
x x
COAMPS® is a registered trademark of NRL
Adjoint Optimal Perturbations
Basic State
ti tfNonlinear Forward Model
Adjoint allows for the mathematically rigorous calculation of forecast
sensitivity of a response function to changes in initial state
Real-time Products Nuri Data Denial NOGAPS Ensembles COAMPS Adjoint
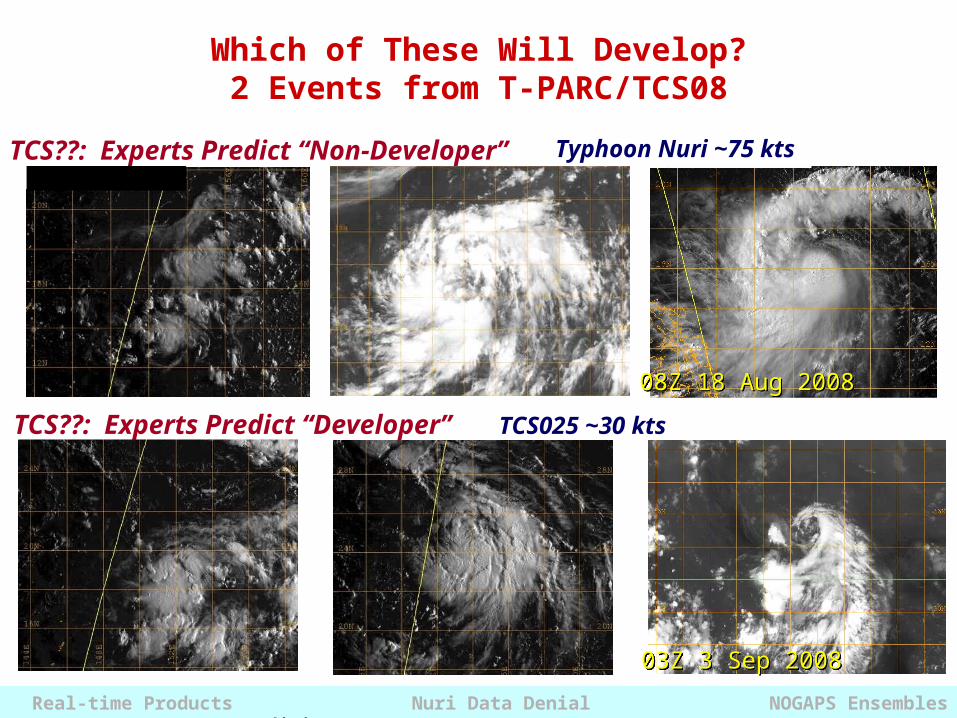
TCS??: Experts Predict “Non-Developer”
Which of These Will Develop?2 Events from T-PARC/TCS08
08Z 18 Aug 200808Z 18 Aug 2008
Typhoon Nuri ~75 kts
03Z 3 Sep 200803Z 3 Sep 2008
TCS??: Experts Predict “Developer” TCS025 ~30 kts
Real-time Products Nuri Data Denial NOGAPS Ensembles COAMPS Adjoint
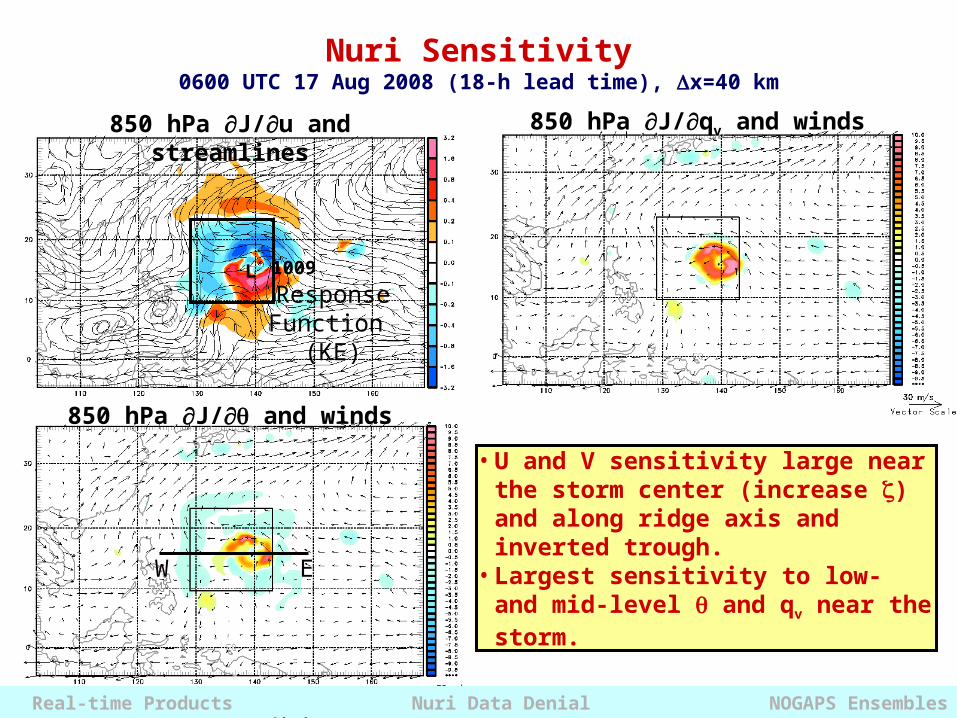
Nuri Sensitivity0600 UTC 17 Aug 2008 (18-h lead time), x=40 km
850 hPa J/qv and winds850 hPa J/u and streamlines
• U and V sensitivity large near the storm center (increase ) and along ridge axis and inverted trough.
• Largest sensitivity to low- and mid-level and qv near the storm.
850 hPa J/ and winds
W E
L 1009
ResponseFunction
(KE)
Real-time Products Nuri Data Denial NOGAPS Ensembles COAMPS Adjoint
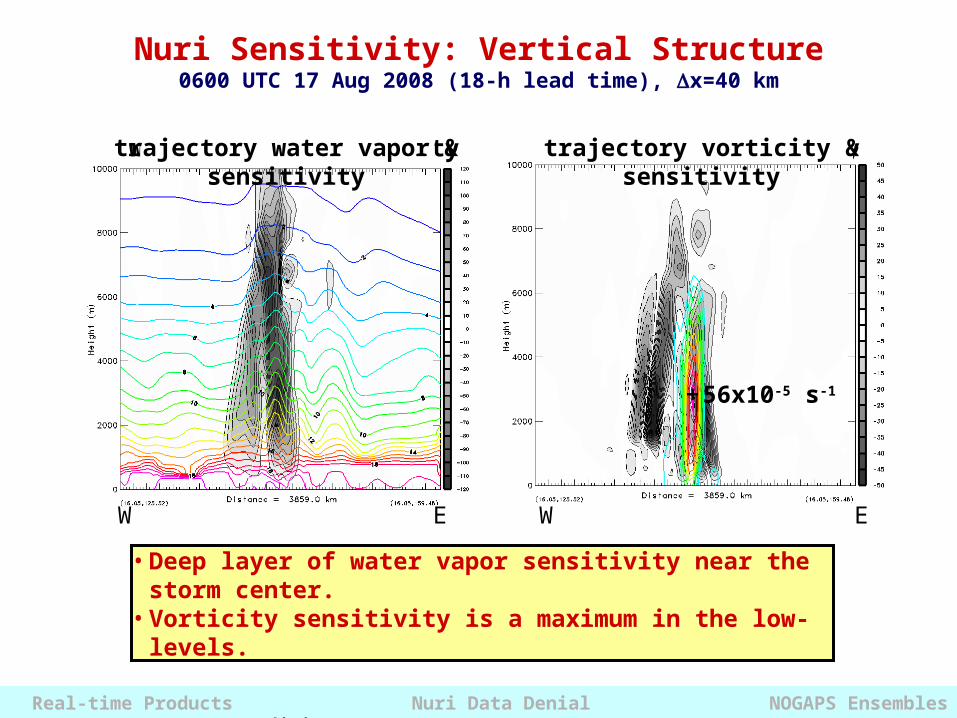
• Deep layer of water vapor sensitivity near the storm center. • Vorticity sensitivity is a maximum in the low-levels.
Nuri Sensitivity: Vertical Structure0600 UTC 17 Aug 2008 (18-h lead time), x=40 km
vorticity sensitivitywater vapor sensitivitytrajectory water vapor & sensitivity trajectory vorticity & sensitivity
W EW E
56x10-5 s-1+
Real-time Products Nuri Data Denial NOGAPS Ensembles COAMPS Adjoint
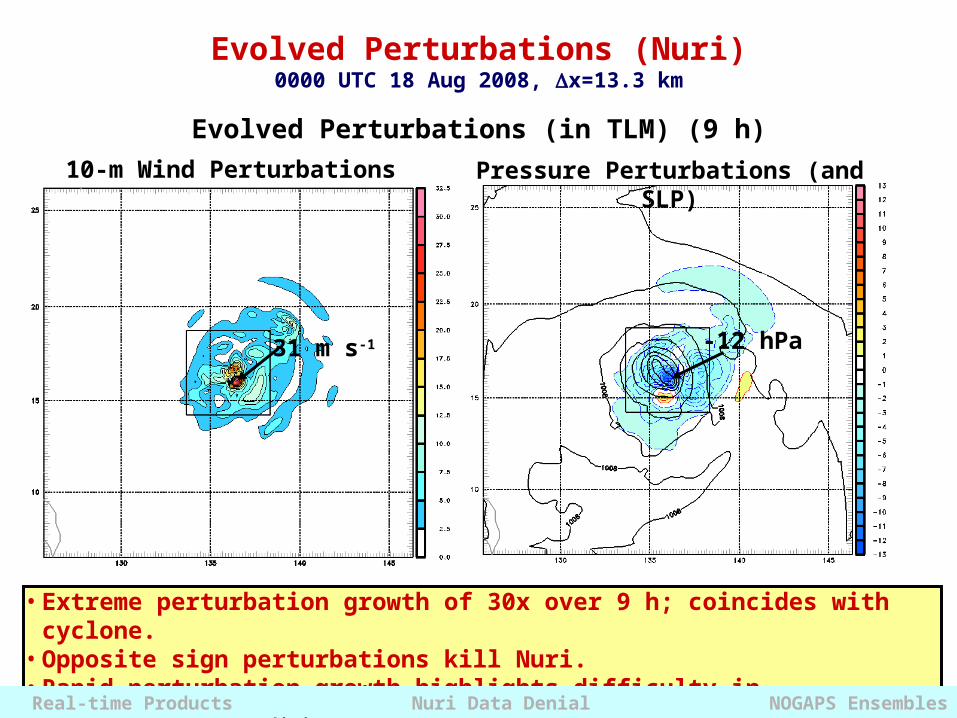
Evolved Perturbations (Nuri)0000 UTC 18 Aug 2008, x=13.3 km
31 m s-1 -12 hPa
Evolved Perturbations (in TLM) (9 h)
10-m Wind Perturbations Pressure Perturbations (and SLP)
• Extreme perturbation growth of 30x over 9 h; coincides with cyclone.• Opposite sign perturbations kill Nuri.• Rapid perturbation growth highlights difficulty in genesis/intensity forecasting
Real-time Products Nuri Data Denial NOGAPS Ensembles COAMPS Adjoint
SUMMARY
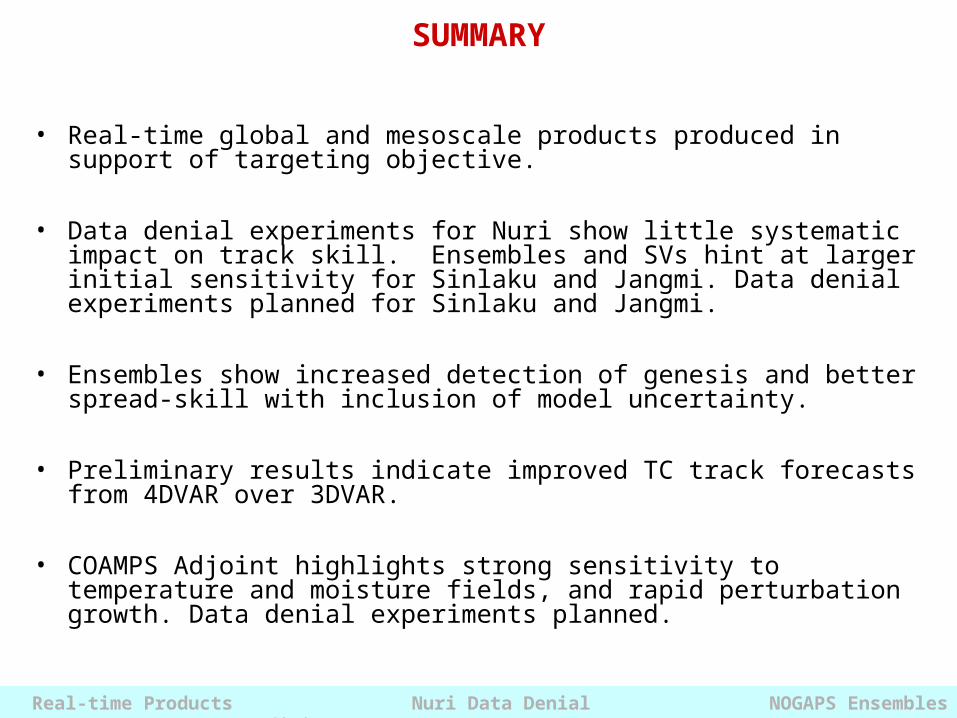
• Real-time global and mesoscale products produced in support of targeting objective.
• Data denial experiments for Nuri show little systematic impact on track skill. Ensembles and SVs hint at larger initial sensitivity for Sinlaku and Jangmi. Data denial experiments planned for Sinlaku and Jangmi.
• Ensembles show increased detection of genesis and better spread-skill with inclusion of model uncertainty.
• Preliminary results indicate improved TC track forecasts from 4DVAR over 3DVAR.
• COAMPS Adjoint highlights strong sensitivity to temperature and moisture fields, and rapid perturbation growth. Data denial experiments planned.
Real-time Products Nuri Data Denial NOGAPS Ensembles COAMPS Adjoint

Questions?
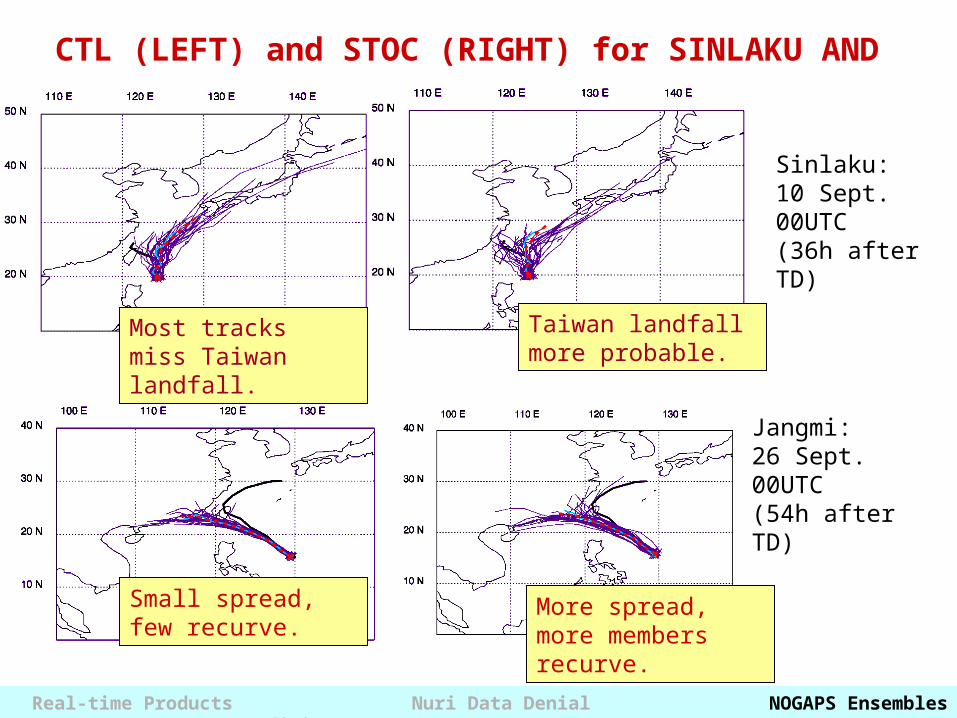
Jangmi: 26 Sept. 00UTC(54h after TD)
Small spread, few recurve.
More spread, more members recurve.
Real-time Products Nuri Data Denial NOGAPS Ensembles COAMPS Adjoint
CTL (LEFT) and STOC (RIGHT) for SINLAKU AND JANGMI
Sinlaku: 10 Sept. 00UTC(36h after TD)
Most tracks miss Taiwan landfall.
Taiwan landfall more probable.
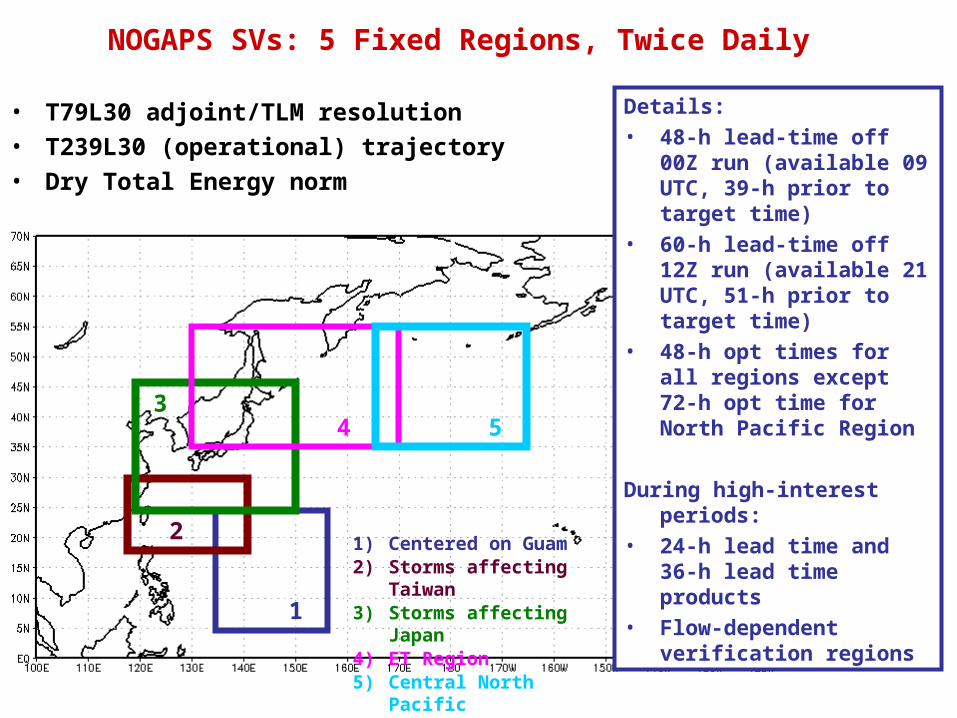
NOGAPS SVs: 5 Fixed Regions, Twice Daily
• T79L30 adjoint/TLM resolution
• T239L30 (operational) trajectory
• Dry Total Energy norm
1
2
34 5
Details:• 48-h lead-time off 00Z run
(available 09 UTC, 39-h prior to target time)
• 60-h lead-time off 12Z run (available 21 UTC, 51-h prior to target time)
• 48-h opt times for all regions except 72-h opt time for North Pacific Region
During high-interest periods:• 24-h lead time and 36-h
lead time products • Flow-dependent
verification regions1) Centered on Guam2) Storms affecting Taiwan3) Storms affecting Japan4) ET Region5) Central North Pacific
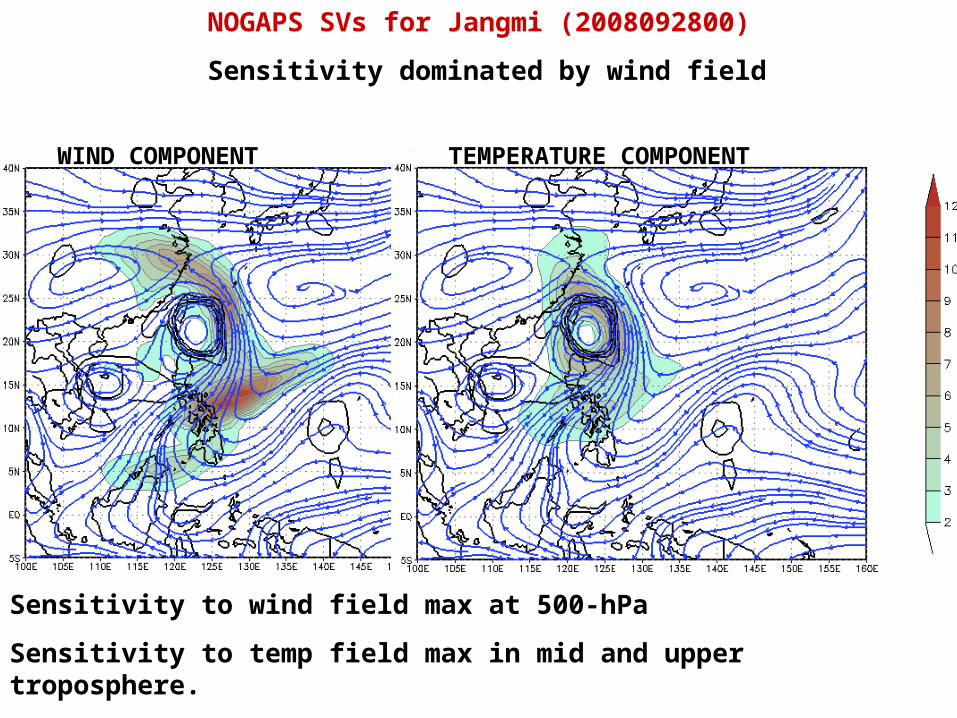
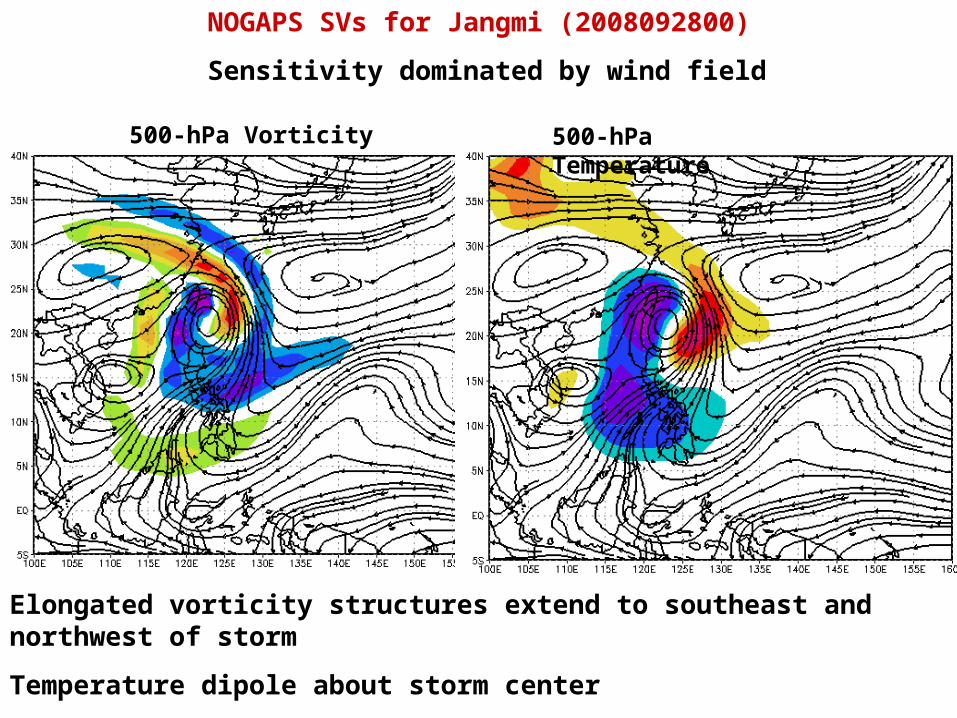
NOGAPS SVs for Jangmi (2008092800)
Sensitivity dominated by wind field
WIND COMPONENT TEMPERATURE COMPONENT
Sensitivity to wind field max at 500-hPa
Sensitivity to temp field max in mid and upper troposphere.
NOGAPS SVs for Jangmi (2008092800)
Sensitivity dominated by wind field
500-hPa Vorticity 500-hPa Temperature
Elongated vorticity structures extend to southeast and northwest of storm
Temperature dipole about storm center
Final Time
Initial Time
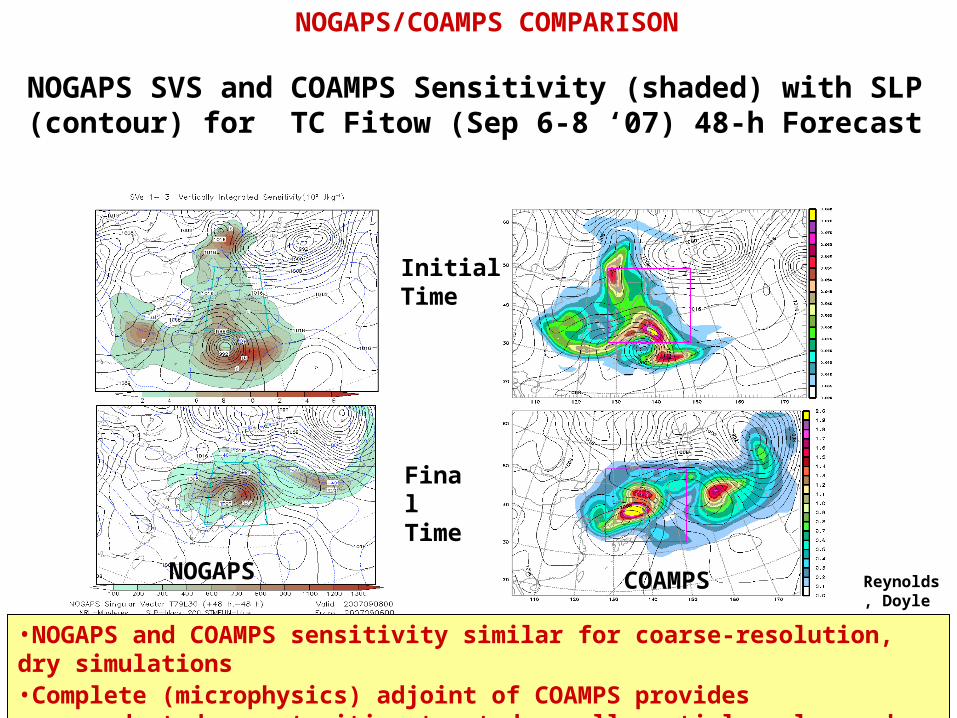
NOGAPS SVS and COAMPS Sensitivity (shaded) with SLP (contour) for TC Fitow (Sep 6-8 ‘07) 48-h Forecast
NOGAPS COAMPS
•NOGAPS and COAMPS sensitivity similar for coarse-resolution, dry simulations•Complete (microphysics) adjoint of COAMPS provides unprecedented opportunities to study small spatial scales and short time scales
Reynolds, Doyle
NOGAPS/COAMPS COMPARISON
KE/qv 500 m
KE/qv KE/
Low-Level Moisture
Sensitivity
Mid-Level Sensitivity
e Perturbation
W E W E W E
Low-Level e Maximum
(Destabilization)
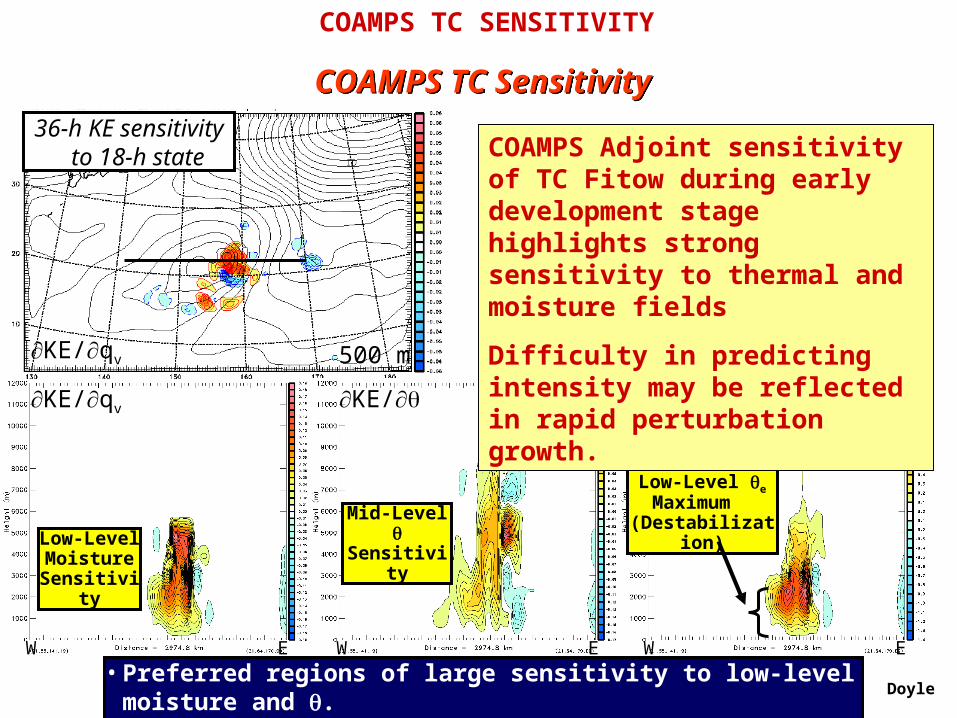
• Preferred regions of large sensitivity to low-level moisture and .• Low-level e optimal perturbations: destabilize & saturate core.
36-h KE sensitivity to 18-h state
COAMPS TC SensitivityCOAMPS TC Sensitivity
COAMPS Adjoint sensitivity of TC Fitow during early development stage highlights strong sensitivity to thermal and moisture fields
Difficulty in predicting intensity may be reflected in rapid perturbation growth.
Doyle
COAMPS TC SENSITIVITY
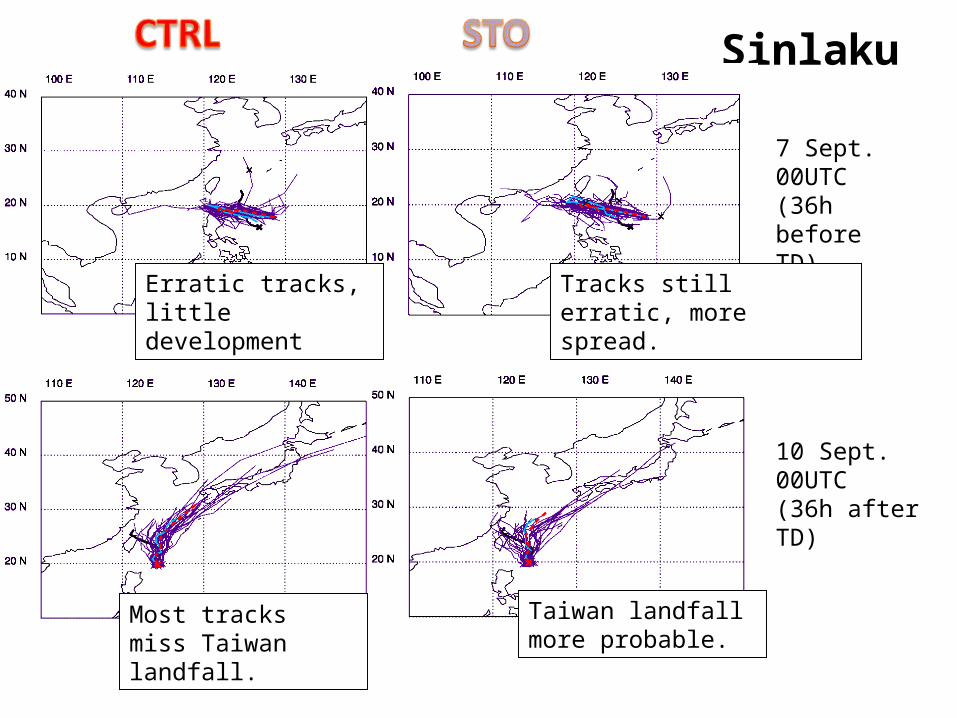
Sinlaku
7 Sept. 00UTC(36h before TD)
10 Sept. 00UTC(36h after TD)
Erratic tracks, little development
Tracks still erratic, more spread.
Most tracks miss Taiwan landfall.
Taiwan landfall more probable.
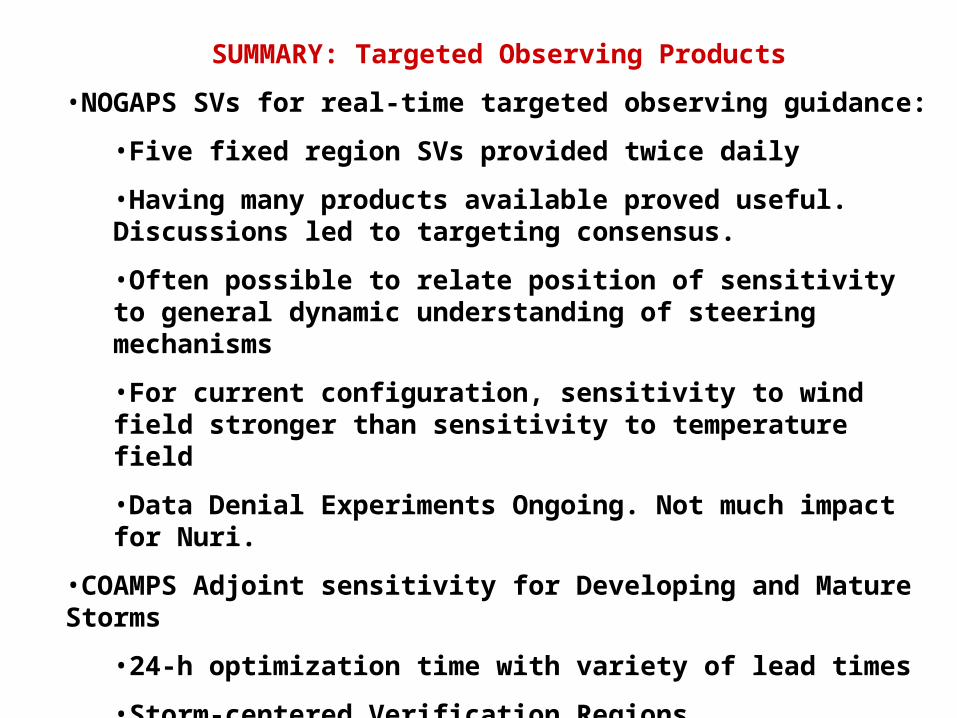
SUMMARY: Targeted Observing Products
•NOGAPS SVs for real-time targeted observing guidance:
•Five fixed region SVs provided twice daily
•Having many products available proved useful. Discussions led to targeting consensus.
•Often possible to relate position of sensitivity to general dynamic understanding of steering mechanisms
•For current configuration, sensitivity to wind field stronger than sensitivity to temperature field
•Data Denial Experiments Ongoing. Not much impact for Nuri.
•COAMPS Adjoint sensitivity for Developing and Mature Storms
•24-h optimization time with variety of lead times
•Storm-centered Verification Regions
•Fine-scale products complementary to large-scale SVs
•Rapid perturbation growth associated with moist processes
SUMMARY: Ensemble Products
•NOGAPS ensemble products (time-longitude diagrams), useful for downstream impact problem
•Real-time 55-km 8-member Ensemble Tests ongoing
•Tests for 2008 season indicate
Impact of initial perturbation formulation relatively small
Impact of resolution significant
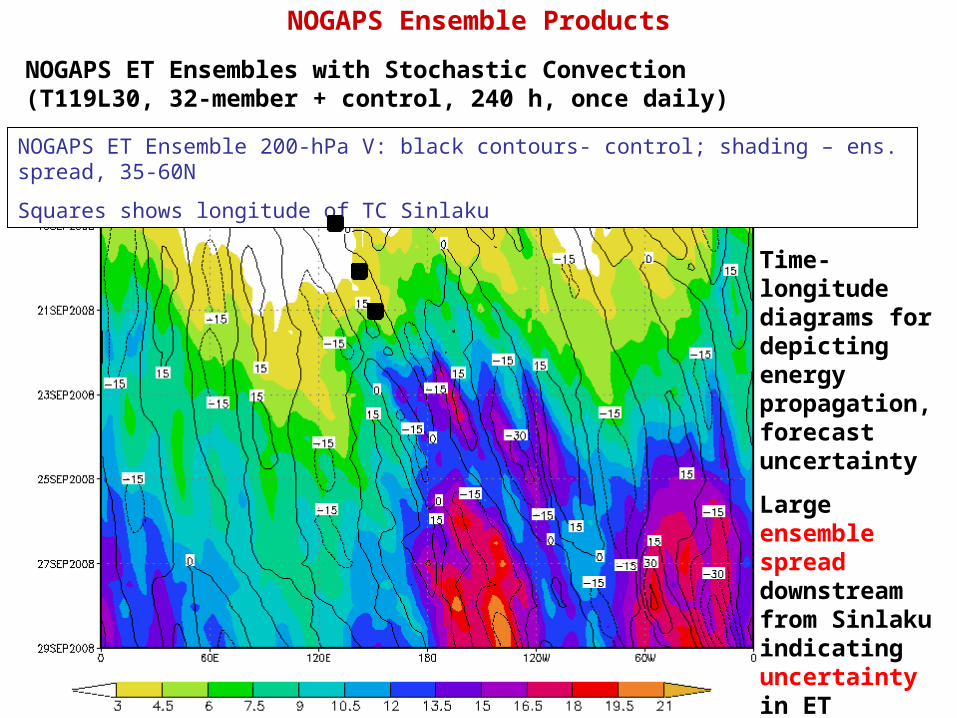
NOGAPS ET Ensemble 200-hPa V: black contours- control; shading – ens. spread, 35-60N
Squares shows longitude of TC Sinlaku
NOGAPS ET Ensembles with Stochastic Convection (T119L30, 32-member + control, 240 h, once daily)
NOGAPS Ensemble Products
Time-longitude diagrams for depicting energy propagation, forecast uncertainty
Large ensemble spread downstream from Sinlaku indicating uncertainty in ET
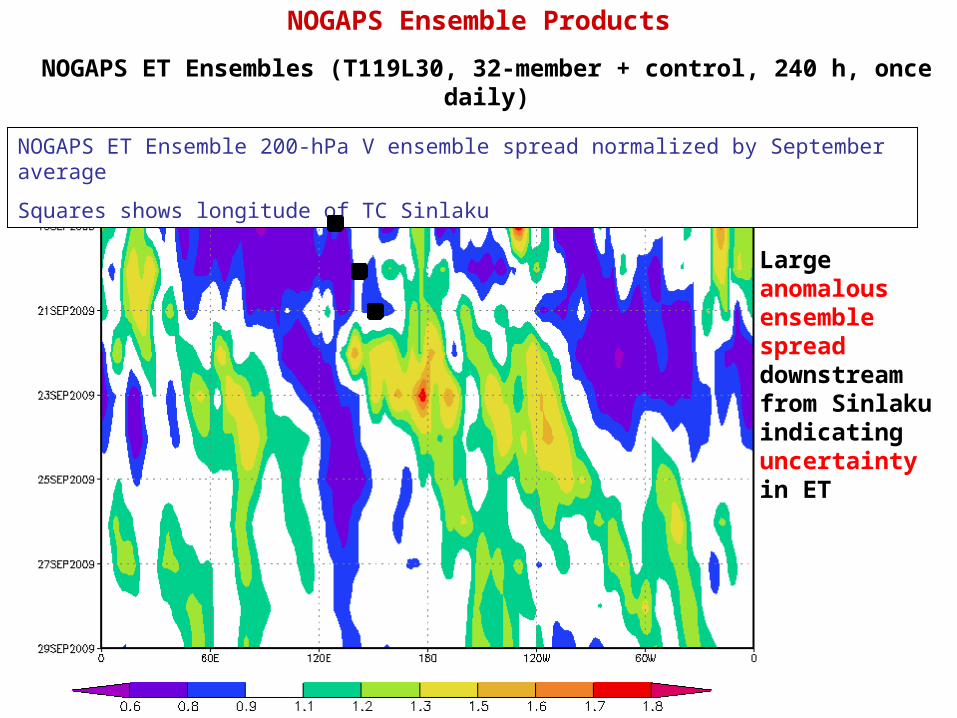
NOGAPS ET Ensemble 200-hPa V ensemble spread normalized by September average
Squares shows longitude of TC Sinlaku
NOGAPS Ensemble Products
Large anomalous ensemble spread downstream from Sinlaku indicating uncertainty in ET
NOGAPS ET Ensembles (T119L30, 32-member + control, 240 h, once daily)
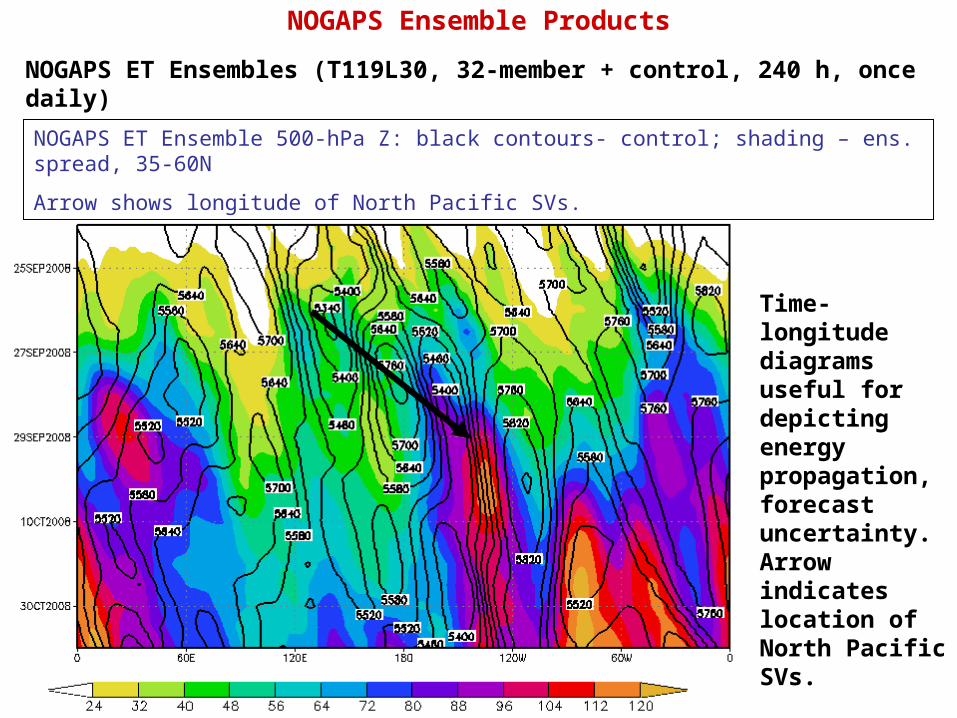
NOGAPS ET Ensembles (T119L30, 32-member + control, 240 h, once daily)
NOGAPS ET Ensemble 500-hPa Z: black contours- control; shading – ens. spread, 35-60N
Arrow shows longitude of North Pacific SVs.
NOGAPS Ensemble Products
Time-longitude diagrams useful for depicting energy propagation, forecast uncertainty. Arrow indicates location of North Pacific SVs.
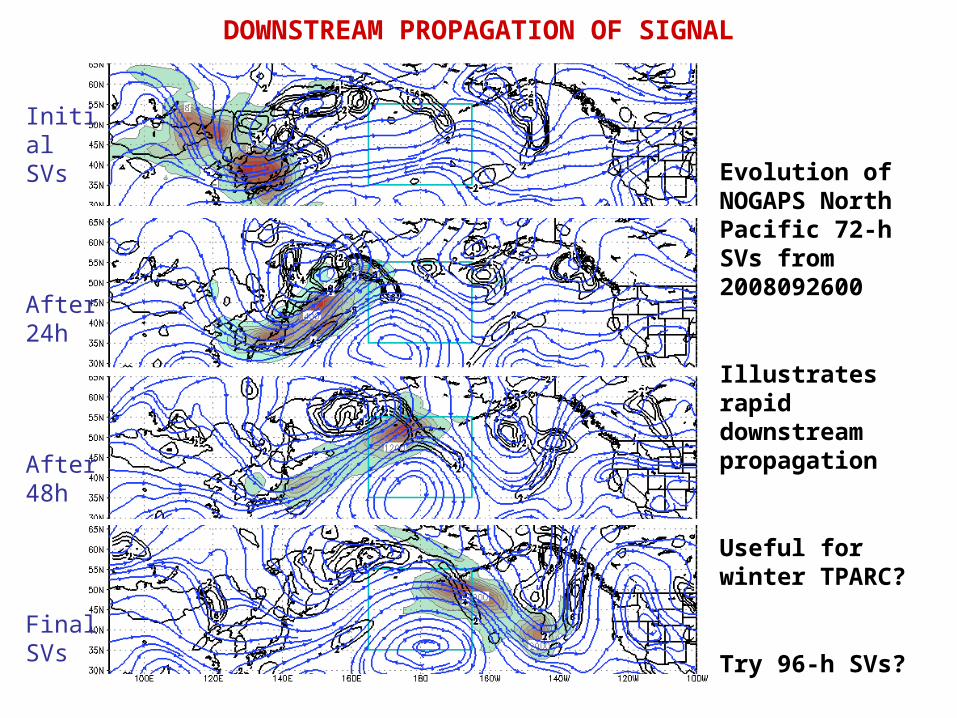
Initial SVs
After 24h
After 48h
Final SVs
Evolution of NOGAPS North Pacific 72-h SVs from 2008092600
Illustrates rapid downstream propagation
Useful for winter TPARC?
Try 96-h SVs?
DOWNSTREAM PROPAGATION OF SIGNAL
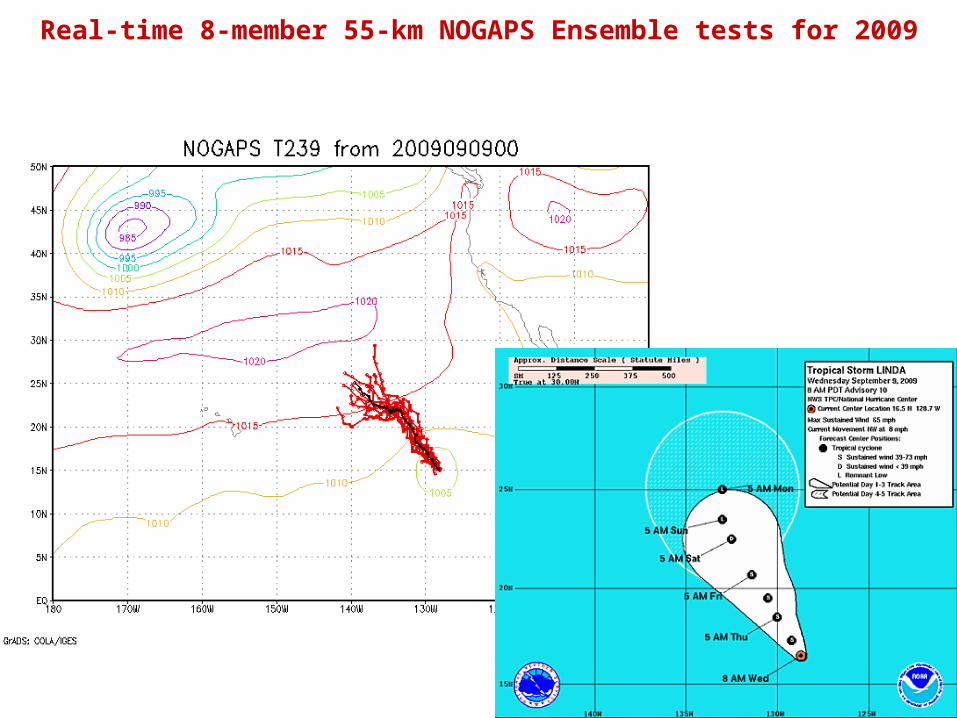
Real-time 8-member 55-km NOGAPS Ensemble tests for 2009
James D. DoyleClark Amerault, Carolyn Reynolds, Hao Jin, Jon Moskaitis1
Naval Research Laboratory, Monterey, CA1National Research Council, Monterey, CA
James D. DoyleClark Amerault, Carolyn Reynolds, Hao Jin, Jon Moskaitis1
Naval Research Laboratory, Monterey, CA1National Research Council, Monterey, CA
Acknowledgements: ONR, TCS08 TeamAcknowledgements: ONR, TCS08 Team
Aspects of Tropical Cyclogenesis Predictability during TCS08
Aspects of Tropical Cyclogenesis Predictability during TCS08
Typhoon Saomai (08W) and Tropical Storm Bopha (10W) 02Z 8 Aug 2006 (NASA MODIS)Typhoon Saomai (08W) and Tropical Storm Bopha (10W) 02Z 8 Aug 2006 (NASA MODIS)
Vertically-integrated total energy, C130 Track and
Drops
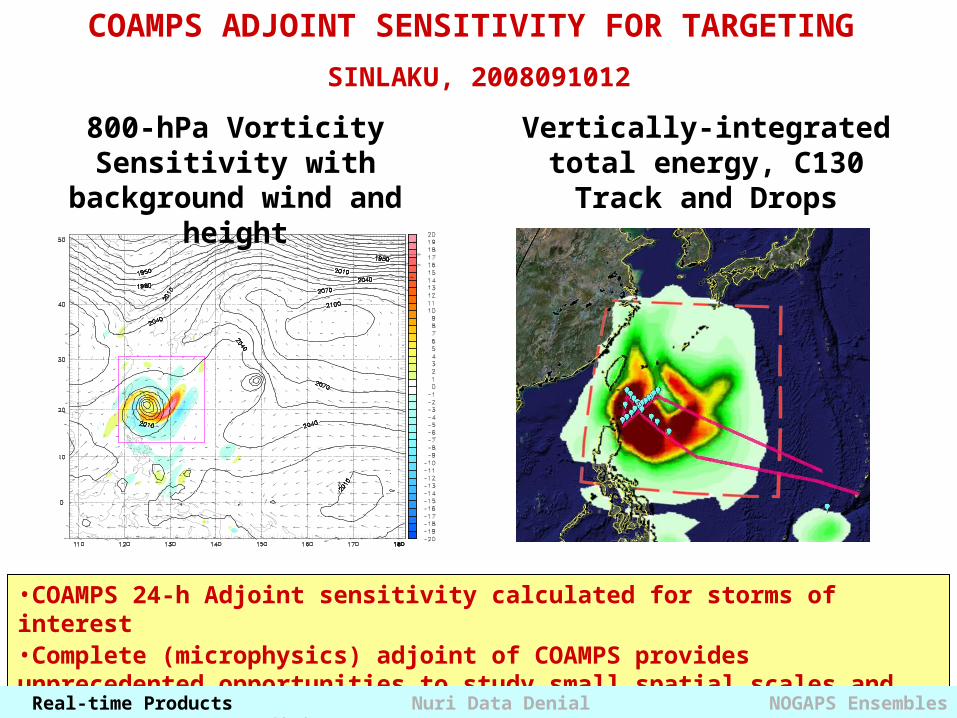
•COAMPS 24-h Adjoint sensitivity calculated for storms of interest•Complete (microphysics) adjoint of COAMPS provides unprecedented opportunities to study small spatial scales and short time scales
COAMPS ADJOINT SENSITIVITY FOR TARGETING
SINLAKU, 2008091012
800-hPa Vorticity Sensitivity with background wind and
height
Real-time Products Nuri Data Denial NOGAPS Ensembles COAMPS Adjoint
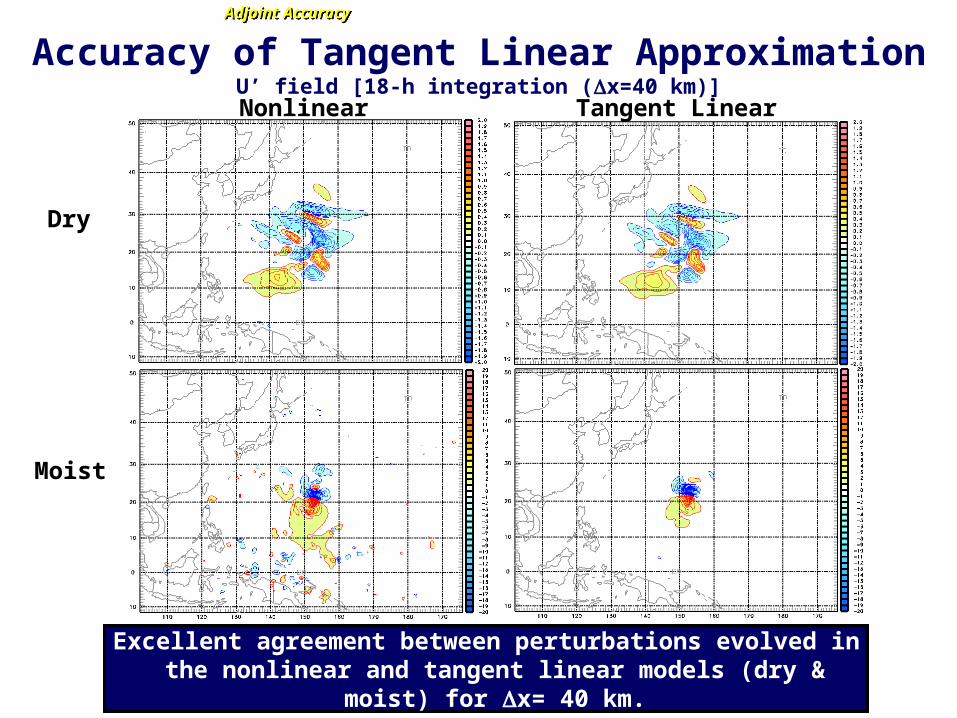
Accuracy of Tangent Linear ApproximationU’ field [18-h integration (x=40 km)]
Adjoint AccuracyAdjoint Accuracy
Excellent agreement between perturbations evolved in the nonlinear and tangent linear models (dry & moist) for x= 40 km.
Dry
Nonlinear Tangent Linear
Moist
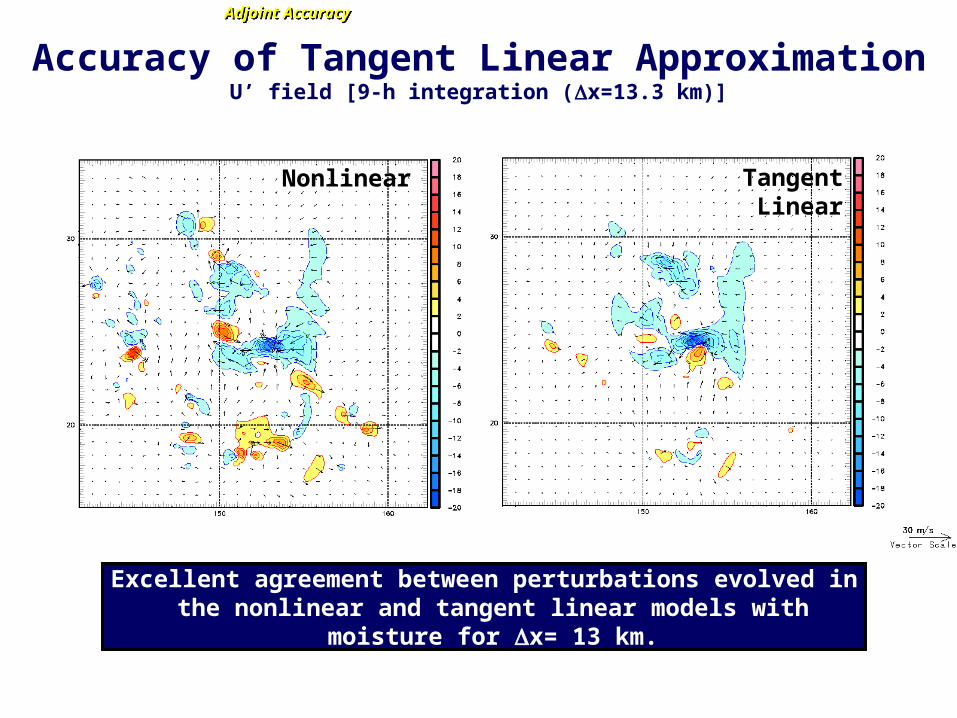
Accuracy of Tangent Linear ApproximationU’ field [9-h integration (x=13.3 km)]
Nonlinear Tangent Linear
Excellent agreement between perturbations evolved in the nonlinear and tangent linear models with moisture for x= 13 km.
Adjoint AccuracyAdjoint Accuracy
P3 LIDAR Winds at 500 m
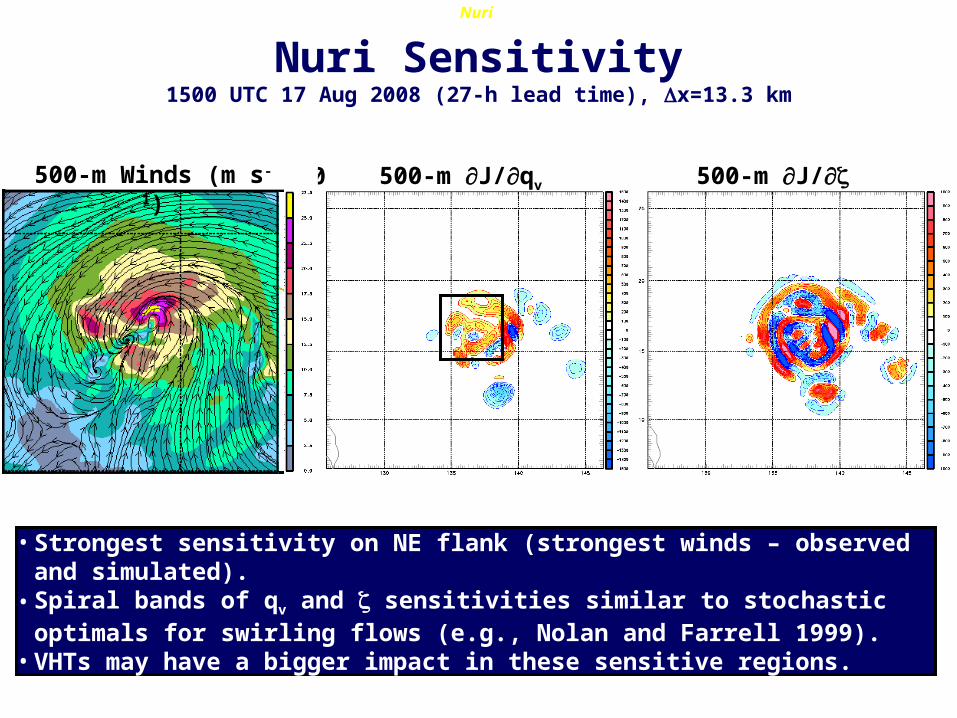
Nuri Sensitivity1500 UTC 17 Aug 2008 (27-h lead time), x=13.3 km
500-m J/qv 500-m J/
• Strongest sensitivity on NE flank (strongest winds – observed and simulated).• Spiral bands of qv and sensitivities similar to stochastic optimals for swirling
flows (e.g., Nolan and Farrell 1999).• VHTs may have a bigger impact in these sensitive regions.
Nuri
D. Emmitt
500-m Winds (m s-1)
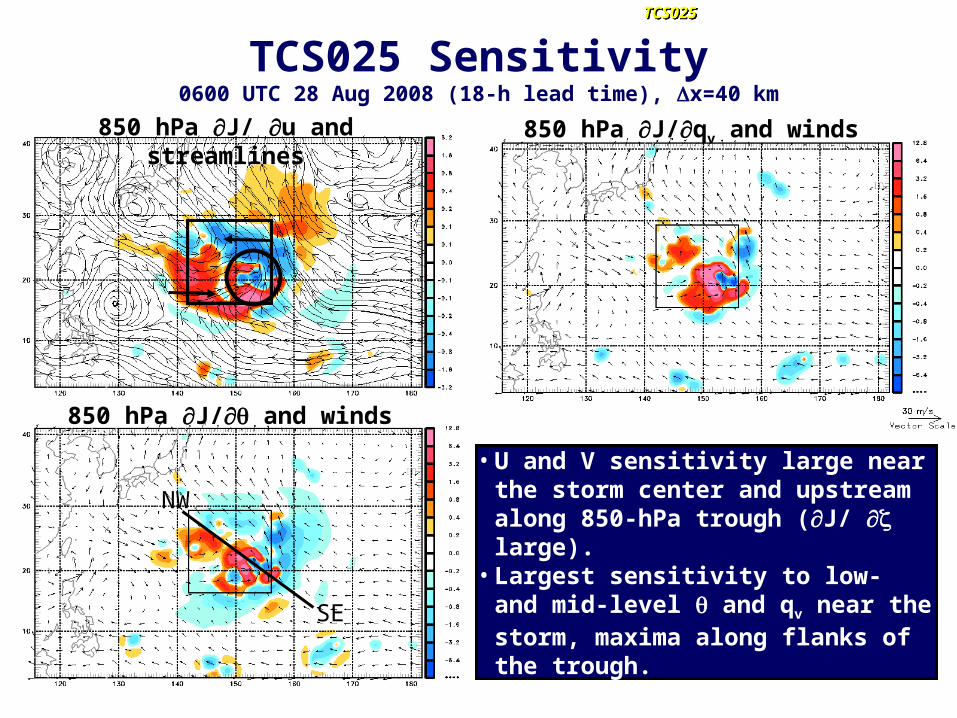
TCS025 Sensitivity0600 UTC 28 Aug 2008 (18-h lead time), x=40 km
• U and V sensitivity large near the storm center and upstream along 850-hPa trough (J/ large).
• Largest sensitivity to low- and mid-level and qv near the storm, maxima along flanks of the trough.
850 hPa J/ u and SLP 850 hPa J/qv and winds
850 hPa J/ and winds
NW
SE
TCS025TCS025
850 hPa J/ u and streamlines
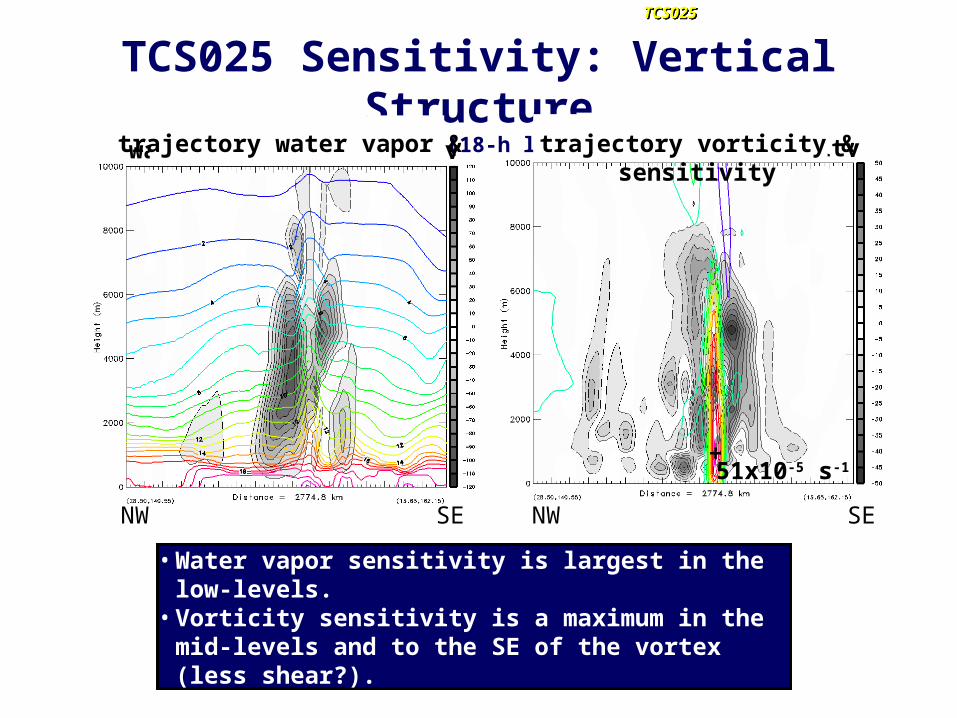
vorticity sensitivity
TCS025 Sensitivity: Vertical Structure0600 UTC 28 Aug 2008 (18-h lead time), x=40 km
• Water vapor sensitivity is largest in the low-levels. • Vorticity sensitivity is a maximum in the mid-levels
and to the SE of the vortex (less shear?).
water vapor sensitivitytrajectory water vapor & sensitivity trajectory vorticity & sensitivity
51x10-5 s-1+
NW SE NW SE
TCS025TCS025
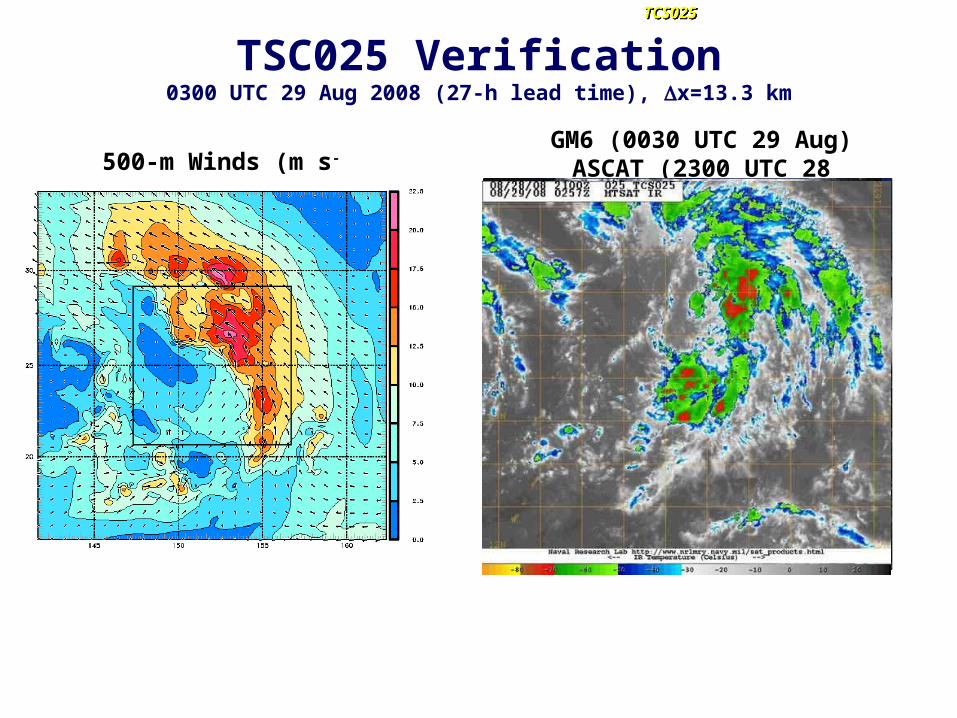
TSC025 Verification0300 UTC 29 Aug 2008 (27-h lead time), x=13.3 km
500-m Winds (m s-1)GM6 (0030 UTC 29 Aug)
ASCAT (2300 UTC 28 Aug)
25 kts
TCS025TCS025
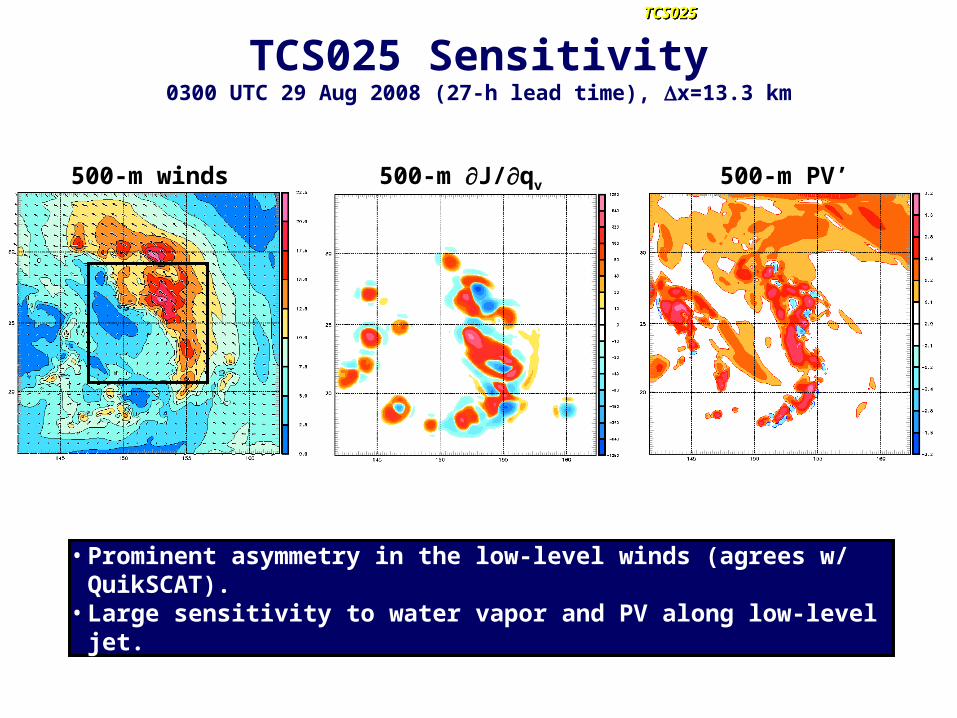
TCS025 Sensitivity0300 UTC 29 Aug 2008 (27-h lead time), x=13.3 km
500-m winds 500-m J/qv 500-m PV’
• Prominent asymmetry in the low-level winds (agrees w/ QuikSCAT).• Large sensitivity to water vapor and PV along low-level jet.
TCS025TCS025
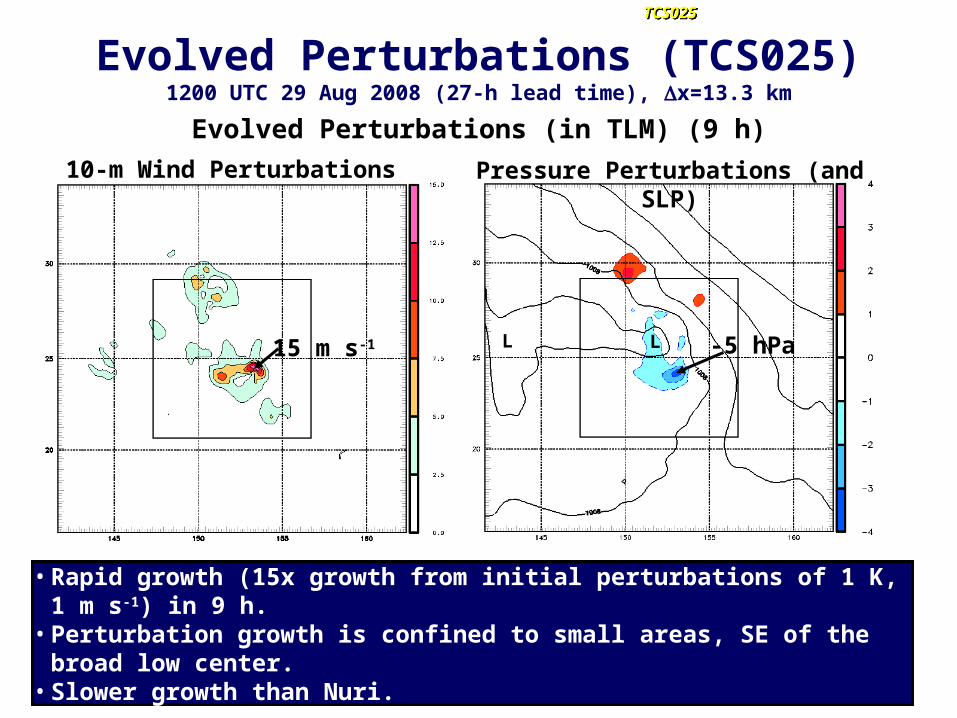
Evolved Perturbations (TCS025)1200 UTC 29 Aug 2008 (27-h lead time), x=13.3 km
15 m s-1 -5 hPa
Evolved Perturbations (in TLM) (9 h)
10-m Wind Perturbations Pressure Perturbations (and SLP)
• Rapid growth (15x growth from initial perturbations of 1 K, 1 m s-1) in 9 h.• Perturbation growth is confined to small areas, SE of the broad low center.• Slower growth than Nuri.
L L
TCS025TCS025
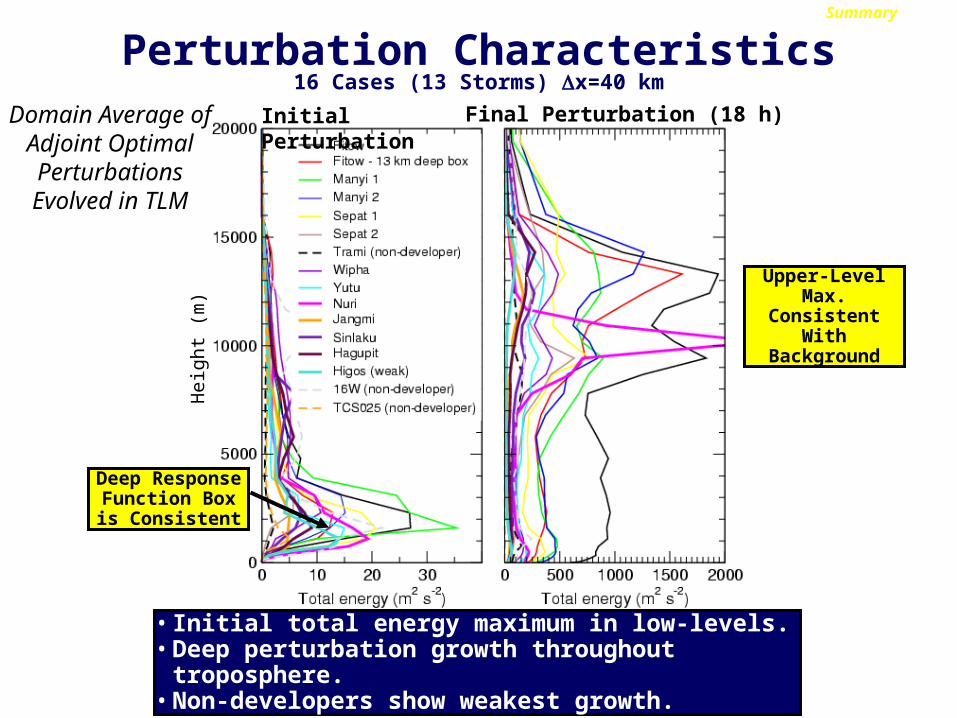
Initial PerturbationDomain Average of Adjoint Optimal Perturbations
Evolved in TLM
Final Perturbation (18 h)
Upper-Level Max. Consistent With
Background
Deep Response Function Box is
Consistent
Perturbation Characteristics16 Cases (13 Storms) x=40 km
• Initial total energy maximum in low-levels.• Deep perturbation growth throughout troposphere.• Non-developers show weakest growth.
Hei
ght
(m)
Summary
• Moist adjoint was successfully applied (real time) during T-PARC/TCS08-Targeted observations and forecasting-Dropsondes from P3 & C130 often sampled sensitive regions
• Moist adjoint provides physically meaningful sensitivities. -Characteristics of both “bottom-up” and “top-down” development-Moisture and temperature show greater sensitivity than winds-Preferred locations of deep convection for intensification
• Significant differences in adjoint sensitivities for 2 genesis cases-Nuri: convectively dominated, vorticity sensitivity bands-TCS025: multi-scale aspects, baroclinic signatures
• Challenges for TC genesis predictability.-Convection introduces inherent uncertainty - motivates need for ensembles-Rapid growth rates: 50% cases show > 10x growth 18 h-1 for 500-m winds
ConclusionsSummary
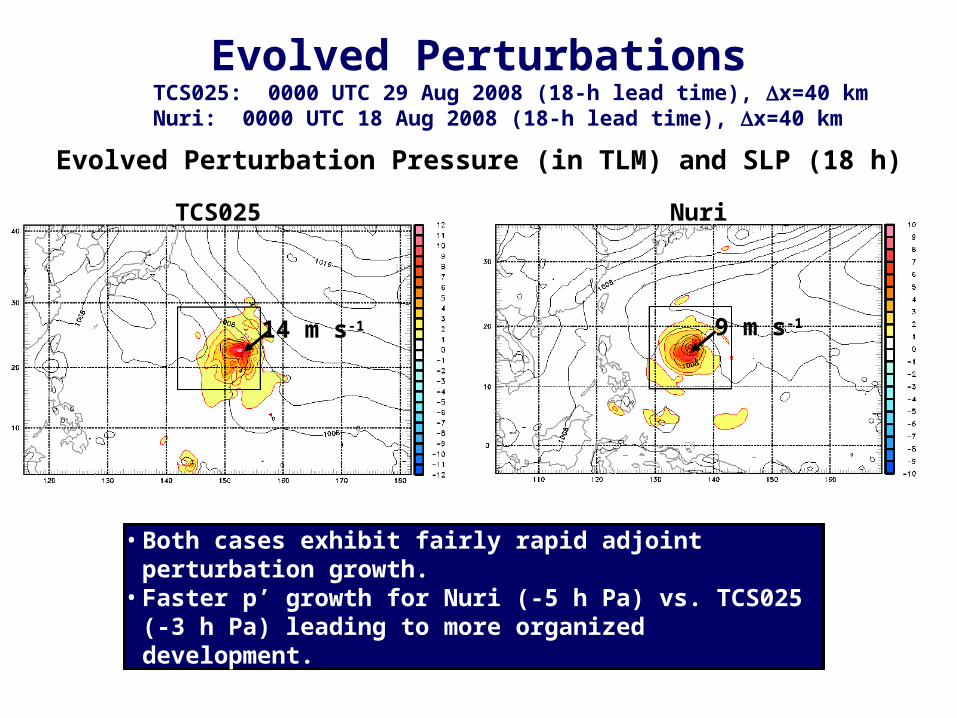
Evolved PerturbationsTCS025: 0000 UTC 29 Aug 2008 (18-h lead time), x=40 kmNuri: 0000 UTC 18 Aug 2008 (18-h lead time), x=40 km
14 m s-1 9 m s-1
• Both cases exhibit fairly rapid adjoint perturbation growth.• Faster p’ growth for Nuri (-5 h Pa) vs. TCS025 (-3 h Pa)
leading to more organized development.
TCS025
Evolved Perturbation Pressure (in TLM) and SLP (18 h)
Nuri
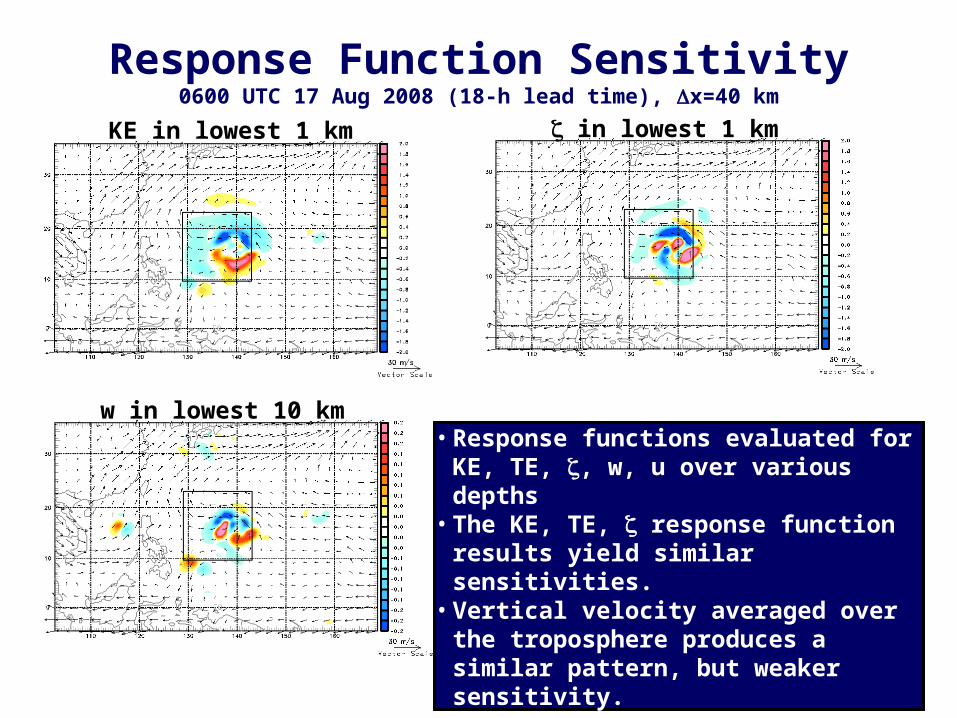
Response Function Sensitivity0600 UTC 17 Aug 2008 (18-h lead time), x=40 km
KE in lowest 1 km in lowest 1 km
w in lowest 10 km• Response functions evaluated for KE,
TE, , w, u over various depths• The KE, TE, response function results
yield similar sensitivities.• Vertical velocity averaged over the
troposphere produces a similar pattern, but weaker sensitivity.

Sinlaku
7 Sept. 00UTC(36h before TD)
10 Sept. 00UTC(36h after TD)
Erratic tracks, little development
Tracks still erratic, more spread.
Most tracks miss Taiwan landfall.
Taiwan landfall more probable.


![An overview of abelian varieties in homotopy theory · An overview of abelian varieties in homotopy theory 181 of finite subgroups [21]. Goerss, Henn, Mahowald and Rezk [17] and](https://img.pdfslide.us/doc/110x75/5f054be27e708231d41242db/an-overview-of-abelian-varieties-in-homotopy-theory-an-overview-of-abelian-varieties.jpg)

![TOPOLOGICAL MODULAR FORMS [after Hopkins, Miller, and ... › TEXTES › 1005.pdf · TOPOLOGICAL MODULAR FORMS [after Hopkins, Miller, and Lurie] by Paul G. GOERSS INTRODUCTION In](https://img.pdfslide.us/doc/110x75/5f0d7e4a7e708231d43aa1aa/topological-modular-forms-after-hopkins-miller-and-a-textes-a-1005pdf.jpg)