Embed Size (px)
Citation preview
A national laboratory of the U.S. Department of EnergyOffice of Energy Efficiency & Renewable Energy
National Renewable Energy Laboratory Innovation for Our Energy Future
BAE/Orion Hybrid Electric Buses at New York City Transit A Generational Comparison R. Barnitt
Technical Report NREL/TP-540-42217 Revised March 2008
NREL is operated by Midwest Research Institute ● Battelle Contract No. DE-AC36-99-GO10337
National Renewable Energy Laboratory1617 Cole Boulevard, Golden, Colorado 80401-3393 303-275-3000 • www.nrel.gov
Operated for the U.S. Department of Energy Office of Energy Efficiency and Renewable Energy by Midwest Research Institute • Battelle
Contract No. DE-AC36-99-GO10337
Technical Report NREL/TP-540-42217 Revised March 2008
BAE/Orion Hybrid Electric Buses at New York City Transit A Generational Comparison R. Barnitt
Prepared under Task No. FC08.3000
NOTICE
This report was prepared as an account of work sponsored by an agency of the United States government. Neither the United States government nor any agency thereof, nor any of their employees, makes any warranty, express or implied, or assumes any legal liability or responsibility for the accuracy, completeness, or usefulness of any information, apparatus, product, or process disclosed, or represents that its use would not infringe privately owned rights. Reference herein to any specific commercial product, process, or service by trade name, trademark, manufacturer, or otherwise does not necessarily constitute or imply its endorsement, recommendation, or favoring by the United States government or any agency thereof. The views and opinions of authors expressed herein do not necessarily state or reflect those of the United States government or any agency thereof.
Available electronically at http://www.osti.gov/bridge
Available for a processing fee to U.S. Department of Energy and its contractors, in paper, from:
U.S. Department of Energy Office of Scientific and Technical Information P.O. Box 62 Oak Ridge, TN 37831-0062 phone: 865.576.8401 fax: 865.576.5728 email: mailto:[email protected]
Available for sale to the public, in paper, from: U.S. Department of Commerce National Technical Information Service 5285 Port Royal Road Springfield, VA 22161 phone: 800.553.6847 fax: 703.605.6900 email: [email protected] online ordering: http://www.ntis.gov/ordering.htm
Printed on paper containing at least 50% wastepaper, including 20% postconsumer waste
ERRATA SHEET NREL REPORT/PROJECT NUMBER: NREL/TP-540-42217
TITLE: BAE/Orion Hybrid Electric Buses at New York City Transit: A Generational Comparison
AUTHOR(S): R. Barnitt
ORIGINAL PUBLICATION DATE: January 2008
DATE OF CORRECTIONS: March 2008
The following corrections were made to this report/document:
6.8% was changed to 5.9% in the following sentences: Page 2: Comparing evaluation year 1 in both cases, the 12-month average fuel economy for the Gen II hybrid buses is 5.9% lower than that of the Gen I hybrid buses. Page 11: Comparing evaluation year 1 in both cases, the 12-month average fuel economy for the Gen II hybrid buses is 5.9% lower than that of the Gen I hybrid buses. Page 19: With similar usage and duty cycle, the Gen II hybrids exhibited a 5.9% lower fuel economy than the Gen I hybrids.
Acknowledgments This evaluation is funded through the Advanced Vehicle Testing Activity, which is managed by Lee Slezak within the U.S. Department of Energy (DOE). All publications on the New York City Transit (NYCT) hybrid bus evaluation will be posted on DOE's Energy Efficiency and Renewable Energy Web site. See the Medium- & Heavy-Duty Vehicles section of the following link: www1.eere.energy.gov/vehiclesandfuels/avta/index.html. This evaluation at NYCT would not have been possible without the support and cooperation of many people. The author wishes to thank each of the following: U.S. Department of Energy Lee Slezak New York City Transit Gordon Coor Danny Ilioiu Gary LaBouff Glenn Maerki Doug Zupo BAE Systems Tom Apalenek Jody Lanfranchi Bart Mancini Steve Tilyou Tom Webb DaimlerChrysler Commercial Buses, N.A. Patrick Scully Battelle Kevin Chandler
iii
Contents Executive Summary........................................................................................................................ 1
Project Design and Data Collection............................................................................................ 1 Evaluation Results ...................................................................................................................... 2
Duty Cycle .............................................................................................................................. 2 Bus Use ................................................................................................................................... 2 Fuel Economy ......................................................................................................................... 2 Total Maintenance Costs......................................................................................................... 3 Propulsion-Related Maintenance Costs .................................................................................. 4 Other Important Maintenance Costs ....................................................................................... 4
Roadcalls..................................................................................................................................... 5 Overview......................................................................................................................................... 5
DOE/NREL Advanced Vehicle Testing Activity ....................................................................... 5 Host Site Profile—NYCT........................................................................................................... 6 Project Design and Data Collection............................................................................................ 7 Vehicle System Descriptions ...................................................................................................... 8
Evaluation Results ........................................................................................................................ 10 Bus Use ..................................................................................................................................... 10 Fuel Economy and Cost ............................................................................................................ 11 Maintenance Cost Analysis....................................................................................................... 12
Total Maintenance Costs....................................................................................................... 13 Propulsion-Related Maintenance Costs ................................................................................ 13
Traction Batteries...................................................................................................................... 15 Brakes ....................................................................................................................................... 16 Preventative Maintenance Inspection ....................................................................................... 17 Roadcall Analysis ..................................................................................................................... 17 Summary of Costs..................................................................................................................... 18
Conclusions................................................................................................................................... 19 Contacts......................................................................................................................................... 19 References and Related Reports ................................................................................................... 23
iv
Executive Summary This report is part of a series of evaluations from the U.S. Department of Energy (DOE). DOE, through the National Renewable Energy Laboratory (NREL), has been tracking and evaluating new propulsion systems in transit buses and trucks for more than 10 years using an established and documented evaluation protocol. These DOE/NREL vehicle evaluations are a part of the Advanced Vehicle Testing Activity (AVTA), which supports DOE’s Vehicle Technologies Program. The role of AVTA is to help bridge the gap between research and development (R&D) and commercial availability for advanced vehicle technologies that reduce petroleum use while meeting air quality standards. AVTA supports DOE’s Vehicle Technologies Program by examining market factors and customer requirements and evaluating the performance and durability of alternative fuel and advanced technology vehicles in fleet applications. NREL’s Fleet Test and Evaluation (FT&E) Team conducts evaluations primarily under support from AVTA, but also with support from other DOE programs focused on nonpetroleum-based and advanced petroleum-based fuels. DOE/NREL evaluated the original 10 prototype diesel-hybrid buses from Orion and BAE Systems (model Orion VI buses) operated at New York City Transit (NYCT). That evaluation was reported in July 2002 and provided results from the prototype buses from 1998 through 2001. The next report focused on 10 new compressed natural gas (CNG) and 10 next generation diesel hybrid electric (equipped with BAE Systems’ HybriDrive propulsion system) buses from an order group of 125 (Gen I) at NYCT. This was reported in November 2006. Both the CNG and hybrid propulsion systems are alternatives to standard diesel buses and allow for reductions in petroleum use and emissions (usually focused on reductions of particulate matter and oxides of nitrogen). In this evaluation, the focus is on hybrid-electric transit buses (equipped with BAE Systems’ HybriDrive propulsion system) purchased by NYCT in an order group of 200 (Gen II), and their performance during their first year of service.
Project Design and Data Collection The primary focus of this evaluation is the first-year service performance of hybrid-electric transit buses purchased by NYCT in an order group of 200 (Gen II). This latest generation exhibits several improvements, which allows an evolutionary comparison to similar hybrid-electric transit buses purchased by NYCT in an order group of 125 (Gen I). Gen I hybrids have now been in service over 3 years, and operational data collection has spanned 2 of those 3. In this report, Gen II hybrids are compared to Gen I hybrids during their first “evaluation year,” and the performance of Gen I hybrids is evaluated for their second evaluation year. The evaluation periods used for buses considered in this report are:
• Hybrid Gen II (evaluation year 1): February 2006 through January 2007 • Hybrid Gen I (evaluation year 1): October 2004 through September 2005 • Hybrid Gen I (evaluation year 2): October 2005 through September 2006.
1
In addition, brake reline data from the 10 CNG Orion VII buses evaluated previously is compared to brake reline data from the 10 Gen I hybrid buses. This approach assesses the benefits of regenerative braking, realized in less frequent brake relines and concomitant reduced maintenance costs. Gen II hybrids are not considered due to insufficient mileage to conduct a brake reline. This evaluation of the Gen II and Gen I Orion VII hybrid buses compares buses with the same bus platform but propulsion system modifications during a snapshot of each group’s respective evaluation year 1. The Gen II and Gen I hybrid buses have been operated on similar duty-cycles and the maintenance practices at the two depots appear to be similar. The evaluation team selected 10 vehicles from each study group for analysis; which was determined to be a sufficient number to provide some degree of statistical significance to the results obtained.
Evaluation Results The following results and discussion focus only on the evaluated study bus groups. Duty Cycle Average speed has been used as an indicator of the general duty cycle for the evaluation locations. The average speed for the Gen II hybrid buses at Manhattanville (MTV) Depot was 6.07 mph for evaluation year 1. The average speed for the Gen I hybrid buses at Mother Clara Hale Depot was 6.13 mph and 5.70 mph for evaluation years 1 and 2, respectively. The average speeds are comparable between the two hybrid bus groups and evaluation locations. The buses at the two depots were randomly dispatched on all standard bus routes. Bus Use The overall 12-month average monthly miles per bus for the Gen II hybrids (2,134) is about 10% lower than for the Gen I hybrids (2,370) and CNG buses (2,295). This is primarily a function of depot size and routes served. Fuel Economy The hybrid study fleet fuel consumption and economy data are given in Table ES- 1. Comparing evaluation year 1 in both cases, the 12-month average fuel economy for the Gen II hybrid buses is 5.9% lower than that of the Gen I hybrid buses. This difference could result from the employment of EGR in the 2004 model year Gen II hybrid bus engines, versus the non-EGR 2002 model year Gen I engines.
Table ES- 1: Gen II and Gen I Hybrid Bus Fuel Use and Economy
Bus Study Group Evaluation
Year Number Mileage (Fuel Base)
Gallons Consumed
Miles per
Gallon Gen II Hybrid 1 246,926 82,213 3.00 Gen I Hybrid 1 258,826 81,104 3.19 Gen I Hybrid 2 263,130 81,677 3.22
2
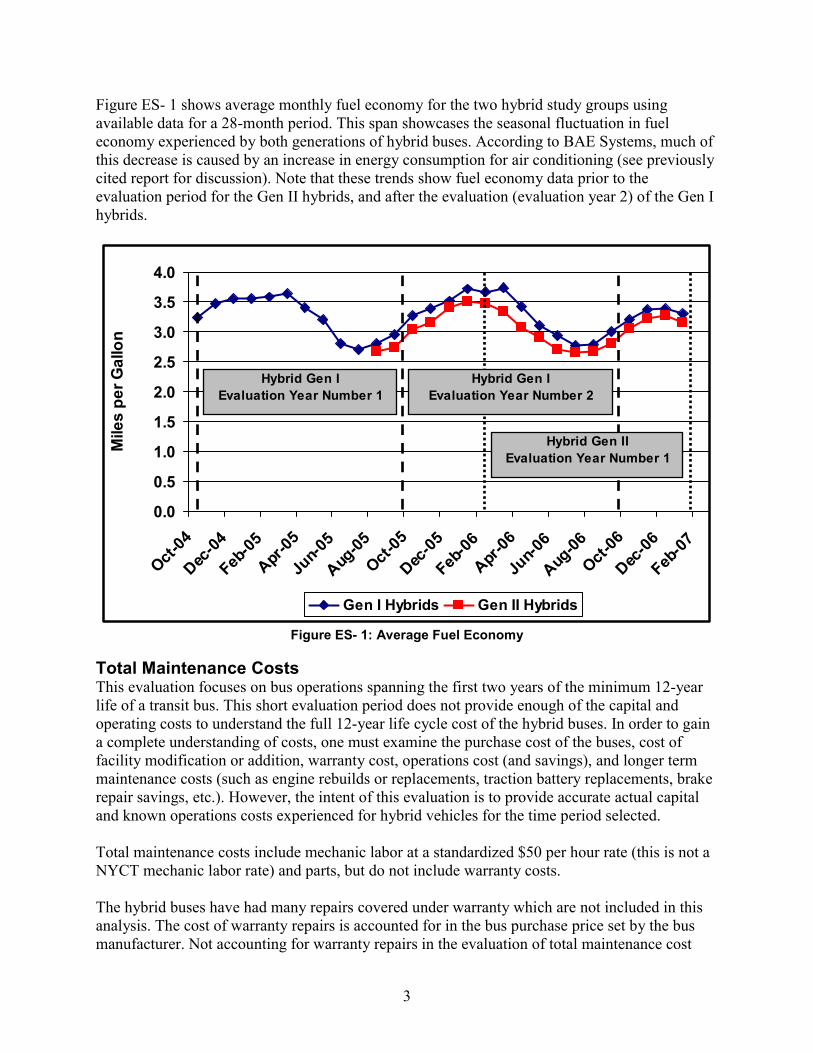
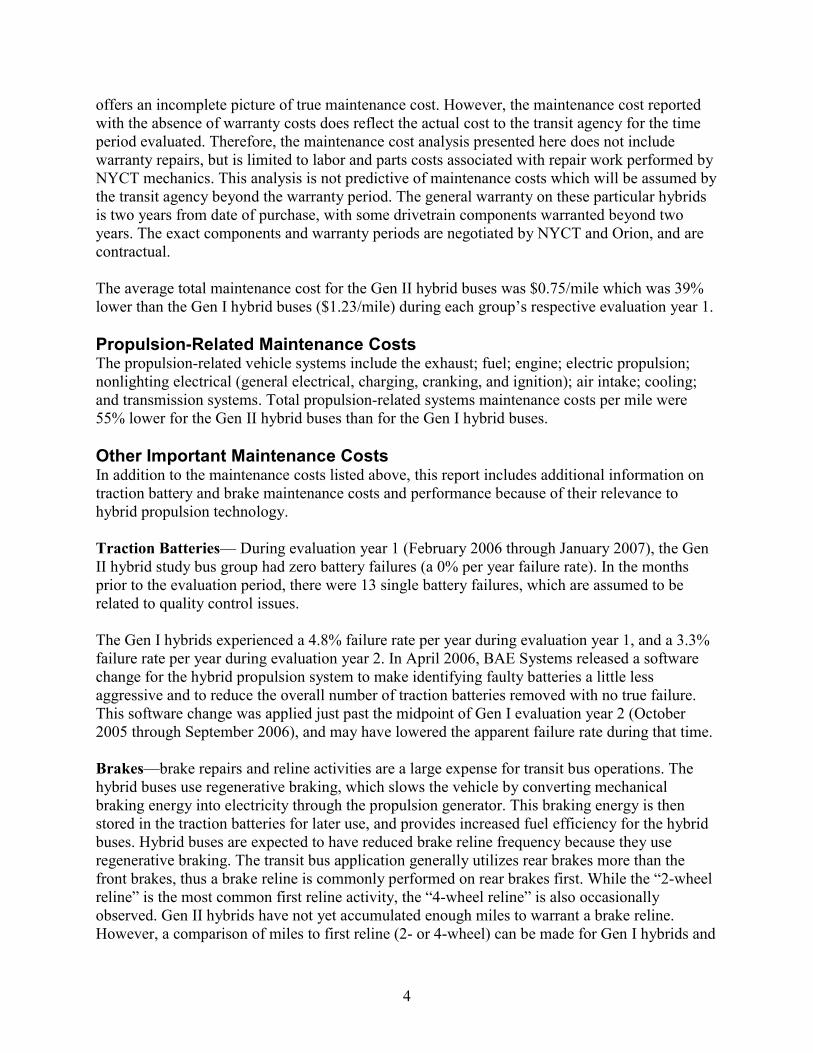
Figure ES- 1 shows average monthly fuel economy for the two hybrid study groups using available data for a 28-month period. This span showcases the seasonal fluctuation in fuel economy experienced by both generations of hybrid buses. According to BAE Systems, much of this decrease is caused by an increase in energy consumption for air conditioning (see previously cited report for discussion). Note that these trends show fuel economy data prior to the evaluation period for the Gen II hybrids, and after the evaluation (evaluation year 2) of the Gen I hybrids.
0.0
0.5
1.0
1.5
2.0
2.5
3.0
3.5
4.0
Oct-04
Dec-04
Feb-05
Apr-05
Jun-0
5
Aug-05
Oct-05
Dec-05
Feb-06
Apr-06
Jun-0
6
Aug-06
Oct-06
Dec-06
Feb-07
Mile
s pe
r Gal
lon
Gen I Hybrids Gen II Hybrids
Hybrid Gen IEvaluation Year Number 1
Hybrid Gen IEvaluation Year Number 2
Hybrid Gen IIEvaluation Year Number 1
Figure ES- 1: Average Fuel Economy
Total Maintenance Costs This evaluation focuses on bus operations spanning the first two years of the minimum 12-year life of a transit bus. This short evaluation period does not provide enough of the capital and operating costs to understand the full 12-year life cycle cost of the hybrid buses. In order to gain a complete understanding of costs, one must examine the purchase cost of the buses, cost of facility modification or addition, warranty cost, operations cost (and savings), and longer term maintenance costs (such as engine rebuilds or replacements, traction battery replacements, brake repair savings, etc.). However, the intent of this evaluation is to provide accurate actual capital and known operations costs experienced for hybrid vehicles for the time period selected. Total maintenance costs include mechanic labor at a standardized $50 per hour rate (this is not a NYCT mechanic labor rate) and parts, but do not include warranty costs. The hybrid buses have had many repairs covered under warranty which are not included in this analysis. The cost of warranty repairs is accounted for in the bus purchase price set by the bus manufacturer. Not accounting for warranty repairs in the evaluation of total maintenance cost
3
offers an incomplete picture of true maintenance cost. However, the maintenance cost reported with the absence of warranty costs does reflect the actual cost to the transit agency for the time period evaluated. Therefore, the maintenance cost analysis presented here does not include warranty repairs, but is limited to labor and parts costs associated with repair work performed by NYCT mechanics. This analysis is not predictive of maintenance costs which will be assumed by the transit agency beyond the warranty period. The general warranty on these particular hybrids is two years from date of purchase, with some drivetrain components warranted beyond two years. The exact components and warranty periods are negotiated by NYCT and Orion, and are contractual. The average total maintenance cost for the Gen II hybrid buses was $0.75/mile which was 39% lower than the Gen I hybrid buses ($1.23/mile) during each group’s respective evaluation year 1. Propulsion-Related Maintenance Costs The propulsion-related vehicle systems include the exhaust; fuel; engine; electric propulsion; nonlighting electrical (general electrical, charging, cranking, and ignition); air intake; cooling; and transmission systems. Total propulsion-related systems maintenance costs per mile were 55% lower for the Gen II hybrid buses than for the Gen I hybrid buses. Other Important Maintenance Costs In addition to the maintenance costs listed above, this report includes additional information on traction battery and brake maintenance costs and performance because of their relevance to hybrid propulsion technology. Traction Batteries— During evaluation year 1 (February 2006 through January 2007), the Gen II hybrid study bus group had zero battery failures (a 0% per year failure rate). In the months prior to the evaluation period, there were 13 single battery failures, which are assumed to be related to quality control issues. The Gen I hybrids experienced a 4.8% failure rate per year during evaluation year 1, and a 3.3% failure rate per year during evaluation year 2. In April 2006, BAE Systems released a software change for the hybrid propulsion system to make identifying faulty batteries a little less aggressive and to reduce the overall number of traction batteries removed with no true failure. This software change was applied just past the midpoint of Gen I evaluation year 2 (October 2005 through September 2006), and may have lowered the apparent failure rate during that time. Brakes—brake repairs and reline activities are a large expense for transit bus operations. The hybrid buses use regenerative braking, which slows the vehicle by converting mechanical braking energy into electricity through the propulsion generator. This braking energy is then stored in the traction batteries for later use, and provides increased fuel efficiency for the hybrid buses. Hybrid buses are expected to have reduced brake reline frequency because they use regenerative braking. The transit bus application generally utilizes rear brakes more than the front brakes, thus a brake reline is commonly performed on rear brakes first. While the “2-wheel reline” is the most common first reline activity, the “4-wheel reline” is also occasionally observed. Gen II hybrids have not yet accumulated enough miles to warrant a brake reline. However, a comparison of miles to first reline (2- or 4-wheel) can be made for Gen I hybrids and
4
the CNG buses from the previous evaluation. The Gen I hybrid buses (average 55,067 miles) accumulated more than two times the mileage of the CNG buses (25,554 miles) before requiring their first brake reline. This ~2x trend is similar when comparing first 2-wheel relines or first 4-wheel relines between groups. NYCT expects nonhybrid buses to have a four-wheel brake reline every 18,000 miles on average.
Roadcalls In this report, a roadcall (RC) is defined as an on-road failure of an in-service bus, which results in a bus being taken out of service or replaced on-route. RCs are a direct indicator of reliability for transit buses. Miles between RC (MBRC) is a typical industry measurement for RC performance for transit buses. NYCT expects transit buses to meet or exceed a rate of 4,000 MBRC for all RCs. The Gen II hybrid buses had nearly 5,445 MBRC, while the Gen I hybrid buses had around 5,188 MBRC during each group’s respective evaluation year 1. For RCs related only to the propulsion system, the Gen II hybrid buses are at 8,678 MBRC and the Gen I hybrid buses are at 8,153 MBRC during each group’s respective evaluation year 1.
Overview
DOE/NREL Advanced Vehicle Testing Activity The role of AVTA is to help bridge the gap between research and development (R&D) and commercial availability for advanced vehicle technologies that reduce petroleum use while meeting air quality standards. AVTA supports DOE’s Vehicle Technologies Program by examining market factors and customer requirements and evaluating the performance and durability of alternative fuel and advanced technology vehicles in fleet applications. NREL’s Fleet Test and Evaluation (FT&E) Team conducts evaluations primarily under support from AVTA, but also with support from other DOE programs focused on nonpetroleum-based and advanced petroleum-based fuels. The main objective of FT&E projects is to conduct comprehensive, unbiased evaluations of advanced technology vehicles. Data collected and analyzed include the operations, maintenance, performance, cost, and emissions characteristics of advanced technology vehicles and comparable conventional technology in fleets operating at the same site. By comparing available advanced and conventional technology vehicles, FT&E evaluations help fleet owners and operators make informed purchasing decisions. The evaluations also provide valuable data to DOE about the maturity of the technology being assessed. The FT&E team recently conducted—or is in the process of conducting—several evaluations of advanced propulsion heavy-duty vehicles (see Table 1). For information on these and other evaluations involving advanced technologies or alternative fuels such as biodiesel and Fischer-Tropsch diesel, visit www.nrel.gov/vehiclesandfuels/fleettest.
5
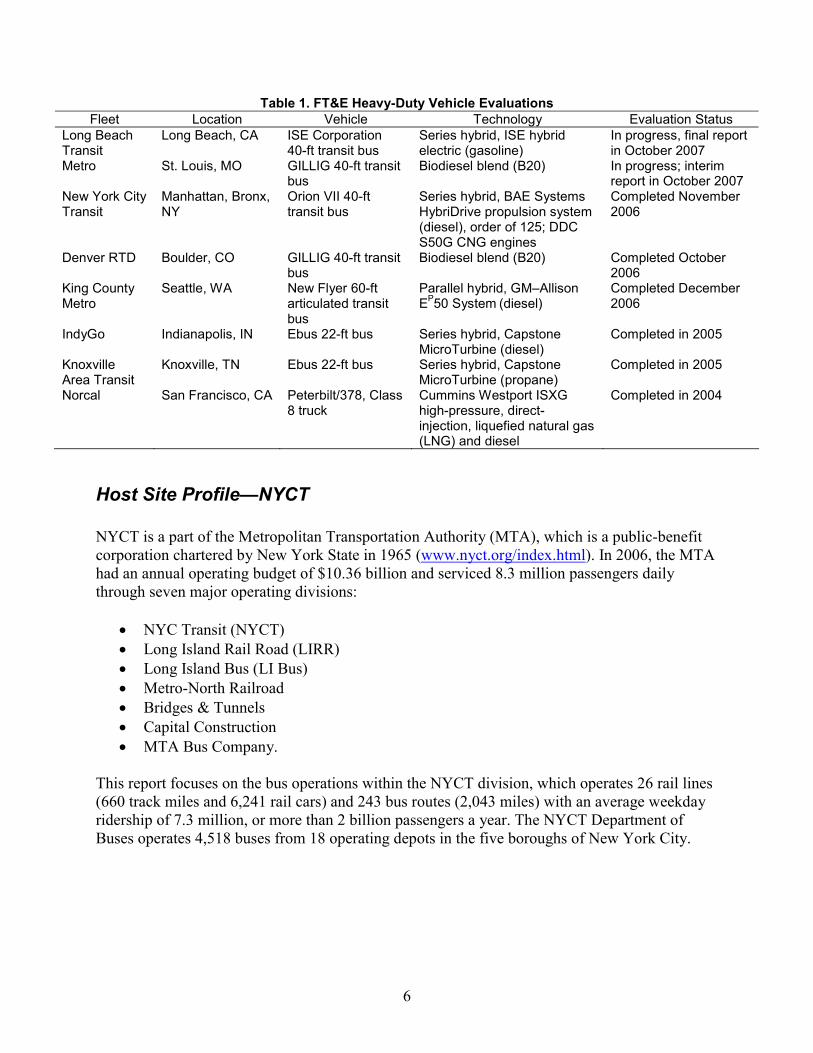
Table 1. FT&E Heavy-Duty Vehicle Evaluations Fleet Location Vehicle Technology Evaluation Status
Long Beach Transit
Long Beach, CA ISE Corporation 40-ft transit bus
Series hybrid, ISE hybrid electric (gasoline)
In progress, final report in October 2007
Metro St. Louis, MO GILLIG 40-ft transit bus
Biodiesel blend (B20) In progress; interim report in October 2007
New York City Transit
Manhattan, Bronx, NY
Orion VII 40-ft transit bus
Series hybrid, BAE Systems HybriDrive propulsion system (diesel), order of 125; DDC S50G CNG engines
Completed November 2006
Denver RTD Boulder, CO GILLIG 40-ft transit bus
Biodiesel blend (B20) Completed October 2006
King County Metro
Seattle, WA New Flyer 60-ft articulated transit bus
Parallel hybrid, GM–Allison EP50 System (diesel)
Completed December 2006
IndyGo Indianapolis, IN Ebus 22-ft bus Series hybrid, Capstone MicroTurbine (diesel)
Completed in 2005
Knoxville Area Transit
Knoxville, TN Ebus 22-ft bus Series hybrid, Capstone MicroTurbine (propane)
Completed in 2005
Norcal San Francisco, CA Peterbilt/378, Class 8 truck
Cummins Westport ISXG high-pressure, direct- injection, liquefied natural gas (LNG) and diesel
Completed in 2004
Host Site Profile—NYCT NYCT is a part of the Metropolitan Transportation Authority (MTA), which is a public-benefit corporation chartered by New York State in 1965 (www.nyct.org/index.html). In 2006, the MTA had an annual operating budget of $10.36 billion and serviced 8.3 million passengers daily through seven major operating divisions:
• NYC Transit (NYCT) • Long Island Rail Road (LIRR) • Long Island Bus (LI Bus) • Metro-North Railroad • Bridges & Tunnels • Capital Construction • MTA Bus Company.
This report focuses on the bus operations within the NYCT division, which operates 26 rail lines (660 track miles and 6,241 rail cars) and 243 bus routes (2,043 miles) with an average weekday ridership of 7.3 million, or more than 2 billion passengers a year. The NYCT Department of Buses operates 4,518 buses from 18 operating depots in the five boroughs of New York City.
6
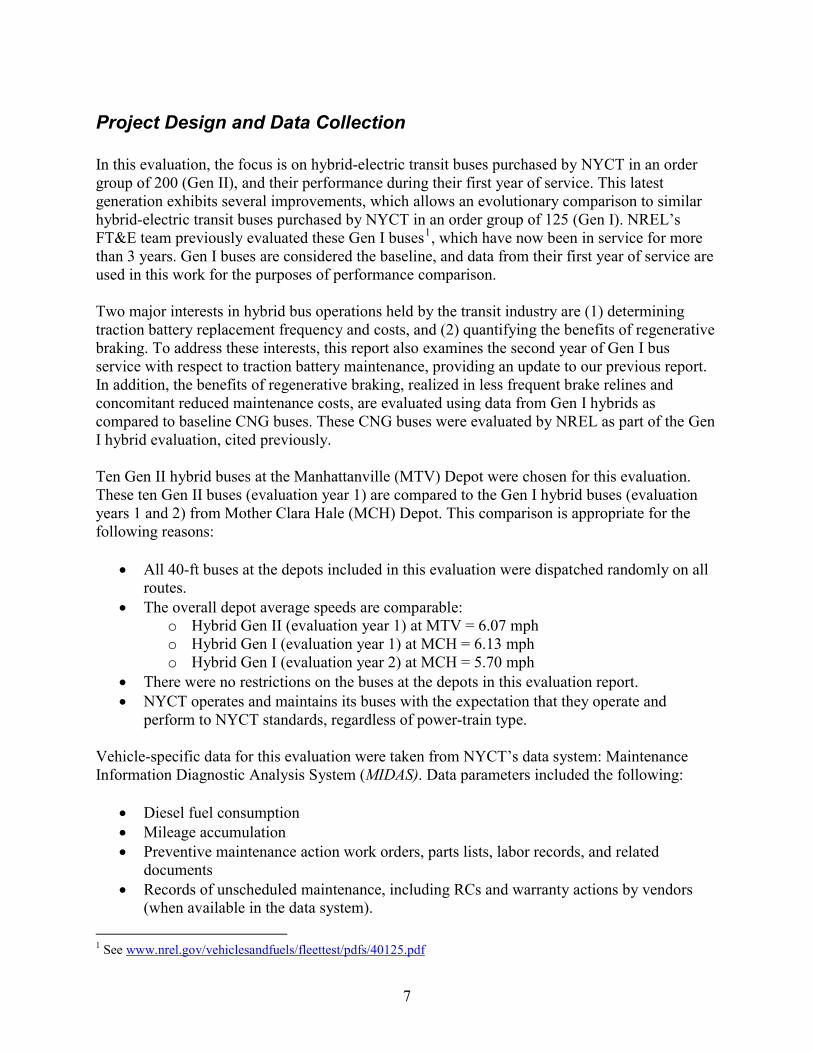
Project Design and Data Collection In this evaluation, the focus is on hybrid-electric transit buses purchased by NYCT in an order group of 200 (Gen II), and their performance during their first year of service. This latest generation exhibits several improvements, which allows an evolutionary comparison to similar hybrid-electric transit buses purchased by NYCT in an order group of 125 (Gen I). NREL’s FT&E team previously evaluated these Gen I buses1, which have now been in service for more than 3 years. Gen I buses are considered the baseline, and data from their first year of service are used in this work for the purposes of performance comparison. Two major interests in hybrid bus operations held by the transit industry are (1) determining traction battery replacement frequency and costs, and (2) quantifying the benefits of regenerative braking. To address these interests, this report also examines the second year of Gen I bus service with respect to traction battery maintenance, providing an update to our previous report. In addition, the benefits of regenerative braking, realized in less frequent brake relines and concomitant reduced maintenance costs, are evaluated using data from Gen I hybrids as compared to baseline CNG buses. These CNG buses were evaluated by NREL as part of the Gen I hybrid evaluation, cited previously. Ten Gen II hybrid buses at the Manhattanville (MTV) Depot were chosen for this evaluation. These ten Gen II buses (evaluation year 1) are compared to the Gen I hybrid buses (evaluation years 1 and 2) from Mother Clara Hale (MCH) Depot. This comparison is appropriate for the following reasons:
• All 40-ft buses at the depots included in this evaluation were dispatched randomly on all routes.
• The overall depot average speeds are comparable: o Hybrid Gen II (evaluation year 1) at MTV = 6.07 mph o Hybrid Gen I (evaluation year 1) at MCH = 6.13 mph o Hybrid Gen I (evaluation year 2) at MCH = 5.70 mph
• There were no restrictions on the buses at the depots in this evaluation report. • NYCT operates and maintains its buses with the expectation that they operate and
perform to NYCT standards, regardless of power-train type. Vehicle-specific data for this evaluation were taken from NYCT’s data system: Maintenance Information Diagnostic Analysis System (MIDAS). Data parameters included the following:
• Diesel fuel consumption • Mileage accumulation • Preventive maintenance action work orders, parts lists, labor records, and related
documents • Records of unscheduled maintenance, including RCs and warranty actions by vendors
(when available in the data system). 1 See www.nrel.gov/vehiclesandfuels/fleettest/pdfs/40125.pdf
7

The evaluation periods used for buses considered in this report are
• Hybrid Gen II (evaluation year 1): February 2006 through January 2007 • Hybrid Gen I (evaluation year 1): October 2004 through September 2005 • Hybrid Gen I (evaluation year 2): October 2005 through September 2006.
Vehicle System Descriptions NYCT’s hybrid buses are built by Orion Bus Industries (a part of DaimlerChrysler Commercial Buses North America) and use the BAE Systems HybriDrive propulsion system (see Figure 1).
A: A 5.9-L diesel engine runs at an optimal controlled speed
and is connected to a generator to produce electrical power for the drive motor and batteries.
B: The electric drive motor drives the vehicle and acts as a generator to capture energy during braking.
C: The batteries supply power during acceleration and hill climbing and store energy recovered during regenerative braking.
D: The propulsion control system manages the entire system and optimizes performance for emissions, fuel economy, and power. Figure 1. BAE Systems HybriDrive Propulsion System
In this series hybrid electric system, a downsized diesel engine running at an optimal controlled speed is connected to a generator that produces electricity for the electric drive motor and batteries. The electric drive motor drives the vehicle and acts as a generator to capture energy during regenerative braking. The batteries supply additional power during acceleration and hill climbing and store energy recovered during regenerative braking and idling. The battery *optimization subsystem monitors and maintains the charge of each individual battery. The propulsion control subsystem manages the entire system and optimizes performance for emissions, fuel economy, and power. Additional details about the hybrid system are presented in Table 2.
8
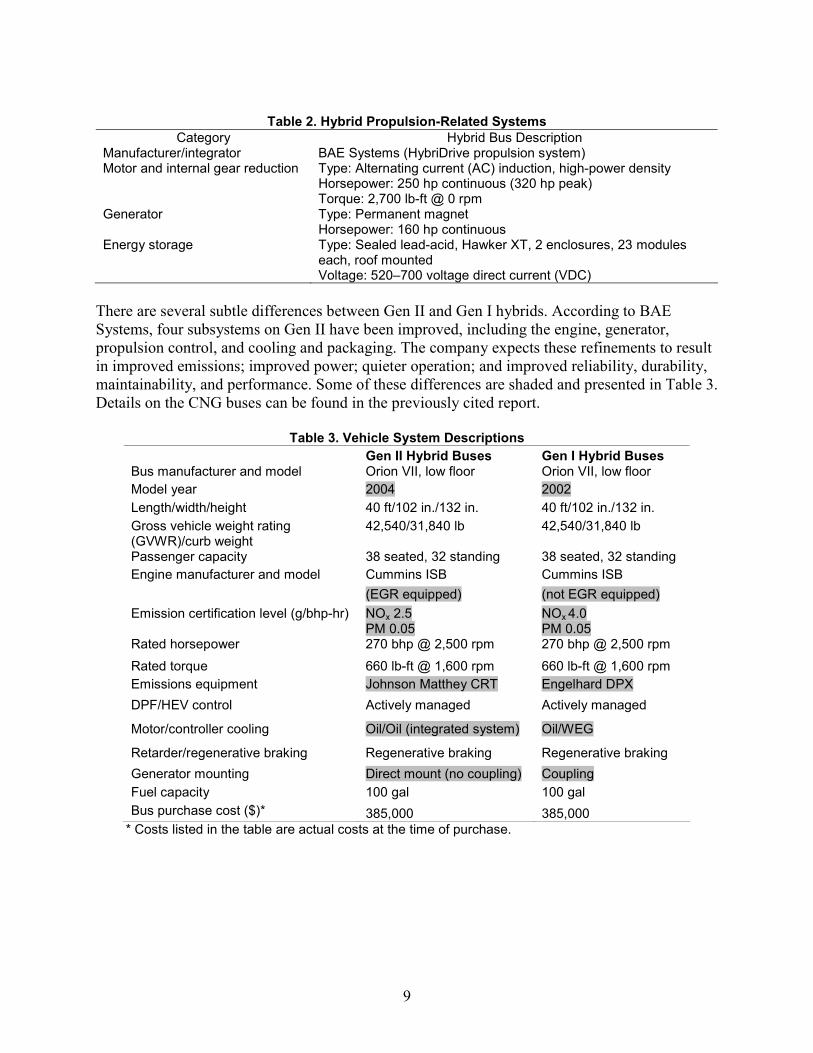
Table 2. Hybrid Propulsion-Related Systems
Category Hybrid Bus Description Manufacturer/integrator BAE Systems (HybriDrive propulsion system) Motor and internal gear reduction Type: Alternating current (AC) induction, high-power density
Horsepower: 250 hp continuous (320 hp peak) Torque: 2,700 lb-ft @ 0 rpm
Generator Type: Permanent magnet Horsepower: 160 hp continuous
Energy storage Type: Sealed lead-acid, Hawker XT, 2 enclosures, 23 modules each, roof mounted Voltage: 520–700 voltage direct current (VDC)
There are several subtle differences between Gen II and Gen I hybrids. According to BAE Systems, four subsystems on Gen II have been improved, including the engine, generator, propulsion control, and cooling and packaging. The company expects these refinements to result in improved emissions; improved power; quieter operation; and improved reliability, durability, maintainability, and performance. Some of these differences are shaded and presented in Table 3. Details on the CNG buses can be found in the previously cited report.
Table 3. Vehicle System Descriptions Gen II Hybrid Buses Gen I Hybrid Buses
Bus manufacturer and model Orion VII, low floor Orion VII, low floor Model year 2004 2002 Length/width/height 40 ft/102 in./132 in. 40 ft/102 in./132 in. Gross vehicle weight rating (GVWR)/curb weight
42,540/31,840 lb 42,540/31,840 lb
Passenger capacity 38 seated, 32 standing 38 seated, 32 standing Cummins ISB Cummins ISB Engine manufacturer and model (EGR equipped) (not EGR equipped)
Emission certification level (g/bhp-hr) NOx 2.5 PM 0.05
NOx 4.0 PM 0.05
Rated horsepower 270 bhp @ 2,500 rpm 270 bhp @ 2,500 rpm Rated torque 660 lb-ft @ 1,600 rpm 660 lb-ft @ 1,600 rpm Emissions equipment Johnson Matthey CRT Engelhard DPX DPF/HEV control Actively managed Actively managed
Motor/controller cooling Oil/Oil (integrated system) Oil/WEG
Retarder/regenerative braking Regenerative braking Regenerative braking Generator mounting Direct mount (no coupling) Coupling Fuel capacity 100 gal 100 gal Bus purchase cost ($)* 385,000 385,000
* Costs listed in the table are actual costs at the time of purchase.
9
Evaluation Results
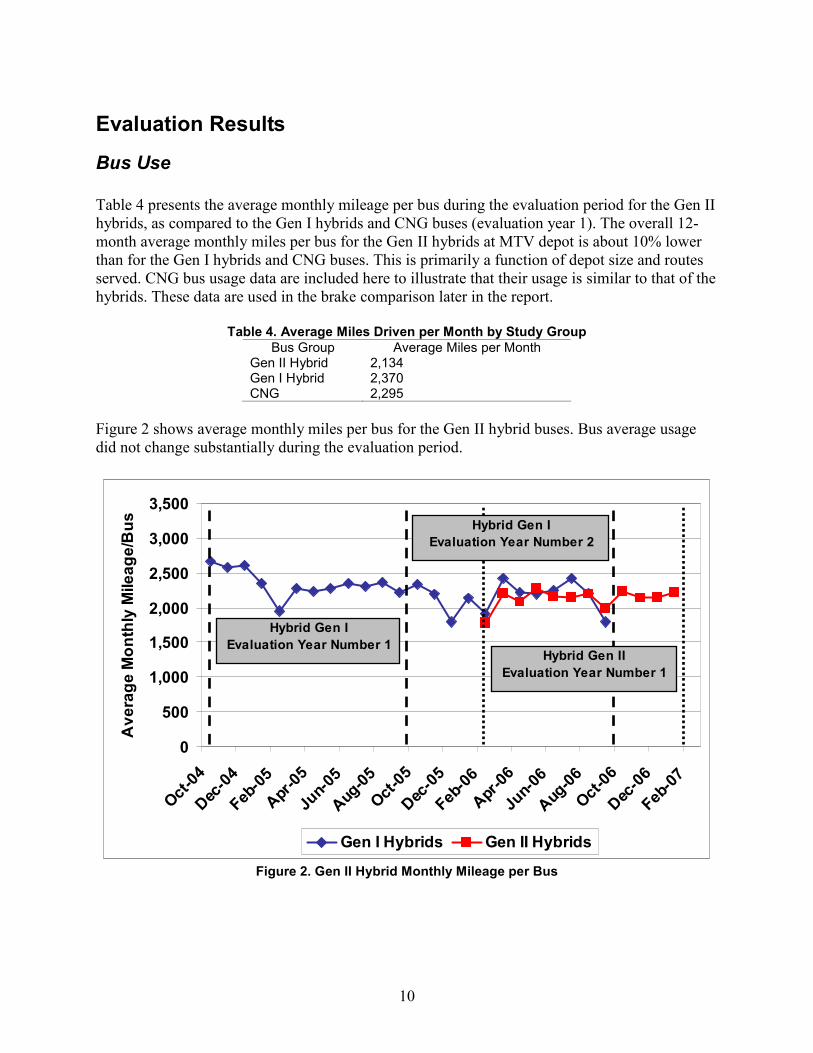
Bus Use Table 4 presents the average monthly mileage per bus during the evaluation period for the Gen II hybrids, as compared to the Gen I hybrids and CNG buses (evaluation year 1). The overall 12-month average monthly miles per bus for the Gen II hybrids at MTV depot is about 10% lower than for the Gen I hybrids and CNG buses. This is primarily a function of depot size and routes served. CNG bus usage data are included here to illustrate that their usage is similar to that of the hybrids. These data are used in the brake comparison later in the report.
Table 4. Average Miles Driven per Month by Study Group Bus Group Average Miles per Month
Gen II Hybrid 2,134 Gen I Hybrid 2,370 CNG 2,295
Figure 2 shows average monthly miles per bus for the Gen II hybrid buses. Bus average usage did not change substantially during the evaluation period.
0
500
1,000
1,500
2,000
2,500
3,000
3,500
Oct-04
Dec-04
Feb-05
Apr-05
Jun-0
5
Aug-05
Oct-05
Dec-05
Feb-06
Apr-06
Jun-0
6
Aug-06
Oct-06
Dec-06
Feb-07
Ave
rage
Mon
thly
Mile
age/
Bus
Gen I Hybrids Gen II Hybrids
Hybrid Gen IEvaluation Year Number 1
Hybrid Gen IEvaluation Year Number 2
Hybrid Gen IIEvaluation Year Number 1
Figure 2. Gen II Hybrid Monthly Mileage per Bus
10
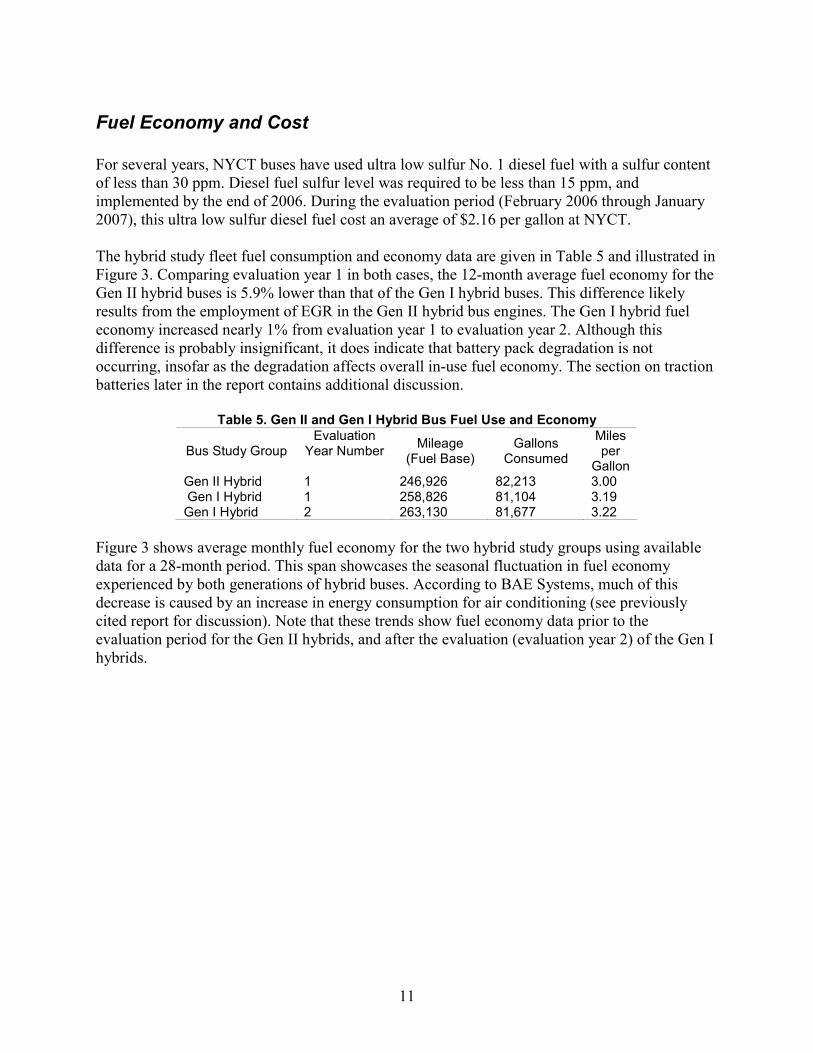
Fuel Economy and Cost For several years, NYCT buses have used ultra low sulfur No. 1 diesel fuel with a sulfur content of less than 30 ppm. Diesel fuel sulfur level was required to be less than 15 ppm, and implemented by the end of 2006. During the evaluation period (February 2006 through January 2007), this ultra low sulfur diesel fuel cost an average of $2.16 per gallon at NYCT. The hybrid study fleet fuel consumption and economy data are given in Table 5 and illustrated in Figure 3. Comparing evaluation year 1 in both cases, the 12-month average fuel economy for the Gen II hybrid buses is 5.9% lower than that of the Gen I hybrid buses. This difference likely results from the employment of EGR in the Gen II hybrid bus engines. The Gen I hybrid fuel economy increased nearly 1% from evaluation year 1 to evaluation year 2. Although this difference is probably insignificant, it does indicate that battery pack degradation is not occurring, insofar as the degradation affects overall in-use fuel economy. The section on traction batteries later in the report contains additional discussion.
Table 5. Gen II and Gen I Hybrid Bus Fuel Use and Economy
Bus Study Group Evaluation
Year Number Mileage (Fuel Base)
Gallons Consumed
Miles per
Gallon Gen II Hybrid 1 246,926 82,213 3.00 Gen I Hybrid 1 258,826 81,104 3.19 Gen I Hybrid 2 263,130 81,677 3.22
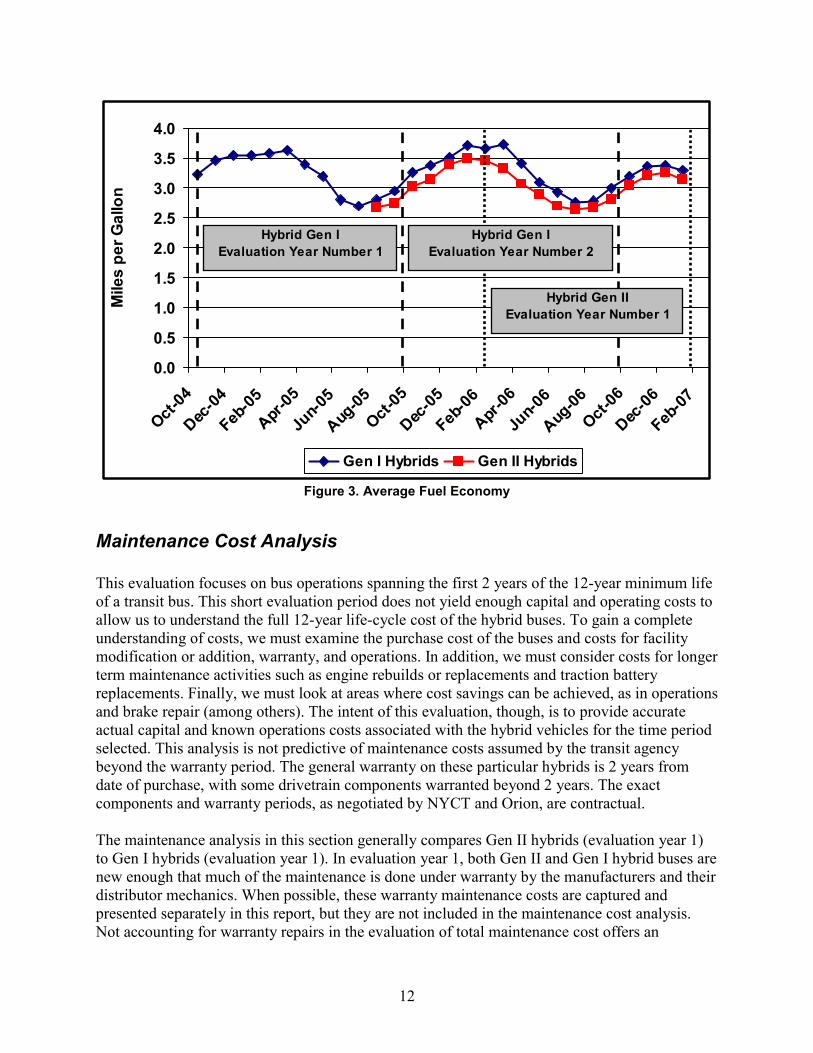
Figure 3 shows average monthly fuel economy for the two hybrid study groups using available data for a 28-month period. This span showcases the seasonal fluctuation in fuel economy experienced by both generations of hybrid buses. According to BAE Systems, much of this decrease is caused by an increase in energy consumption for air conditioning (see previously cited report for discussion). Note that these trends show fuel economy data prior to the evaluation period for the Gen II hybrids, and after the evaluation (evaluation year 2) of the Gen I hybrids.
11
0.0
0.5
1.0
1.5
2.0
2.5
3.0
3.5
4.0
Oct-04
Dec-04
Feb-05
Apr-05
Jun-0
5
Aug-05
Oct-05
Dec-05
Feb-06
Apr-06
Jun-0
6
Aug-06
Oct-06
Dec-06
Feb-07
Mile
s pe
r Gal
lon
Gen I Hybrids Gen II Hybrids
Hybrid Gen IEvaluation Year Number 1
Hybrid Gen IEvaluation Year Number 2
Hybrid Gen IIEvaluation Year Number 1
Figure 3. Average Fuel Economy
Maintenance Cost Analysis This evaluation focuses on bus operations spanning the first 2 years of the 12-year minimum life of a transit bus. This short evaluation period does not yield enough capital and operating costs to allow us to understand the full 12-year life-cycle cost of the hybrid buses. To gain a complete understanding of costs, we must examine the purchase cost of the buses and costs for facility modification or addition, warranty, and operations. In addition, we must consider costs for longer term maintenance activities such as engine rebuilds or replacements and traction battery replacements. Finally, we must look at areas where cost savings can be achieved, as in operations and brake repair (among others). The intent of this evaluation, though, is to provide accurate actual capital and known operations costs associated with the hybrid vehicles for the time period selected. This analysis is not predictive of maintenance costs assumed by the transit agency beyond the warranty period. The general warranty on these particular hybrids is 2 years from date of purchase, with some drivetrain components warranted beyond 2 years. The exact components and warranty periods, as negotiated by NYCT and Orion, are contractual. The maintenance analysis in this section generally compares Gen II hybrids (evaluation year 1) to Gen I hybrids (evaluation year 1). In evaluation year 1, both Gen II and Gen I hybrid buses are new enough that much of the maintenance is done under warranty by the manufacturers and their distributor mechanics. When possible, these warranty maintenance costs are captured and presented separately in this report, but they are not included in the maintenance cost analysis. Not accounting for warranty repairs in the evaluation of total maintenance cost offers an
12
incomplete picture of true maintenance cost. Even with warranty costs absent, however, this analysis reflects the actual cost to the transit agency during the time period selected. The maintenance costs have been collected in a similar way for each study group. The duty cycle and maintenance practices at MTV and MCH depots are similar and do allow a comparison between the Gen II and Gen I hybrid buses. All work orders and parts information available were collected for the study buses. The maintenance analysis discussions include only maintenance data from the respective evaluation periods. Two major interests in hybrid bus operations held by the transit industry are (1) determining traction battery replacement frequency and costs, and (2) quantifying the benefits of regenerative braking. Consequently, this report also examines the second year of Gen I bus service with respect to traction battery maintenance, providing an update to our previous report (see footnote 2). In addition, the benefits of regenerative braking, realized in less frequent brake relines and concomitant reduced maintenance costs, are evaluated using data from Gen I hybrids as compared to baseline CNG buses. Total Maintenance Costs This cost category includes the costs of parts and hourly labor costs of $50 per hour, and does not include warranty costs. Cost per mile is calculated as follows:
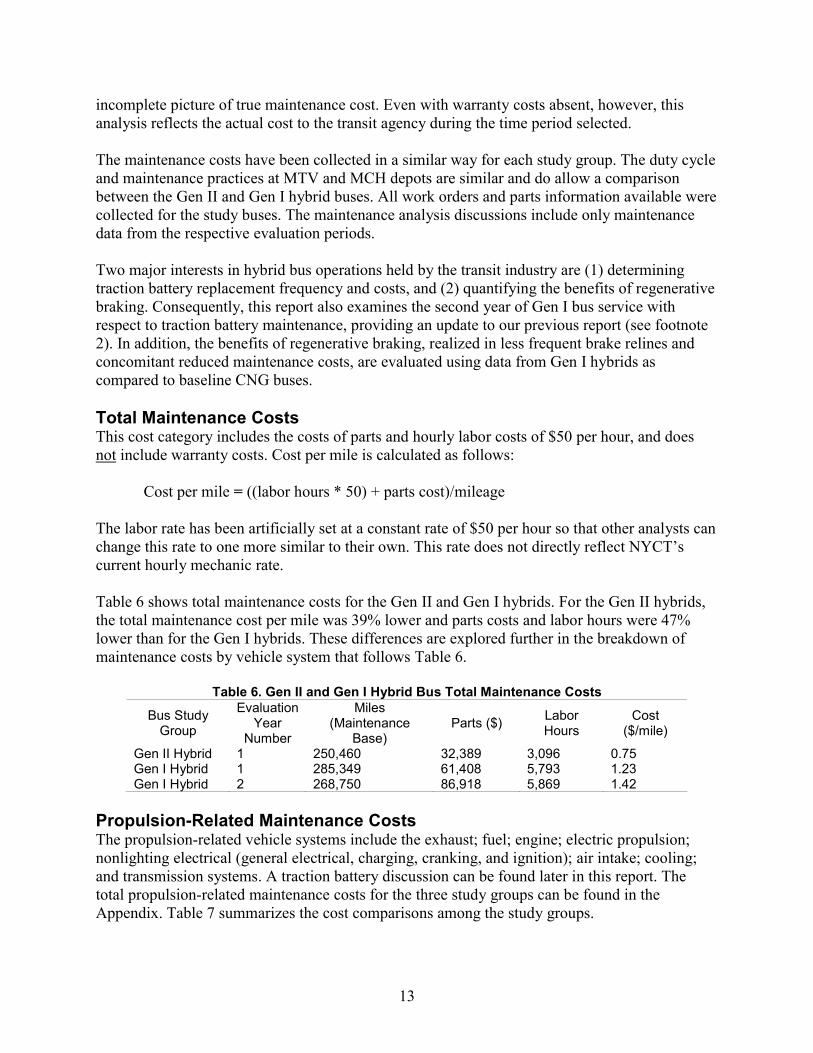
Cost per mile = ((labor hours * 50) + parts cost)/mileage The labor rate has been artificially set at a constant rate of $50 per hour so that other analysts can change this rate to one more similar to their own. This rate does not directly reflect NYCT’s current hourly mechanic rate. Table 6 shows total maintenance costs for the Gen II and Gen I hybrids. For the Gen II hybrids, the total maintenance cost per mile was 39% lower and parts costs and labor hours were 47% lower than for the Gen I hybrids. These differences are explored further in the breakdown of maintenance costs by vehicle system that follows Table 6.
Table 6. Gen II and Gen I Hybrid Bus Total Maintenance Costs
Bus Study Group
Evaluation Year
Number
Miles (Maintenance
Base) Parts ($) Labor
Hours Cost
($/mile)
Gen II Hybrid 1 250,460 32,389 3,096 0.75 Gen I Hybrid 1 285,349 61,408 5,793 1.23 Gen I Hybrid 2 268,750 86,918 5,869 1.42
Propulsion-Related Maintenance Costs The propulsion-related vehicle systems include the exhaust; fuel; engine; electric propulsion; nonlighting electrical (general electrical, charging, cranking, and ignition); air intake; cooling; and transmission systems. A traction battery discussion can be found later in this report. The total propulsion-related maintenance costs for the three study groups can be found in the Appendix. Table 7 summarizes the cost comparisons among the study groups.
13
Total propulsion-related systems maintenance costs per mile were 55% lower for the Gen II hybrid buses than for the Gen I hybrid buses.
Table 7. Summary of Propulsion-Related Maintenance Cost Comparisons Vehicle System Gen II Hybrid
($/mile) Gen I Hybrid
($/mile) Gen I Hybrid
($/mile) Evaluation Year Number 1 1 2 Total propulsion-related 0.162 0.359 0.335
Exhaust 0.0169 0.0241 0.0174 Fuel 0.0176 0.0150 0.0150 Engine 0.0331 0.0609 0.0367 Electric propulsion 0.0387 0.1765 0.1266 Nonlighting electrical 0.0278 0.0416 0.0613 Air intake 0.0087 0.0056 0.0054 Cooling 0.0181 0.0309 0.0689 Transmission 0.0008 0.0044 0.0039
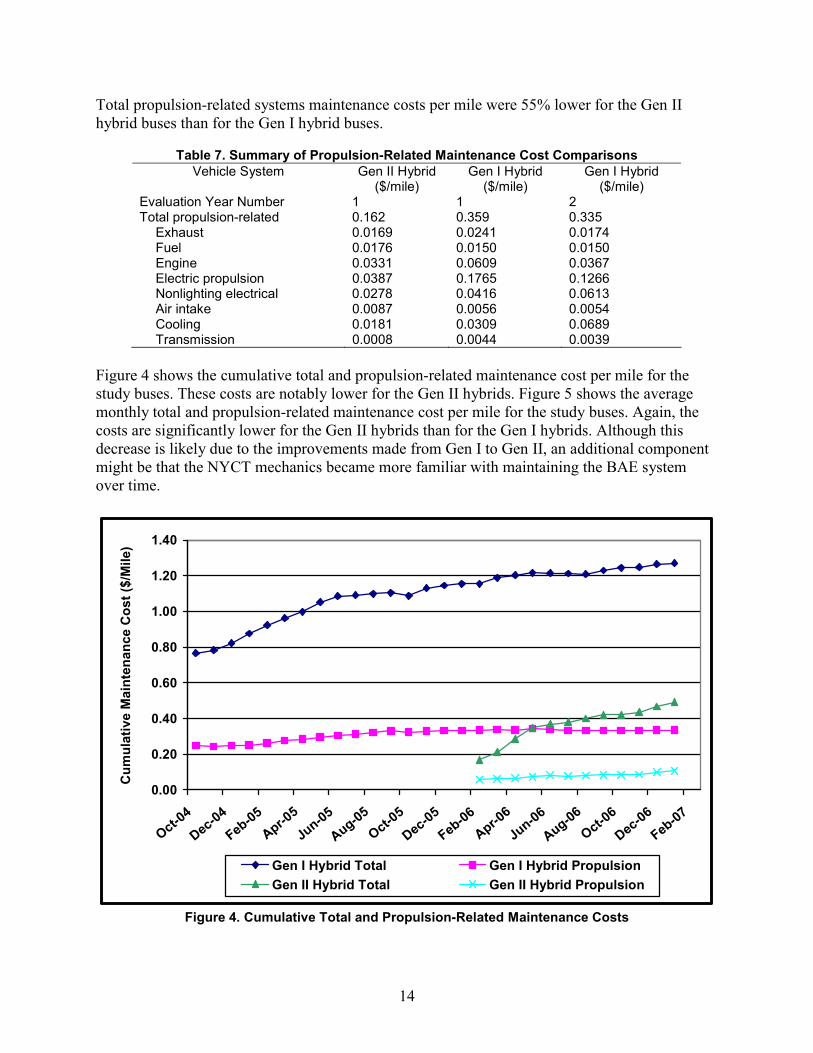
Figure 4 shows the cumulative total and propulsion-related maintenance cost per mile for the study buses. These costs are notably lower for the Gen II hybrids. Figure 5 shows the average monthly total and propulsion-related maintenance cost per mile for the study buses. Again, the costs are significantly lower for the Gen II hybrids than for the Gen I hybrids. Although this decrease is likely due to the improvements made from Gen I to Gen II, an additional component might be that the NYCT mechanics became more familiar with maintaining the BAE system over time.
0.00
0.20
0.40
0.60
0.80
1.00
1.20
1.40
Oct-04
Dec-04Feb-05
Apr-05
Jun-05
Aug-05Oct-0
5
Dec-05Feb-06
Apr-06
Jun-06
Aug-06Oct-0
6
Dec-06Feb-07
Cum
ulat
ive
Mai
nten
ance
Cos
t ($/
Mile
)
Gen I Hybrid Total Gen I Hybrid PropulsionGen II Hybrid Total Gen II Hybrid Propulsion
Figure 4. Cumulative Total and Propulsion-Related Maintenance Costs
14
0.00
0.50
1.00
1.50
2.00
2.50
3.00
3.50
4.00
Oct-04
Dec-04Feb-05
Apr-05
Jun-05
Aug-05Oct-0
5
Dec-05Feb-06
Apr-06
Jun-06
Aug-06Oct-0
6
Dec-06Feb-07
Ave
rage
Mai
nten
ance
Cos
t ($/
Mile
)
Gen I Hybrid Total Gen I Hybrid PropulsionGen II Hybrid Total Gen II Hybrid Propulsion
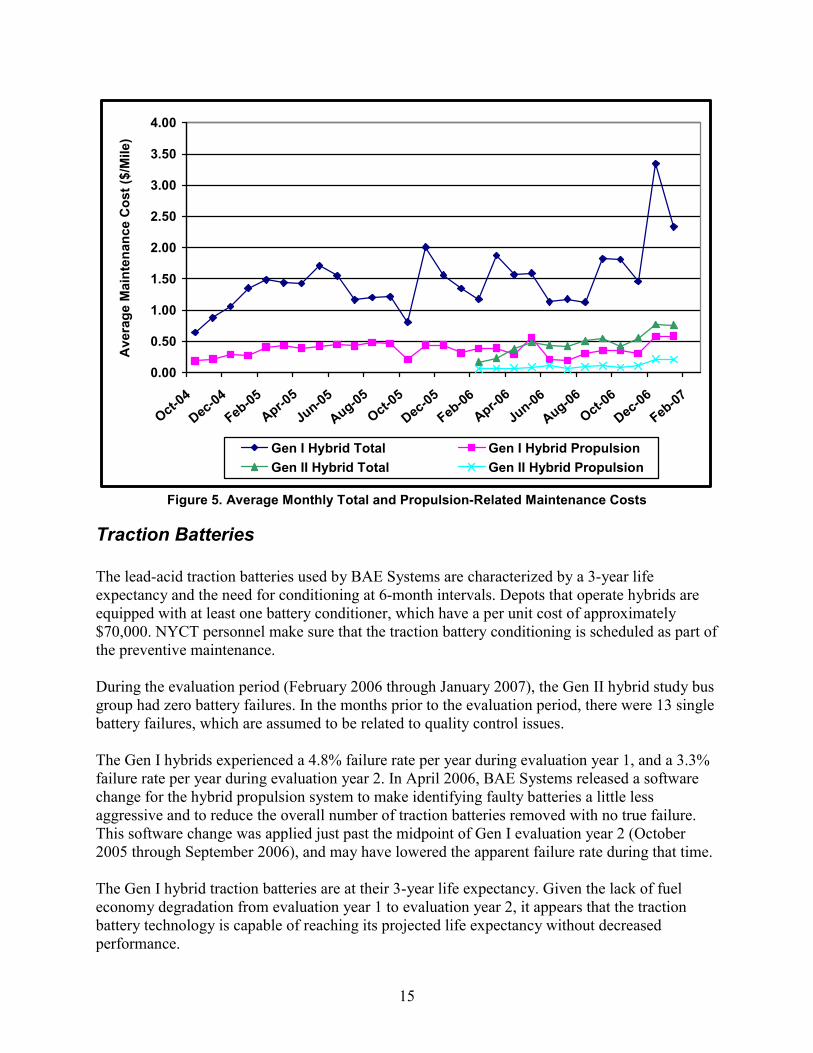
Figure 5. Average Monthly Total and Propulsion-Related Maintenance Costs
Traction Batteries The lead-acid traction batteries used by BAE Systems are characterized by a 3-year life expectancy and the need for conditioning at 6-month intervals. Depots that operate hybrids are equipped with at least one battery conditioner, which have a per unit cost of approximately $70,000. NYCT personnel make sure that the traction battery conditioning is scheduled as part of the preventive maintenance. During the evaluation period (February 2006 through January 2007), the Gen II hybrid study bus group had zero battery failures. In the months prior to the evaluation period, there were 13 single battery failures, which are assumed to be related to quality control issues. The Gen I hybrids experienced a 4.8% failure rate per year during evaluation year 1, and a 3.3% failure rate per year during evaluation year 2. In April 2006, BAE Systems released a software change for the hybrid propulsion system to make identifying faulty batteries a little less aggressive and to reduce the overall number of traction batteries removed with no true failure. This software change was applied just past the midpoint of Gen I evaluation year 2 (October 2005 through September 2006), and may have lowered the apparent failure rate during that time. The Gen I hybrid traction batteries are at their 3-year life expectancy. Given the lack of fuel economy degradation from evaluation year 1 to evaluation year 2, it appears that the traction battery technology is capable of reaching its projected life expectancy without decreased performance.
15
Brakes The brake system maintenance costs are expected to be lower for hybrid propulsion systems with regenerative braking. The regenerative braking allows the electric drive motors to be used to slow down a bus, similar to a transmission retarder. On Orion/BAE hybrid buses, energy from braking is taken at the rear (drive) axle into the electric drive motor, and then fed back to the traction batteries. NYCT does not use the maximum available regenerative braking capacity, preferring for safety reasons that nonhybrid and hybrid buses have a similar feel to drivers when they release the accelerator. The transit bus application generally utilizes rear brakes more than the front brakes, thus a brake reline is commonly performed on rear brakes first. While the “2-wheel reline” is the most common first reline activity, the “4-wheel reline” is also occasionally observed. In this comparison of brake maintenance, Gen I hybrids are compared to CNG buses with respect to miles to first brake reline. The first brake reline for both groups occurred during evaluation year number 2. Gen II hybrids have not yet accumulated sufficient mileage to make this comparison, and Gen I hybrids shared this condition at the time of the last NREL evaluation. As a result, CNG buses serve as the baseline (nonhybrid) in this comparison. NYCT expects nonhybrid buses to have a four-wheel brake reline every 18,000 miles on average. Additional issues contributing to this comparison are
• The hybrids weigh 440 lb more than the CNG buses. • The brake assembly and pad materials are the same. • The majority of braking is naturally applied to the rear wheels, which is compounded by
regenerative braking at the electric drive motor coupled to the rear (drive) axle. There is parity between hybrid and CNG buses in brake materials, and the hybrids have a weight disadvantage that should nominally contribute to a slight increase in brake wear. The focus of regenerative braking at the rear wheels will theoretically extend the two-wheel reline period, as well as the four-wheel reline period.
Table 8 shows that the Gen I hybrid buses accumulated more than two times the mileage of the CNG buses before requiring their first brake reline. This ~2x trend is also true when comparing first 2-wheel relines or first 4-wheel relines between groups.
16
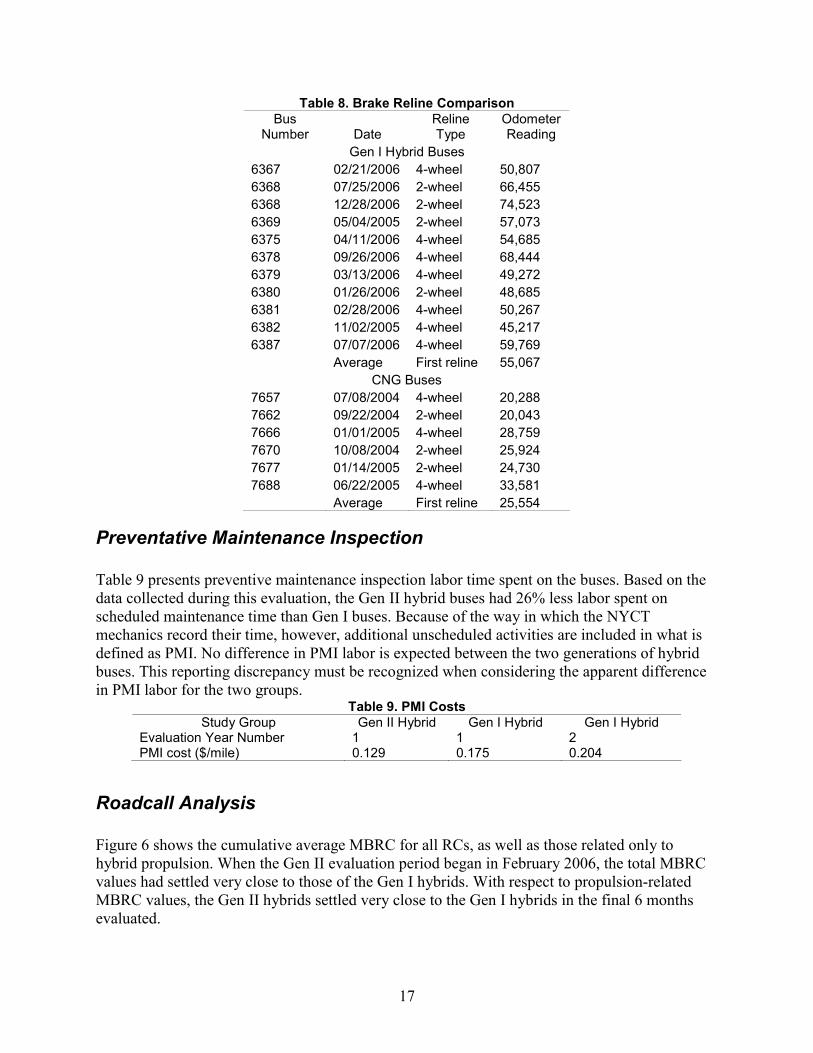
Table 8. Brake Reline Comparison Bus
Number Date Reline Type
Odometer Reading
Gen I Hybrid Buses 6367 02/21/2006 4-wheel 50,807 6368 07/25/2006 2-wheel 66,455 6368 12/28/2006 2-wheel 74,523 6369 05/04/2005 2-wheel 57,073 6375 04/11/2006 4-wheel 54,685 6378 09/26/2006 4-wheel 68,444 6379 03/13/2006 4-wheel 49,272 6380 01/26/2006 2-wheel 48,685 6381 02/28/2006 4-wheel 50,267 6382 11/02/2005 4-wheel 45,217 6387 07/07/2006 4-wheel 59,769 Average First reline 55,067
CNG Buses 7657 07/08/2004 4-wheel 20,288 7662 09/22/2004 2-wheel 20,043 7666 01/01/2005 4-wheel 28,759 7670 10/08/2004 2-wheel 25,924 7677 01/14/2005 2-wheel 24,730 7688 06/22/2005 4-wheel 33,581 Average First reline 25,554
Preventative Maintenance Inspection Table 9 presents preventive maintenance inspection labor time spent on the buses. Based on the data collected during this evaluation, the Gen II hybrid buses had 26% less labor spent on scheduled maintenance time than Gen I buses. Because of the way in which the NYCT mechanics record their time, however, additional unscheduled activities are included in what is defined as PMI. No difference in PMI labor is expected between the two generations of hybrid buses. This reporting discrepancy must be recognized when considering the apparent difference in PMI labor for the two groups.
Table 9. PMI Costs Study Group Gen II Hybrid Gen I Hybrid Gen I Hybrid
Evaluation Year Number 1 1 2 PMI cost ($/mile) 0.129 0.175 0.204
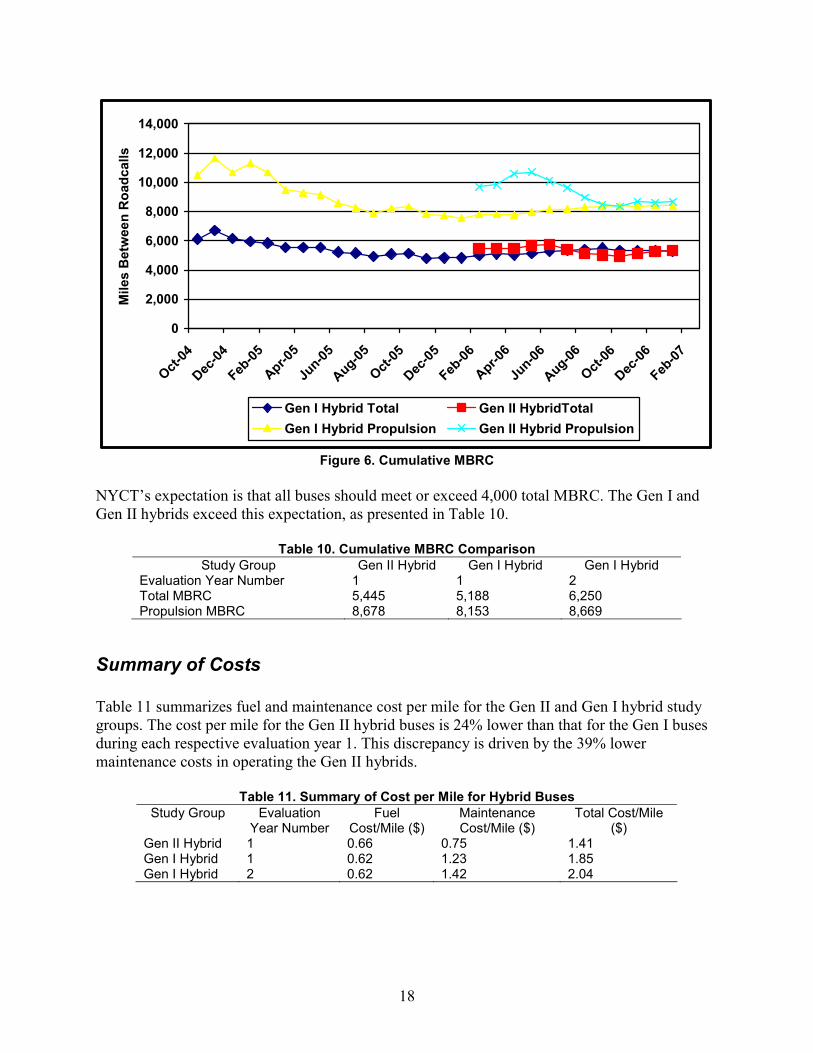
Roadcall Analysis Figure 6 shows the cumulative average MBRC for all RCs, as well as those related only to hybrid propulsion. When the Gen II evaluation period began in February 2006, the total MBRC values had settled very close to those of the Gen I hybrids. With respect to propulsion-related MBRC values, the Gen II hybrids settled very close to the Gen I hybrids in the final 6 months evaluated.
17
0
2,000
4,000
6,000
8,000
10,000
12,000
14,000
Oct-04
Dec-04
Feb-05
Apr-05
Jun-05
Aug-05
Oct-05
Dec-05
Feb-06
Apr-06
Jun-06
Aug-06
Oct-06
Dec-06
Feb-07
Mile
s B
etw
een
Roa
dcal
ls
Gen I Hybrid Total Gen II HybridTotalGen I Hybrid Propulsion Gen II Hybrid Propulsion
Figure 6. Cumulative MBRC
NYCT’s expectation is that all buses should meet or exceed 4,000 total MBRC. The Gen I and Gen II hybrids exceed this expectation, as presented in Table 10.
Table 10. Cumulative MBRC Comparison Study Group Gen II Hybrid Gen I Hybrid Gen I Hybrid
Evaluation Year Number 1 1 2 Total MBRC 5,445 5,188 6,250 Propulsion MBRC 8,678 8,153 8,669
Summary of Costs Table 11 summarizes fuel and maintenance cost per mile for the Gen II and Gen I hybrid study groups. The cost per mile for the Gen II hybrid buses is 24% lower than that for the Gen I buses during each respective evaluation year 1. This discrepancy is driven by the 39% lower maintenance costs in operating the Gen II hybrids.
Table 11. Summary of Cost per Mile for Hybrid Buses Study Group Evaluation
Year Number Fuel
Cost/Mile ($) Maintenance Cost/Mile ($)
Total Cost/Mile ($)
Gen II Hybrid 1 0.66 0.75 1.41 Gen I Hybrid 1 0.62 1.23 1.85 Gen I Hybrid 2 0.62 1.42 2.04
18
Conclusions The primary conclusions from this evaluation are:
• With similar usage and duty cycle, the Gen II hybrids exhibited a 5.9% lower fuel economy than the Gen I hybrids. This is likely due to the MY2004 EGR-equipped engine in the Gen II hybrids.
• The Gen I hybrid fuel economy was essentially the same over two years of evaluation up through year number three of implementation. This indicates that the lead acid battery chemistry is capable of consistent performance, in this duty cycle application, through the projected three year lifespan.
• The total maintenance costs for the Gen II hybrids were 39% lower than the Gen I hybrids for each respective evaluation year number 1.
• The propulsion-related maintenance costs for the Gen II hybrids were 55% lower than the Gen I hybrids for each respective evaluation year number 1.
• The Gen I hybrid buses accumulated more than two times the mileage of the CNG buses before requiring their first brake reline. For NYCT, this indicates tangible advantage to regenerative braking in terms of lower brake system maintenance costs related to brake relines. However, it should be noted that brake wear is a function of duty cycle, driver behavior, and transmission retarder type and tuning.
• The Gen II hybrids exhibited similar reliability (as measured in MBRCs) to the Gen I hybrids. Both Gen II and Gen I hybrids exceeded NYCT’s expectations in this arena.
Due to lower maintenance costs, but despite lower fuel economy, the Gen II hybrids total operating cost per mile was 24% lower than the Gen I hybrids for each respective evaluation year.
What’s Next? Orion Bus announced in December 2007 that NYCT ordered 850 diesel-electric hybrid transit buses for use by the MTA Bus Company and MTA New York City Transit. The buses will be powered by a hybrid drive system developed by BAE Systems and incorporate lithium-ion energy storage supplied by A123Systems. When the complete order is delivered to the city by early 2010, the buses will make the MTA's diesel-electric hybrid bus fleet the largest in the world, with nearly 1,700 hybrid buses.
19
Contacts U.S. Department of Energy Lee Slezak Manager, Advanced Vehicle Testing Activity Phone: 202-586-2335 E-mail: [email protected] National Renewable Energy Laboratory Robb Barnitt Project Engineer Phone: 303-275-4489 E-mail: [email protected] New York City Transit Gary LaBouff Director, Research and Development Department of Buses Phone: 718-566-3535 E-mail: [email protected] DaimlerChrysler Commercial Buses, N.A. Patrick Scully Chief Commercial Officer Phone: 336-878-5429 E-mail: [email protected] BAE Systems Tom Webb Director, Business Development Phone: 413-253-2564 E-mail: [email protected] Battelle Kevin Chandler Principal Research Scientist Phone: 614-424-5127 E-mail: [email protected]
20
Acronyms and Abbreviations AC—alternating current AVTA—Advanced Vehicle Testing Activity bhp—brake horsepower CNG—compressed natural gas CO—carbon monoxide CRT—continuously regenerating technology DDC—Detroit Diesel Corporation DOE—U.S. Department of Energy DPF—diesel particulate filter EGR—exhaust gas recirculation EPA—U.S. Environmental Protection Agency ERMD—Emissions Research & Measurement Division (Environment Canada) ft—foot g/bhp-hr—grams per brake horsepower hour gal—gallon GVWR—gross vehicle weight rating HEV—hybrid electric vehicle hp—horsepower in.—inch L—liter lb-ft—pound-foot (unit of torque) LIRR—Long Island Railroad LI Bus—Long Island Bus LNG—liquefied natural gas MBRC—miles between roadcalls MCH—Mother Clara Hale Depot MIDAS— Maintenance Information Diagnostic Analysis System MTA—Metropolitan Transportation Authority NiMH— nickel metal hydride NMHC—nonmethane hydrocarbons NOx—oxides of nitrogen NREL—National Renewable Energy Laboratory NYCT—New York City Transit
21
PM—particulate matter PMI—preventive maintenance inspection ppm—parts per million PTI—Pennsylvania Transportation Institute RC—roadcall R&D—research and development rpm—revolutions per minute VDC—voltage direct current WEG – Water Ethylene Glycol
22
References and Related Reports Barnitt, R.; Chandler, K. (2006). New York City Transit (NYCT) Hybrid and CNG Transit Buses:
Final Evaluation Results. NREL/TP-540-40125. Golden, CO: National Renewable Energy Laboratory (NREL).
Battelle/NREL. (2001). Advanced Technology Vehicles in Service, Diesel Hybrid Electric Buses.
NREL/FS-540-30736. Golden, CO: NREL. Battelle/NREL. (2002). NYCT’s Diesel Hybrid-Electric Buses, Program Status Update.
NREL/BR-540-31668. Golden, CO: NREL. Chandler, K.; Eudy, L.; Eberts, E. (2006). New York City Transit (NYCT) Hybrid and CNG
Transit Buses: Interim Evaluation Results. NREL/TP-540-38843. Golden, CO: NREL. Chandler, K.; Walkowicz, K.; Eudy, L. (2002). New York City Transit Diesel Hybrid-Electric
Buses: Final Results. NREL/BR-540-32427. Golden, CO: NREL. Clark, N.; Wenwei, X.; Gautam, M.; Lyons, D.; Norton, P.; Balon, T. (2000). Hybrid Diesel-
Electric Heavy Duty Bus Emissions: Benefits of Regeneration and Need for State of Charge Correction. 2000-01-2955. Warrendale, PA: SAE International.
Environment Canada. (1998). Evaluation of Engine RPM on the Emissions from the Low Floor
Diesel-Electric Hybrid Bus. Emissions Research & Measurement Division (ERMD) Report #97-26771-3. Ottawa, Ontario: Environment Canada.
Environment Canada. (2001). Emissions Evaluation of Orion VII Hybrid Bus with BAE Systems
Controls HybriDrive Propulsion System. ERMD Report #01-12. Ottawa, Ontario: Environment Canada.
Environment Canada. (2004). Orion VII Transit Bus Equipped with BAE Systems HybriDrive
Propulsion System Emissions and Fuel Economy Test Report. ERMD Report #2004-18. Ottawa, Ontario: Environment Canada.
Lanni, T.; Chatterjee, S.; Conway, R.; Windawi, H.; Rosenblatt, D.; Bush, C.; Lowell, D.; Evans,
J.; McLean, R. (2001). Performance and Durability Evaluation of Continuously Regenerating Particulate Filters on Diesel Powered Urban Buses at NY City Transit. 2001-01-0511. Warrendale, PA: SAE International.
M.J. Bradley & Associates. (2000). Hybrid-Electric Drive Heavy-Duty Vehicle Testing Project,
Final Emissions Report. Boston, MA: Northeast Advanced Vehicle Consortium. NREL. (2003). Advanced Technology Vehicles in Service: MTA New York City Transit, Diesel
Hybrid Electric Buses. NREL/FS-540-33397. Golden, CO: NREL.
23
NREL. (2005). Advanced Technology Vehicles in Service: New York City Transit Drives Hybrid Electric Buses into the Future. DOE/GO-102005-2009. Golden, CO: NREL.
Pennsylvania Transportation Institute (PTI). (2002). STURAA Test, Orion Bus Industries, Inc.,
Model Orion VII. PTI-BT-R0113. Altoona, PA: PTI. PTI. (2003a). Partial STURAA Test, Orion Bus Industries, Inc., Model Orion VII. PTI-BT-
R0327-P. Altoona, PA: PTI. PTI. (2003b). Partial STURAA Test, Orion Bus Industries, Inc., Model Orion VII. PTI-BT-
R0304-P. Altoona, PA: PTI.
24
F1147-E(12/2004)
REPORT DOCUMENTATION PAGE Form Approved OMB No. 0704-0188
The public reporting burden for this collection of information is estimated to average 1 hour per response, including the time for reviewing instructions, searching existing data sources, gathering and maintaining the data needed, and completing and reviewing the collection of information. Send comments regarding this burden estimate or any other aspect of this collection of information, including suggestions for reducing the burden, to Department of Defense, Executive Services and Communications Directorate (0704-0188). Respondents should be aware that notwithstanding any other provision of law, no person shall be subject to any penalty for failing to comply with a collection of information if it does not display a currently valid OMB control number. PLEASE DO NOT RETURN YOUR FORM TO THE ABOVE ORGANIZATION. 1. REPORT DATE (DD-MM-YYYY)
Revised March 2008 2. REPORT TYPE
Technical Report 3. DATES COVERED (From - To)
5a. CONTRACT NUMBER
DE-AC36-99-GO10337
5b. GRANT NUMBER
4. TITLE AND SUBTITLE BAE/Orion Hybrid Electric Buses at New York City Transit: A Generational Comparison
5c. PROGRAM ELEMENT NUMBER
5d. PROJECT NUMBER NREL/TP-540-42217
5e. TASK NUMBER FC08.3000
6. AUTHOR(S) R. Barnitt
5f. WORK UNIT NUMBER
7. PERFORMING ORGANIZATION NAME(S) AND ADDRESS(ES) National Renewable Energy Laboratory 1617 Cole Blvd. Golden, CO 80401-3393
8. PERFORMING ORGANIZATION REPORT NUMBER NREL/TP-540-42217
10. SPONSOR/MONITOR'S ACRONYM(S) NREL
9. SPONSORING/MONITORING AGENCY NAME(S) AND ADDRESS(ES)
11. SPONSORING/MONITORING AGENCY REPORT NUMBER
12. DISTRIBUTION AVAILABILITY STATEMENT National Technical Information Service U.S. Department of Commerce 5285 Port Royal Road Springfield, VA 22161
13. SUPPLEMENTARY NOTES
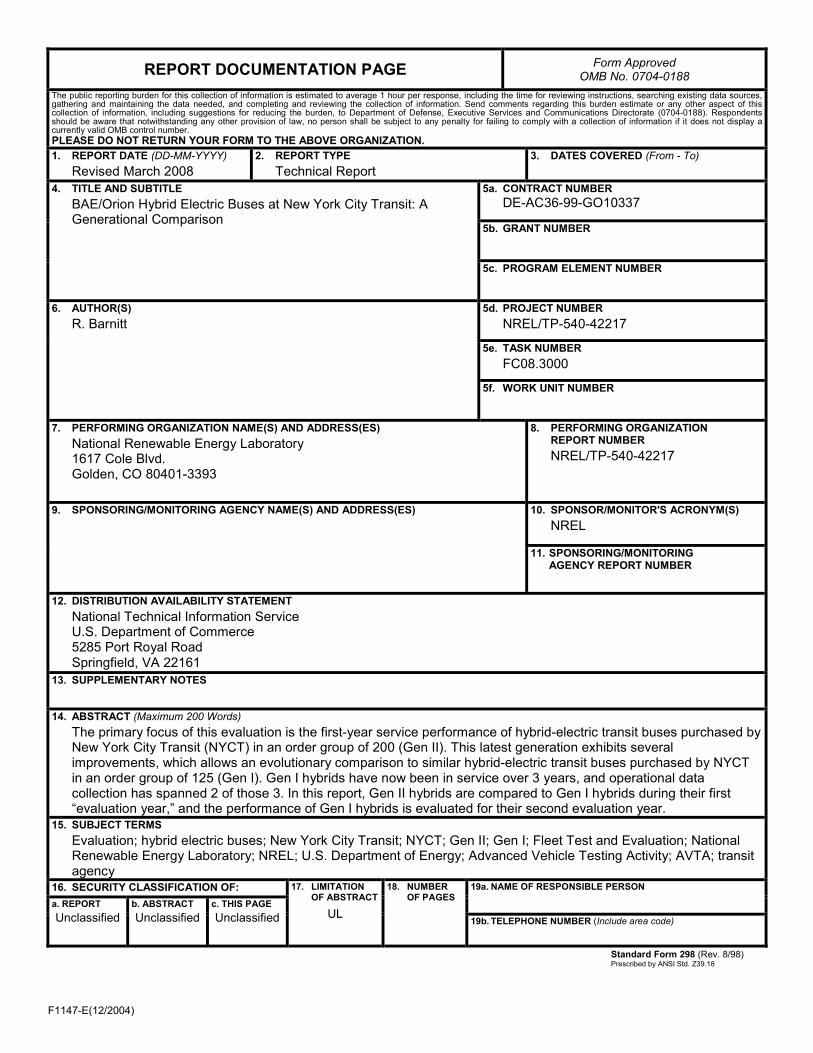
14. ABSTRACT (Maximum 200 Words) The primary focus of this evaluation is the first-year service performance of hybrid-electric transit buses purchased by New York City Transit (NYCT) in an order group of 200 (Gen II). This latest generation exhibits several improvements, which allows an evolutionary comparison to similar hybrid-electric transit buses purchased by NYCT in an order group of 125 (Gen I). Gen I hybrids have now been in service over 3 years, and operational data collection has spanned 2 of those 3. In this report, Gen II hybrids are compared to Gen I hybrids during their first “evaluation year,” and the performance of Gen I hybrids is evaluated for their second evaluation year.
15. SUBJECT TERMS Evaluation; hybrid electric buses; New York City Transit; NYCT; Gen II; Gen I; Fleet Test and Evaluation; National Renewable Energy Laboratory; NREL; U.S. Department of Energy; Advanced Vehicle Testing Activity; AVTA; transit agency
16. SECURITY CLASSIFICATION OF: 19a. NAME OF RESPONSIBLE PERSON a. REPORT
Unclassified b. ABSTRACT Unclassified
c. THIS PAGE Unclassified
17. LIMITATION OF ABSTRACT
UL
18. NUMBER OF PAGES
19b. TELEPHONE NUMBER (Include area code)
Standard Form 298 (Rev. 8/98) Prescribed by ANSI Std. Z39.18

![York Region Rapid Transit Corporation · > Toronto-York Spadina Subway Extension [TYSSE] > Making transit connections in VMC ... Detailed design Q4 2015 – Q4 2016 Utility relocation](https://img.pdfslide.us/doc/110x75/5f20d5f8694d3710c026c363/york-region-rapid-transit-toronto-york-spadina-subway-extension-tysse-.jpg)