Embed Size (px)
Citation preview
Power Systems Engineering Center
NREL Microgrid Challenge
Blake Lundstrom, P.E. Senior Engineer Power Systems Engineering Center National Renewable Energy Laboratory Golden, CO, USA
2
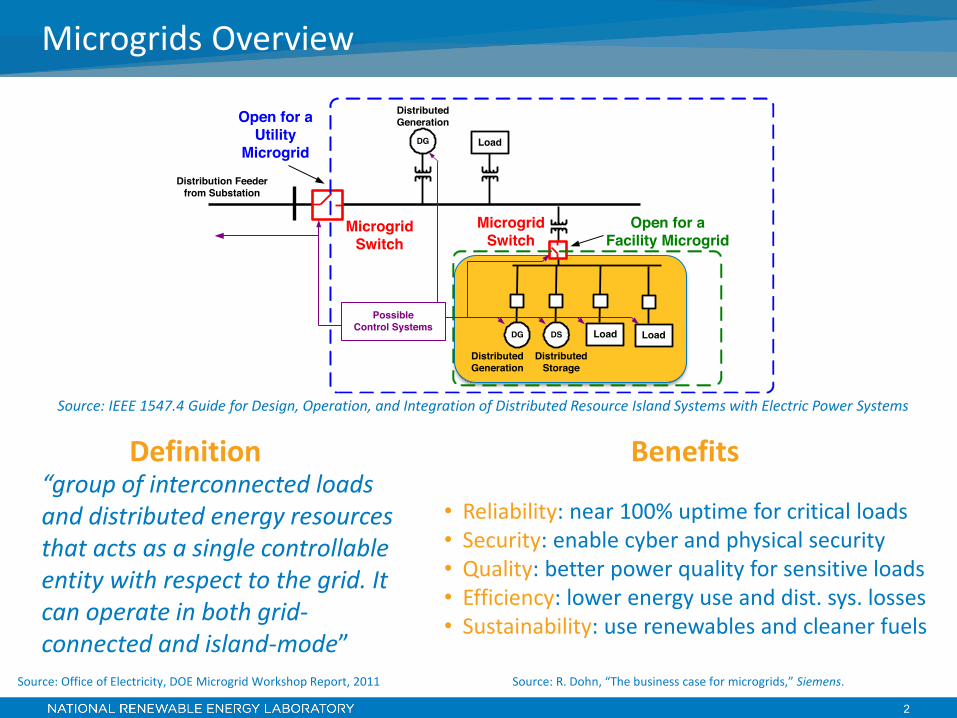
Distribution Feeder from Substation
Open for a Utility
Microgrid
DSDG Load Load
DG Load
MicrogridSwitch
Distributed Generation
Distributed Generation
Distributed Storage
Open for a Facility Microgrid
PossibleControl Systems
MicrogridSwitch
Source: IEEE 1547.4 Guide for Design, Operation, and Integration of Distributed Resource Island Systems with Electric Power Systems
Microgrids Overview
“group of interconnected loads and distributed energy resources that acts as a single controllable entity with respect to the grid. It can operate in both grid-connected and island-mode”
Source: Office of Electricity, DOE Microgrid Workshop Report, 2011
Definition Benefits
• Reliability: near 100% uptime for critical loads • Security: enable cyber and physical security • Quality: better power quality for sensitive loads • Efficiency: lower energy use and dist. sys. losses • Sustainability: use renewables and cleaner fuels
Source: R. Dohn, “The business case for microgrids,” Siemens.
3
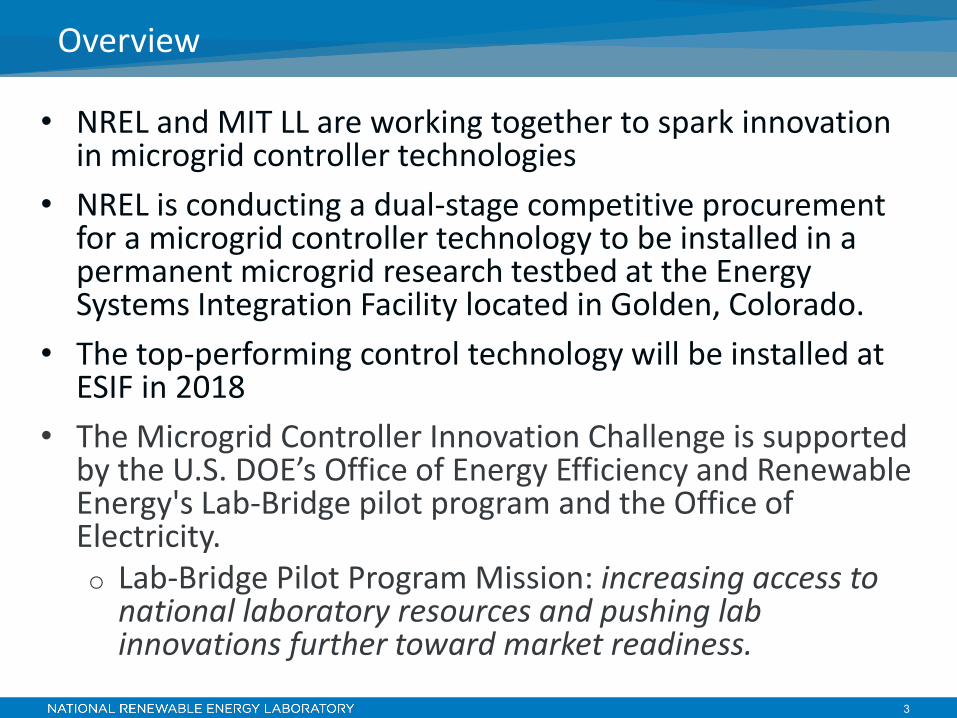
• NREL and MIT LL are working together to spark innovation in microgrid controller technologies
• NREL is conducting a dual-stage competitive procurement for a microgrid controller technology to be installed in a permanent microgrid research testbed at the Energy Systems Integration Facility located in Golden, Colorado.
• The top-performing control technology will be installed at ESIF in 2018
• The Microgrid Controller Innovation Challenge is supported by the U.S. DOE’s Office of Energy Efficiency and Renewable Energy's Lab-Bridge pilot program and the Office of Electricity. o Lab-Bridge Pilot Program Mission: increasing access to
national laboratory resources and pushing lab innovations further toward market readiness.
Overview
4
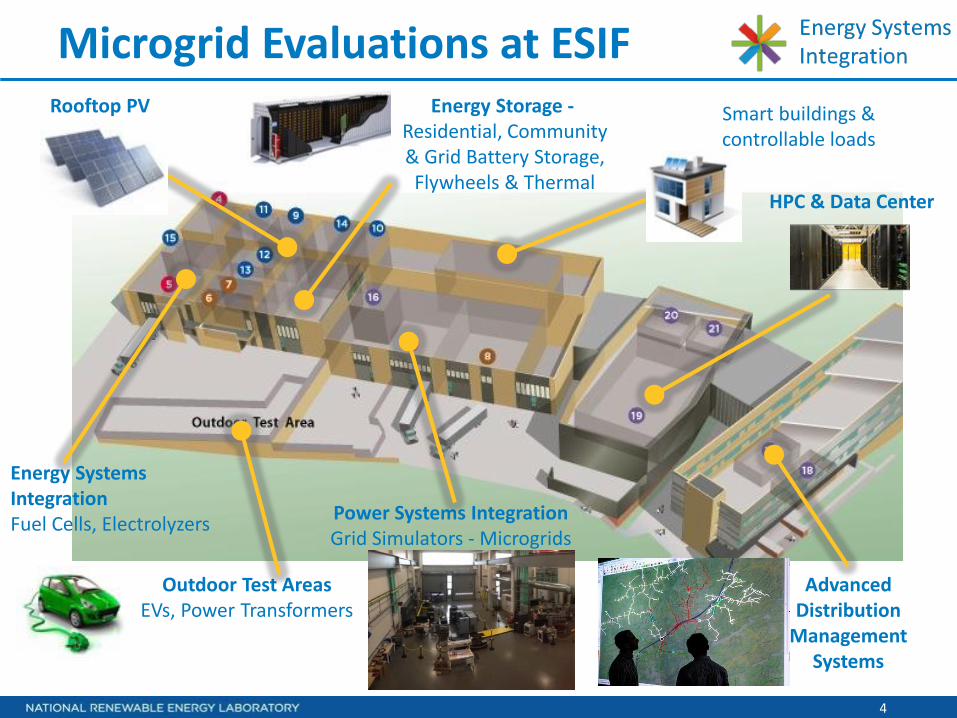
Microgrid Evaluations at ESIF Smart buildings & controllable loads
Power Systems Integration Grid Simulators - Microgrids
Energy Systems Integration Fuel Cells, Electrolyzers
Outdoor Test Areas EVs, Power Transformers
Rooftop PV Energy Storage - Residential, Community & Grid Battery Storage, Flywheels & Thermal
HPC & Data Center
Advanced Distribution
Management Systems
5
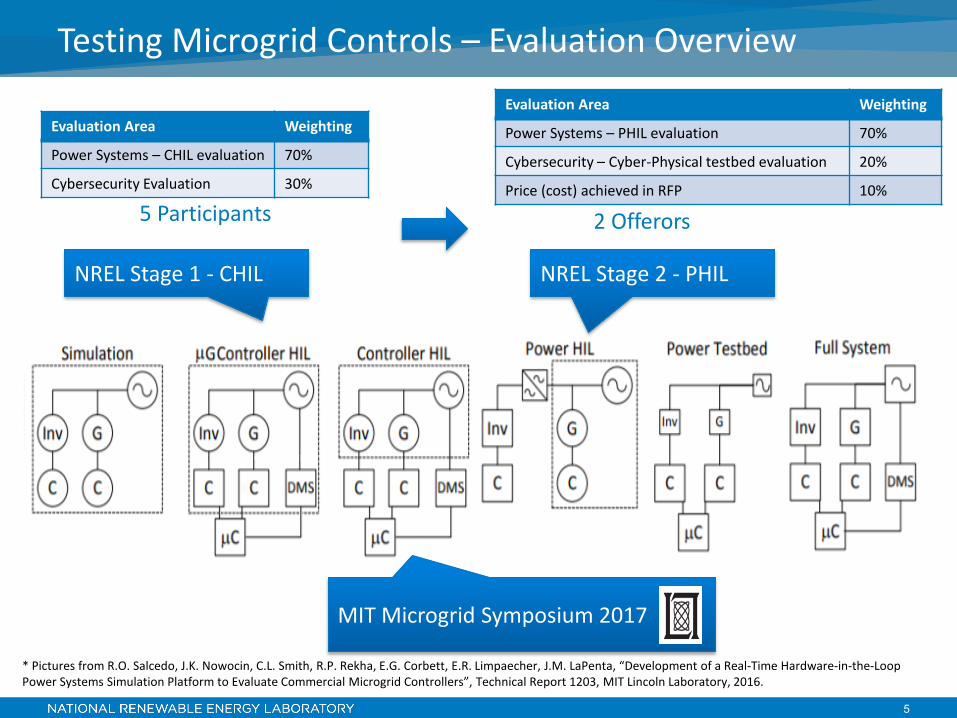
Testing Microgrid Controls – Evaluation Overview
* Pictures from R.O. Salcedo, J.K. Nowocin, C.L. Smith, R.P. Rekha, E.G. Corbett, E.R. Limpaecher, J.M. LaPenta, “Development of a Real-Time Hardware-in-the-Loop Power Systems Simulation Platform to Evaluate Commercial Microgrid Controllers”, Technical Report 1203, MIT Lincoln Laboratory, 2016.
MIT Microgrid Symposium 2017
NREL Stage 1 - CHIL NREL Stage 2 - PHIL
Evaluation Area Weighting
Power Systems – CHIL evaluation 70%
Cybersecurity Evaluation 30%
5 Participants
Evaluation Area Weighting
Power Systems – PHIL evaluation 70%
Cybersecurity – Cyber-Physical testbed evaluation 20%
Price (cost) achieved in RFP 10%
2 Offerors
6
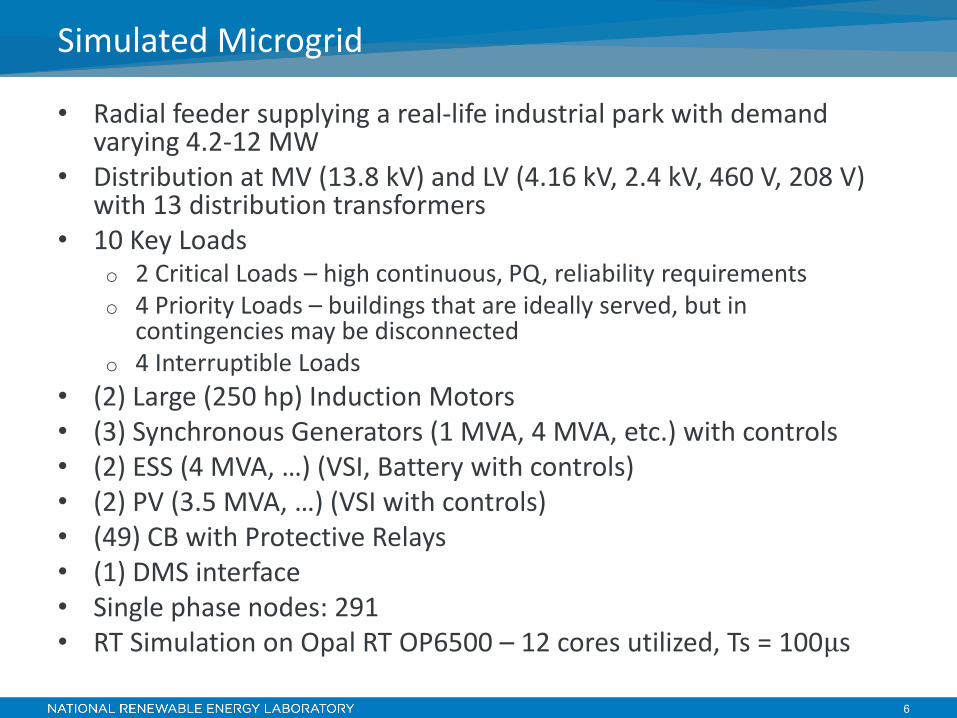
• Radial feeder supplying a real-life industrial park with demand varying 4.2-12 MW
• Distribution at MV (13.8 kV) and LV (4.16 kV, 2.4 kV, 460 V, 208 V) with 13 distribution transformers
• 10 Key Loads o 2 Critical Loads – high continuous, PQ, reliability requirements o 4 Priority Loads – buildings that are ideally served, but in
contingencies may be disconnected o 4 Interruptible Loads
• (2) Large (250 hp) Induction Motors • (3) Synchronous Generators (1 MVA, 4 MVA, etc.) with controls • (2) ESS (4 MVA, …) (VSI, Battery with controls) • (2) PV (3.5 MVA, …) (VSI with controls) • (49) CB with Protective Relays • (1) DMS interface • Single phase nodes: 291 • RT Simulation on Opal RT OP6500 – 12 cores utilized, Ts = 100μs
Simulated Microgrid
7
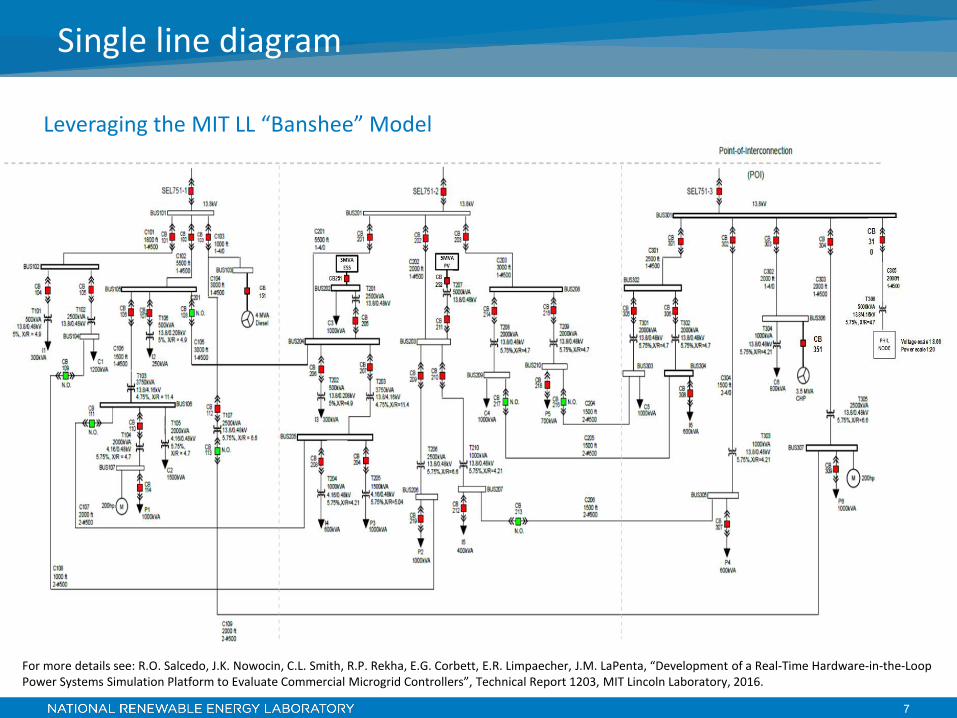
Single line diagram
Leveraging the MIT LL “Banshee” Model
For more details see: R.O. Salcedo, J.K. Nowocin, C.L. Smith, R.P. Rekha, E.G. Corbett, E.R. Limpaecher, J.M. LaPenta, “Development of a Real-Time Hardware-in-the-Loop Power Systems Simulation Platform to Evaluate Commercial Microgrid Controllers”, Technical Report 1203, MIT Lincoln Laboratory, 2016.
8
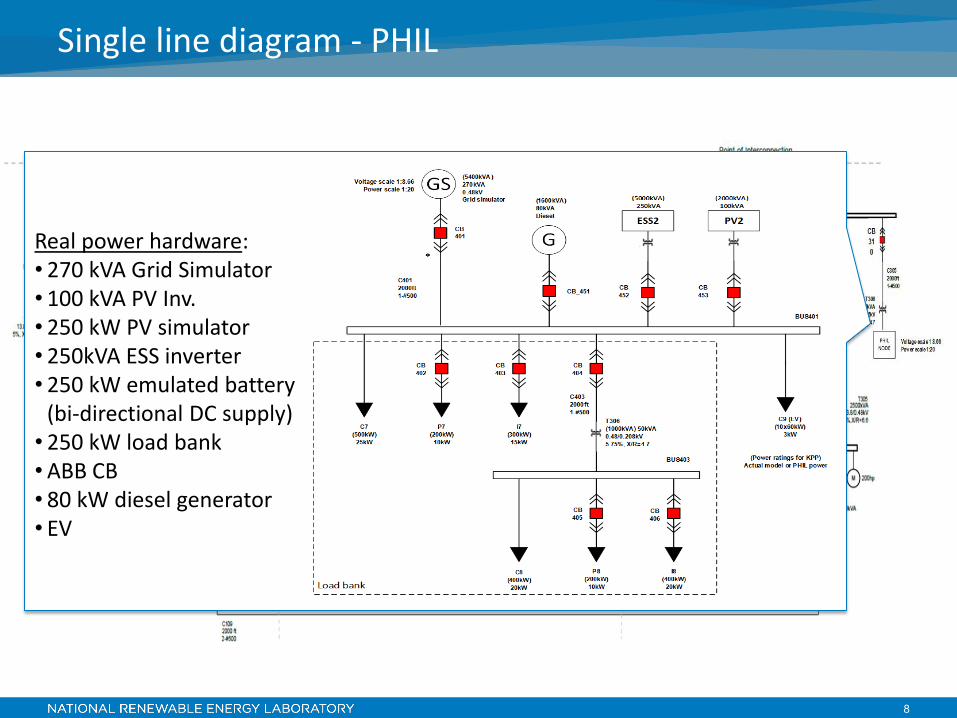
Single line diagram - PHIL
Real power hardware: • 270 kVA Grid Simulator • 100 kVA PV Inv. • 250 kW PV simulator • 250kVA ESS inverter • 250 kW emulated battery
(bi-directional DC supply) • 250 kW load bank • ABB CB • 80 kW diesel generator • EV
9
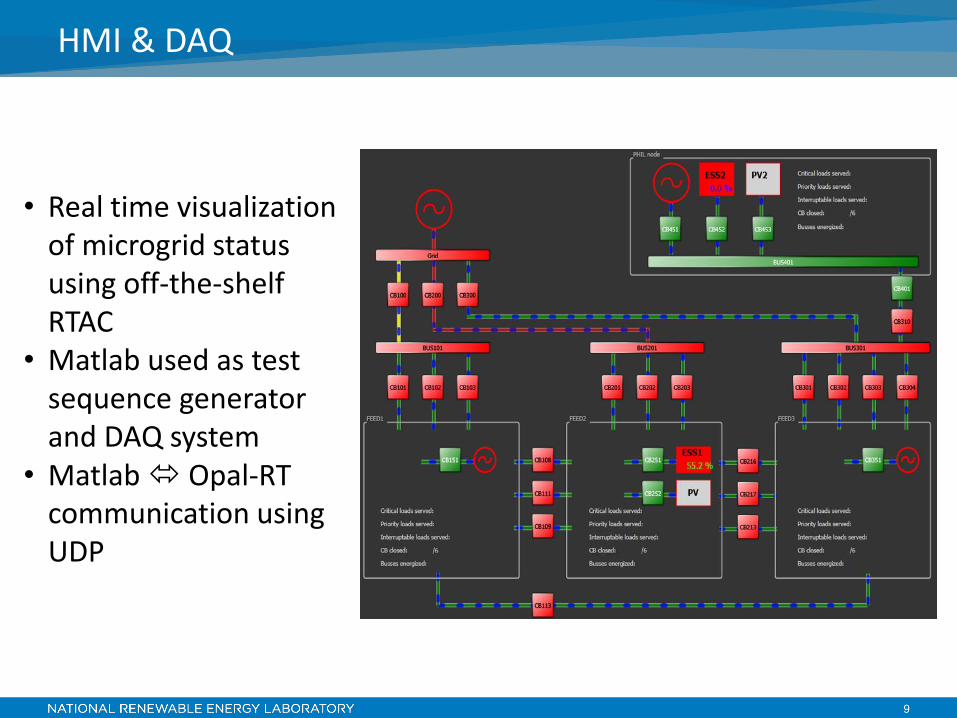
HMI & DAQ
• Real time visualization of microgrid status using off-the-shelf RTAC
• Matlab used as test sequence generator and DAQ system
• Matlab Ù Opal-RT communication using UDP
10
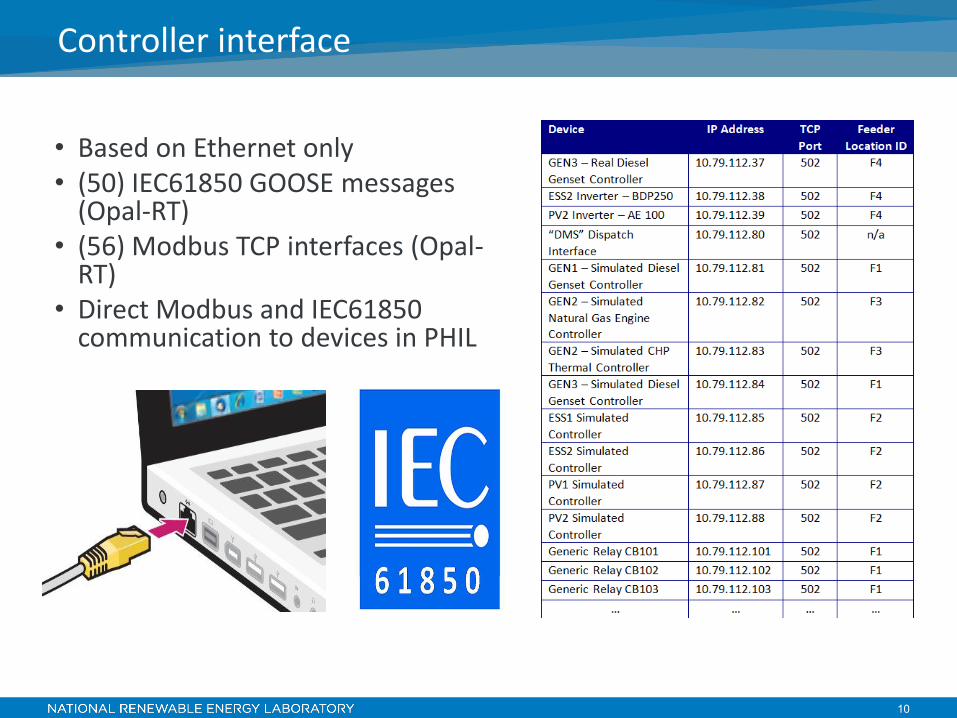
• Based on Ethernet only • (50) IEC61850 GOOSE messages
(Opal-RT) • (56) Modbus TCP interfaces (Opal-
RT) • Direct Modbus and IEC61850
communication to devices in PHIL
Controller interface
11
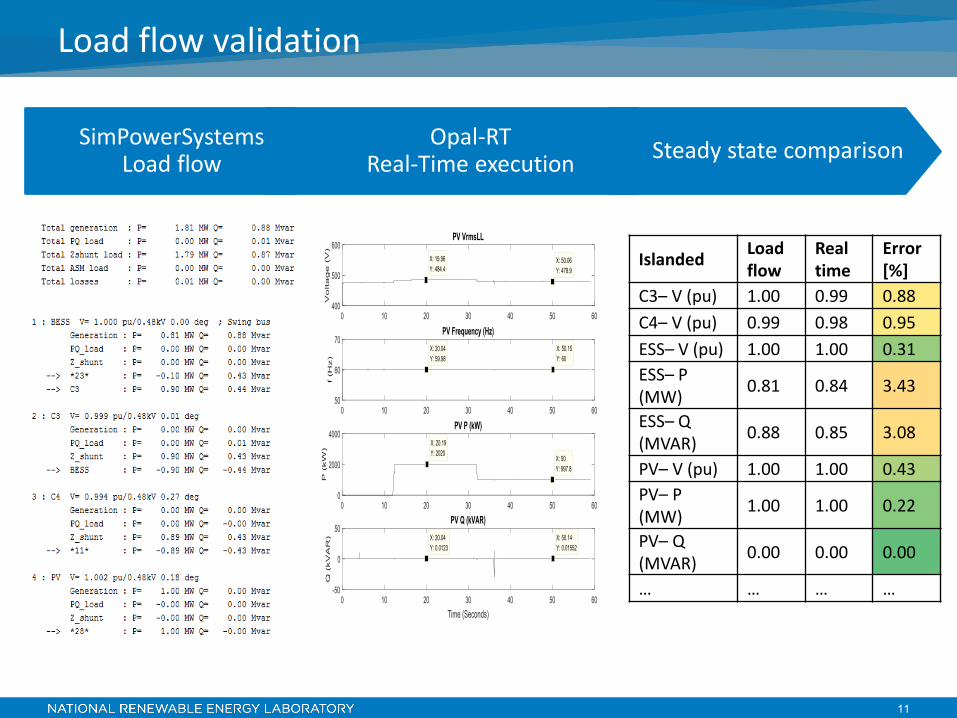
Load flow validation
Islanded Load flow
Real time
Error [%]
C3– V (pu) 1.00 0.99 0.88 C4– V (pu) 0.99 0.98 0.95 ESS– V (pu) 1.00 1.00 0.31 ESS– P (MW) 0.81 0.84 3.43
ESS– Q (MVAR) 0.88 0.85 3.08
PV– V (pu) 1.00 1.00 0.43 PV– P (MW) 1.00 1.00 0.22
PV– Q (MVAR) 0.00 0.00 0.00
… … … …
SimPowerSystems Load flow
Opal-RT Real-Time execution Steady state comparison
12
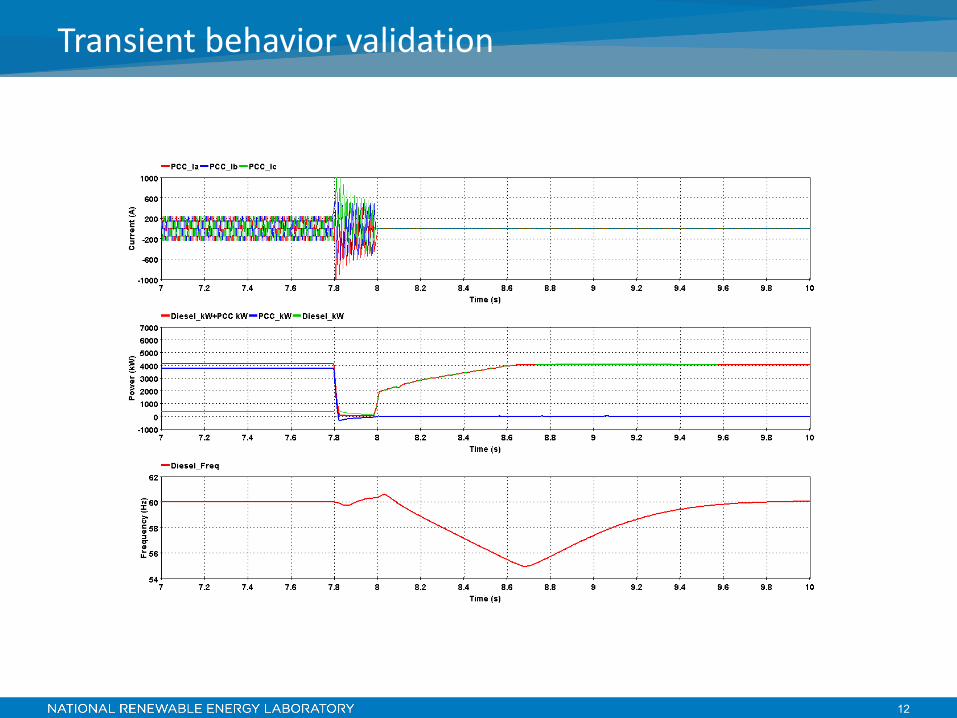
Transient behavior validation
13
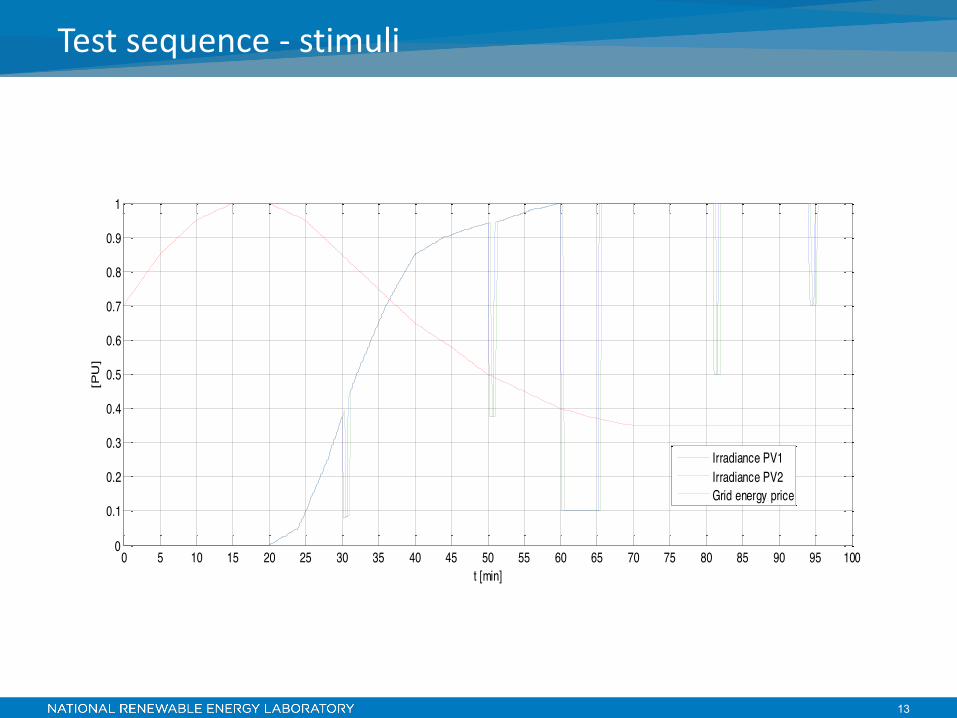
Test sequence - stimuli
0 5 10 15 20 25 30 35 40 45 50 55 60 65 70 75 80 85 90 95 1000
0.1
0.2
0.3
0.4
0.5
0.6
0.7
0.8
0.9
1
t [min]
[PU
]
Irradiance PV1Irradiance PV2Grid energy price
14
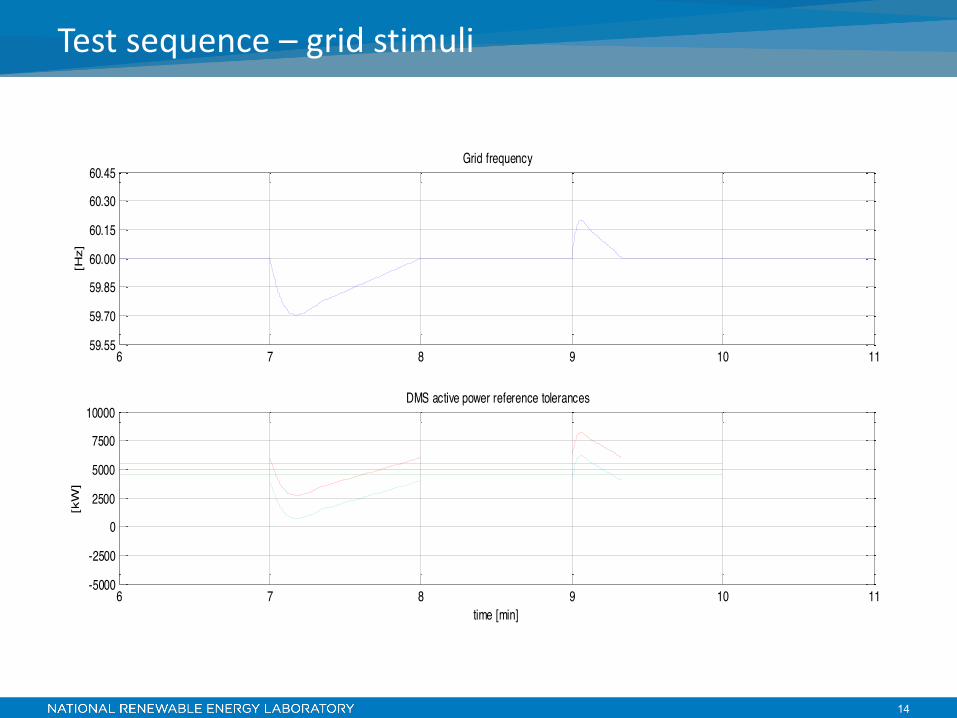
Test sequence – grid stimuli
6 7 8 9 10 1159.55
59.70
59.85
60.00
60.15
60.30
60.45Grid frequency
[Hz]
6 7 8 9 10 11-5000
-2500
0
2500
5000
7500
10000DMS active power reference tolerances
[kW
]
time [min]
15
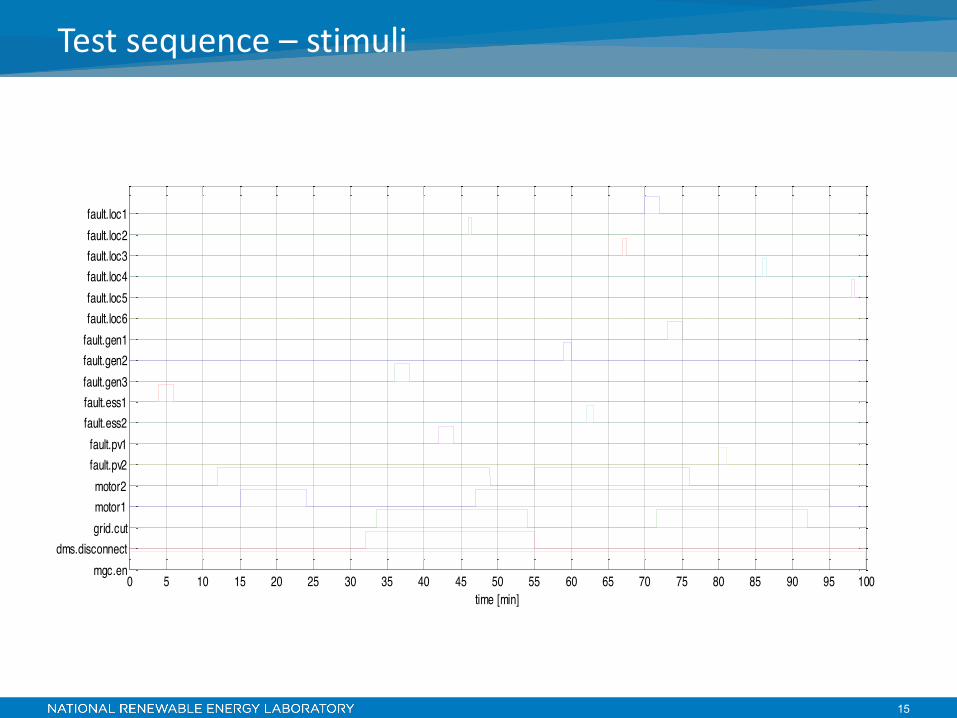
Test sequence – stimuli
0 5 10 15 20 25 30 35 40 45 50 55 60 65 70 75 80 85 90 95 100mgc.en
dms.disconnectgrid.cutmotor1motor2
fault.pv2fault.pv1
fault.ess2fault.ess1fault.gen3fault.gen2fault.gen1fault.loc6fault.loc5fault.loc4fault.loc3fault.loc2fault.loc1
time [min]
16
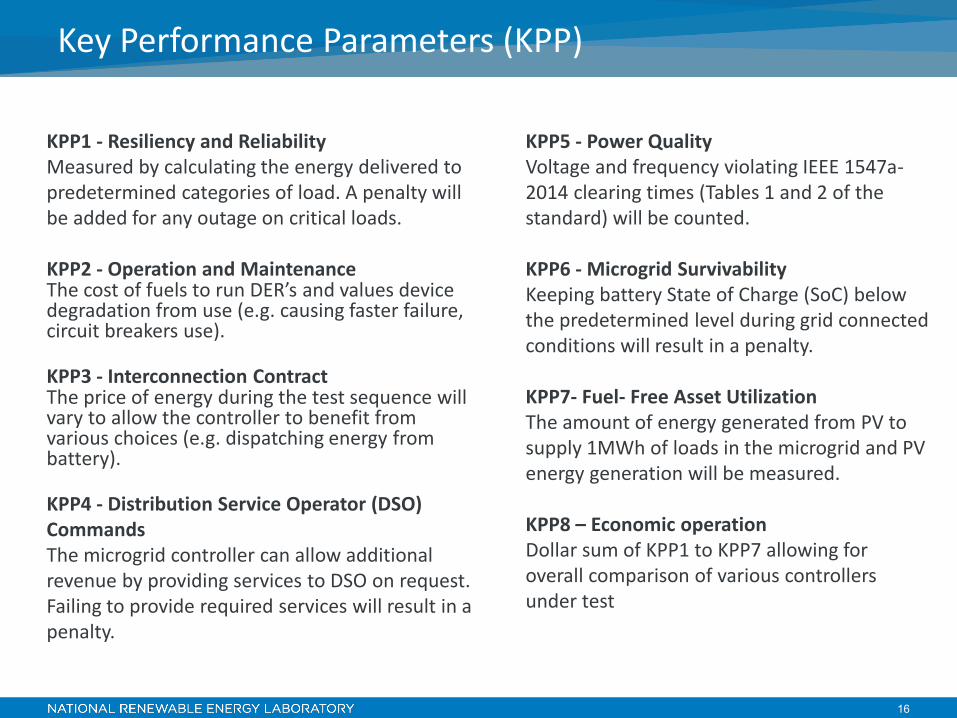
KPP1 - Resiliency and Reliability Measured by calculating the energy delivered to predetermined categories of load. A penalty will be added for any outage on critical loads. KPP2 - Operation and Maintenance The cost of fuels to run DER’s and values device degradation from use (e.g. causing faster failure, circuit breakers use). KPP3 - Interconnection Contract The price of energy during the test sequence will vary to allow the controller to benefit from various choices (e.g. dispatching energy from battery). KPP4 - Distribution Service Operator (DSO) Commands The microgrid controller can allow additional revenue by providing services to DSO on request. Failing to provide required services will result in a penalty.
Key Performance Parameters (KPP)
KPP5 - Power Quality Voltage and frequency violating IEEE 1547a-2014 clearing times (Tables 1 and 2 of the standard) will be counted. KPP6 - Microgrid Survivability Keeping battery State of Charge (SoC) below the predetermined level during grid connected conditions will result in a penalty. KPP7- Fuel- Free Asset Utilization The amount of energy generated from PV to supply 1MWh of loads in the microgrid and PV energy generation will be measured. KPP8 – Economic operation Dollar sum of KPP1 to KPP7 allowing for overall comparison of various controllers under test
17
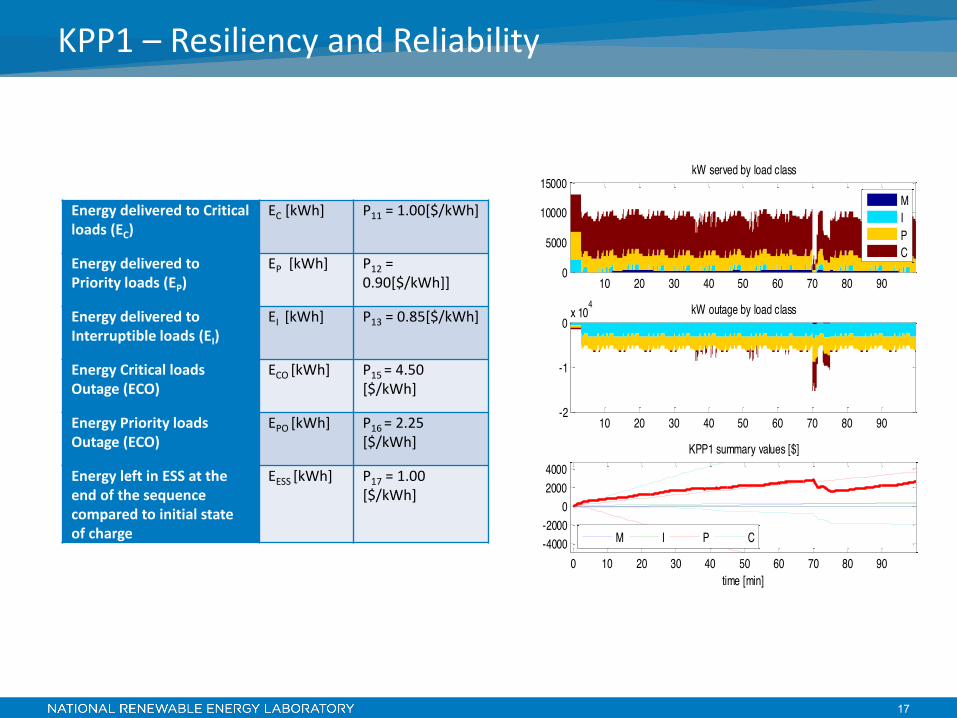
Energy delivered to Critical loads (EC)
EC [kWh] P11 = 1.00[$/kWh]
Energy delivered to Priority loads (EP)
EP [kWh] P12 = 0.90[$/kWh]]
Energy delivered to Interruptible loads (EI)
EI [kWh] P13 = 0.85[$/kWh]
Energy Critical loads Outage (ECO)
ECO [kWh] P15 = 4.50 [$/kWh]
Energy Priority loads Outage (ECO)
EPO [kWh] P16 = 2.25 [$/kWh]
Energy left in ESS at the end of the sequence compared to initial state of charge
EESS [kWh] P17 = 1.00 [$/kWh]
KPP1 – Resiliency and Reliability
10 20 30 40 50 60 70 80 900
5000
10000
15000kW served by load class
MIPC
10 20 30 40 50 60 70 80 90-2
-1
0x 10
4 kW outage by load class
0 10 20 30 40 50 60 70 80 90-4000-2000
020004000
time [min]
KPP1 summary values [$]
M I P C
18
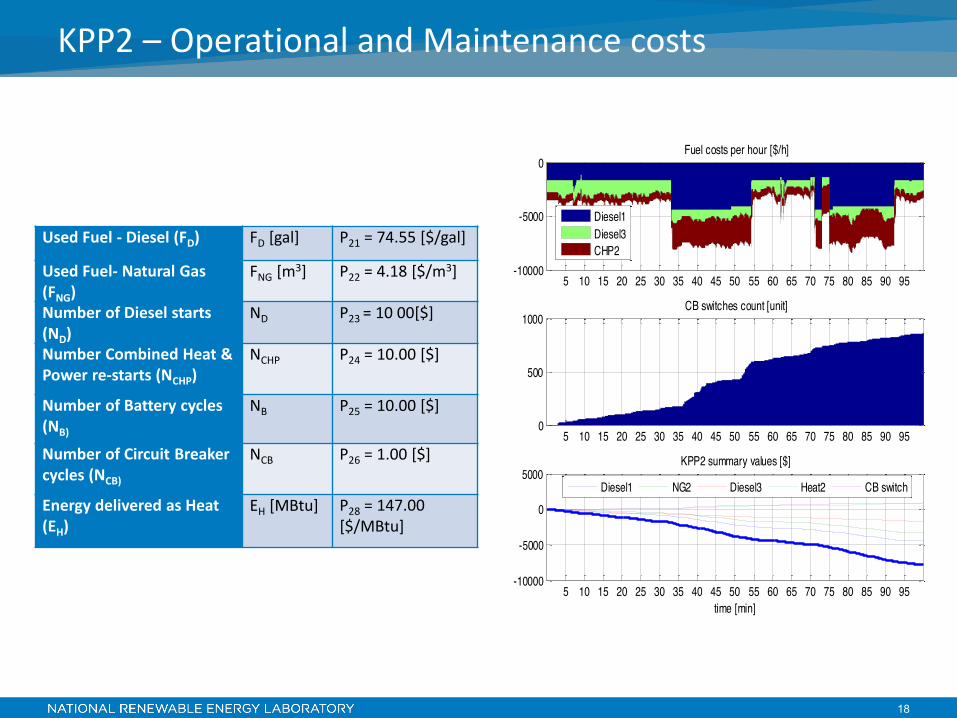
KPP2 – Operational and Maintenance costs
Used Fuel - Diesel (FD) FD [gal] P21 = 74.55 [$/gal]
Used Fuel- Natural Gas (FNG)
FNG [m3] P22 = 4.18 [$/m3]
Number of Diesel starts (ND)
ND P23 = 10 00[$]
Number Combined Heat & Power re-starts (NCHP)
NCHP P24 = 10.00 [$]
Number of Battery cycles (NB)
NB P25 = 10.00 [$]
Number of Circuit Breaker cycles (NCB)
NCB P26 = 1.00 [$]
Energy delivered as Heat (EH)
EH [MBtu] P28 = 147.00 [$/MBtu]
5 10 15 20 25 30 35 40 45 50 55 60 65 70 75 80 85 90 95-10000
-5000
0Fuel costs per hour [$/h]
Diesel1Diesel3CHP2
5 10 15 20 25 30 35 40 45 50 55 60 65 70 75 80 85 90 950
500
1000CB switches count [unit]
5 10 15 20 25 30 35 40 45 50 55 60 65 70 75 80 85 90 95-10000
-5000
0
5000KPP2 summary values [$]
time [min]
Diesel1 NG2 Diesel3 Heat2 CB switch
19
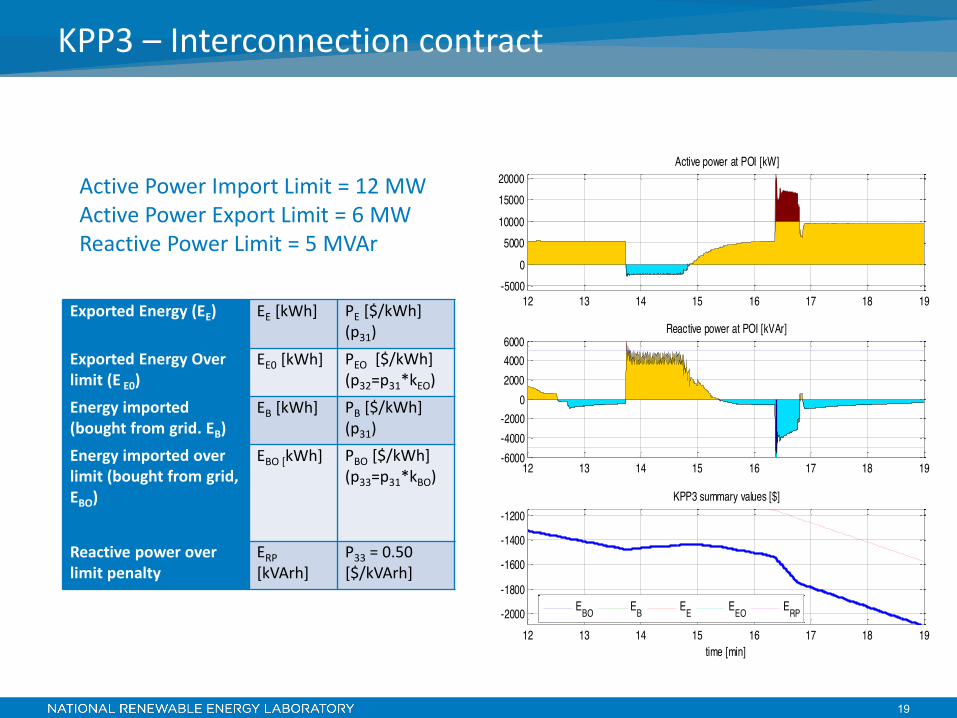
KPP3 – Interconnection contract
Exported Energy (EE) EE [kWh] PE [$/kWh] (p31)
Exported Energy Over limit (E E0)
EE0 [kWh] PEO [$/kWh] (p32=p31*kEO)
Energy imported (bought from grid. EB)
EB [kWh] PB [$/kWh] (p31)
Energy imported over limit (bought from grid, EBO)
EBO [kWh] PBO [$/kWh] (p33=p31*kBO)
Reactive power over limit penalty
ERP [kVArh]
P33 = 0.50 [$/kVArh]
12 13 14 15 16 17 18 19-5000
05000
100001500020000
Active power at POI [kW]
12 13 14 15 16 17 18 19-6000-4000-2000
0200040006000
Reactive power at POI [kVAr]
12 13 14 15 16 17 18 19-2000
-1800
-1600
-1400
-1200KPP3 summary values [$]
time [min]
EBO EB EE EEO ERP
Active Power Import Limit = 12 MW Active Power Export Limit = 6 MW Reactive Power Limit = 5 MVAr
20
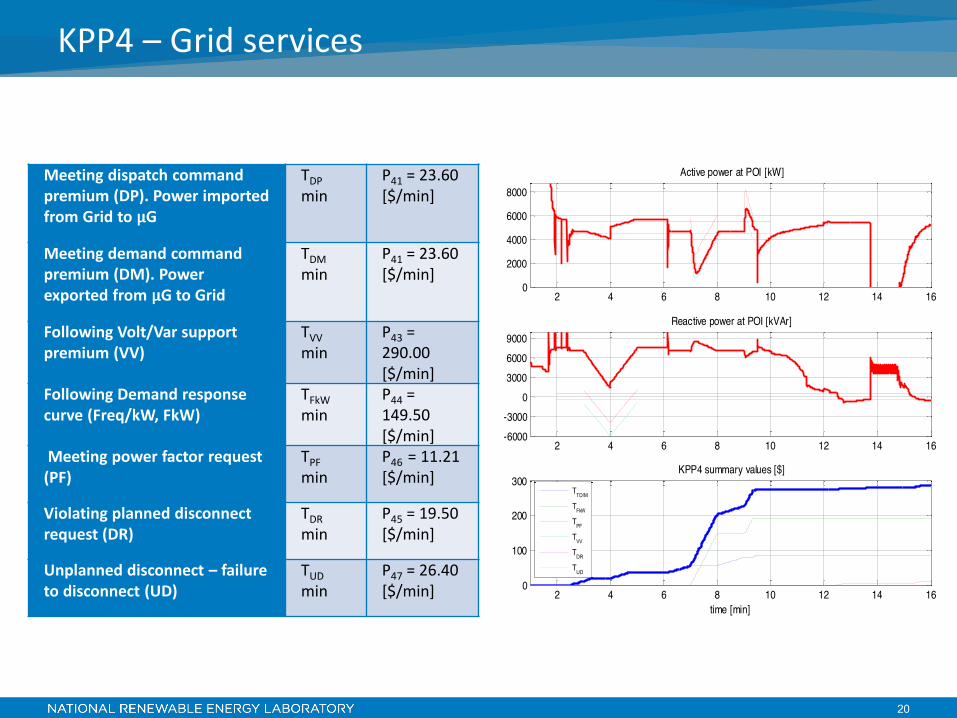
Meeting dispatch command premium (DP). Power imported from Grid to μG
TDP min
P41 = 23.60 [$/min]
Meeting demand command premium (DM). Power exported from μG to Grid
TDM min
P41 = 23.60 [$/min]
Following Volt/Var support premium (VV)
TVV min
P43 = 290.00 [$/min]
Following Demand response curve (Freq/kW, FkW)
TFkW min
P44 = 149.50 [$/min]
Meeting power factor request (PF)
TPF min
P46 = 11.21 [$/min]
Violating planned disconnect request (DR)
TDR min
P45 = 19.50 [$/min]
Unplanned disconnect – failure to disconnect (UD)
TUD min
P47 = 26.40 [$/min]
KPP4 – Grid services
2 4 6 8 10 12 14 160
2000
4000
6000
8000
Active power at POI [kW]
2 4 6 8 10 12 14 16-6000-3000
0300060009000
Reactive power at POI [kVAr]
2 4 6 8 10 12 14 160
100
200
300KPP4 summary values [$]
time [min]
TTD/M
TFkW
TPF
TVV
TDR
TUD
21
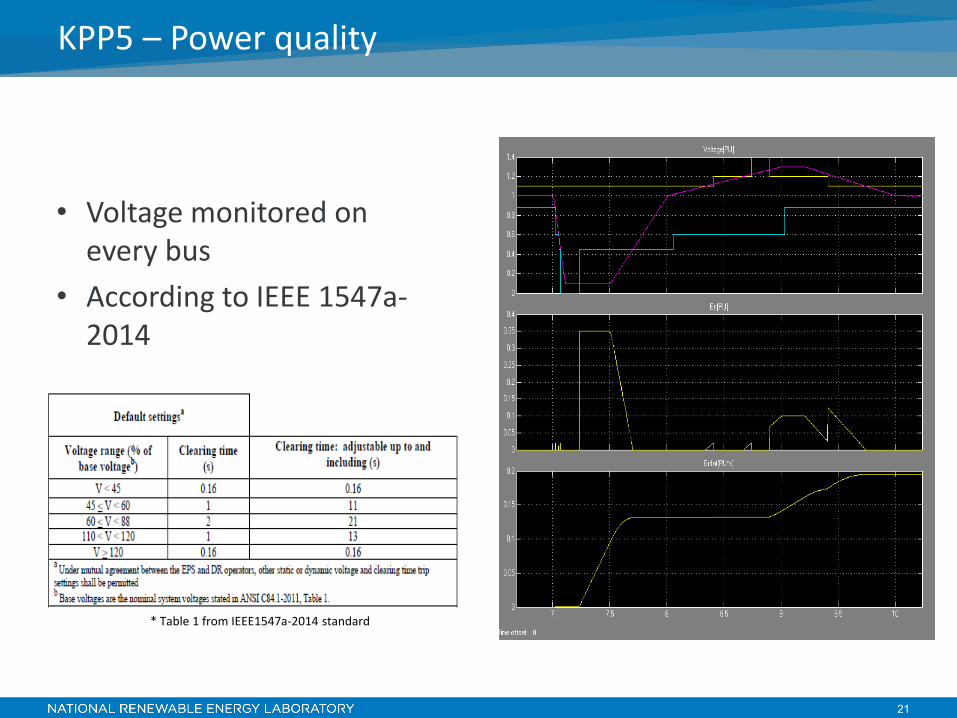
KPP5 – Power quality
• Voltage monitored on every bus
• According to IEEE 1547a-2014
* Table 1 from IEEE1547a-2014 standard
22
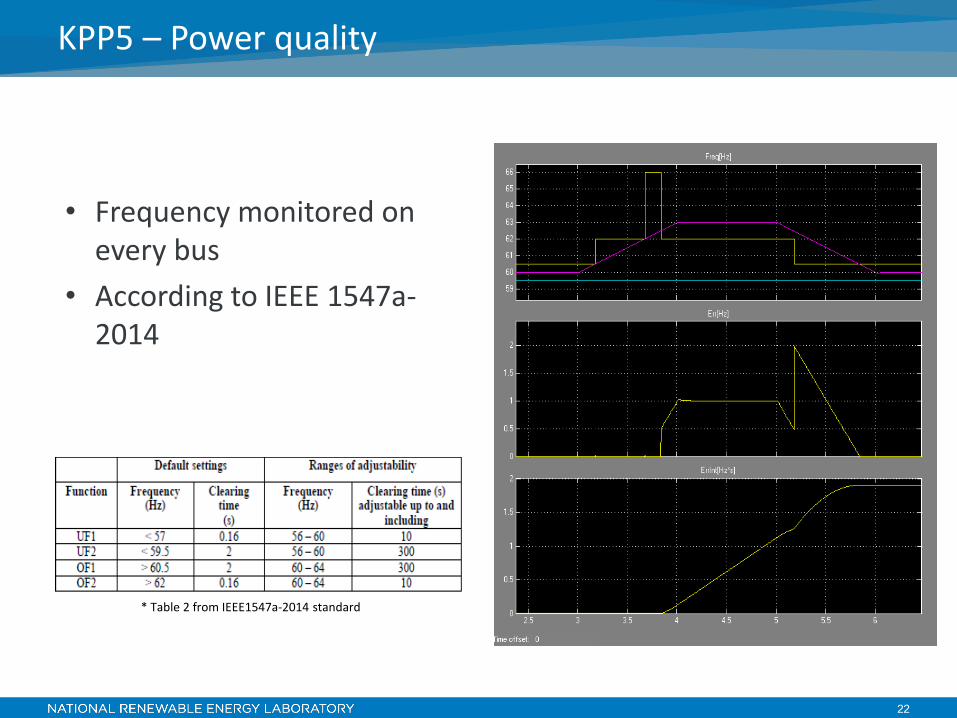
KPP5 – Power quality
• Frequency monitored on every bus
• According to IEEE 1547a-2014
* Table 2 from IEEE1547a-2014 standard
23
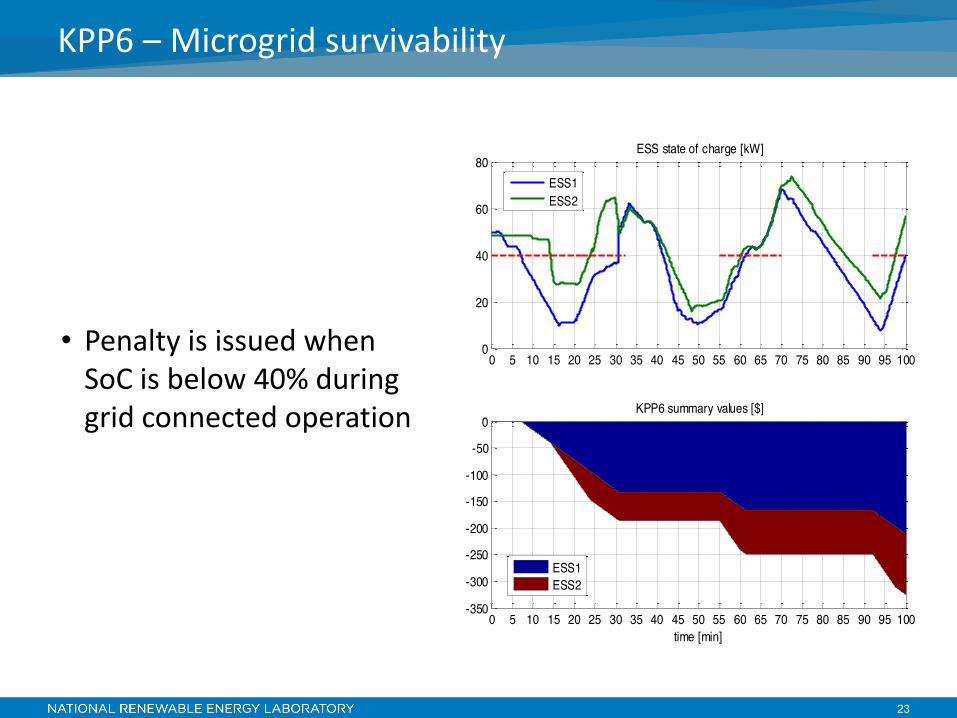
KPP6 – Microgrid survivability
• Penalty is issued when SoC is below 40% during grid connected operation
0 5 10 15 20 25 30 35 40 45 50 55 60 65 70 75 80 85 90 95 1000
20
40
60
80ESS state of charge [kW]
ESS1ESS2
0 5 10 15 20 25 30 35 40 45 50 55 60 65 70 75 80 85 90 95 100-350
-300
-250
-200
-150
-100
-50
0KPP6 summary values [$]
time [min]
ESS1ESS2
24
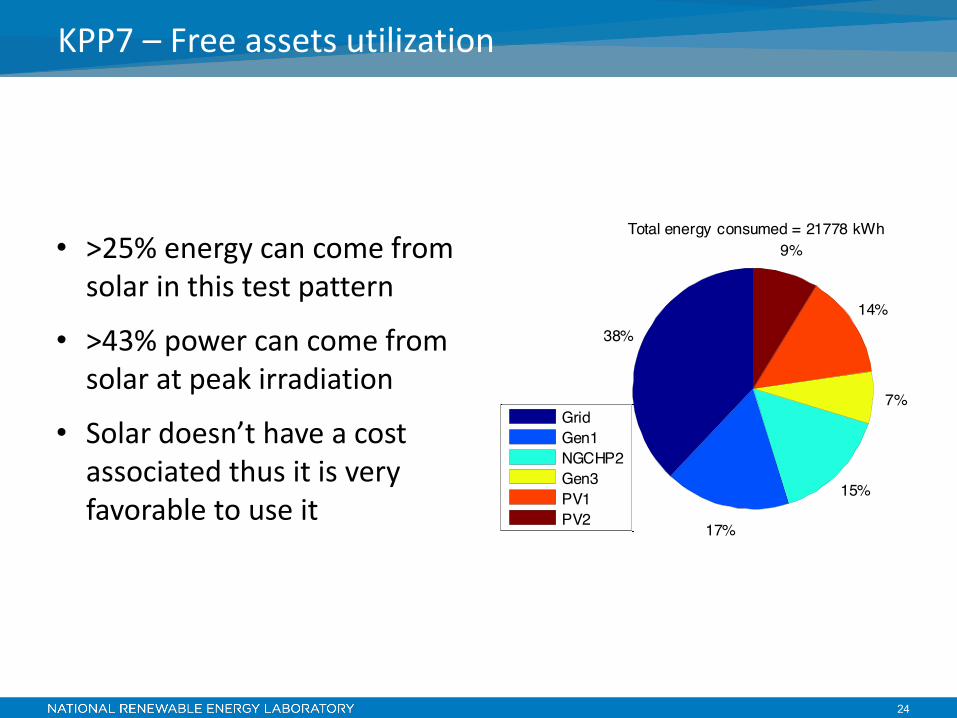
38%
17%
15%
7%
14%
9%Total energy consumed = 21778 kWh
GridGen1NGCHP2Gen3PV1PV2
2%
17%
34%
47%
Consumption by loads = 19624 kWh
MIPC
KPP7 – Free assets utilization
• >25% energy can come from solar in this test pattern
• >43% power can come from solar at peak irradiation
• Solar doesn’t have a cost associated thus it is very favorable to use it
25
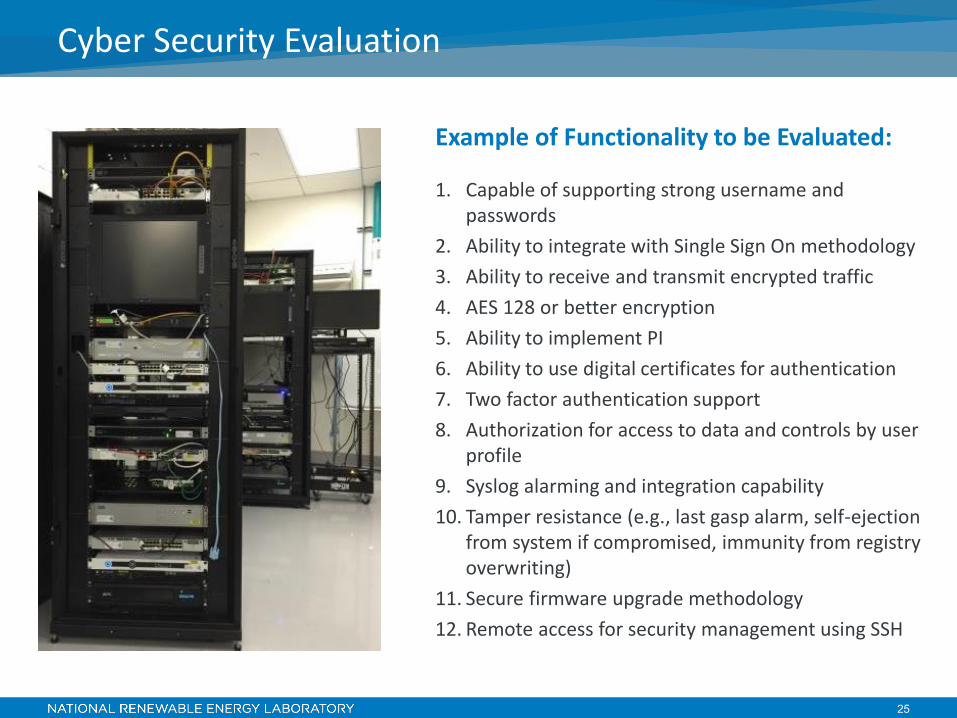
Cyber Security Evaluation
1. Capable of supporting strong username and passwords
2. Ability to integrate with Single Sign On methodology 3. Ability to receive and transmit encrypted traffic 4. AES 128 or better encryption 5. Ability to implement PI 6. Ability to use digital certificates for authentication 7. Two factor authentication support 8. Authorization for access to data and controls by user
profile 9. Syslog alarming and integration capability 10. Tamper resistance (e.g., last gasp alarm, self-ejection
from system if compromised, immunity from registry overwriting)
11. Secure firmware upgrade methodology 12. Remote access for security management using SSH
Example of Functionality to be Evaluated:
26
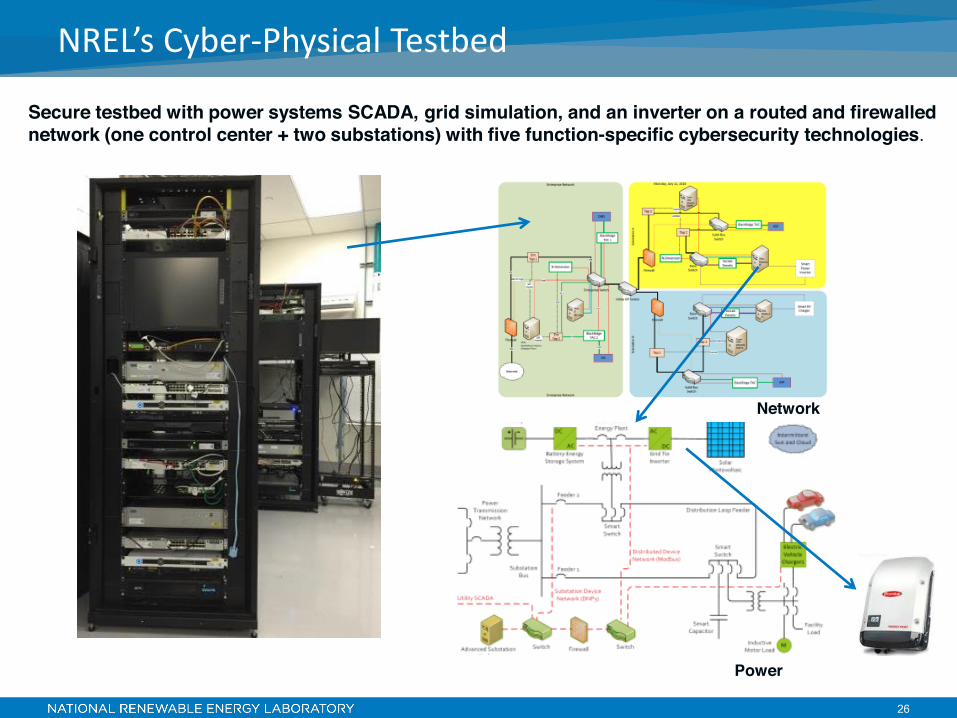
NREL’s Cyber-Physical Testbed
Secure testbed with power systems SCADA, grid simulation, and an inverter on a routed and firewalled network (one control center + two substations) with five function-specific cybersecurity technologies.
Network
Power
27
• Currently at Stage 1 (CHIL) and validating Team #4 • We will publish details about competition winner’s
strategies and analyze various teams’ approaches • Models will be published after procurement:
github.com/mgcp2017/
Next steps
Recommended(Prac,ce(for(Hardware0in0the0Loop((HIL)(Simula,on(Based(Tes,ng(of(Electric(Power(Apparatus(
and(Controls Newly&established*IEEE*WG&P2004&
1*
IEEE(WG(P2004(Basics
• Chair:*Michael&“Mischa”&Steurer*Florida*State*University,*Tallahassee,*FL,*USA,**• Co:Chair:*Georg&Lauss,**Austrian*Ins1tute*of*Technology,**Vienna,*Austria*• Secretary:*Blake&Lundstrom,**Na1onal*Renewable*Energy*Laboratory,**Golden,*CO,*USA*• Sponsor:*PELS&• Co:sponsor:*IAS,&IES&• PAR*ends*12/31/2021&
4*
The(philosophy(of(P2004 • The*intent*of*WG*P2004*is*to*remain*agnosBc&to&the&specific&realLBme&simulaBon&and&power&lifier&technologies&but*focus*on*the*structures,&models,&and&procedures&specific&to*conducBng&HIL*based*tes1ng*• One*challenge*P2004*will*have*to*overcome*is*to*keep*the*document*as*generic*as*possible*so*it*does*not*conflict*with*exis1ng*tes1ng*standards*
• P2004*will*• Establish*pracBces&for&ROS&model&development&&• Discuss&HIL&specific&documentaBon,&verificaBon&and&validaBon**
• Provide*guidance&on&requirements&for&power&lifiers,&DRTS,&and*HIL&interface&algorithms&for*classes&of&HIL&tesBng&needs&
6*
Contact(IEEE(WG(P2004 • Email:*[email protected]*• Chair:*Michael*“Mischa”*Steurer,*[email protected]*,*+1:850:644:1629*
• Co:Chair:*Georg*Lauss,*[email protected]*,*+43:50550:6283*• Secretary:*Blake*Lundstrom,*[email protected]*,*+1:303:275:4385*
• Data*repository*and*web*site:*IEEE*iMeet*work*space*
*
How*to*sign*up?*• Sheet*is*passing*around*right*now*• Email*Blake*Lundstrom*
9*