Embed Size (px)
Citation preview
PAGE 1 | Carbon Reduction Opportunities in the California Petroleum Industry
AuthORs
Karen Law [email protected]
Michael Chan [email protected]
Tetra Tech, Inc.
COntRIbutInG AuthOR
simon Mui, Ph.D. [email protected]
Natural Resources Defense Council
Carbon Reduction Opportunities in the California Petroleum Industry
NRDC Issue brIef OCtObER 2013 Ib:13-09-e
suMMARy
As industry leaders and policymakers seek to reduce the carbon pollution impacts caused
by human activity, the petroleum supply chain and the use of petroleum products present
numerous and significant opportunities for emission reductions. from crude oil production
and refining to gasoline and diesel use in vehicles, each portion of the supply chain contributes to the
oil industry’s carbon footprint. While substitution of cleaner energy sources for oil is a key strategy to
reduce carbon pollution, it is also important to take advantage of the technologies currently available
that can directly reduce the carbon footprint of petroleum from production to final use. Opportunities
to shrink this footprint include, but are not limited to:
n renewable steam generation: generating steam for enhanced oil recovery using solar power,
rather than combusting fossil fuels in once-through steam generators.n steam generation with carbon capture and sequestration (CCs): capturing and storing the flue
gas emissions from once-through steam generators used in enhanced oil recovery.
n refinery energy efficiency: enabling refineries to use less energy in their operations, thereby
reducing their carbon emissions.
n refinery CCs: capturing and storing carbon emissions resulting from the energy-intensive
hydrogen processes needed for refining crude oil.
n renewable refinery feedstocks: displacing part of the refinery’s crude oil with natural oils, such
as animal fats and waste oils, thereby reducing the full-fuel-cycle carbon intensity of the final
refinery products.

PAGE 2 | Carbon Reduction Opportunities in the California Petroleum Industry
The five technologies analyzed here do not encompass the full suite of opportunities to reduce greenhouse gas emissions (GHG, or herein “carbon”) in the petroleum supply chain; such an extensive analysis is beyond the scope of this brief. Some of these additional technologies or practices include use of renewable electricity at refineries, use of biomass as an energy input, use of clean distributed generation technologies at oil production operations, renewable hydrogen inputs at refineries, avoidance of lower-quality crude oils that require greater extraction and refining energy, lower-carbon technologies for enhanced oil recovery that utilize gas or chemical injection, and efficiency improvements at crude oil production facilities.1,2 In addition to these limitations, this brief does not evaluate the costs or cost-effectiveness of the various technologies or the potential reductions in criteria air pollutants.
This brief analyzes a low and a high market adoption scenario for the 2014 to 2020 period to illustrate the potential impact of implementing the five carbon reduction technologies identified above. The low case represents a conservative scenario in which the technologies are adopted to a limited degree, whereas the high case represents a scenario in which the technologies are adopted more broadly, though still to a reasonable and achievable degree as discussed further in this brief. These cases are applied to California, which accounts for 11 percent of total U.S. petroleum refining capacity and 8 percent of total U.S. crude oil production.3 GHG emissions from California petroleum refining and crude oil production are currently estimated to be approximately 31 million metric tons of CO2e and 17 MMT, respectively, for a total of 48 MMT.4
In the low case, the combined GHG emission reductions may be 2.8 million metric tons annually in 2020. In the high case, the combined reductions may be approximately 6.6 million metric tons annually in 2020. As a reference point, the full potential of these technologies—if adopted across
the board—would be more than 20 million metric tons of reduction annually.
These carbon reduction technologies can make major contributions to the petroleum industry’s obligations under California’s Global Warming Solutions Act of 2006 (known as AB32). In addition to carbon pollution reduction, many of these technologies can significantly reduce other air pollutants, providing further benefits to public health. If these technologies were all eligible reduction pathways under California’s Low Carbon Fuel Standard (LCFS), part of AB32, even moderate adoption could meet a substantial portion of obligations for refiners under the standard, which requires a reduction of 17 million metric tons in 2020.5 Overall, the potential to reduce carbon emissions from the petroleum industry is sizeable, and the technologies to achieve these reductions are available and viable. Additional opportunities, such as CCS at the refinery beyond hydrogen applications, and higher levels of renewable refinery feedstock content and inputs can further reduce the carbon footprint of the petroleum industry.
tEChnOLOGIEs tO REDuCE CARbOn EMIssIOns
The petroleum supply chain consists of multiple stages that, together with vehicle fuel combustion, are responsible for the full-fuel-cycle carbon emissions of the final products, such as gasoline and diesel. From crude oil production through refining to fuel combustion in vehicles, each portion of the supply chain contributes to the total carbon footprint of the petroleum industry. Furthermore, each offers opportunities to reduce this footprint. Three key stages where carbon reduction technologies can significantly impact total emissions are crude oil recovery, refinery processes, and vehicle fuel combustion.
the petroleum supply chain offers at least three key areas where promising technologies can enable significant reductions in carbon emissions. the percentages shown represent the contribution of each stage to total life-cycle emissions. Crude oil transport and finished product transport represent less than 2% of emissions. the totals are less than 100% due to rounding.
STEAM GENERATION FOR CRUDE OIL RECOVERY
1% 0.4%
REFINERYPROCESS14%11% VEHICLE FUEL
COMBUSTION73%
PAGE 3 | Carbon Reduction Opportunities in the California Petroleum Industry
Crude Oil RecoveryThe recovery (or extraction) stage may include the use of artificial lift or enhanced recovery methods to push crude oil from underground reservoirs to the surface after the natural reservoir pressure falls to a point where the well cannot produce on its own. In some cases, this process is accomplished by the injection of gas, water, or chemical agents to facilitate recovery. The major greenhouse gas emission sources at this stage are tied to energy use to lift or pump crude oil from the subsurface, production of steam in thermal enhanced oil recovery operations, and potential gas venting, flaring, and fugitive (VFF) emissions.6
For some oil fields, steam injection is used to enhance crude oil recovery by decreasing viscosity, causing the oil to swell, and helping sweep the oil out of the reservoir rock.7,8 In California, modern steam injection has been utilized since 1960. Today, steam injection is used to produce approximately 70 percent of the 630,000 barrels per day of oil produced in California.9 Conventionally, fossil fuels such as natural gas are combusted to generate the steam, which is then pumped into injection wells.10 The process is energy intensive, and the combustion of fossil fuel releases carbon into the atmosphere.11 Two technologies that can eliminate this carbon release include:
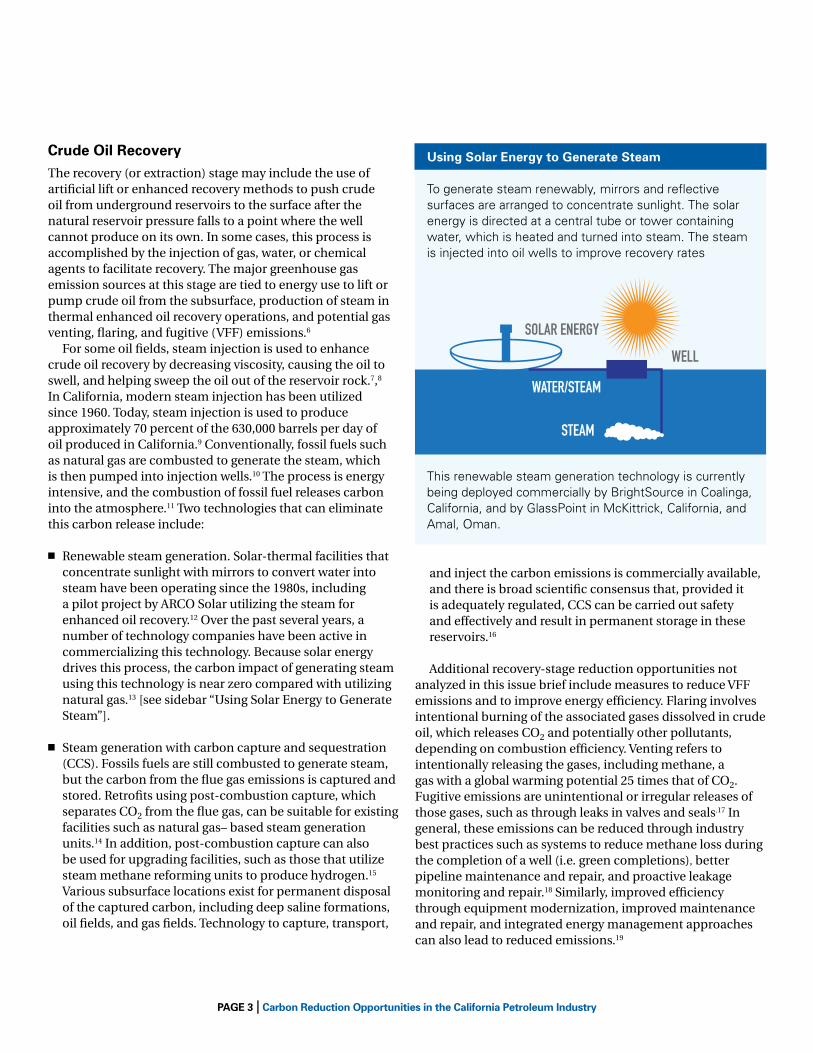
n Renewable steam generation. Solar-thermal facilities that concentrate sunlight with mirrors to convert water into steam have been operating since the 1980s, including a pilot project by ARCO Solar utilizing the steam for enhanced oil recovery.12 Over the past several years, a number of technology companies have been active in commercializing this technology. Because solar energy drives this process, the carbon impact of generating steam using this technology is near zero compared with utilizing natural gas.13 [see sidebar “Using Solar Energy to Generate Steam”].
n Steam generation with carbon capture and sequestration (CCS). Fossils fuels are still combusted to generate steam, but the carbon from the flue gas emissions is captured and stored. Retrofits using post-combustion capture, which separates CO2 from the flue gas, can be suitable for existing facilities such as natural gas– based steam generation units.14 In addition, post-combustion capture can also be used for upgrading facilities, such as those that utilize steam methane reforming units to produce hydrogen.15 Various subsurface locations exist for permanent disposal of the captured carbon, including deep saline formations, oil fields, and gas fields. Technology to capture, transport,
and inject the carbon emissions is commercially available, and there is broad scientific consensus that, provided it is adequately regulated, CCS can be carried out safety and effectively and result in permanent storage in these reservoirs.16
Additional recovery-stage reduction opportunities not analyzed in this issue brief include measures to reduce VFF emissions and to improve energy efficiency. Flaring involves intentional burning of the associated gases dissolved in crude oil, which releases CO2 and potentially other pollutants, depending on combustion efficiency. Venting refers to intentionally releasing the gases, including methane, a gas with a global warming potential 25 times that of CO2. Fugitive emissions are unintentional or irregular releases of those gases, such as through leaks in valves and seals.17 In general, these emissions can be reduced through industry best practices such as systems to reduce methane loss during the completion of a well (i.e. green completions), better pipeline maintenance and repair, and proactive leakage monitoring and repair.18 Similarly, improved efficiency through equipment modernization, improved maintenance and repair, and integrated energy management approaches can also lead to reduced emissions.19
using solar Energy to Generate steam
To generate steam renewably, mirrors and reflective surfaces are arranged to concentrate sunlight. The solar energy is directed at a central tube or tower containing water, which is heated and turned into steam. The steam is injected into oil wells to improve recovery rates
This renewable steam generation technology is currently being deployed commercially by brightsource in Coalinga, California, and by GlassPoint in McKittrick, California, and Amal, Oman.
STEAM GENERATION FOR CRUDE OIL RECOVERY
1% 0.4%
REFINERYPROCESS14%11% VEHICLE FUEL
COMBUSTION73%
SOLAR ENERGY
WELL
WATER/STEAM
STEAM

PAGE 4 | Carbon Reduction Opportunities in the California Petroleum Industry
Opportunities for Refinery Energy Efficiency
The California Air resources board reports that the largest refineries in the state have implemented or are currently implementing efficiency improvement projects whose impact will be equivalent to approximately an 8 percent reduction in refining emissions. These projects involve boilers (cogeneration, steam, and combined cycle plants), electric motors, stationary combustion (gas turbines), steam motors, thermal equipment (furnaces and heat exchangers), and other equipment (including refinery-wide projects and flare systems).
Refinery ProcessesRefineries are a collection of complex chemical process systems that convert crude oil to valuable petroleum products like gasoline, diesel, kerosene, and jet fuel. These typically include distillation, cracking, treating, and reforming. Carbon emissions result from the series of steps required to upgrade the crude oil into its final products. Two technologies that can reduce these emissions are:
n Refinery energy efficiency. Continual improvements in the efficiency of the refinery enable it to use less energy in its operations, thereby reducing its carbon impact. Measures that increase the energy efficiency of a refinery include improved controls, improved heat recovery, hydrogen and fuel gas management, utilities optimization, and advanced process technologies. McKinsey & Company (2011) found that the U.S. refining industry could reduce its energy use by 13 percent by 2020 through commercially available technologies at an internal rate of return of at least 10 percent; others, such as Energetics Incorporated (2006), found that the technical potential was as high as 26 percent if best practices and state-of-the-art technologies were used.20
n Refinery CCS. As with carbon capture and sequestration for steam generation, emissions are not vented into the atmosphere but are instead stored over geological timescales with active measurement, monitoring, and verification protocols. There are many point sources of CO2 emissions from refinery operations, including hydrogen production, the fluid catalytic cracking (FCC) unit, steam generation, and localized heat requirements. One particular carbon reduction opportunity among refinery processes is hydrogen-related CCS. The production of hydrogen by reforming or gasifying fossil fuels and its use in the refinery both emit carbon dioxide. Hydrogen production usually represents the best capture and sequestration opportunity at the facility, capable of appreciably reducing overall refinery emissions.21,22 Other potential CO2 sources within a refinery are not included in this assessment. [See sidebar on “Opportunities for Refinery Energy Efficiency”] While not analyzed here, the use of lower-quality crude
oils and/or heavier crude oils —including but not limited to tar sands or other extra-heavy crude oils— can also result in greater production and refining emissions due to the additional energy necessary to extract, upgrade, and refine these feedstocks. California refineries utilize a significant mix of heavy crude oils, which is one reason why average refining
emissions in California are higher than those in other major U.S. refining regions.23 Reduced reliance on lower-quality or heavier crude oil feedstocks, through a switch to lighter, higher-quality crude oils and renewable crude oils, can help reduce carbon emissions and yield additional benefits in terms of reduced air pollutants, so long as the switch reduces overall production and refining of lower-quality, heavier crude oil and does not result in shifting those crude oils elsewhere.24
Vehicle Fuel CombustionAt the end of the petroleum supply and processing chain, petroleum fuels like diesel are combusted to provide motive power. Examining only the fuel portion of the carbon footprint, most of the carbon content of the feedstocks used to create the fuel is released during vehicle operation and represents 73 percent of the total life cycle, or well-to-wheels, emissions for gasoline.25 On a full-fuel-cycle
source: www.arb.ca.gov/cc/energyaudits/publicreports.htm.
0.0
0.5
1.0
1.5
2.0
2.5
3.0
3.5
0
1
2
3
4
5
6
7
8
■ Renewable Feedstocks (Refinery)
■ Solar Thermal or CCS (Crude Oil Recovery)
■ CCS (Refinery)
■ Efficiency (Refinery)
■ Number of Current and Potential Projects■ Emission Reductions
2014 2015 2016 2017 2018 2019 2020Year
An
nu
al E
mis
sio
n R
edu
ctio
ns
Mill
ion
Met
ric
Ton
s C
O2e
Mill
ion
Met
ric
Ton
s C
O2e
Num
ber o
f Pro
ject
s (C
A R
efin
erie
s)
Ann
ual E
mis
sion
Red
uctio
ns
(MM
T CO
2e)
2014 2015 2016 2017 2018 2019 2020Year
0
30
60
90
120
150
0.0
0.2
0.4
0.6
0.8
1.0
1.2
Boile
r
Elec
trica
l Onl
yEq
uipm
ent
Stat
iona
ry C
ombu
stio
n St
eam
Only
Sys
tem
Ther
mal
Equ
ipm
ent
Othe
r E
quip
men
t
PAGE 5 | Carbon Reduction Opportunities in the California Petroleum Industry
basis, combusting fuel from petroleum directly increases atmospheric carbon concentration, whereas renewable feedstocks like biomass are grown using carbon dioxide from the atmosphere and can result in lower net emissions if regrown. The petroleum industry can reduce the direct emissions of fuel use in vehicles by reducing the carbon intensity of the fuel itself through many types of renewable feedstocks.
n Renewable refinery feedstocks. By displacing part of the crude oil with feedstocks from renewable sources, the carbon intensity of the ultimate fuel can be reduced. The use of natural oils, including animal fats, waste grease, and vegetable oils, does not completely eliminate the fuel’s carbon impact, as the processing of renewable feedstocks and direct and indirect land conversion also generate emissions, but the full-fuel-cycle carbon intensity of diesel from renewable feedstocks can be 16 to 60 percent less than that of diesel made from crude oil alone. While
supply and availability limitations will prevent renewable biomass from entirely replacing crude oil feedstocks, other opportunities, such as renewable electricity use, can also reduce carbon intensity but were not evaluated here.
POtEntIAL tO REDuCE CARbOn EMIssIOnsThe technologies described above can offer significant reductions in carbon emissions associated with the production of transportation fuels, as shown below. For comparison, the carbon intensities—on a full-life-cycle basis—of petroleum-based gasoline and diesel in California today are 99.18 and 98.03 gCO2e/MJ, respectively.26
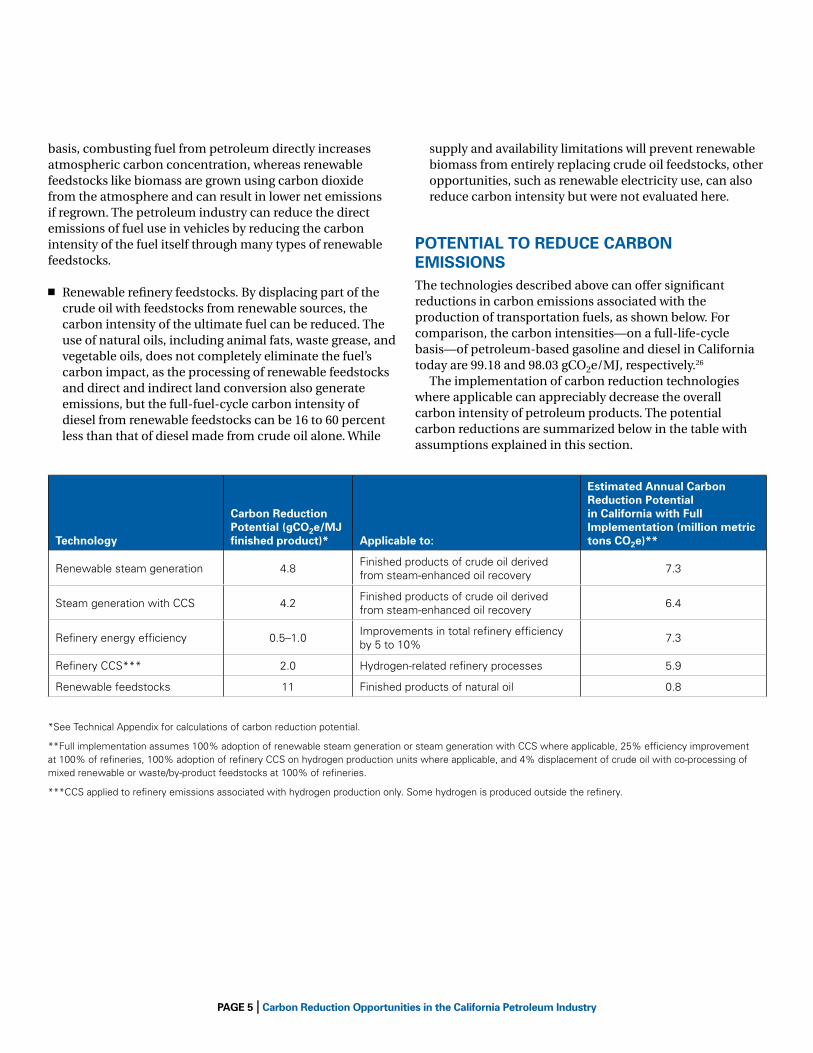
The implementation of carbon reduction technologies where applicable can appreciably decrease the overall carbon intensity of petroleum products. The potential carbon reductions are summarized below in the table with assumptions explained in this section.
technology
Carbon Reduction Potential (gCO2e/MJ finished product)* Applicable to:
Estimated Annual Carbon Reduction Potential in California with Full Implementation (million metric tons CO2e)**
renewable steam generation 4.8finished products of crude oil derived from steam-enhanced oil recovery
7.3
steam generation with CCs 4.2finished products of crude oil derived from steam-enhanced oil recovery
6.4
refinery energy efficiency 0.5–1.0Improvements in total refinery efficiency by 5 to 10%
7.3
refinery CCs*** 2.0 Hydrogen-related refinery processes 5.9
renewable feedstocks 11 finished products of natural oil 0.8
*see Technical Appendix for calculations of carbon reduction potential.
**full implementation assumes 100% adoption of renewable steam generation or steam generation with CCs where applicable, 25% efficiency improvement at 100% of refineries, 100% adoption of refinery CCs on hydrogen production units where applicable, and 4% displacement of crude oil with co-processing of mixed renewable or waste/by-product feedstocks at 100% of refineries.
***CCs applied to refinery emissions associated with hydrogen production only. some hydrogen is produced outside the refinery.

PAGE 6 | Carbon Reduction Opportunities in the California Petroleum Industry
hIGh AnD LOw ADOPtIOn CAsEsTo illustrate the potential impact of implementing the various carbon reduction technologies within the petroleum industry, two adoption cases between 2013 and 2020 were explored by Tetra Tech, Inc., using assumptions about potential adoption rates and quantitative estimates of emission reductions. The low case represents a conservative market scenario in which the oil producers and refineries adopt technologies to a limited degree, whereas the high case represents a scenario in which adoption is broader, though still to a reasonable and achievable degree. Assumptions for each technology in the low and high cases are described below.
Renewable steam GenerationSteam generation by concentrating solar energy can replace combusting natural gas expressly for the purpose of generating steam to enhance oil recovery. GlassPoint, a manufacturer of solar steam generators for the oil and gas industry, estimates that as much as 80 percent of natural gas use can be displaced by solar energy, and simulations show that, despite the diurnal and seasonal nature of solar energy, oil recovery from renewable steam generation may be essentially the same as that of combusting natural gas.27,28
In the low adoption case, we assume that up to 5 percent of natural gas currently used in once-through steam generators is displaced by renewable steam generation or uses CCS, as described below, by 2020. In the high case, up to 20 percent of the natural gas used in once-through steam generators in California is displaced by renewable steam generation or uses CCS. Other crude oil production facilities globally may also employ this technology, such as the GlassPoint project currently underway in Oman. This study considers only California crude oil sources, making up about 37 percent of the petroleum used in the state.29 Inclusion of reduction opportunities for foreign sources would increase the emission reduction potential.
steam Generation with CCs As an alternative to renewable steam generation, carbon from natural gas steam generation can be generally captured via post-combustion methods and stored. Retrofits using post-combustion capture, which separates CO2 from the flue gas, can be suitable for existing facilities such as natural gas–based steam generation units.30 Post-combustion capture can also be utilized for upgrading facilities, such as those that use steam methane units to produce hydrogen.31 In the low case, we assume that up to 5 percent of carbon emissions from once-through steam generators used in enhanced oil recovery are captured and sequestered or reduced using renewable steam generation, as described above, by 2020.
In the high case, up to 20 percent of these carbon emissions from California fields using natural gas steam generation are captured and sequestered or reduce using renewable steam generation. Other out-of-state crude oil production facilities that supply California refineries may also be able to employ this technology, thereby increasing the potential emission reductions. However, this issue paper focuses just on opportunities at California production facilities.
As with refinery CCS, combustion products are sequestered rather than emitted into the atmosphere. CCS is a particularly interesting option for this portion of the petroleum supply chain, as carbon dioxide injection is currently used widely for enhanced oil recovery as well, thereby aligning closely with the original purpose of steam generation. However, additional regulations are necessary for enhanced oil recovery projects to ensure that CO2 injections into oil fields are sequestered. In fact, in some cases, fields that are amenable to steam recovery may also produce higher yields through the injection of carbon dioxide.32
Refinery Energy EfficiencyThe opportunities for efficiency improvements in refinery energy consumption are substantial. Technology providers such as Honeywell UOP estimate the potential to be 12 to 25 percent in the United States, attainable through improved operation and control, improved heat recovery, advanced process technology, utilities optimization, and hydrogen and fuel gas management.33 Lawrence Berkeley National Laboratory suggests that the potential improvement may be greater than 23 percent from energy efficiency measures for refinery boilers and more than 31 percent from energy efficiency measures for steam distribution systems in the United States.34 Figures from McKinsey & Company indicate that a 13 percent improvement in refinery energy efficiency in the United States can be achieved using only commercially available technologies that offer a positive internal rate of return.35 The refinery sector public report from the California Air Resources Board, based on self-audits by refineries, indicates that approximately 2.8 million metric tons of CO2e can be avoided with refinery efficiency improvements, with just over 60 percent of the reductions coming from projects that were completed or were implemented prior to 2010.36 The avoidance of 2.8 million metric tons is equivalent to an 8 percent reduction in refining emissions. We note that these estimates are likely conservative, given that (1) the information is based on self-audits and (2) the estimates do not include the off-site production of electricity, steam, or hydrogen, which is a potential major source of emissions and would be included in a life-cycle assessment.
The authors evaluate a low and higher case, considering the aforementioned studies that cite up to a 20 to 30 percent energy efficiency improvement while recognizing that
PAGE 7 | Carbon Reduction Opportunities in the California Petroleum Industry
some refineries may have already deployed some level of energy efficiency improvements. The cases also account for some conservatism with respect to timescale for planning, permitting, and installation. The low case applies a ramp-up to a very conservative 5 percent improvement in refinery efficiency by 2020 relative to 2010 levels. A 5 percent improvement can be attained, for example, by using advanced process technology, such as new catalysts. The high case applies a ramp-up to a still conservative 10 percent improvement in refinery efficiency by 2020. This level can be attained, for example, using improved heat recovery within and across process units.
Refinery Carbon Capture and storage (CCs)In the low case, we assume that 15 percent of the refining capacity in California utilizes CCS by 2020. This adoption rate is roughly equivalent to having just one of the largest refineries in California utilize CCS.37 We assume that CCS is used to capture and store emissions from the hydrogen production unit. In the high case, up to 30 percent of the refining capacity in California utilizes CCS by 2020. This percentage is equivalent to the two largest refineries in California adopting CCS on hydrogen production.
Because CCS requires significant capital and is technologically intensive, implementation will likely take the form of maximum capture and sequestration at a small fraction of refineries, rather than partial capture and sequestration at all refineries. In addition, CCS is not limited to emissions associated with hydrogen production and may be further applied to other carbon emissions from the refinery. However, we consider only hydrogen-related CCS here since it is generally thought to be a lower-cost option that is comparatively easy to implement.
Renewable Feedstocks Renewable feedstocks can include first-generation natural oils from vegetable seeds, animal fats, and greases, or second-generation feedstocks including camelina, lignocellulosic biomass, and algal oils.38 Natural oil from renewable feedstocks is either directly co-processed with the incoming crude oil stream using existing refining equipment or processed in new, stand-alone units. For example, the Paramount Refinery in Paramount, California is currently being retrofitted to produce renewable diesel and jet fuel using Honeywell UOP technology consisting of stand-alone units, while the Valero Refinery in St. Charles, Louisiana, also has a stand-alone unit co-located with the existing refinery. For direct co-processing, there is no technical guidance yet on the maximum allowable renewable fraction that still ensures refinery performance. The level of renewable feedstock acceptable for co-processing in existing refineries depends on the level of contaminants (e.g., nitrogen, sulfur,
chlorine, alkali metals), which can negatively affect catalyst performance, as well as the risk tolerance of individual refiners. To date, tests have generally incorporated less than 5 percent renewable feedstocks through co-processing, although up to 30 percent has been proposed.39 Stand-alone units to produce renewable finished products allow for potentially higher blend levels with petroleum finished products. As more refineries adopt the use of renewables, growing industry experience with this technology will provide greater understanding and better characterization of its carbon reduction potential.
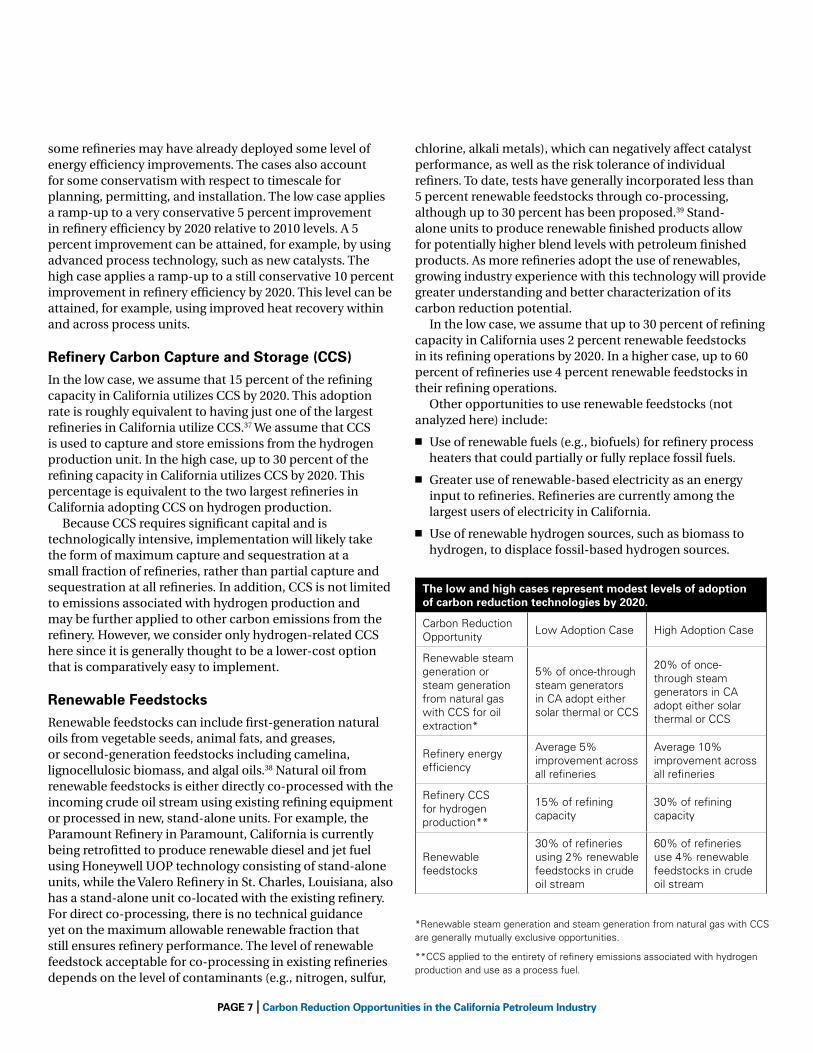
In the low case, we assume that up to 30 percent of refining capacity in California uses 2 percent renewable feedstocks in its refining operations by 2020. In a higher case, up to 60 percent of refineries use 4 percent renewable feedstocks in their refining operations. Other opportunities to use renewable feedstocks (not analyzed here) include:
n Use of renewable fuels (e.g., biofuels) for refinery process heaters that could partially or fully replace fossil fuels.
n Greater use of renewable-based electricity as an energy input to refineries. Refineries are currently among the largest users of electricity in California.
n Use of renewable hydrogen sources, such as biomass to hydrogen, to displace fossil-based hydrogen sources.
the low and high cases represent modest levels of adoption of carbon reduction technologies by 2020.
Carbon reduction Opportunity
Low Adoption Case High Adoption Case
renewable steam generation or steam generation from natural gas with CCs for oil extraction*
5% of once-through steam generators in CA adopt either solar thermal or CCs
20% of once-through steam generators in CA adopt either solar thermal or CCs
refinery energy efficiency
Average 5% improvement across all refineries
Average 10% improvement across all refineries
refinery CCs for hydrogen production**
15% of refining capacity
30% of refining capacity
renewable feedstocks
30% of refineries using 2% renewable feedstocks in crude oil stream
60% of refineries use 4% renewable feedstocks in crude oil stream
*renewable steam generation and steam generation from natural gas with CCs are generally mutually exclusive opportunities.
**CCs applied to the entirety of refinery emissions associated with hydrogen production and use as a process fuel.

PAGE 8 | Carbon Reduction Opportunities in the California Petroleum Industry
0.0
0.5
1.0
1.5
2.0
2.5
3.0
3.5
0
1
2
3
4
5
6
7
8
'$"
'%"
'&"
!"#$
$%&
'($")
*!+,
)-((
."#)
/0#$
1"2&
(3))
45$#
#$&
()56
7'$8
)7&
(3)!
/96:
)
■ Renewable Feedstocks (Refinery)
■ Solar Thermal or CCS (Crude Oil Recovery)
■ CCS (Refinery)
■ Efficiency (Refinery)
■ Renewable Feedstocks (Refinery)
■ Solar Thermal or CCS (Crude Oil Recovery)
■ CCS (Refinery)
■ Efficiency (Refinery)
2014 2015 2016 2017 2018 2019 2020Year
An
nu
al E
mis
sio
n R
edu
ctio
ns
Mill
ion
Met
ric
Ton
s C
O2e
Mill
ion
Met
ric
Ton
s C
O2e
2014 2015 2016 2017 2018 2019 2020Year
COMbInED CARbOn REDuCtIOn POtEntIALThe magnitude of potential carbon reductions in the low and high adoption cases is illustrated (in the two figures below) for California between 2014 and 2020. Refining in California represents 15 percent of total U.S. capacity. GHG emissions from California petroleum refining and crude oil production are currently estimated to be approximately 31 million metric tons of CO2e and 17 MMT, respectively, for a total of 48 MMT.40
If carbon reduction opportunities for the petroleum industry were adopted to a limited degree (low case), the combined emissions reductions could be 2.8 million metric tons annually by 2020.
If carbon reduction opportunities for the petroleum industry were adopted more broadly to a reasonable and achievable degree (high case), the combined emissions reductions could be approximately 6.6 million metric tons annually by 2020. As a reference, full adoption of these opportunities could reduce carbon emissions by approximately 20 million metric tons annually but would be unlikely to occur by 2020.
Carbon Reduction Potential under a high Adoption Case: the adoption of carbon reduction technologies to a reasonable and achievable degree is equivalent to reducing total California refining and oil production emissions by 14% by 2020.
Carbon Reduction Potential under a Low Adoption Case: the adoption of carbon reduction technologies to a limited degree is equivalent to reducing total California refining and oil production emissions by 6% by 2020.
PAGE 9 | Carbon Reduction Opportunities in the California Petroleum Industry
For oil recovery, renewable steam generation and steam generation utilizing CCS both show similar carbon benefits. Both the low and high cases evaluated here reflect conservative assumptions regarding the adoption of carbon reduction technologies by the petroleum industry. As discussed above, there are numerous technologies and applications not evaluated in this brief that may offer additional reductions. Because many of these technologies, particularly refinery efficiency improvements, also positively impact the economics of the petroleum industry, even higher levels of technology adoption may be feasible.
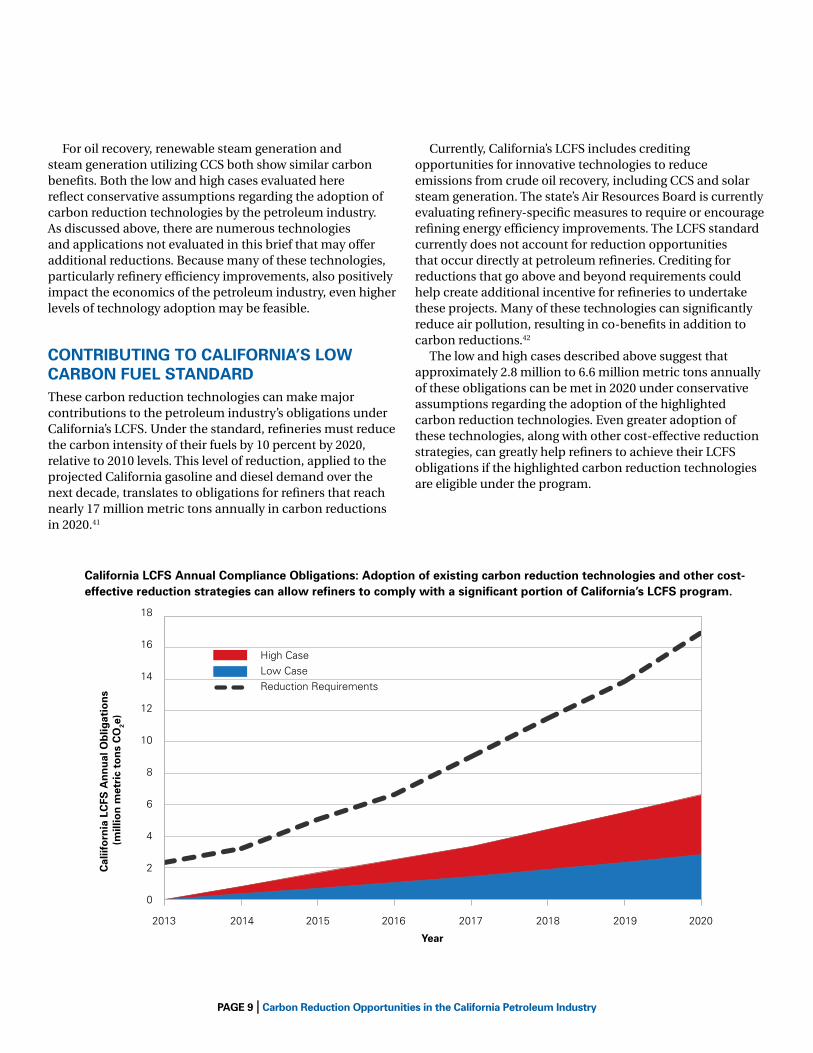
COntRIbutInG tO CALIFORnIA’s LOw CARbOn FuEL stAnDARDThese carbon reduction technologies can make major contributions to the petroleum industry’s obligations under California’s LCFS. Under the standard, refineries must reduce the carbon intensity of their fuels by 10 percent by 2020, relative to 2010 levels. This level of reduction, applied to the projected California gasoline and diesel demand over the next decade, translates to obligations for refiners that reach nearly 17 million metric tons annually in carbon reductions in 2020.41
Currently, California’s LCFS includes crediting opportunities for innovative technologies to reduce emissions from crude oil recovery, including CCS and solar steam generation. The state’s Air Resources Board is currently evaluating refinery-specific measures to require or encourage refining energy efficiency improvements. The LCFS standard currently does not account for reduction opportunities that occur directly at petroleum refineries. Crediting for reductions that go above and beyond requirements could help create additional incentive for refineries to undertake these projects. Many of these technologies can significantly reduce air pollution, resulting in co-benefits in addition to carbon reductions.42
The low and high cases described above suggest that approximately 2.8 million to 6.6 million metric tons annually of these obligations can be met in 2020 under conservative assumptions regarding the adoption of the highlighted carbon reduction technologies. Even greater adoption of these technologies, along with other cost-effective reduction strategies, can greatly help refiners to achieve their LCFS obligations if the highlighted carbon reduction technologies are eligible under the program.
California LCFs Annual Compliance Obligations: Adoption of existing carbon reduction technologies and other cost-effective reduction strategies can allow refiners to comply with a significant portion of California’s LCFs program.
0.0
0.5
1.0
1.5
2.0
2.5
3.0
3.5
0
1
2
3
4
5
6
7
8
18
16
14
12
10
8
6
4
2
0
■ Renewable Feedstocks (Refinery)
■ Solar Thermal or CCS (Crude Oil Recovery)
■ CCS (Refinery)
■ Efficiency (Refinery)
■ Renewable Feedstocks (Refinery)
■ Solar Thermal or CCS (Crude Oil Recovery)
■ CCS (Refinery)
■ Efficiency (Refinery)
High Case
Low Case
Reduction Requirements
2014 2015 2016 2017 2018 2019 2020Year
An
nu
al E
mis
sio
n R
edu
ctio
ns
Mill
ion
Met
ric
Ton
s C
O2e
Cal
iifo
rnia
LC
FS A
nn
ual
Ob
ligat
ion
s (m
illio
n m
etri
c to
ns
CO
2e)
Mill
ion
Met
ric
Ton
s C
O2e
2014 2015 2016 2017 2018 2019 2020
2013 2014 2015 2016 2017 2018 2019 2020
Year
Year

PAGE 10 | Carbon Reduction Opportunities in the California Petroleum Industry
COnCLusIOnThe potential to reduce carbon emissions from the petroleum industry is sizable, and many of the technologies to achieve these reductions are available and viable. Along the supply chain, major opportunities exist in crude oil recovery, refining, and refinery feedstocks to shrink the carbon footprint of petroleum. In California alone, modest adoption of renewable steam generation or steam generation with CCS, refinery efficiency improvements, CCS of hydrogen-related refinery processes, and renewable refinery feedstocks can enable carbon reductions of nearly 3 million to 6.6 million metric tons of reductions annually by 2020. Full adoption of these technologies would result in 20 million metric tons of reduction. If all of these technologies were credited under the LCFS, they could contribute to meeting a significant portion of refiners’ annual obligations. Additional opportunities, such as CCS at the refinery beyond hydrogen and additional use of renewable feedstocks and energy inputs, can further reduce the carbon impact of the petroleum industry.
Endnotes
1 California Air resources board, Draft White Paper: Potential GHG Reductions from Clean Distributed Generation Technologies at Oil and Natural Gas Facilities, March 14, 2012, www.arb.ca.gov/cc/oil-gas/draft_white_paper_oil_DG_March_7.pdf (accessed August 11, 2013).
2 u.s. Department of energy Office of fossil energy, Enhanced Oil Recovery, energy.gov/fe/science-innovation/oil-gas/enhanced-oil-recovery (accessed July 12, 2013).
3 based on u.s. energy Information Administration crude oil production and refining capacity data for 2012, www.eia.gov/.
4 see Technical Appendix for details on the estimates.
5 under recent amendments to California’s LCfs, innovative carbon reduction technologies used for oil production, such as solar thermal and carbon capture and storage, are eligible for LCfs credit generation, with each credit representing 1 metric ton of reduction. reductions in petroleum refinery emissions are currently not credited under the LCfs.
6 el-Houjeiri, H.M., s. McNally, and A.r. brandt, Oil Production Greenhouse Gas Emissions Estimator, version 1.1, Appendix C. California environmental Protection Agency, Air resources board, february 23, 2013.
7 According to the National energy Technology Laboratory, “[i]n steamflooding, high-temperature steam is injected into a reservoir to heat the oil. The oil expands, becomes less viscous and partially vaporizes, making it easier to move to the production wells. steamflooding is generally used in heavy oil recovery to overcome the high viscosity that inhibits movement of the oil.” See: www.netl.doe.gov/technologies/oil-gas/publications/eordrawings/Color/coltr.pdf and www.netl.doe.gov/technologies/oil-gas/publications/eordrawings/Color/colsf.pdf.
8 We note that in addition to the thermal (or steam) enhanced oil recovery (eOr) technology evaluated here, gas (including natural gas) and chemical injection are the two other main methods for eOr. In some cases, natural gas injection and repressurization could lead to lower GHG emissions, but only if methane is not vented or leaked and if that natural gas is not later recovered as a primary energy source. Currently, repressurization of oil wells using inert or noncombustible gases like CO2 and N2 may be a more economical and stable option than using potentially valuable natural gas feedstocks.
9 California Department of Conservation, Division of Oil, Gas, and Geothermal resources, 2009 Annual Report of the State Oil & Gas Supervisor, ftp://ftp.consrv.ca.gov/pub/oil/annual_reports/2009/0101summary1_09.pdf.
10 In some applications, coal may be combusted to generate steam.
11 California oil recovery has increased in energy-intensity since the 1960s due to an increasing need for steam injection together with resource depletion. see A.r. brandt (2011), Sustainability, Vol. 3, 1833-1854.
12 www1.eere.energy.gov/solar/pdfs/solar_timeline.pdf; Also see Implementation of Solar Thermal Technology, edited by Ronal Larson and Ronald West, 2003, MIT Press (Cambridge, MA).
13 www.brightsourceenergy.com; www.glasspoint.com; www.energymanagertoday.com/glasspoint-solar-steam-generators-to-help-omans-enhanced-oil-recovery-092249/.
14 bellona.org/ccs/?id=37.
15 for example, the shell Quest project aims to capture 35% of the CO2 from existing upgraders. See: www.zeroco2.no/projects/quest-project.
PAGE 11 | Carbon Reduction Opportunities in the California Petroleum Industry
16 IPCC (2005), Special Report on Carbon Dioxide Capture and Storage. Prepared by Working Group III of the Intergovernmental Panel on Climate Change (Cambridge/New York: Cambridge university Press, 2005 442. environmental Non-Governmental Organisation (eNGO), Perspectives on Carbon Capture and Storage, 2012, www.engonetwork.org/engo_perspectives_on_ccs_digital_version.pdf. 2012. Massachusetts Institute of Technology, The future of Coal: Options for a Carbon-Constrained World (Cambridge, Massachusetts: MIT, 2007), www.climatechange.ca.gov/carbon_capture_review_panel/.
17 IPCC 2006, 2006 IPCC Guidelines for National Greenhouse Gas Inventories, Volume 2 “energy”, Chapter 4 “fugitive emissions.” Prepared by the National Greenhouse Gas Inventories Programme, eggleston H.s., buendia L., Miwa K., Ngara T. and Tanabe K. (eds). Published: IGes, Japan.
18 for more options and information, see: Harvey, s., V. Gowrishankar, and T. singer, Leaking Profits, Natural resources Defense Council, March 2012, www.nrdc.org/energy/files/Leaking-Profits-report.pdf.
19 Carbon Intensity of Crude Oil in Europe, prepared by energy-redefined LLC for the International Council on Clean Transportation, November 2010, www.climateworks.org/download/?id=363969bc-e45a-4434-8ff5-553abff7e451.
20 for references, see the environmental Defense fund’s fact sheet, “Petroleum Competitiveness,” business.edf.org/sites/business.edf.org/files/11210_LCMI-refineries-Citations.pdf;
business.edf.org/sites/business.edf.org/files/11209_LCMI-refineries.pdf.
21 each refinery is different, but overall refinery emissions from hydrogen production range between 5% and 20%. Due to their quantity and high carbon dioxide concentration, these emissions usually represent the best opportunity for CCs at refineries. See, for example: Det Norske Veritas, Global Technology Roadmap for CCS in Industry, Sectoral Assessment: Refineries, report No. 12P5TPP-9, Draft rev. 3, August 25, 2010, cdn.globalccsinstitute.com/sites/default/files/publication_20100825_sector-assess-refineries.pdf.
22 In California and nationwide in the united states, natural gas reforming is the dominant technology, as opposed to coal gasification. see: www.energy.ca.gov/2009_energypolicy/documents/2009-05-18_workshop/presentations/05_Alston_bird_Vollsaeter_May_18_CCs.pdf.
23 Karras, G., 2011 Oil refinery CO2 Performance Measurement, prepared by Communities for a better environment (Cbe) for the union of Concerned scientists, september 2011, www.ucsusa.org/assets/documents/global_warming/oil-refinery-CO2-performance.pdf/. Also see: www.ucsusa.org/assets/documents/global_warming/California-refineries-The-Most-Carbon-Intensive-in-the-Nation.pdf.
24 While in general, reduced demand for these higher-carbon feedstocks can reduce overall production and use, we note that estimating the actual reduction in emissions is nontrivial and requires a market analysis of the reduced overall demand in heavy crude oil as well as accounting for potential feedstock substitution. We note that, in part because of these crediting challenges, the LCfs has remained focused on innovative technologies that require clear additional investments and result in direct, verifiable emission reductions.
25 Omitting carbon reduction technologies on the vehicle itself, e.g., fuel economy improvements and alternative fuels.
26 California Air resources board, Low Carbon Fuel Standard Final Regulation Order, November 26, 2012, www.arb.ca.gov/fuels/lcfs/CleanfinalregOrder112612.pdf.
27 Van Heel, A.P.G. et al., “The Impact of Daily and seasonal Cycles in solar-Generated steam on Oil recovery.” Presented at the society of Petroleum engineers enhanced Oil recovery Conference, Muscat, Oman, April 11–13, 2010, www.glasspoint.com/media/2012/11/sPe-Paper-129225_solar-steam_bentouati.pdf.
28 GlassPoint, “use Less Gas for eOr,” www.glasspoint.com/technology/use-less-gas/ (accessed May 22, 2013).
29 energyalmanac.ca.gov/petroleum/ (accessed August 19, 2013).
30 bellona.org/ccs/?id=37.
31 for example, the shell Quest project aims to capture 35% of the CO2 from existing upgraders. See: www.zeroco2.no/projects/quest-project
32 see, for example, Melzer, L. stephen, Carbon Dioxide Enhanced Oil Recovery (CO2 EOR): Factors Involved in Adding Carbon Capture, Utilization and Storage (CCUS) to Enhanced Oil Recovery, february 2012, neori.org/Melzer_CO2eOr_CCus_feb2012.pdf. Also see: National energy Technology Laboratory, u.s. Department of energy, Improving Domestic energy security and Lowering CO2 emissions with ‘Next Generation’ CO2-enhanced Oil recovery (CO2-eOr), June 1, 2011, DOe/NeTL-2011/1504, Activity 04001.420.02.03, www.netl.doe.gov/energy-analyses/pubs/storing%20co2%20w%20eor_final.pdf.
33 “energy Optimization & CO2 reduction Opportunities: A refining & Petrochemicals Webinar,” Honeywell Process solutions and uOP, 2009.
34 Worrell, e., and C. Galitsky, Energy Efficiency Improvement and Cost Saving Opportunities for Petroleum Refineries: An Energy Star® Guide for Energy and Plant Managers. ernest Orlando Lawrence berkeley National Laboratory, february 2005. The LbNL study doesn’t give specific energy use from steam distribution systems, but boiler fuels account for 33% on average of fuel used across the refineries in the u.s.
35 environmental Defense fund, “Think u.s. Industry Can’t be More Competitive? Think Again” fact sheet citations, August 2010, business.edf.org/sites/business.edf.org/files/11210_LCMI-refineries-Citations.pdf. Original factsheet, http://business.edf.org/sites/business.edf.org/files/11209_LCMI-refineries.pdf
36 California Air resources board, Energy Efficiency and Co-Benefits Assessment of Large Industrial Sources: Refinery Sector Public Report, June 6, 2013, www.arb.ca.gov/cc/energyaudits/eeareports/refinery.pdf.
37 California Air resources board, Mandatory GHG Reporting Data: Emissions Reported for Calendar Year 2010, March 12, 2012, www.arb.ca.gov/cc/reporting/ghg-rep/reported_data/mandatory_reporting_facility_2010_summary_2012-03-12.xlsx.
38 uOP, Honeywell, presentation by Chris Higby given at Alternative Clean Transportation (ACT) expo, Washington, D.C., June 26, 2013, www.actexpo.com/pdfs/ACTe2013/presentations/bO3-5/5-Higby-Honeywell.pdf.
39 egeberg, r.G., N.H. Michaelsen, and L. skyum, Novel Hydrotreating Technology for Production of Green Diesel. Haldor Topsøe, www.topsoe.com/business_areas/refining/~/media/PDf%20files/refining/novel_hydrotreating_technology_for_production_of_green_diesel.ashx (accessed May 22, 2013).
40 see Technical Appendix for details on the estimates.
41 based on California Air resources board, LCFS Program Review Advisory Panel: New Illustrative LCFS Scenarios, www.arb.ca.gov/fuels/lcfs/workgroups/advisorypanel/advisorypanel.htm (accessed June 5, 2013); California Air resources board, Low Carbon fuel standard final regulation Order, www.arb.ca.gov/fuels/lcfs/CleanfinalregOrder112612.pdf, November 26, 2012.
42 for example, the California Air resources board’s 2013 public report, energy efficiency and Co-benefits Assessment of Large Industrial sources refinery sector Public report, shows reductions in particulate matter (PM) and nitrous oxide (NOx) through adoption of energy efficiency technologies. While the report did not include the potential reduction estimates for toxic air pollutants (TACs), co-benefits of TAC reductions would be expected as well. www.arb.ca.gov/cc/energyaudits/energyaudits.htm.
PAGE 12 | Carbon Reduction Opportunities in the California Petroleum Industry
MEthODOLOGyTetra Tech Inc. evaluated potential carbon reductions from each technology on the basis of engineering experience and expertise, review of the technical and scientific literature, and discussions with experts. Engineering estimates were made by considering the displaced or avoided energy consumption for the specific energy technology, with baseline energy consumption or emissions data obtained from a number of sources such as the U.S. Department of Energy’s Greenhouse Gases, Regulated Emissions, and Energy Use in Transportation (GREET) model, developed by the Argonne National Laboratory, as well as publically available data from the California Energy Commission and California Air Resources Board.
Low and high Adoption CasesOverall technology adoption cases were estimated on the basis of reasonable, conservative what-if scenarios, including consideration of timescales for planning, permitting, and installation. The low and high cases apply linear adoption curves, assuming no technology implementation in 2013, half of scenario implementation by 2017, and full scenario implementation by 2020. The specific adoption percentages for each technology in the two cases are detailed in the issue brief.
Crude Oil Production EmissionsEmissions of direct and indirect GHG emissions from producing crude oil in California were estimated on the basis of field-level carbon-intensity and production data from the California Air Resources Board (2013).1 We note that ARB estimates are for fields producing more than 10,000 barrels in 2011. Lower heating values were assigned to barrels based on API and utilizing factors in the Oil Production Greenhouse Gas Emission Estimator (OPGEEE), version 1.0.2 Based on ARB’s estimates, total production volume for 2011 was 213,630,418 barrels for fields producing more than 10,000 barrels with a weighted average carbon intensity of 12.4 grams per megajoule (g/MJ). Total emissions were estimated to be 16.8 MMT for California oil production and 0.8 MMT for California Outer Continental Shelf lands.
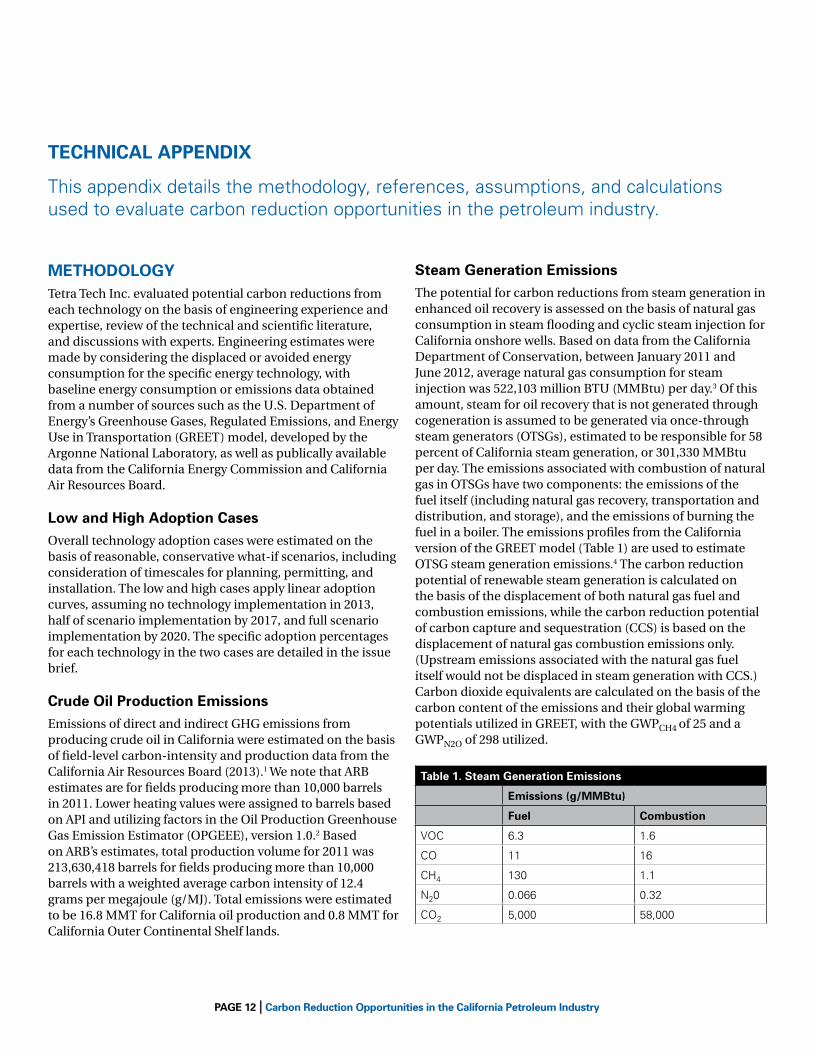
steam Generation EmissionsThe potential for carbon reductions from steam generation in enhanced oil recovery is assessed on the basis of natural gas consumption in steam flooding and cyclic steam injection for California onshore wells. Based on data from the California Department of Conservation, between January 2011 and June 2012, average natural gas consumption for steam injection was 522,103 million BTU (MMBtu) per day.3 Of this amount, steam for oil recovery that is not generated through cogeneration is assumed to be generated via once-through steam generators (OTSGs), estimated to be responsible for 58 percent of California steam generation, or 301,330 MMBtu per day. The emissions associated with combustion of natural gas in OTSGs have two components: the emissions of the fuel itself (including natural gas recovery, transportation and distribution, and storage), and the emissions of burning the fuel in a boiler. The emissions profiles from the California version of the GREET model (Table 1) are used to estimate OTSG steam generation emissions.4 The carbon reduction potential of renewable steam generation is calculated on the basis of the displacement of both natural gas fuel and combustion emissions, while the carbon reduction potential of carbon capture and sequestration (CCS) is based on the displacement of natural gas combustion emissions only. (Upstream emissions associated with the natural gas fuel itself would not be displaced in steam generation with CCS.) Carbon dioxide equivalents are calculated on the basis of the carbon content of the emissions and their global warming potentials utilized in GREET, with the GWPCH4 of 25 and a GWPN2O of 298 utilized.
table 1. steam Generation Emissions
Emissions (g/MMbtu)
Fuel Combustion
VOC 6.3 1.6
CO 11 16
CH4 130 1.1
N20 0.066 0.32
CO2 5,000 58,000
tEChnICAL APPEnDIx
This appendix details the methodology, references, assumptions, and calculations used to evaluate carbon reduction opportunities in the petroleum industry.

PAGE 13 | Carbon Reduction Opportunities in the California Petroleum Industry
Refinery EmissionsCalifornia refinery greenhouse gas (GHG) emissions are derived from facility reports to the California Air Resources Board for calendar year 2010.5 The relevant subset of these data, reflecting only the facilities whose primary purpose is petroleum refining, is reproduced in Table 2 below.
table 2. California Refinery GhG Emissions
Facility ID # Facility name
total Reported CO2 Equivalent Emissions (metric tons/yr, 2010)
101384Chevron Products Company—richmond refinery, 94802
4,511,882
100914 shell Oil Products us 4,446,565
101246bP West Coast Products LLC, refinery
4,432,662
100138Chevron Products Company—el segundo refinery, 90245
3,452,447
100217 exxonMobil Torrance refinery 2,916,147
100372Valero refining Company—California, benicia refinery and benicia Asphalt Plant
2,627,977
101331Tesoro refining and Marketing Company, 94553
2,028,587
100329ConocoPhillips Los Angeles refinery Wilmington Plant
1,660,864
100303Conoco Phillips refining Company—sf refinery
1,638,946
100335Tesoro refining and Marketing Company—LAr
1,416,592
101205 ultramar Inc.—Valero 1,104,741
100913ConocoPhillips Los Angeles refinery, Carson Plant
760,577
101226ConocoPhillips santa Maria refinery
240,912
101056Paramount Petroleum Corporation
209,026
101507 Kern Oil and refining Company 145,206
101239 san Joaquin refining Company 84,426
101162 Lunday–Thagard Company 34,040
101320 edgington Oil Company 20,378
tOtAL: 31,731,977
source: CArb
Projections to 2020 of California refinery emissions are based on gasoline and diesel forecasts from the “Low Petroleum Demand Scenario” of the California Energy Commission’s 2011 Integrated Energy Policy Report (IEPR) Transportation Forecasting Report.6 Volumes of gasoline and diesel demanded annually are linearly interpolated from IEPR estimates for 2009, 2015, and 2020 (Table 3), and crude oil volume and associated refinery emissions are projected by scaling the demand estimates using 2009 data (Table 4). In 2009, refinery GHG emissions were reported at 31,204,903 metric tons, and 597,132,000 barrels of crude oil were used to produce gasoline and diesel in California.7
table 3. California Gasoline and Diesel Projections
year Gasoline (gallons) Diesel (gallons)
2009 14,804,119,733 3,200,244,414
2010 14,685,955,128 3,265,236,366
2011 14,567,790,522 3,330,228,318
2012 14,449,625,917 3,395,220,270
2013 14,331,461,312 3,460,212,221
2014 14,213,296,706 3,525,204,173
2015 14,095,132,101 3,590,196,125
2016 13,898,190,554 3,641,464,547
2017 13,701,249,006 3,692,732,969
2018 13,504,307,459 3,744,001,392
2019 13,307,365,911 3,795,269,814
2020 13,110,424,364 3,846,538,236
table 4. Projected California Refinery Volume and Emissions
year total Crude Volume (thousands of barrels)
total Refinery GhG Emissions (metric tons)
2013 591,388 30,904,714
2014 588,969 30,778,334
2015 586,551 30,651,955
2016 581,719 30,399,476
2017 576,888 30,146,998
2018 572,057 29,894,519
2019 567,225 29,642,041
2020 562,394 29,389,562
Note that refinery emissions were calculated by using crude volume projections to scale current emissions, so the decline in GHG emissions in this table is entirely due to a decline in crude volume. The crude volume decline is projected by the CEC IEPR, presumably accounting for fuel economy improvements and reduced travel demand due to policies that reduce vehicle-miles traveled.

PAGE 14 | Carbon Reduction Opportunities in the California Petroleum Industry
Hydrogen processes make up part of total refinery emissions. As with natural gas used in steam generation, emissions for hydrogen also have two components: those generated during the reforming of natural gas (feed) to produce the hydrogen, and those generated from combustion of natural gas for the energy requirement (process energy) to produce hydrogen, such as a furnace. A more detailed description can be found in NREL (2003).8
Utilizing the LBNL “Profile of the Petroleum Refining Industry in California,” TetraTech Inc. was able to estimate that 576 standard cubic feet (scf) of hydrogen, or 1.47 kg, is used on average to produce one barrel in California.9 Utilizing the hydrogen production assumptions embedded in the California GREET model, there is an estimated 10.5 kg CO2 of emissions per barrel of crude oil (kg/bbl) from H2 production, with 8.0 kg CO2 per barrel emitted from steam methane reforming to H2 and the remaining 2.4 kg CO2 per barrel from the natural gas utilized as process energy for the H2 production. The assumptions in the California GREET model are that 0.238 MMBtu of natural gas is used as process energy for each MMBtu of H2 produced. According to Collodi (2010), CO2 removal efficiencies for specific streams can be about 90 percent (for tail gas and flue gas) to more than 99 percent (from raw H2). For simplicity, it is assumed in the calculations that all the CO2 is removed.10
REnEwAbLE FEEDstOCK EMIssIOnsThe carbon reduction potential of using renewable feedstocks to displace crude oil is calculated on the basis of the full-fuel-cycle carbon intensity of diesel fuel compared with that of renewable diesel. Carbon intensity values are derived from the California Air Resources Board Low Carbon Fuel Standard (LCFS) regulation.11 The carbon intensity of renewable diesel is assumed to be the average of fuel produced from soy oil and fuel produced from tallow (Table 5). From these carbon intensity values, the carbon reduction potential is calculated using the California diesel volume projections.
table 5. Fuel Carbon Intensity Values
Fuel Carbon Intensity (gCO2e/MJ)
Diesel 98.03
renewable diesel:
from soy oil
from tallow
Average
82.16
39.33
60.75
source: CArb
AnnuAL ObLIGAtIOns FOR REFInERsThe annual obligations for refiners imposed by California’s LCFS (Table 6) are derived from the California Air Resources Board’s illustrative scenarios.12 Gasoline Scenario 8 and Diesel Scenario 6 were selected as reasonable representations of the future fuel mix, and the carbon intensity values in these illustrative scenarios were modified using updated values from the LCFS final regulation order.13
table 6. California LCFs Annual Obligations for Refiners
yearLCFs Compliance schedule for Average Carbon Intensity (gCO2e/MJ) Annual Credits Required (million metric tons)
Gasoline Diesel Gasoline Diesel Total
baseline 99.18 98.03 – – –
2013 97.96 97.05 1.9 0.4 2.3
2014 97.47 96.56 2.6 0.6 3.3
2015 96.48 95.58 4.0 1.1 5.1
2016 95.49 94.6 5.3 1.4 6.7
2017 94.00 93.13 7.1 2.0 9.1
2018 92.52 91.66 8.9 2.6 11.5
2019 91.03 90.19 10.6 3.3 13.9
2020 89.06 88.23 12.8 4.2 16.9
source: CArb

PAGE 15 | Carbon Reduction Opportunities in the California Petroleum Industry
technical Appendix Endnotes
1 www.arb.ca.gov/fuels/lcfs/regamend13/062013_ca-produced-crude-names_draft-field-allocation-and-ci-estimates.xlsx (accessed August 11, 2013). “Public Workshop for the refinery-specific Incremental Deficit Option and Low-Complexity/Low energy-use refinery Provisions,” California Air resources board June 20, 2013.
2 www.arb.ca.gov/fuels/lcfs/hcico/opgee_v1.0a.xlsx; www.arb.ca.gov/fuels/lcfs/hcico/draft_Inputs_OPGee_V1%200_preliminary.xlsx, ( accessed August 11, 2013). Public Workshop, California Air resources board, June 12, 2012.
3 Monthly Production and Injection Database, California Department of Conservation: Division of Oil, Gas, and Geothermal resources.
4 CA-GreeT1.8b, December 2009.
5 California Air resources board, Mandatory GHG Reporting Data: Emissions Reported for Calendar Year 2010, March 12, 2012, www.arb.ca.gov/cc/reporting/ghg-rep/reported_data/mandatory_reporting_facility_2010_summary_2012-03-12.xlsx.
6 California energy Commission, Transportation Energy Forecast and Analyses for the 2011 Integrated Energy Policy Report, CeC-600-2011-007-sD, August 2011, www.energy.ca.gov/2011publications/CeC-600-2011-007/CeC-600-2011-007-sD.pdf.
7 California energy Commission, Energy Almanac, energyalmanac.ca.gov/ (accessed January 18, 2013).
8 NreL (2003), Hydrogen from Steam-Methane Reforming with CO2 Capture, 20th Annual International Pittsburgh Coal Conference, september 15–19, 2003, Pittsburgh, Pa, published June 30, 2003, www.netl.doe.gov/technologies/hydrogen_clean_fuels/refshelf/papers/pgh/hydrogen%20from%20steam%20methane%20reforming%20for%20carbon%20dioxide%20cap.pdf (accessed september 6, 2013).
9 DOe (2004), Profile of the Petroleum Refining Industry in California, Lawrence berkeley National Laboratory, LbNL-55450, www1.eere.energy.gov/manufacturing/resources/petroleum_refining/pdfs/cpi_profile.pdf (accessed september 5, 2013).
10 Guido Collodi and foster Wheeler (2009), Hydrogen Production via Steam Methane Reforming with CO2 Capture, 4th International Conference on safety and environment in Process Industry, March 14–17, 2010. florence, Italy, www.aidic.it/CIsAP4/webpapers/7Collodi.pdf (accessed september 6, 2013).
11 California Air resources board,“Low Carbon fuel standard final regulation Order, November 26, 2012.” http://www.arb.ca.gov/fuels/lcfs/CleanfinalregOrder112612.pdf. November 26, 2012.
12 based on California Air resources board, LCFS Program Review Advisory Panel: New Illustrative LCFS Scenarios, www.arb.ca.gov/fuels/lcfs/workgroups/advisorypanel/advisorypanel.htm (accessed June 5, 2013). California Air resources board, Low Carbon fuel standard final regulation Order, November 26, 2012, www.arb.ca.gov/fuels/lcfs/CleanfinalregOrder112612.pdf.
13 California Air resources board, Low Carbon fuel standard final regulation Order, November 26, 2012, www.arb.ca.gov/fuels/lcfs/CleanfinalregOrder112612.pdf.

PAGE 16 | Carbon Reduction Opportunities in the California Petroleum Industry
natural Resources Defense Council40 West 20th streetNew York, NY 10011212 727-2700fax 212 727-1773
beijing
Chicago
Los Angeles
bozeman
san francisco
Washington
www.nrdc.org
Printed on recycled paper
www.nrdc.org/policy www.facebook.com/nrdc.org www.twitter.com/nrdc