Embed Size (px)
Citation preview
UNITED STATESNUCLEAR REGULATORY COMMISSION
OFFICE OF NUCLEAR REACTOR REGULATIONWASHINGTON, D.C. 20555-0001
September 30, 2002
NRC REGULATORY ISSUE SUMMARY 2002-14, SUPPLEMENT 1PROPOSED CHANGES TO THE SAFETY SYSTEM UNAVAILABILITY
PERFORMANCE INDICATORS
ADDRESSEES
All holders of operating licenses for nuclear power reactors, except those who havepermanently ceased operations and have certified that fuel has been permanently removedfrom the reactor vessel.
INTENT
The U. S. Nuclear Regulatory Commission (NRC) is issuing this supplement to RegulatoryIssue Summary (RIS) 2002-14 to provide to the addressees revised versions of the threeattachments to the RIS.
BACKGROUND
Regulatory Issue Summary 2002-14 informed addressees that the NRC was starting a 6-monthpilot program on September 1, 2002, to evaluate changes to the safety system unavailability(SSU) performance indicators (PIs), and that the pilot program would be assessed midwaythrough the test period to determine if more than six months were needed to obtain meaningfulresults. The RIS and its three attachments provided guidance to participating addressees forsubmitting PI data to the NRC and on the program success criteria.
Addressee participation in the pilot program is voluntary and participants were asked to conformto the guidance in the RIS for the voluntary submission of PI data. Addressees were alsoinformed that updated guidance would be provided in the form of revisions to the attachmentsto the RIS, namely, Attachment 1, an excerpt from Draft NEI 99-02, Rev. 0, “RegulatoryAssessment Performance Indicator Guideline,” Section 2.2, “Mitigating System PerformanceIndex,” and Attachment 2, Draft NEI 99-02, Rev. 0, Appendix F, “ Methodologies For Computingthe Unavailability Index, the Unreliability Index and Determining Performance Index Validity.”
SUMMARY OF ISSUE
Since the issuance of RIS 2002-14 on August 28, 2002, Attachments 1 and 2 have beenupdated and Attachment 3 has been revised. The revised attachments are attached to this RISsupplement.
ML022740008
RIS 2002-14, Sup. 1Page 2 of 2
BACKFIT DISCUSSION
This RIS supplement requires no action or written response. Therefore, the staff did notperform a backfit analysis.
FEDERAL REGISTER NOTIFICATION
A notice of opportunity for public comment was not published in the Federal Register becausethis RIS supplement is informational.
PAPERWORK REDUCTION ACT STATEMENT
This RIS supplement does not request any information collections.
If there are any questions about this matter, please contact one of the persons listed below.
/Original signed by: TReis/William D. Beckner, Program DirectorOperating Reactor Improvements programDivision of Regulatory Improvement ProgramsOffice of Nuclear Reactor Regulation
Technical contact: Serita Sanders, NRR 301-415-2956E-mail: [email protected]
Attachments:1. Draft NEI 99-02, Rev. 0, “Regulatory Assessment Performance Indicator Guideline,”
Section 2.2, “Mitigating System Performance Index” 2. Draft NEI 99-02, Rev. 0, “Regulatory Assessment Performance Indicator Guideline,”
Appendix F, “Methodologies For Computing the Unavailability Index, the Unreliability Index, and Determining Performance Index Validity”
3. Mitigating System Performance Index Pilot Program Success Criteria 4. List of Recently Issued NRC Regulatory Issue Summaries

Attachment 1 RIS 2002-14, Sup. 1
Draft NEI 99-02, Rev. 0, “Regulatory Assessment Performance Indicator Guideline,” Section 2.2, “Mitigating System Performance Index”


Attachment 2 RIS 2002-14, Sup. 1
Draft NEI 99-02, Rev. 0, Appendix F, “Methodologies For Computing the Unavailability Index, the Unreliability Index and Determining Performance Index Validity”
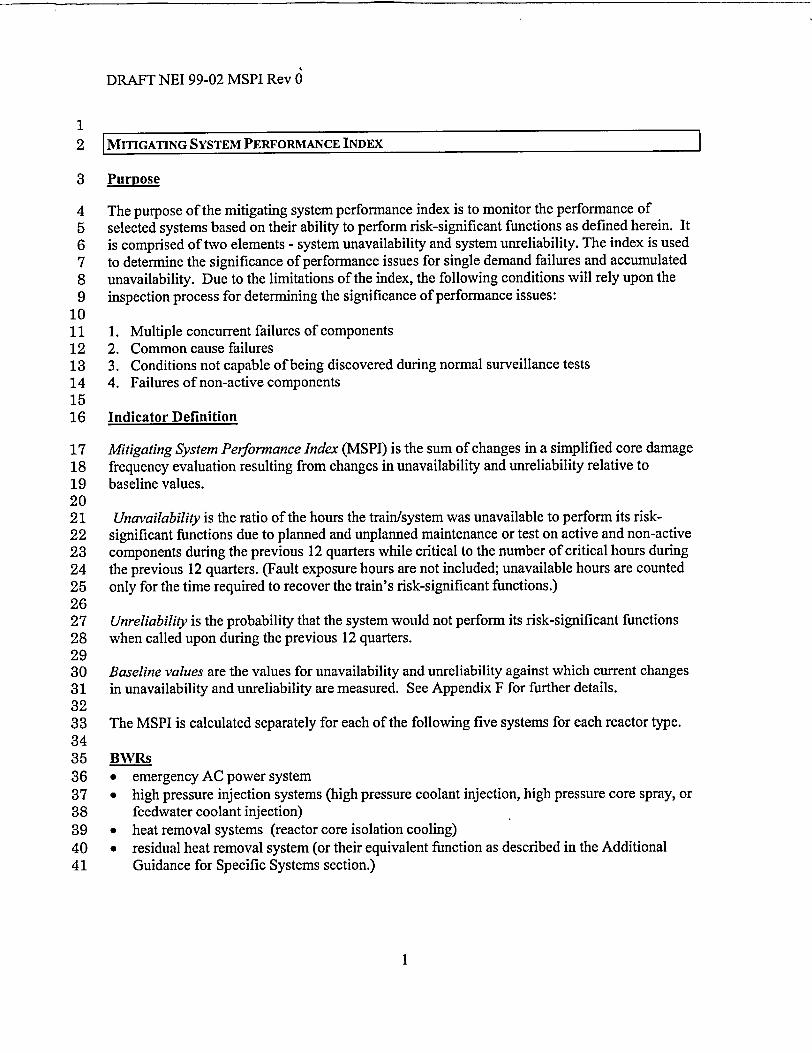
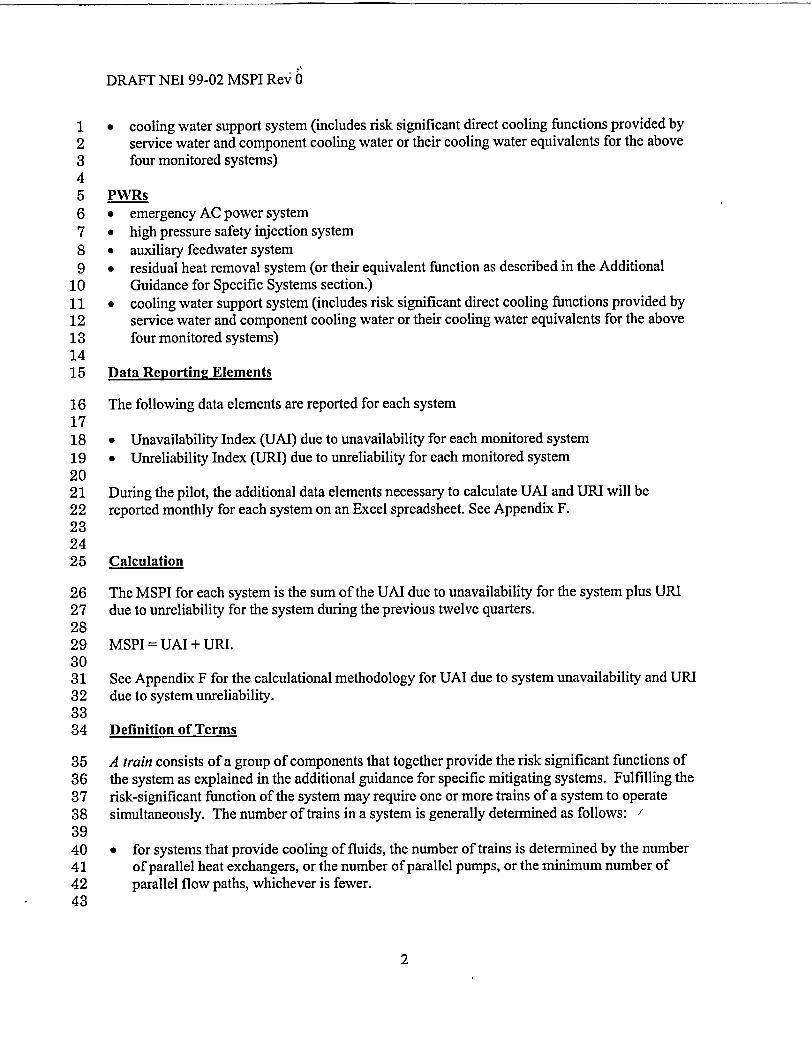
DRAFT NEI 99-02 MSPI Rev 0
F-1
APPENDIX F 1 2
METHODOLOGIES FOR COMPUTING THE UNAVAILABILITY 3 INDEX, THE UNRELIABILITY INDEX AND DETERMINING 4
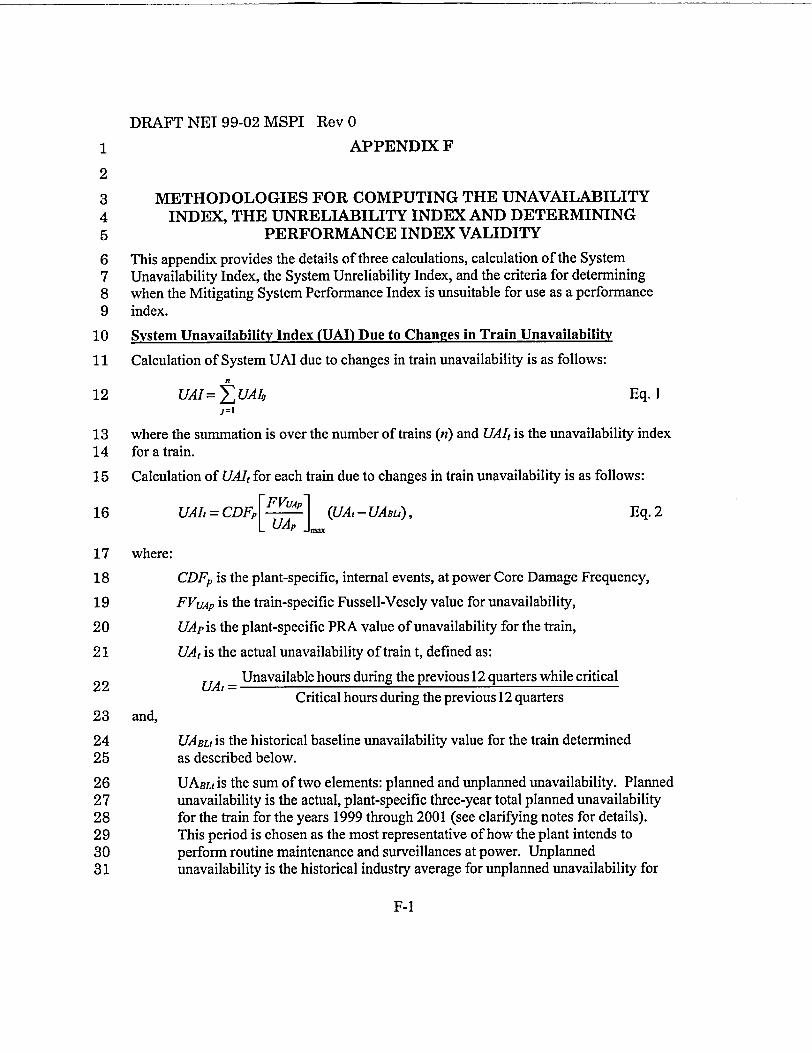
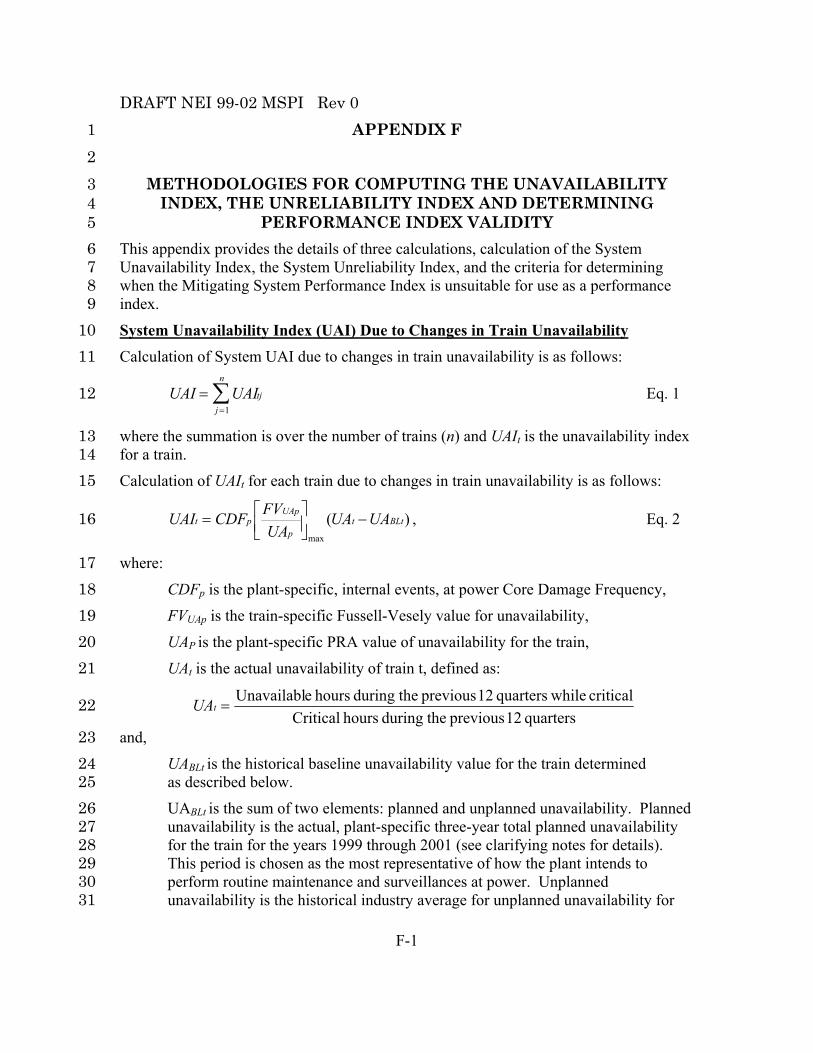
PERFORMANCE INDEX VALIDITY 5 This appendix provides the details of three calculations, calculation of the System 6 Unavailability Index, the System Unreliability Index, and the criteria for determining 7 when the Mitigating System Performance Index is unsuitable for use as a performance 8 index. 9 System Unavailability Index (UAI) Due to Changes in Train Unavailability 10 Calculation of System UAI due to changes in train unavailability is as follows: 11
UAI = UAItjj=1
n
∑ Eq. 1 12
where the summation is over the number of trains (n) and UAIt is the unavailability index 13 for a train. 14 Calculation of UAIt for each train due to changes in train unavailability is as follows: 15
)(max
BLttp
UAppt UAUA
UAFVCDFUAI −
= , Eq. 2 16
where: 17 CDFp is the plant-specific, internal events, at power Core Damage Frequency, 18 FVUAp is the train-specific Fussell-Vesely value for unavailability, 19 UAP is the plant-specific PRA value of unavailability for the train, 20 UAt is the actual unavailability of train t, defined as: 21
quarters 12 previous theduring hours Criticalcritical whilequarters 12 previous theduring hours eUnavailabl
=tUA 22
and, 23 UABLt is the historical baseline unavailability value for the train determined 24 as described below. 25 UABLt is the sum of two elements: planned and unplanned unavailability. Planned 26 unavailability is the actual, plant-specific three-year total planned unavailability 27 for the train for the years 1999 through 2001 (see clarifying notes for details). 28 This period is chosen as the most representative of how the plant intends to 29 perform routine maintenance and surveillances at power. Unplanned 30 unavailability is the historical industry average for unplanned unavailability for 31
DRAFT NEI 99-02 MSPI Rev 0
F-2
the years 1999 through 2001. See Table 1 for historical train values for 1 unplanned unavailability. 2
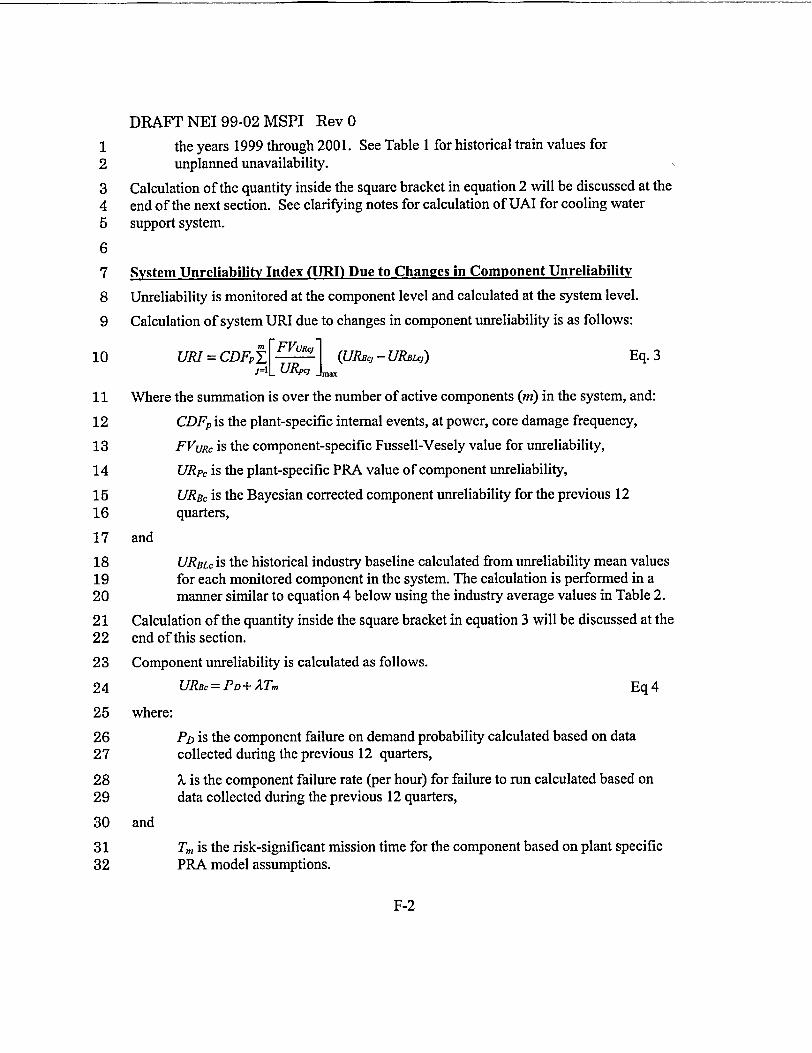
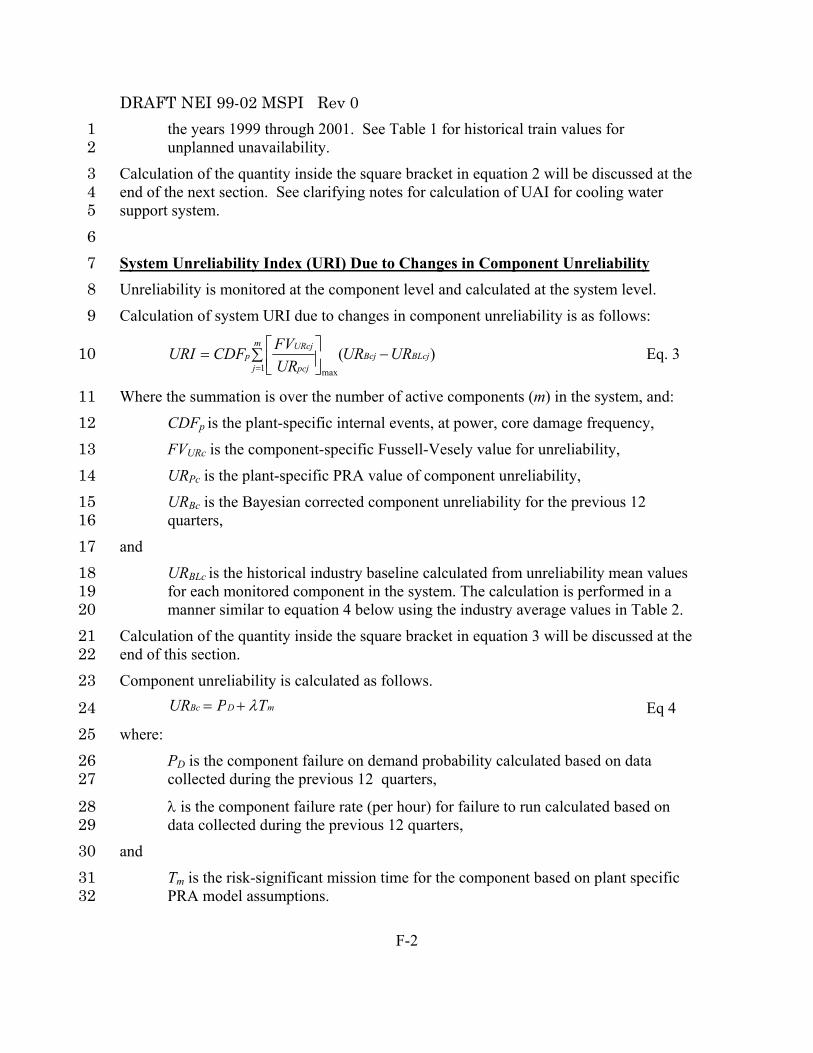
Calculation of the quantity inside the square bracket in equation 2 will be discussed at the 3 end of the next section. See clarifying notes for calculation of UAI for cooling water 4 support system. 5 6 System Unreliability Index (URI) Due to Changes in Component Unreliability 7 Unreliability is monitored at the component level and calculated at the system level. 8 Calculation of system URI due to changes in component unreliability is as follows: 9
)(1 max
BLcjBcjm
j pcj
URcjp URUR
URFVCDFURI −∑
=
= Eq. 3 10
Where the summation is over the number of active components (m) in the system, and: 11 CDFp is the plant-specific internal events, at power, core damage frequency, 12 FVURc is the component-specific Fussell-Vesely value for unreliability, 13 URPc is the plant-specific PRA value of component unreliability, 14 URBc is the Bayesian corrected component unreliability for the previous 12 15 quarters, 16
and 17 URBLc is the historical industry baseline calculated from unreliability mean values 18 for each monitored component in the system. The calculation is performed in a 19 manner similar to equation 4 below using the industry average values in Table 2. 20
Calculation of the quantity inside the square bracket in equation 3 will be discussed at the 21 end of this section. 22 Component unreliability is calculated as follows. 23
URBc = PD+ λTm Eq 4 24 where: 25
PD is the component failure on demand probability calculated based on data 26 collected during the previous 12 quarters, 27 λ is the component failure rate (per hour) for failure to run calculated based on 28 data collected during the previous 12 quarters, 29
and 30 Tm is the risk-significant mission time for the component based on plant specific 31 PRA model assumptions. 32
DRAFT NEI 99-02 MSPI Rev 0
F-3
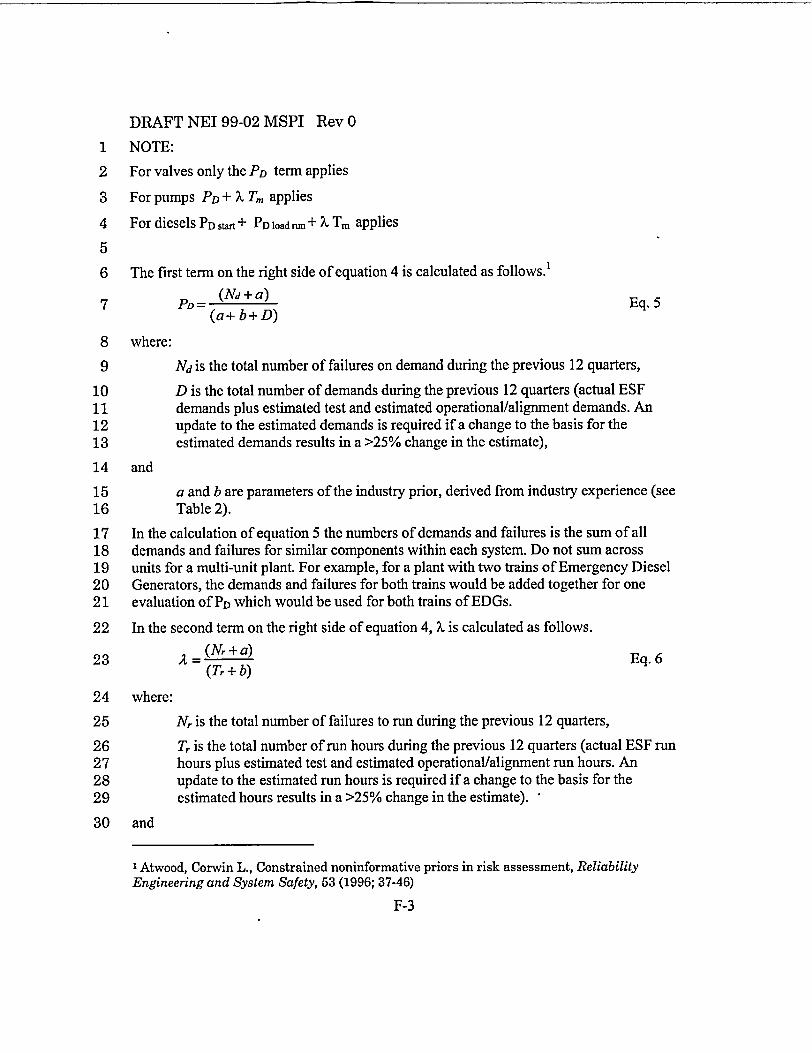
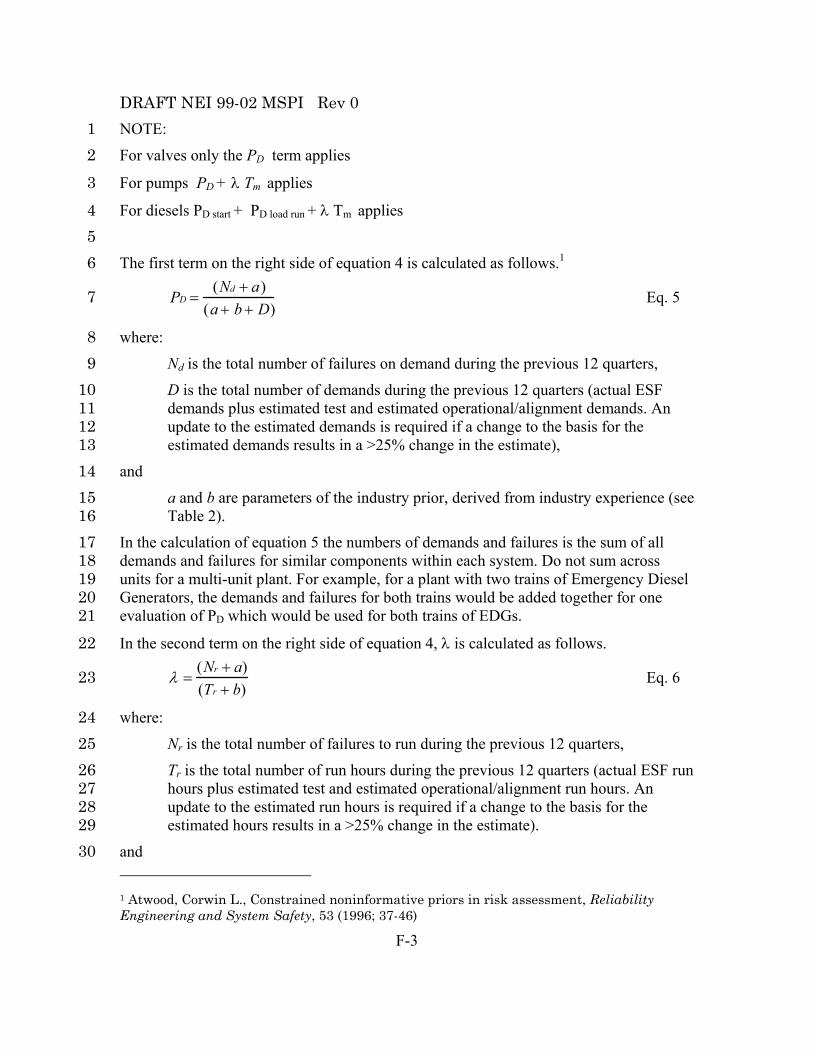
NOTE: 1 For valves only the PD term applies 2 For pumps PD + λ Tm applies 3 For diesels PD start + PD load run + λ Tm applies 4 5 The first term on the right side of equation 4 is calculated as follows.1 6
PD =(Nd + a)
(a + b + D) Eq. 5 7
where: 8 Nd is the total number of failures on demand during the previous 12 quarters, 9 D is the total number of demands during the previous 12 quarters (actual ESF 10 demands plus estimated test and estimated operational/alignment demands. An 11 update to the estimated demands is required if a change to the basis for the 12 estimated demands results in a >25% change in the estimate), 13
and 14 a and b are parameters of the industry prior, derived from industry experience (see 15 Table 2). 16
In the calculation of equation 5 the numbers of demands and failures is the sum of all 17 demands and failures for similar components within each system. Do not sum across 18 units for a multi-unit plant. For example, for a plant with two trains of Emergency Diesel 19 Generators, the demands and failures for both trains would be added together for one 20 evaluation of PD which would be used for both trains of EDGs. 21 In the second term on the right side of equation 4, λ is calculated as follows. 22
λ =(Nr + a)(Tr + b)
Eq. 6 23
where: 24 Nr is the total number of failures to run during the previous 12 quarters, 25 Tr is the total number of run hours during the previous 12 quarters (actual ESF run 26 hours plus estimated test and estimated operational/alignment run hours. An 27 update to the estimated run hours is required if a change to the basis for the 28 estimated hours results in a >25% change in the estimate). 29
and 30 1 Atwood, Corwin L., Constrained noninformative priors in risk assessment, Reliability Engineering and System Safety, 53 (1996; 37-46)
DRAFT NEI 99-02 MSPI Rev 0
F-4
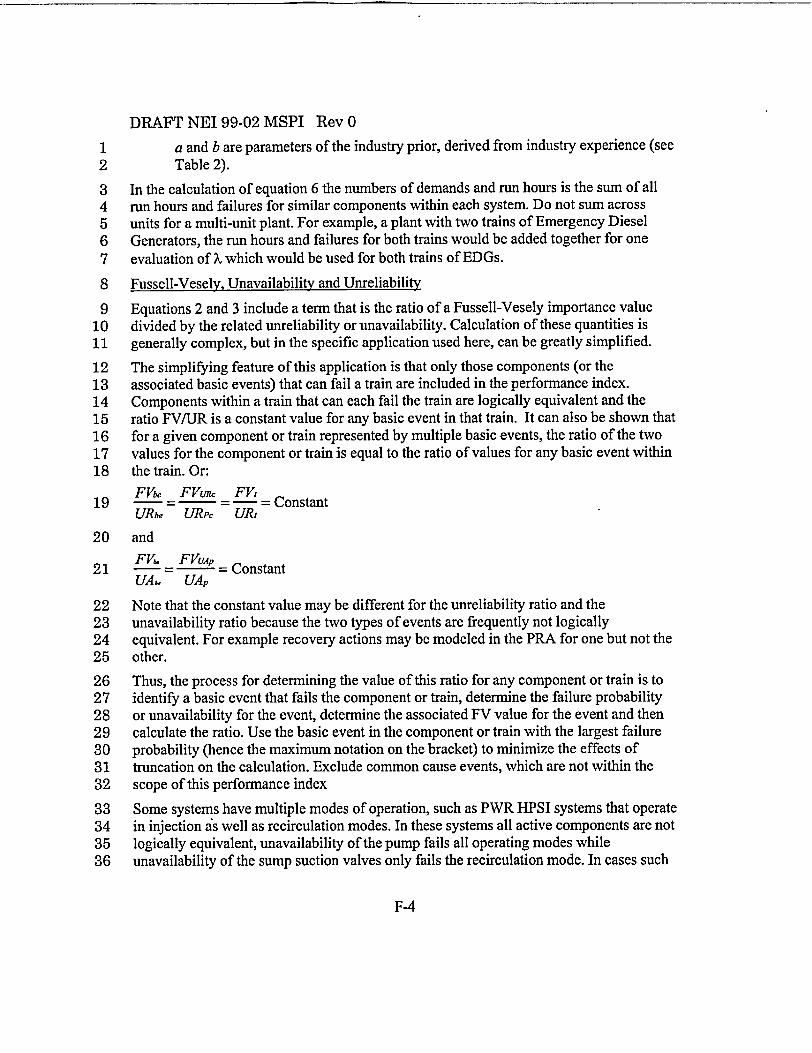
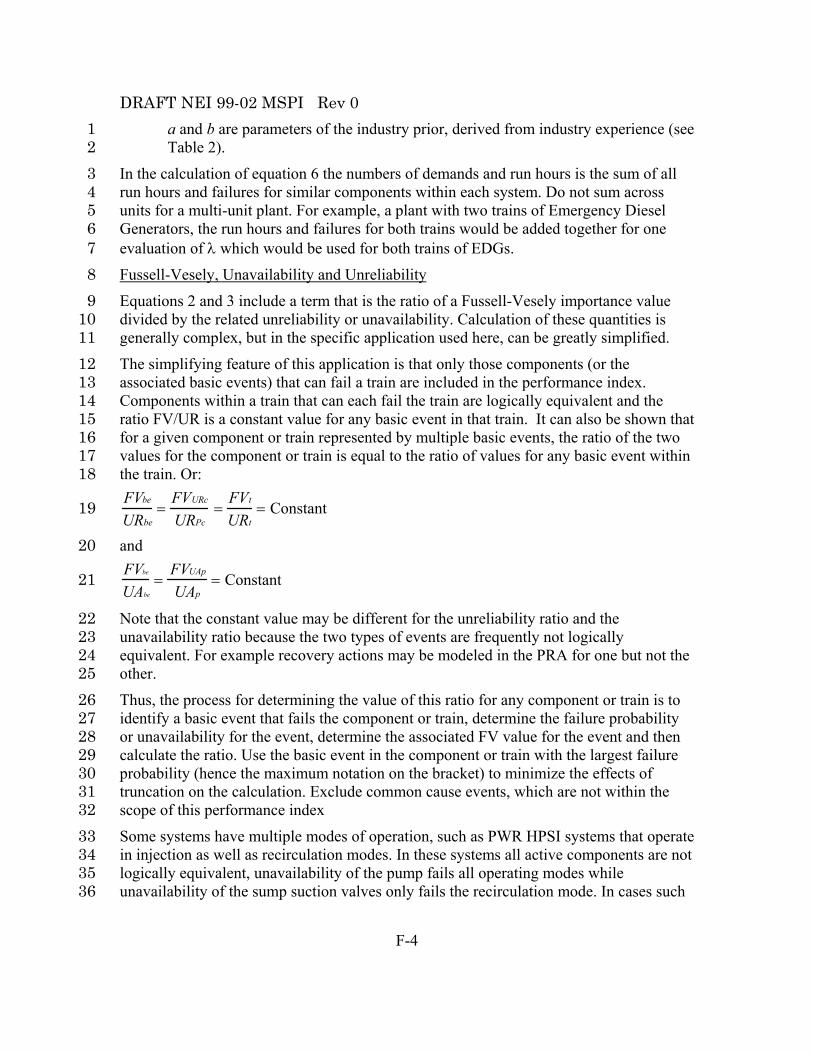
a and b are parameters of the industry prior, derived from industry experience (see 1 Table 2). 2
In the calculation of equation 6 the numbers of demands and run hours is the sum of all 3 run hours and failures for similar components within each system. Do not sum across 4 units for a multi-unit plant. For example, a plant with two trains of Emergency Diesel 5 Generators, the run hours and failures for both trains would be added together for one 6 evaluation of λ which would be used for both trains of EDGs. 7 Fussell-Vesely, Unavailability and Unreliability 8 Equations 2 and 3 include a term that is the ratio of a Fussell-Vesely importance value 9 divided by the related unreliability or unavailability. Calculation of these quantities is 10 generally complex, but in the specific application used here, can be greatly simplified. 11 The simplifying feature of this application is that only those components (or the 12 associated basic events) that can fail a train are included in the performance index. 13 Components within a train that can each fail the train are logically equivalent and the 14 ratio FV/UR is a constant value for any basic event in that train. It can also be shown that 15 for a given component or train represented by multiple basic events, the ratio of the two 16 values for the component or train is equal to the ratio of values for any basic event within 17 the train. Or: 18 FVbe
URbe=
FVURc
URPc=
FVt
URt= Constant 19
and 20 FVbe
UAbe
=FVUAp
UAp= Constant 21
Note that the constant value may be different for the unreliability ratio and the 22 unavailability ratio because the two types of events are frequently not logically 23 equivalent. For example recovery actions may be modeled in the PRA for one but not the 24 other. 25 Thus, the process for determining the value of this ratio for any component or train is to 26 identify a basic event that fails the component or train, determine the failure probability 27 or unavailability for the event, determine the associated FV value for the event and then 28 calculate the ratio. Use the basic event in the component or train with the largest failure 29 probability (hence the maximum notation on the bracket) to minimize the effects of 30 truncation on the calculation. Exclude common cause events, which are not within the 31 scope of this performance index 32 Some systems have multiple modes of operation, such as PWR HPSI systems that operate 33 in injection as well as recirculation modes. In these systems all active components are not 34 logically equivalent, unavailability of the pump fails all operating modes while 35 unavailability of the sump suction valves only fails the recirculation mode. In cases such 36
DRAFT NEI 99-02 MSPI Rev 0
F-5
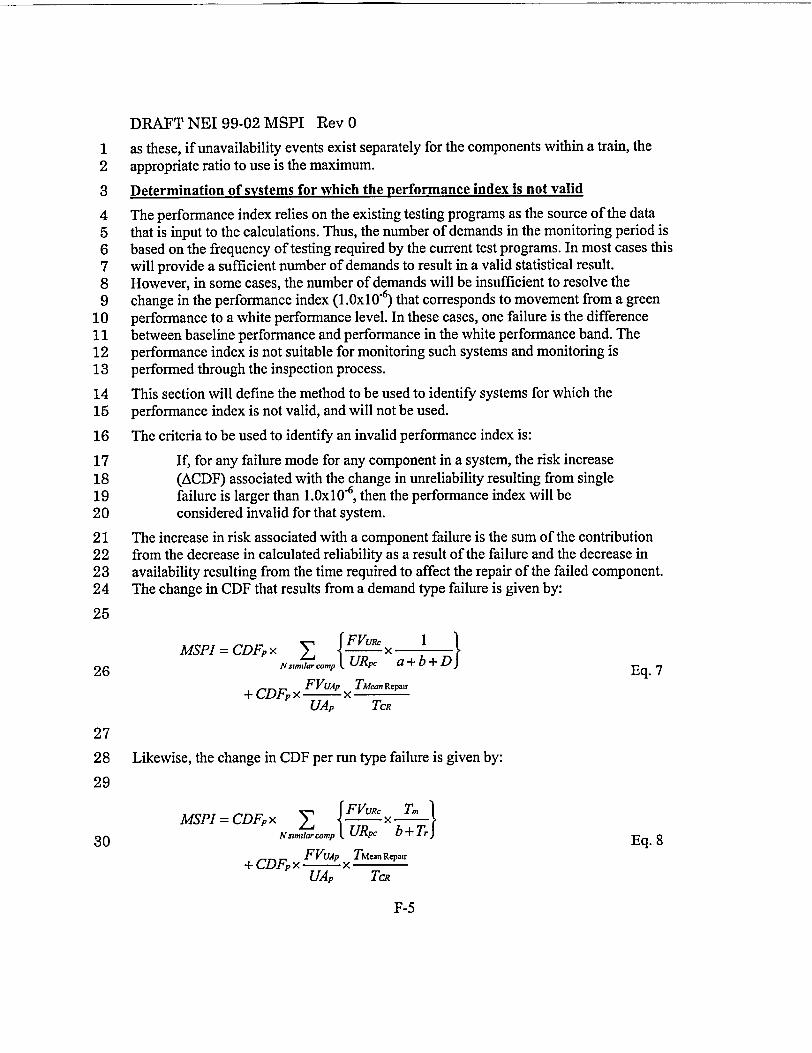
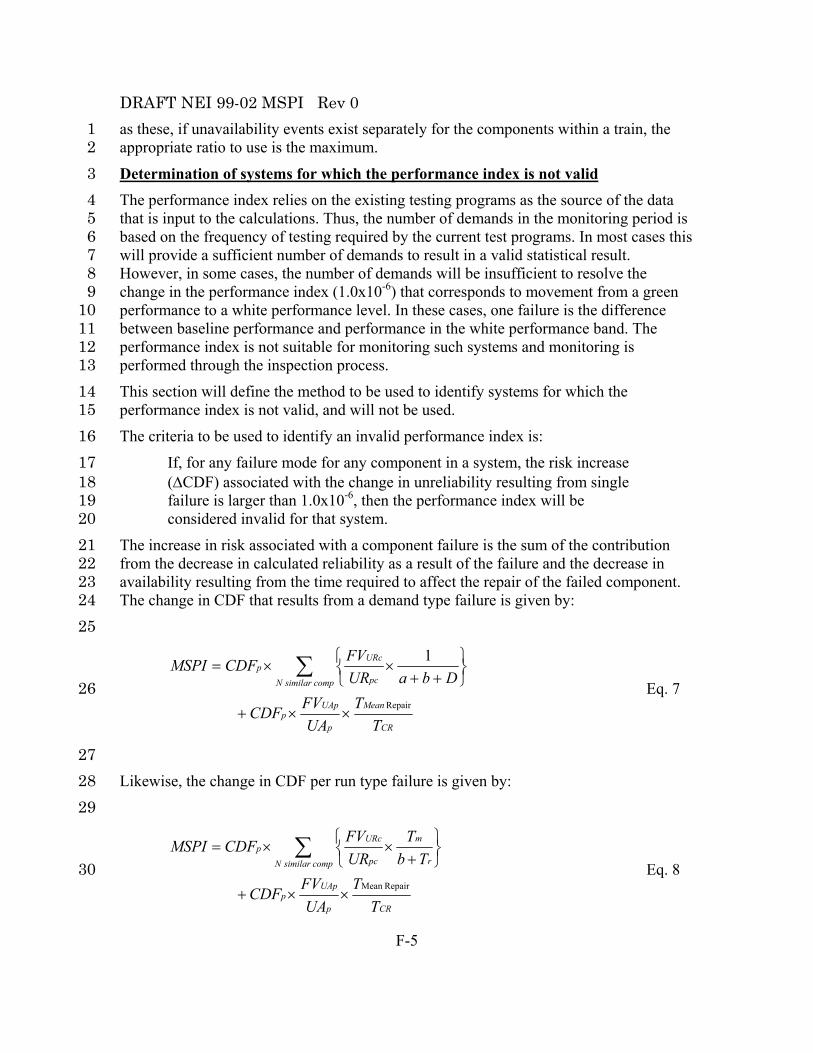
as these, if unavailability events exist separately for the components within a train, the 1 appropriate ratio to use is the maximum. 2 Determination of systems for which the performance index is not valid 3 The performance index relies on the existing testing programs as the source of the data 4 that is input to the calculations. Thus, the number of demands in the monitoring period is 5 based on the frequency of testing required by the current test programs. In most cases this 6 will provide a sufficient number of demands to result in a valid statistical result. 7 However, in some cases, the number of demands will be insufficient to resolve the 8 change in the performance index (1.0x10⁻⁶) that corresponds to movement from a green 9 performance to a white performance level. In these cases, one failure is the difference 10 between baseline performance and performance in the white performance band. The 11 performance index is not suitable for monitoring such systems and monitoring is 12 performed through the inspection process. 13 This section will define the method to be used to identify systems for which the 14 performance index is not valid, and will not be used. 15 The criteria to be used to identify an invalid performance index is: 16
If, for any failure mode for any component in a system, the risk increase 17 (∆CDF) associated with the change in unreliability resulting from single 18 failure is larger than 1.0x10⁻⁶, then the performance index will be 19 considered invalid for that system. 20
The increase in risk associated with a component failure is the sum of the contribution 21 from the decrease in calculated reliability as a result of the failure and the decrease in 22 availability resulting from the time required to affect the repair of the failed component. 23 The change in CDF that results from a demand type failure is given by: 24
25
CR
Mean
p
UApp
compsimilarN pc
URcp
TT
UAFVCDF
DbaURFVCDFMSPI
Repair
1
××+
++××= ∑
Eq. 7 26
27 Likewise, the change in CDF per run type failure is given by: 28
29
CRp
UApp
compsimilarN r
m
pc
URcp
TT
UAFVCDF
TbT
URFVCDFMSPI
RepairMean
××+
+××= ∑
Eq. 8 30
DRAFT NEI 99-02 MSPI Rev 0
F-6
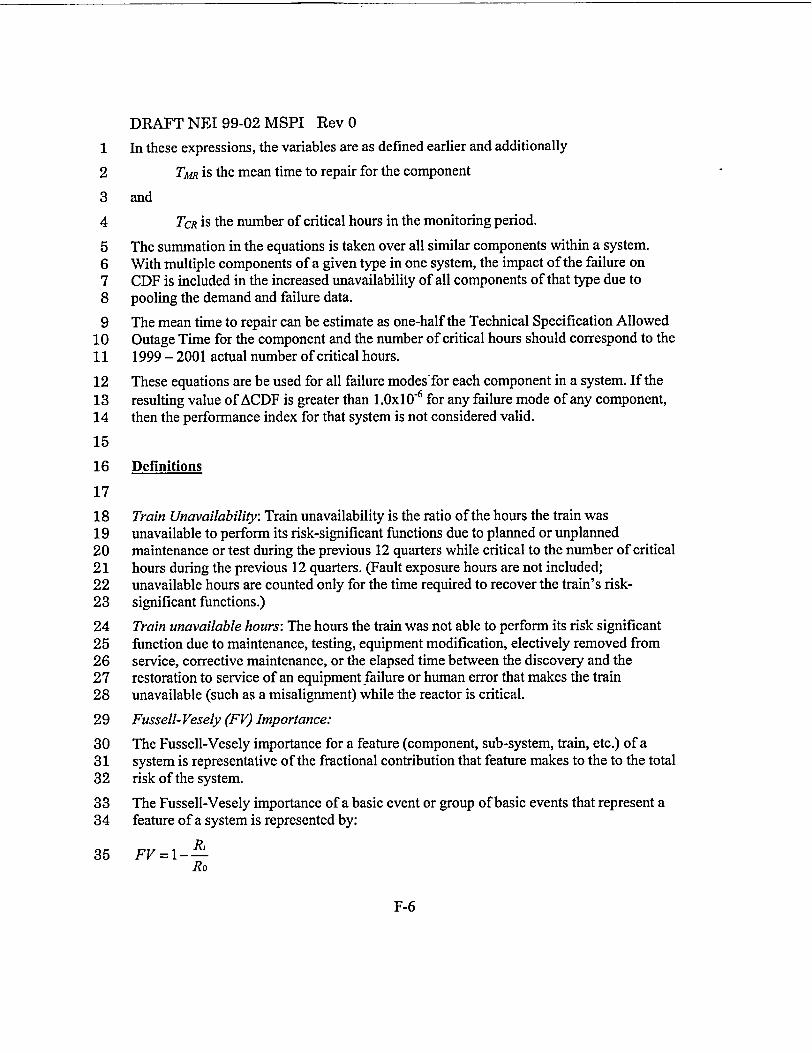
In these expressions, the variables are as defined earlier and additionally 1 TMR is the mean time to repair for the component 2
and 3 TCR is the number of critical hours in the monitoring period. 4
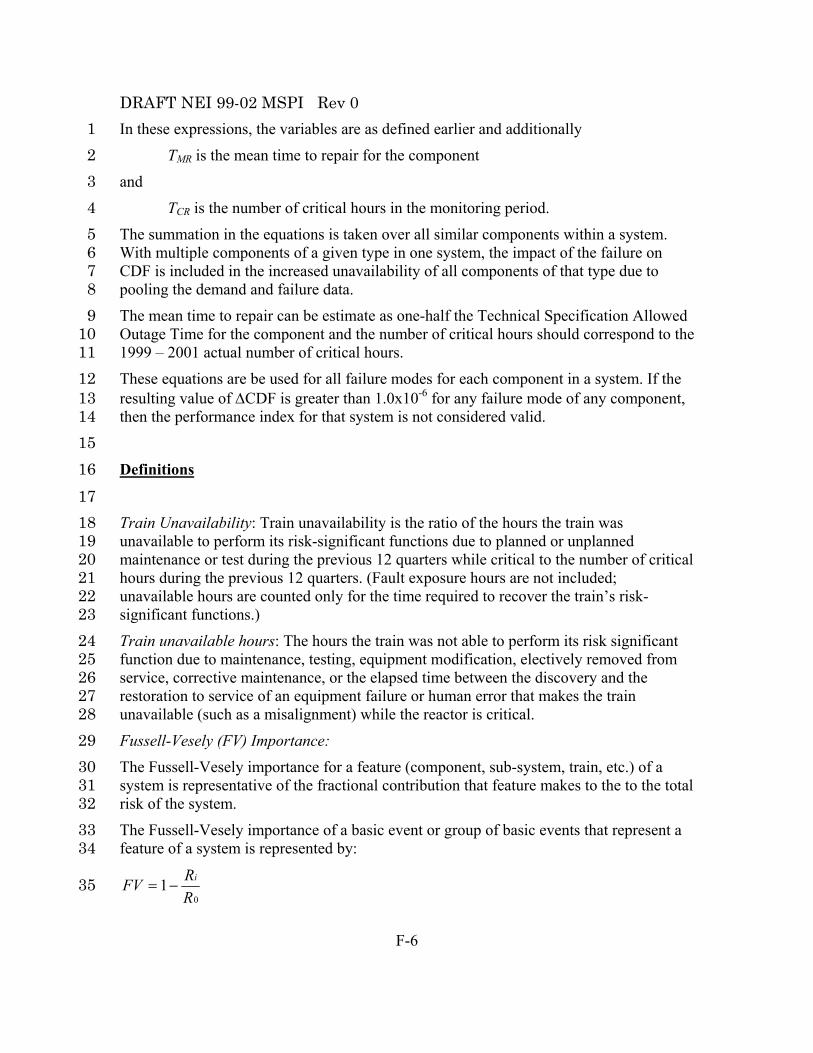
The summation in the equations is taken over all similar components within a system. 5 With multiple components of a given type in one system, the impact of the failure on 6 CDF is included in the increased unavailability of all components of that type due to 7 pooling the demand and failure data. 8 The mean time to repair can be estimate as one-half the Technical Specification Allowed 9 Outage Time for the component and the number of critical hours should correspond to the 10 1999 – 2001 actual number of critical hours. 11 These equations are be used for all failure modes for each component in a system. If the 12 resulting value of ∆CDF is greater than 1.0x10⁻⁶ for any failure mode of any component, 13 then the performance index for that system is not considered valid. 14 15 Definitions 16 17 Train Unavailability: Train unavailability is the ratio of the hours the train was 18 unavailable to perform its risk-significant functions due to planned or unplanned 19 maintenance or test during the previous 12 quarters while critical to the number of critical 20 hours during the previous 12 quarters. (Fault exposure hours are not included; 21 unavailable hours are counted only for the time required to recover the train’s risk-22 significant functions.) 23 Train unavailable hours: The hours the train was not able to perform its risk significant 24 function due to maintenance, testing, equipment modification, electively removed from 25 service, corrective maintenance, or the elapsed time between the discovery and the 26 restoration to service of an equipment failure or human error that makes the train 27 unavailable (such as a misalignment) while the reactor is critical. 28 Fussell-Vesely (FV) Importance: 29 The Fussell-Vesely importance for a feature (component, sub-system, train, etc.) of a 30 system is representative of the fractional contribution that feature makes to the to the total 31 risk of the system. 32 The Fussell-Vesely importance of a basic event or group of basic events that represent a 33 feature of a system is represented by: 34
01
RRFV i
−= 35
DRAFT NEI 99-02 MSPI Rev 0
F-7
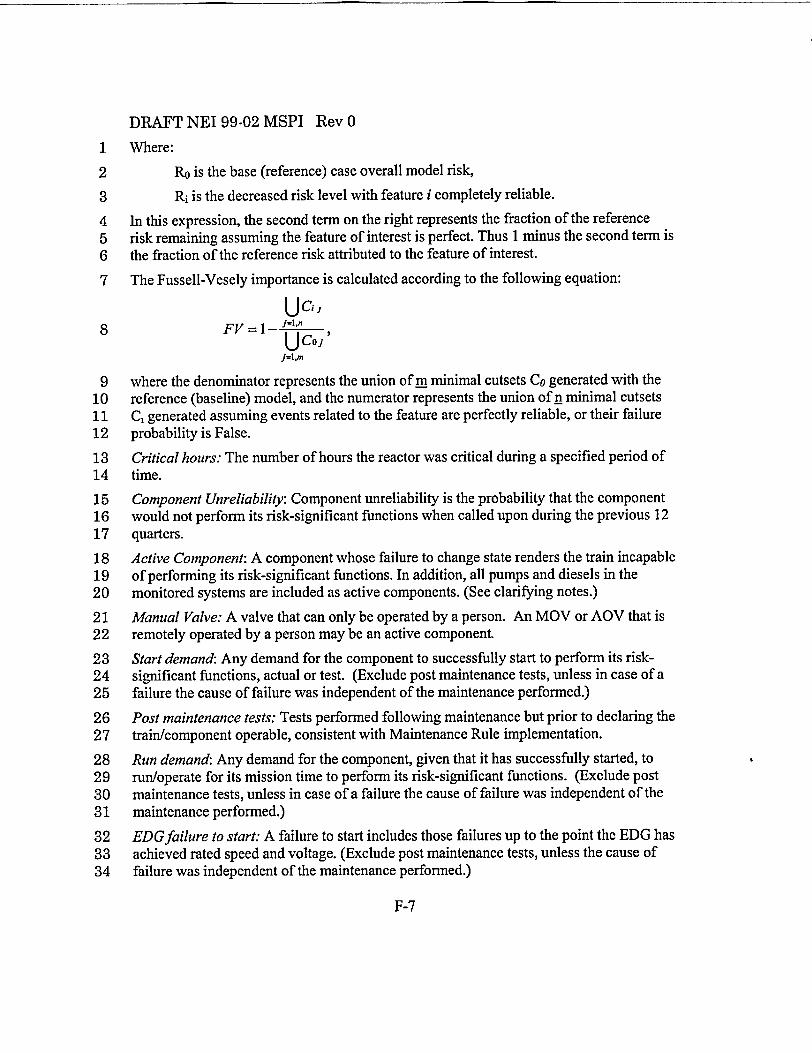
Where: 1 R0 is the base (reference) case overall model risk, 2 Ri is the decreased risk level with feature i completely reliable. 3
In this expression, the second term on the right represents the fraction of the reference 4 risk remaining assuming the feature of interest is perfect. Thus 1 minus the second term is 5 the fraction of the reference risk attributed to the feature of interest. 6 The Fussell-Vesely importance is calculated according to the following equation: 7
U
U
mj
j
nj
ji
C
CFV
,1
0
,1
1
=
=−= , 8
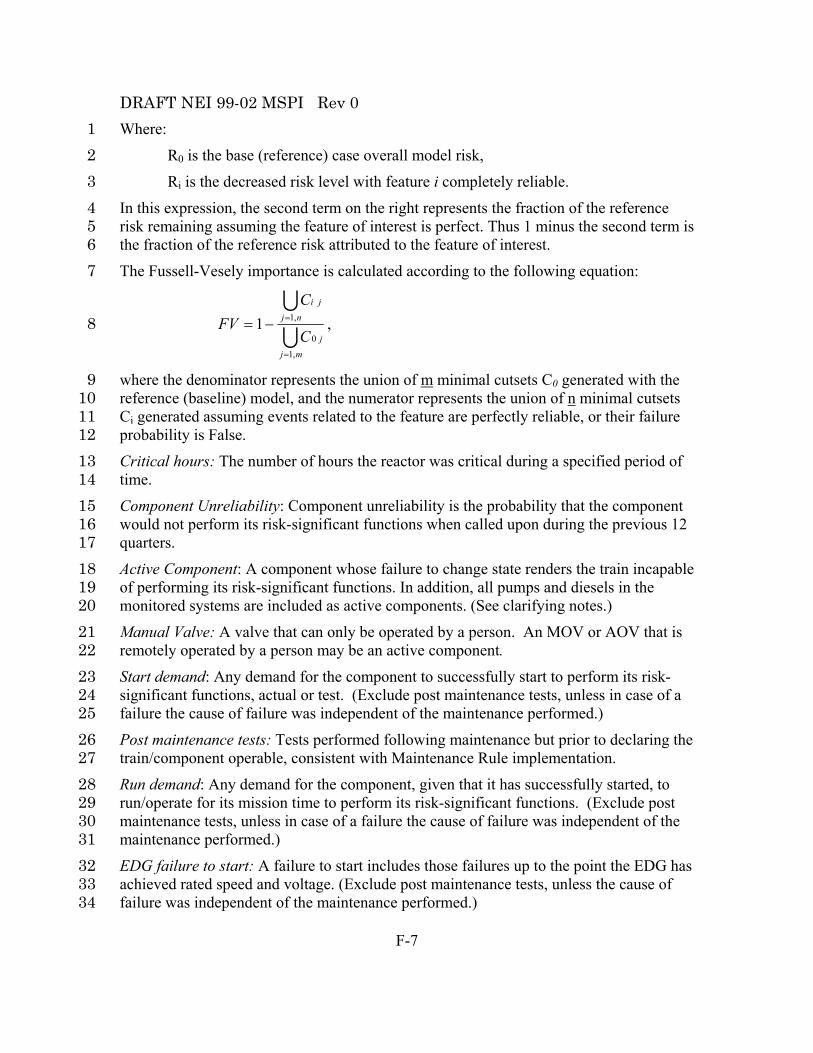
where the denominator represents the union of m minimal cutsets C0 generated with the 9 reference (baseline) model, and the numerator represents the union of n minimal cutsets 10 Ci generated assuming events related to the feature are perfectly reliable, or their failure 11 probability is False. 12 Critical hours: The number of hours the reactor was critical during a specified period of 13 time. 14 Component Unreliability: Component unreliability is the probability that the component 15 would not perform its risk-significant functions when called upon during the previous 12 16 quarters. 17 Active Component: A component whose failure to change state renders the train incapable 18 of performing its risk-significant functions. In addition, all pumps and diesels in the 19 monitored systems are included as active components. (See clarifying notes.) 20 Manual Valve: A valve that can only be operated by a person. An MOV or AOV that is 21 remotely operated by a person may be an active component. 22 Start demand: Any demand for the component to successfully start to perform its risk-23 significant functions, actual or test. (Exclude post maintenance tests, unless in case of a 24 failure the cause of failure was independent of the maintenance performed.) 25 Post maintenance tests: Tests performed following maintenance but prior to declaring the 26 train/component operable, consistent with Maintenance Rule implementation. 27 Run demand: Any demand for the component, given that it has successfully started, to 28 run/operate for its mission time to perform its risk-significant functions. (Exclude post 29 maintenance tests, unless in case of a failure the cause of failure was independent of the 30 maintenance performed.) 31 EDG failure to start: A failure to start includes those failures up to the point the EDG has 32 achieved rated speed and voltage. (Exclude post maintenance tests, unless the cause of 33 failure was independent of the maintenance performed.) 34
DRAFT NEI 99-02 MSPI Rev 0
F-8
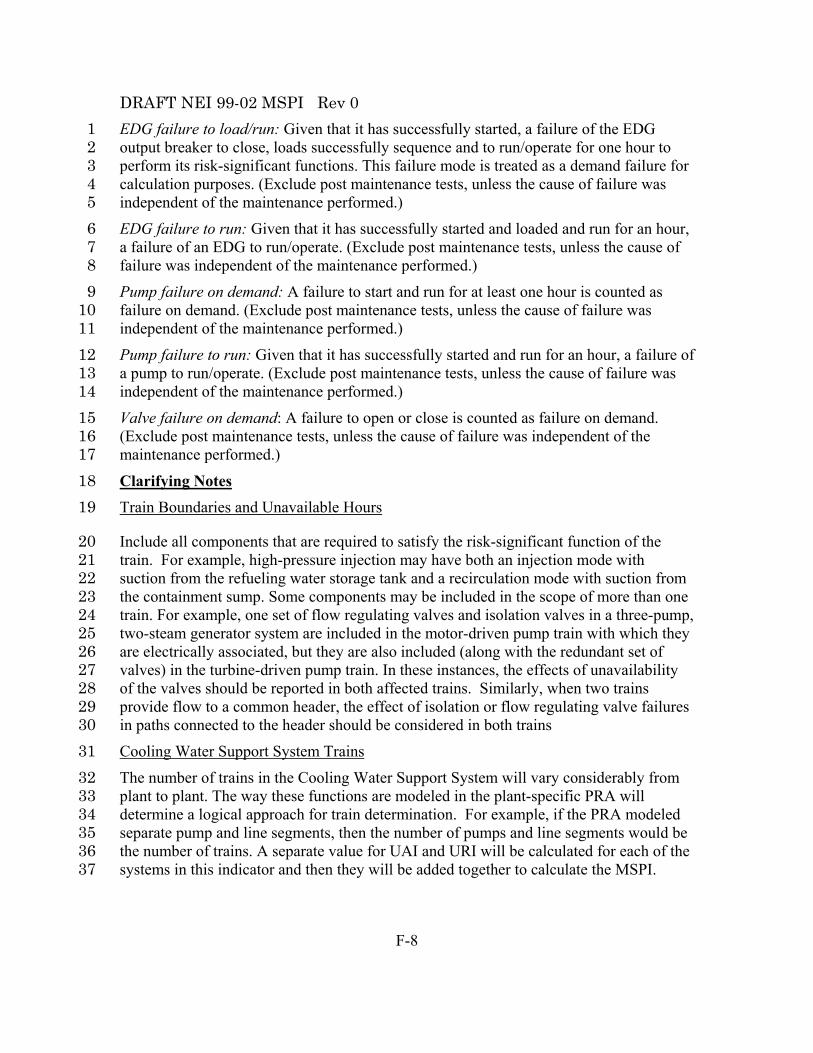
EDG failure to load/run: Given that it has successfully started, a failure of the EDG 1 output breaker to close, loads successfully sequence and to run/operate for one hour to 2 perform its risk-significant functions. This failure mode is treated as a demand failure for 3 calculation purposes. (Exclude post maintenance tests, unless the cause of failure was 4 independent of the maintenance performed.) 5 EDG failure to run: Given that it has successfully started and loaded and run for an hour, 6 a failure of an EDG to run/operate. (Exclude post maintenance tests, unless the cause of 7 failure was independent of the maintenance performed.) 8 Pump failure on demand: A failure to start and run for at least one hour is counted as 9 failure on demand. (Exclude post maintenance tests, unless the cause of failure was 10 independent of the maintenance performed.) 11 Pump failure to run: Given that it has successfully started and run for an hour, a failure of 12 a pump to run/operate. (Exclude post maintenance tests, unless the cause of failure was 13 independent of the maintenance performed.) 14 Valve failure on demand: A failure to open or close is counted as failure on demand. 15 (Exclude post maintenance tests, unless the cause of failure was independent of the 16 maintenance performed.) 17 Clarifying Notes 18 Train Boundaries and Unavailable Hours 19
Include all components that are required to satisfy the risk-significant function of the 20 train. For example, high-pressure injection may have both an injection mode with 21 suction from the refueling water storage tank and a recirculation mode with suction from 22 the containment sump. Some components may be included in the scope of more than one 23 train. For example, one set of flow regulating valves and isolation valves in a three-pump, 24 two-steam generator system are included in the motor-driven pump train with which they 25 are electrically associated, but they are also included (along with the redundant set of 26 valves) in the turbine-driven pump train. In these instances, the effects of unavailability 27 of the valves should be reported in both affected trains. Similarly, when two trains 28 provide flow to a common header, the effect of isolation or flow regulating valve failures 29 in paths connected to the header should be considered in both trains 30 Cooling Water Support System Trains 31 The number of trains in the Cooling Water Support System will vary considerably from 32 plant to plant. The way these functions are modeled in the plant-specific PRA will 33 determine a logical approach for train determination. For example, if the PRA modeled 34 separate pump and line segments, then the number of pumps and line segments would be 35 the number of trains. A separate value for UAI and URI will be calculated for each of the 36 systems in this indicator and then they will be added together to calculate the MSPI. 37
DRAFT NEI 99-02 MSPI Rev 0
F-9
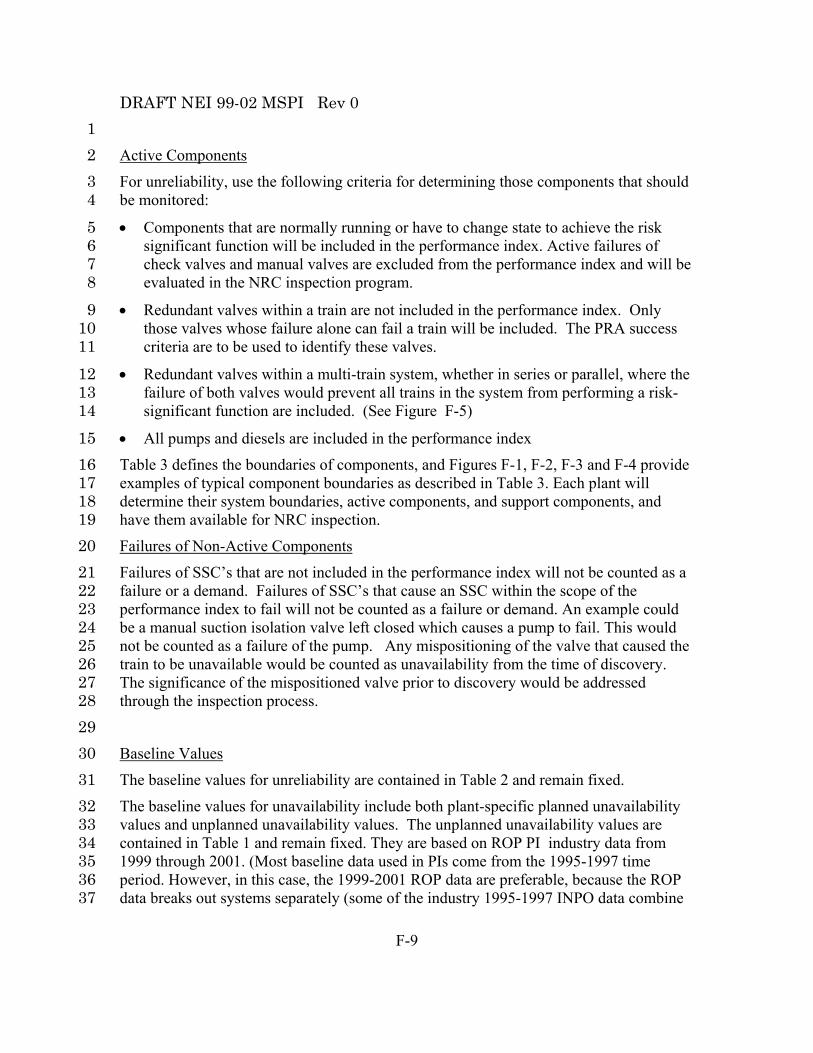
1 Active Components 2 For unreliability, use the following criteria for determining those components that should 3 be monitored: 4 • Components that are normally running or have to change state to achieve the risk 5
significant function will be included in the performance index. Active failures of 6 check valves and manual valves are excluded from the performance index and will be 7 evaluated in the NRC inspection program. 8
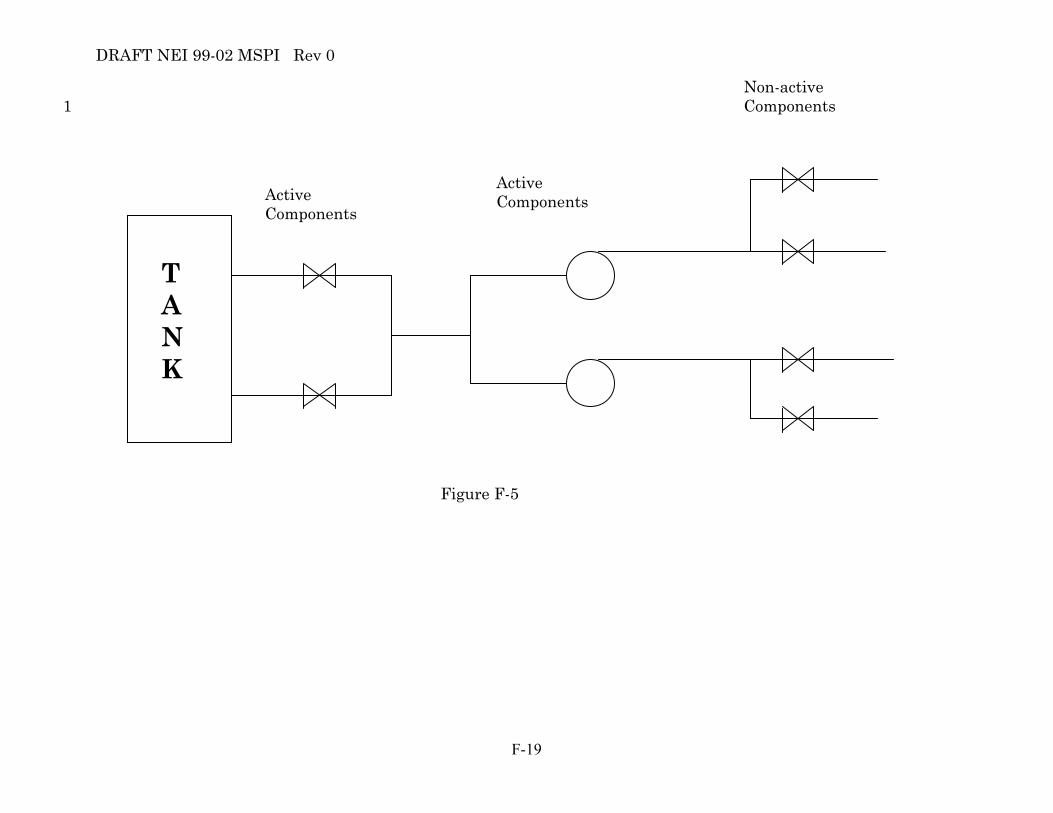
• Redundant valves within a train are not included in the performance index. Only 9 those valves whose failure alone can fail a train will be included. The PRA success 10 criteria are to be used to identify these valves. 11
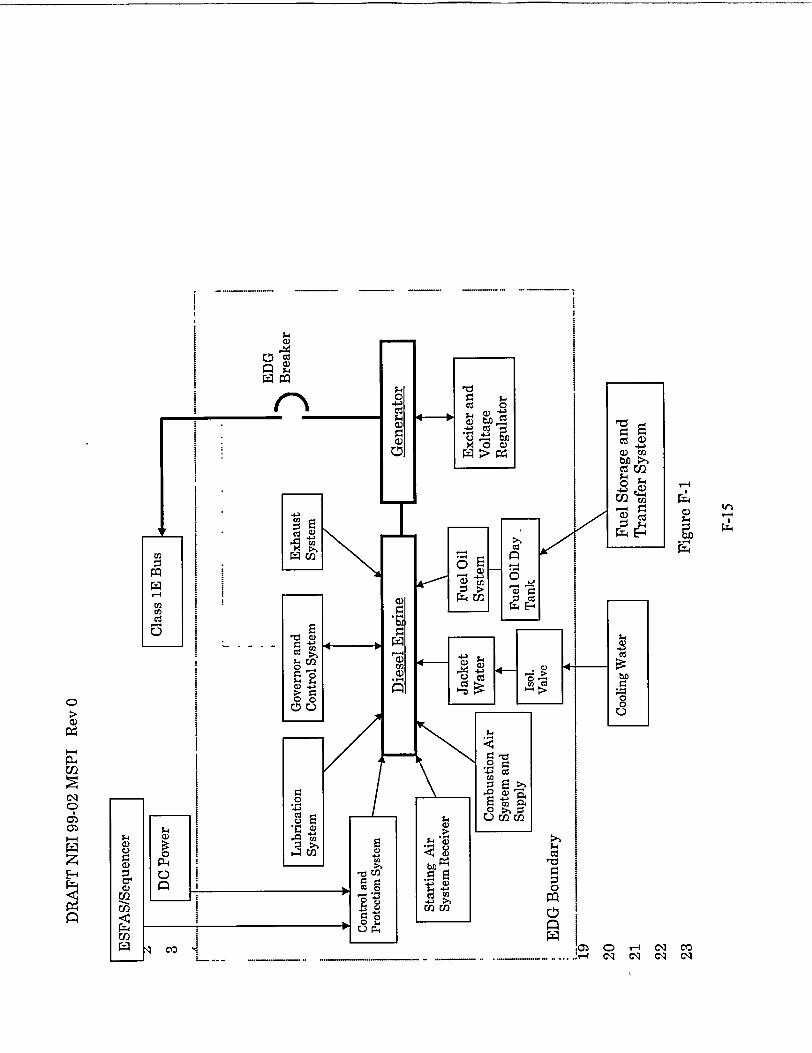
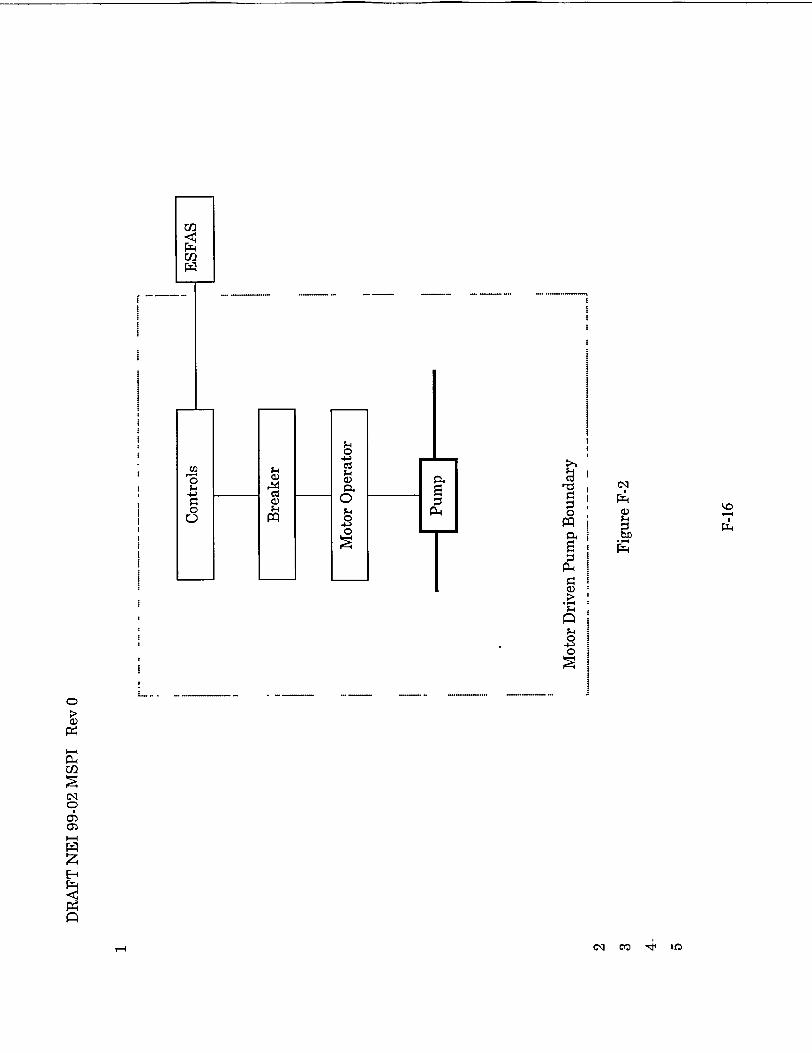
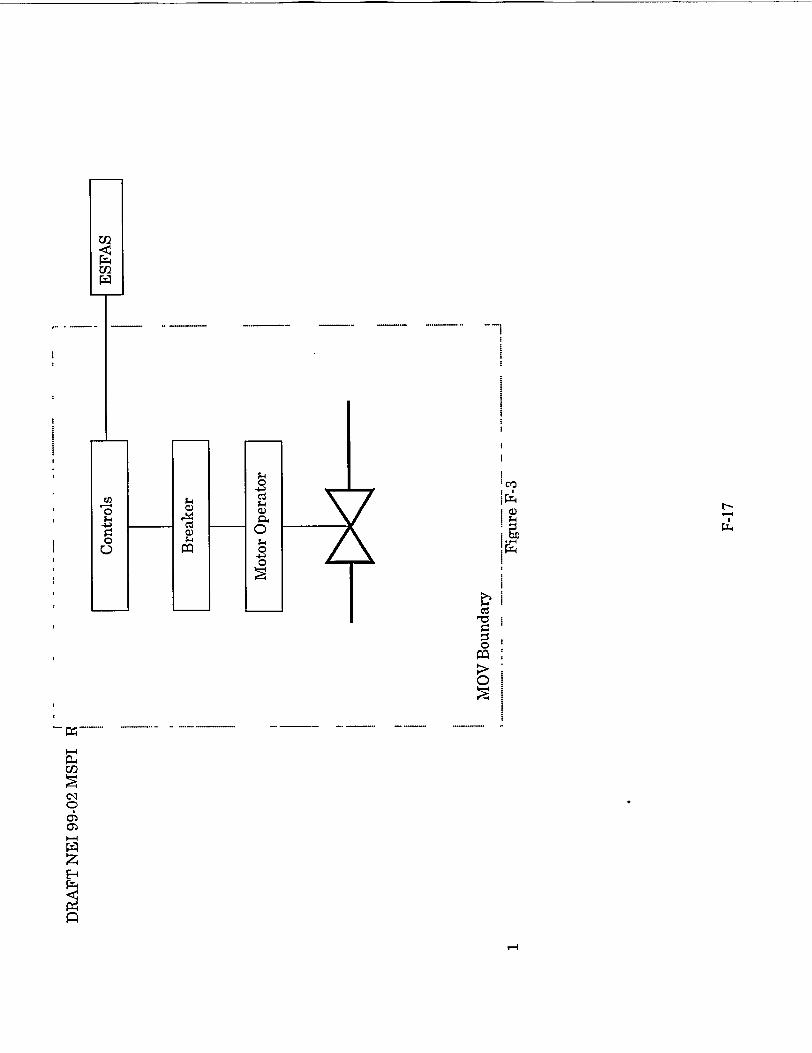
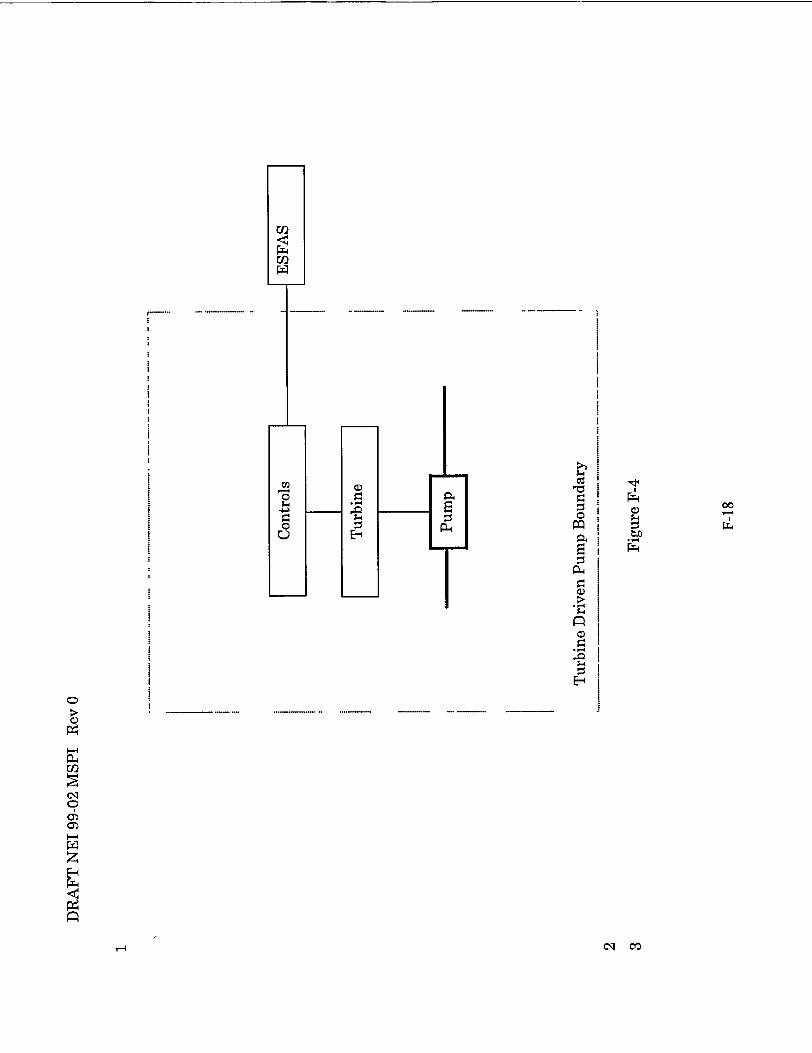
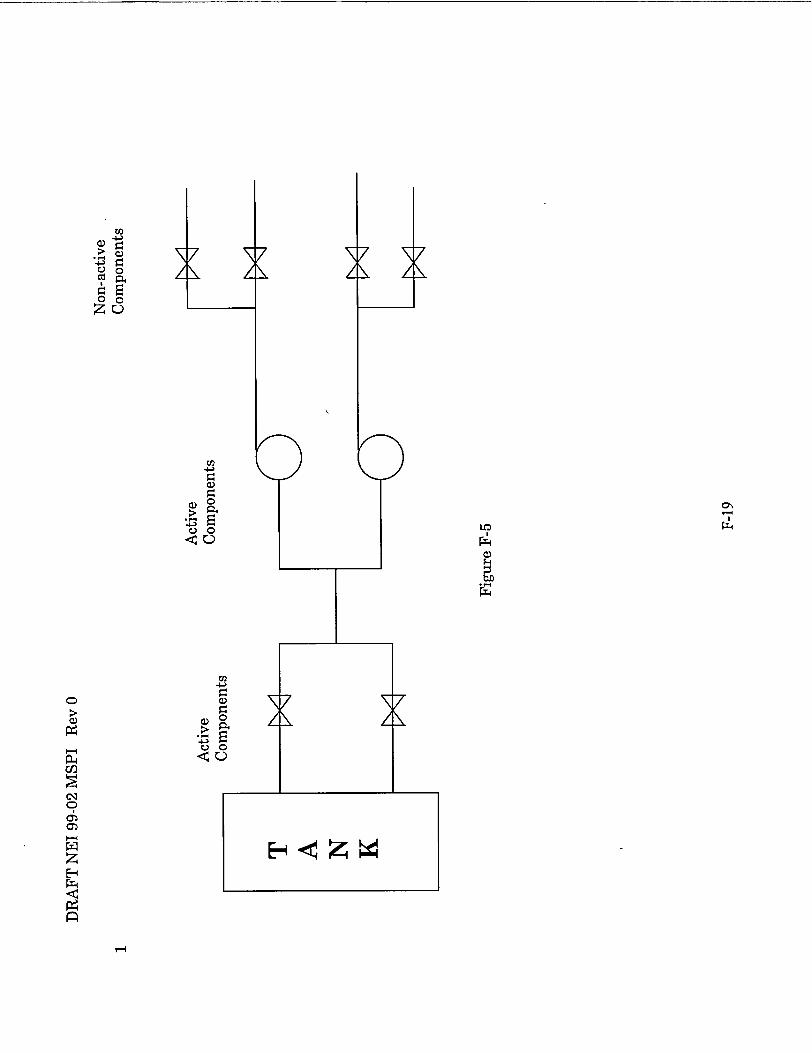
• Redundant valves within a multi-train system, whether in series or parallel, where the 12 failure of both valves would prevent all trains in the system from performing a risk-13 significant function are included. (See Figure F-5) 14
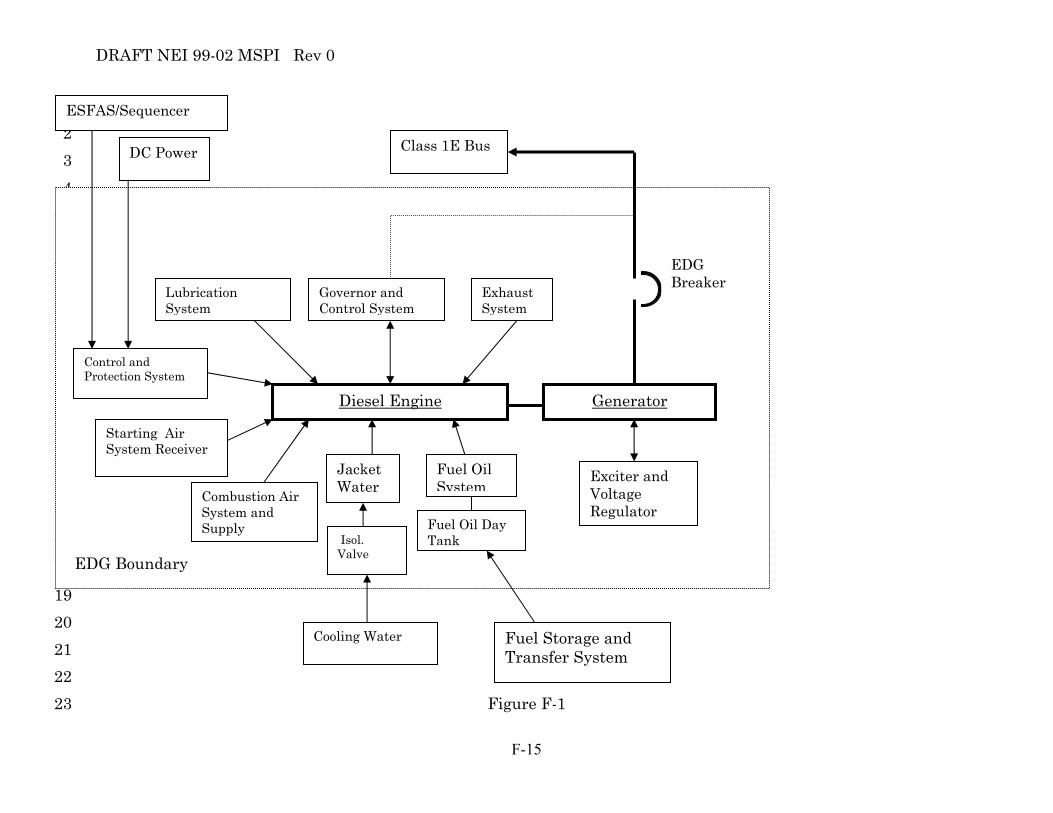
• All pumps and diesels are included in the performance index 15 Table 3 defines the boundaries of components, and Figures F-1, F-2, F-3 and F-4 provide 16 examples of typical component boundaries as described in Table 3. Each plant will 17 determine their system boundaries, active components, and support components, and 18 have them available for NRC inspection. 19 Failures of Non-Active Components 20 Failures of SSC’s that are not included in the performance index will not be counted as a 21 failure or a demand. Failures of SSC’s that cause an SSC within the scope of the 22 performance index to fail will not be counted as a failure or demand. An example could 23 be a manual suction isolation valve left closed which causes a pump to fail. This would 24 not be counted as a failure of the pump. Any mispositioning of the valve that caused the 25 train to be unavailable would be counted as unavailability from the time of discovery. 26 The significance of the mispositioned valve prior to discovery would be addressed 27 through the inspection process. 28 29 Baseline Values 30 The baseline values for unreliability are contained in Table 2 and remain fixed. 31 The baseline values for unavailability include both plant-specific planned unavailability 32 values and unplanned unavailability values. The unplanned unavailability values are 33 contained in Table 1 and remain fixed. They are based on ROP PI industry data from 34 1999 through 2001. (Most baseline data used in PIs come from the 1995-1997 time 35 period. However, in this case, the 1999-2001 ROP data are preferable, because the ROP 36 data breaks out systems separately (some of the industry 1995-1997 INPO data combine 37
DRAFT NEI 99-02 MSPI Rev 0
F-10
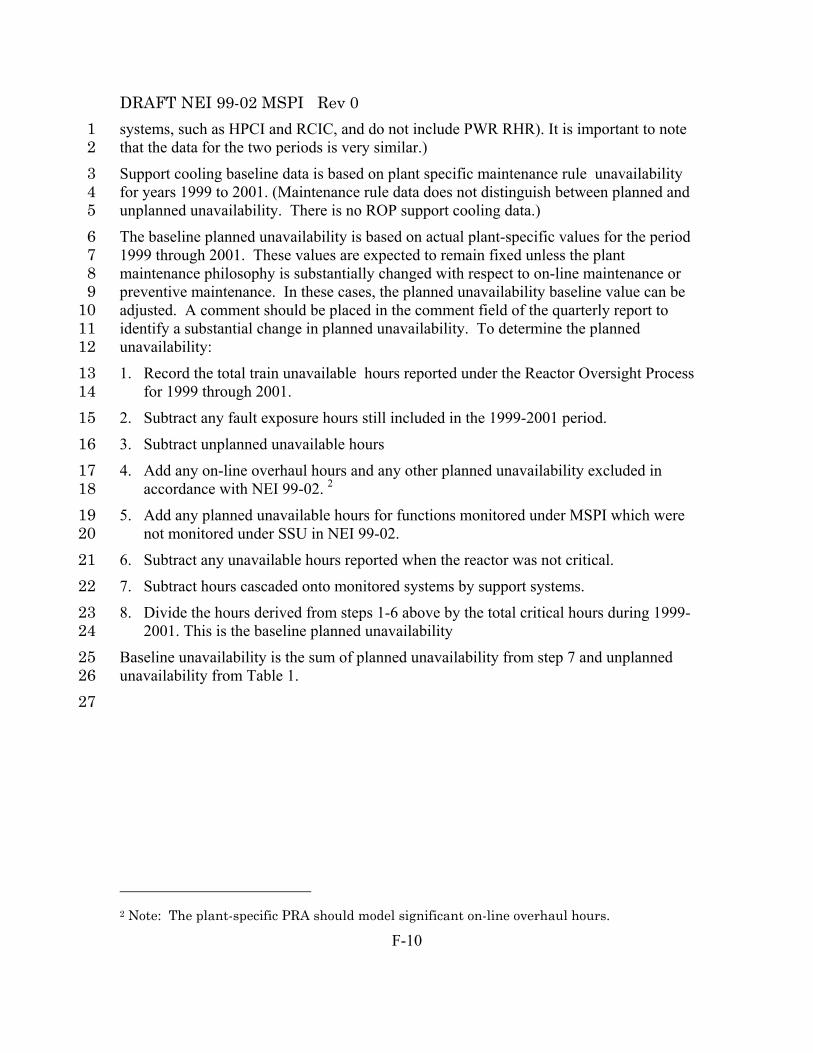
systems, such as HPCI and RCIC, and do not include PWR RHR). It is important to note 1 that the data for the two periods is very similar.) 2 Support cooling baseline data is based on plant specific maintenance rule unavailability 3 for years 1999 to 2001. (Maintenance rule data does not distinguish between planned and 4 unplanned unavailability. There is no ROP support cooling data.) 5 The baseline planned unavailability is based on actual plant-specific values for the period 6 1999 through 2001. These values are expected to remain fixed unless the plant 7 maintenance philosophy is substantially changed with respect to on-line maintenance or 8 preventive maintenance. In these cases, the planned unavailability baseline value can be 9 adjusted. A comment should be placed in the comment field of the quarterly report to 10 identify a substantial change in planned unavailability. To determine the planned 11 unavailability: 12 1. Record the total train unavailable hours reported under the Reactor Oversight Process 13
for 1999 through 2001. 14 2. Subtract any fault exposure hours still included in the 1999-2001 period. 15 3. Subtract unplanned unavailable hours 16 4. Add any on-line overhaul hours and any other planned unavailability excluded in 17
accordance with NEI 99-02. 2 18 5. Add any planned unavailable hours for functions monitored under MSPI which were 19
not monitored under SSU in NEI 99-02. 20 6. Subtract any unavailable hours reported when the reactor was not critical. 21 7. Subtract hours cascaded onto monitored systems by support systems. 22 8. Divide the hours derived from steps 1-6 above by the total critical hours during 1999-23
2001. This is the baseline planned unavailability 24 Baseline unavailability is the sum of planned unavailability from step 7 and unplanned 25 unavailability from Table 1. 26 27
2 Note: The plant-specific PRA should model significant on-line overhaul hours.
DRAFT NEI 99-02 MSPI Rev 0
F-11
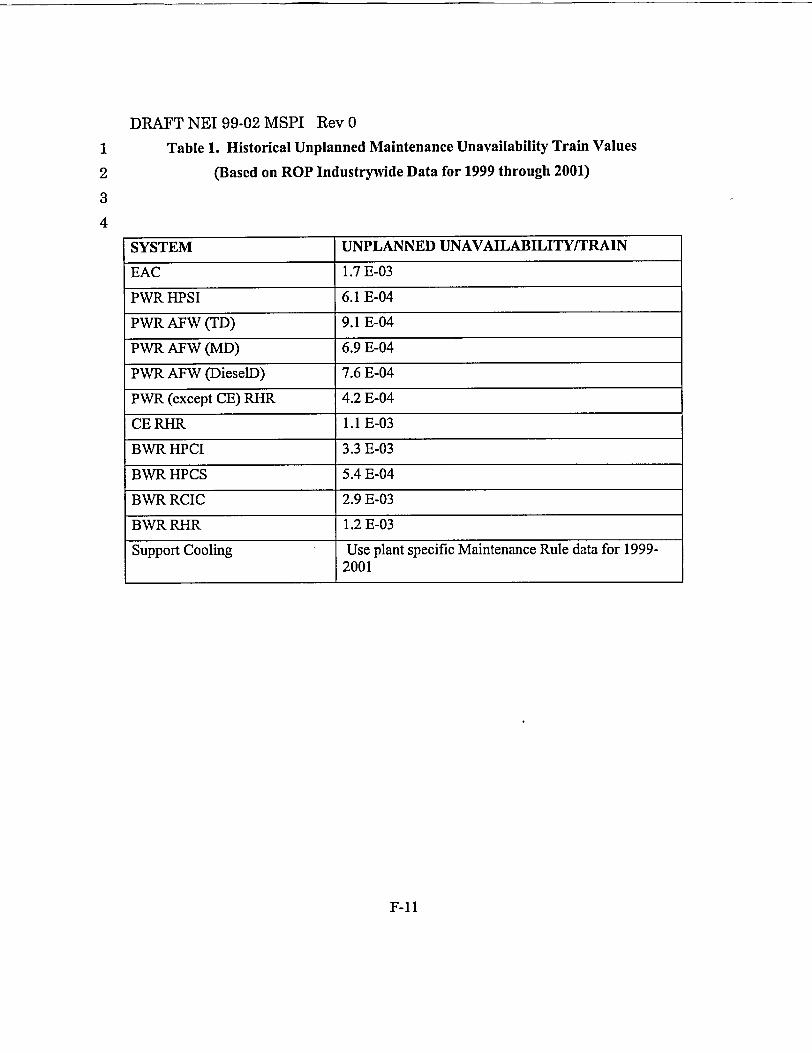
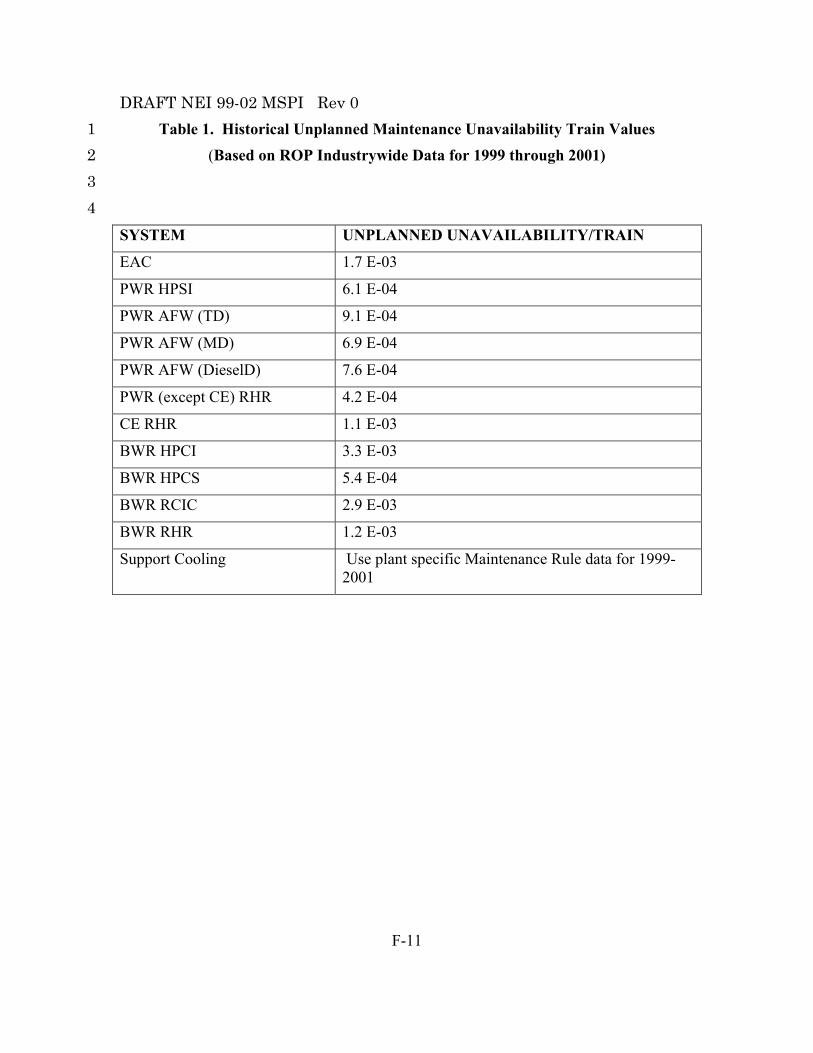
Table 1. Historical Unplanned Maintenance Unavailability Train Values 1 (Based on ROP Industrywide Data for 1999 through 2001) 2
3 4
SYSTEM UNPLANNED UNAVAILABILITY/TRAIN
EAC 1.7 E-03
PWR HPSI 6.1 E-04
PWR AFW (TD) 9.1 E-04
PWR AFW (MD) 6.9 E-04
PWR AFW (DieselD) 7.6 E-04
PWR (except CE) RHR 4.2 E-04
CE RHR 1.1 E-03
BWR HPCI 3.3 E-03
BWR HPCS 5.4 E-04
BWR RCIC 2.9 E-03
BWR RHR 1.2 E-03
Support Cooling Use plant specific Maintenance Rule data for 1999-2001
DRAFT NEI 99-02 MSPI Rev 0
F-12
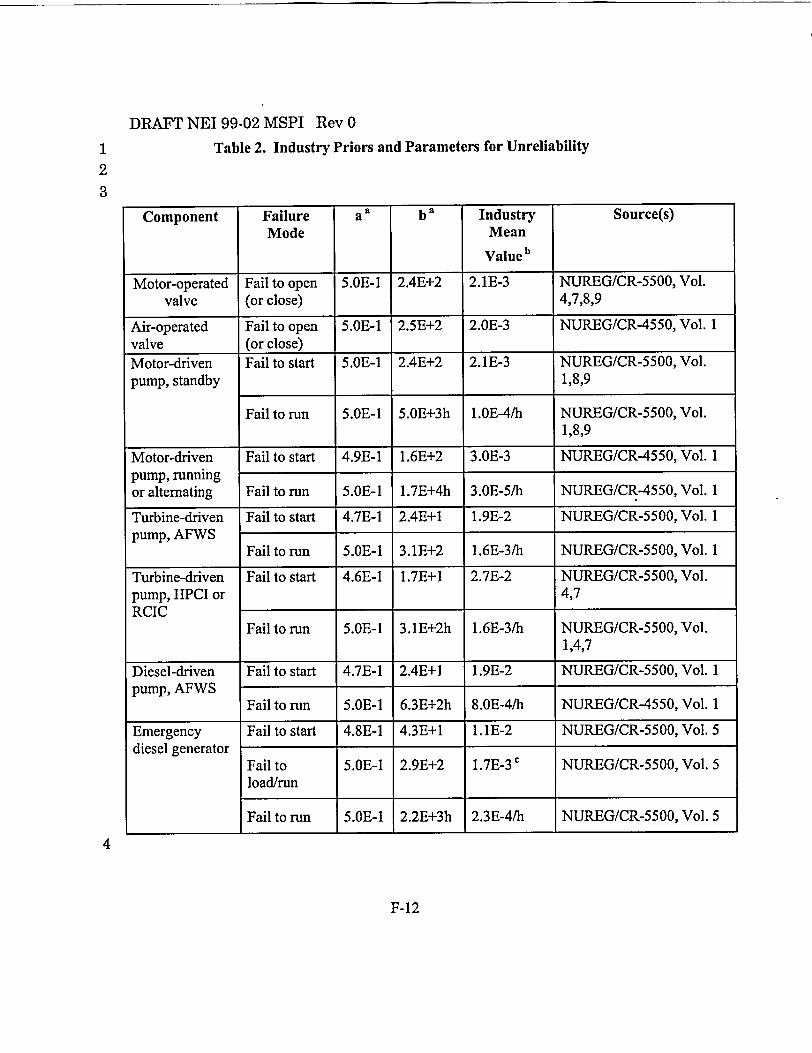
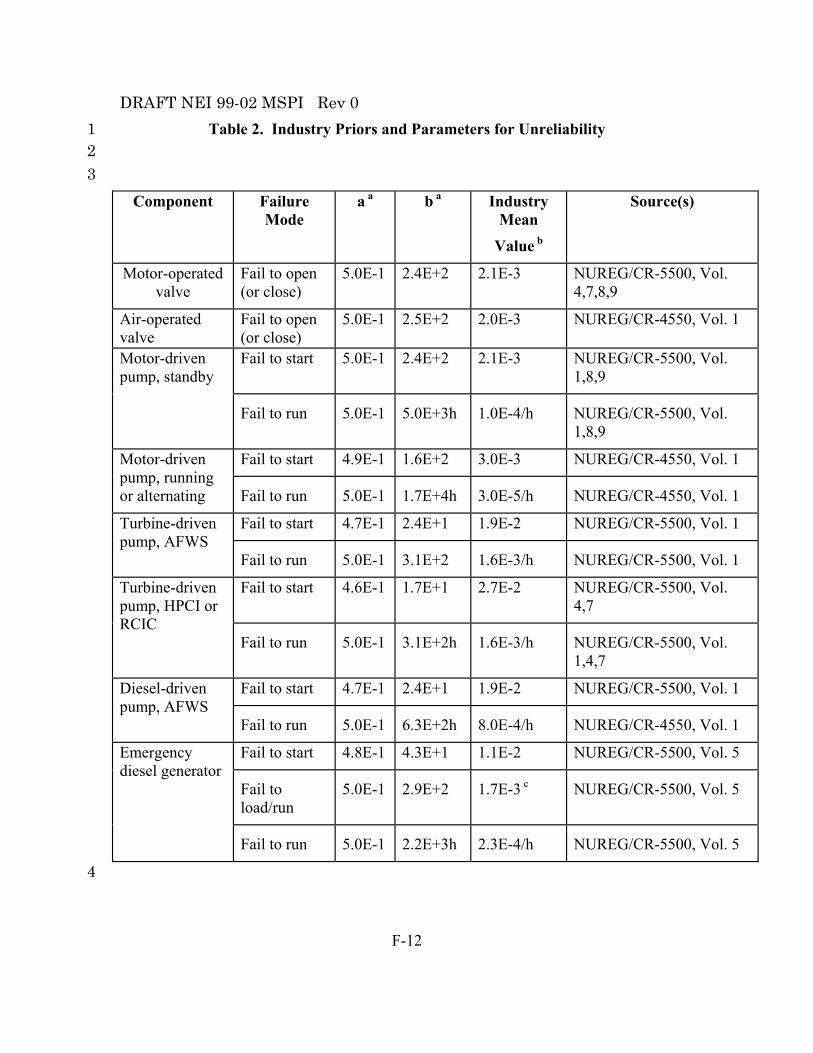
Table 2. Industry Priors and Parameters for Unreliability 1 2 3
Component Failure Mode
a a b a Industry Mean
Value b
Source(s)
Motor-operated valve
Fail to open (or close)
5.0E-1 2.4E+2 2.1E-3 NUREG/CR-5500, Vol. 4,7,8,9
Air-operated valve
Fail to open (or close)
5.0E-1 2.5E+2 2.0E-3 NUREG/CR-4550, Vol. 1
Fail to start 5.0E-1 2.4E+2 2.1E-3 NUREG/CR-5500, Vol. 1,8,9
Motor-driven pump, standby
Fail to run
5.0E-1
5.0E+3h
1.0E-4/h
NUREG/CR-5500, Vol. 1,8,9
Fail to start 4.9E-1 1.6E+2 3.0E-3 NUREG/CR-4550, Vol. 1 Motor-driven pump, running or alternating
Fail to run
5.0E-1
1.7E+4h
3.0E-5/h
NUREG/CR-4550, Vol. 1
Fail to start 4.7E-1 2.4E+1 1.9E-2 NUREG/CR-5500, Vol. 1 Turbine-driven pump, AFWS
Fail to run 5.0E-1
3.1E+2
1.6E-3/h
NUREG/CR-5500, Vol. 1
Fail to start 4.6E-1 1.7E+1 2.7E-2 NUREG/CR-5500, Vol. 4,7
Turbine-driven pump, HPCI or RCIC
Fail to run 5.0E-1
3.1E+2h
1.6E-3/h
NUREG/CR-5500, Vol. 1,4,7
Fail to start 4.7E-1 2.4E+1 1.9E-2 NUREG/CR-5500, Vol. 1 Diesel-driven pump, AFWS
Fail to run 5.0E-1
6.3E+2h
8.0E-4/h
NUREG/CR-4550, Vol. 1
Fail to start 4.8E-1 4.3E+1 1.1E-2 NUREG/CR-5500, Vol. 5 Fail to load/run
5.0E-1
2.9E+2
1.7E-3 c
NUREG/CR-5500, Vol. 5
Emergency diesel generator
Fail to run
5.0E-1
2.2E+3h
2.3E-4/h
NUREG/CR-5500, Vol. 5
4
DRAFT NEI 99-02 MSPI Rev 0
F-13
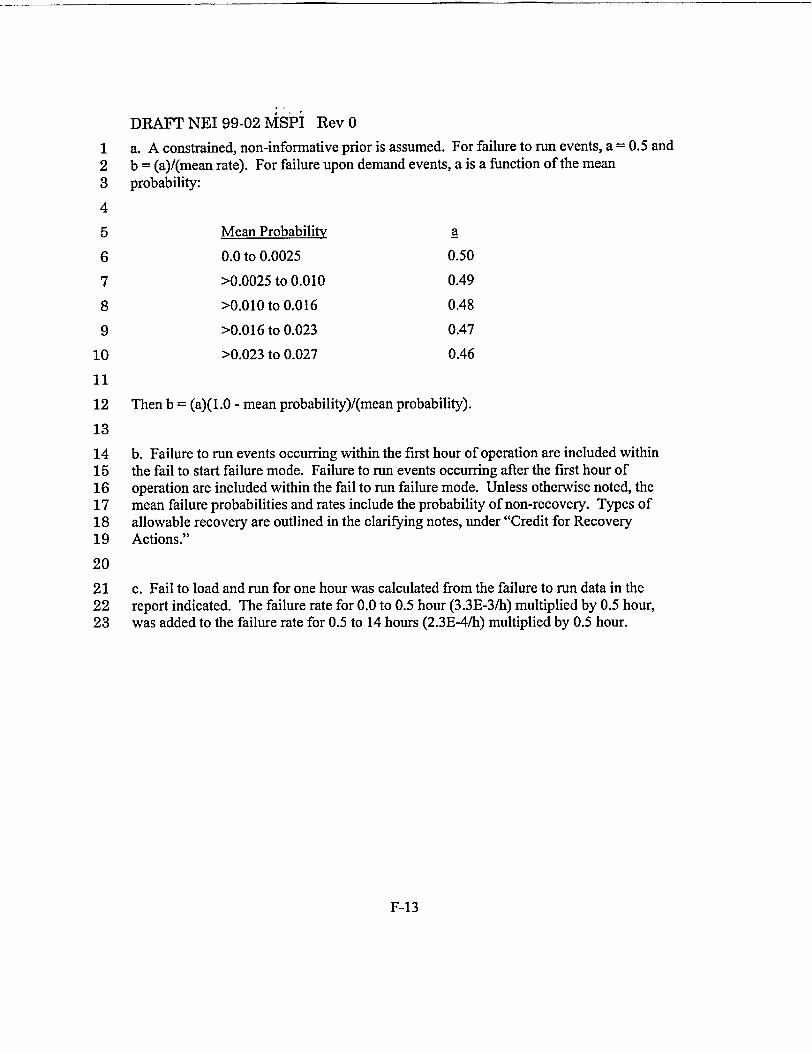
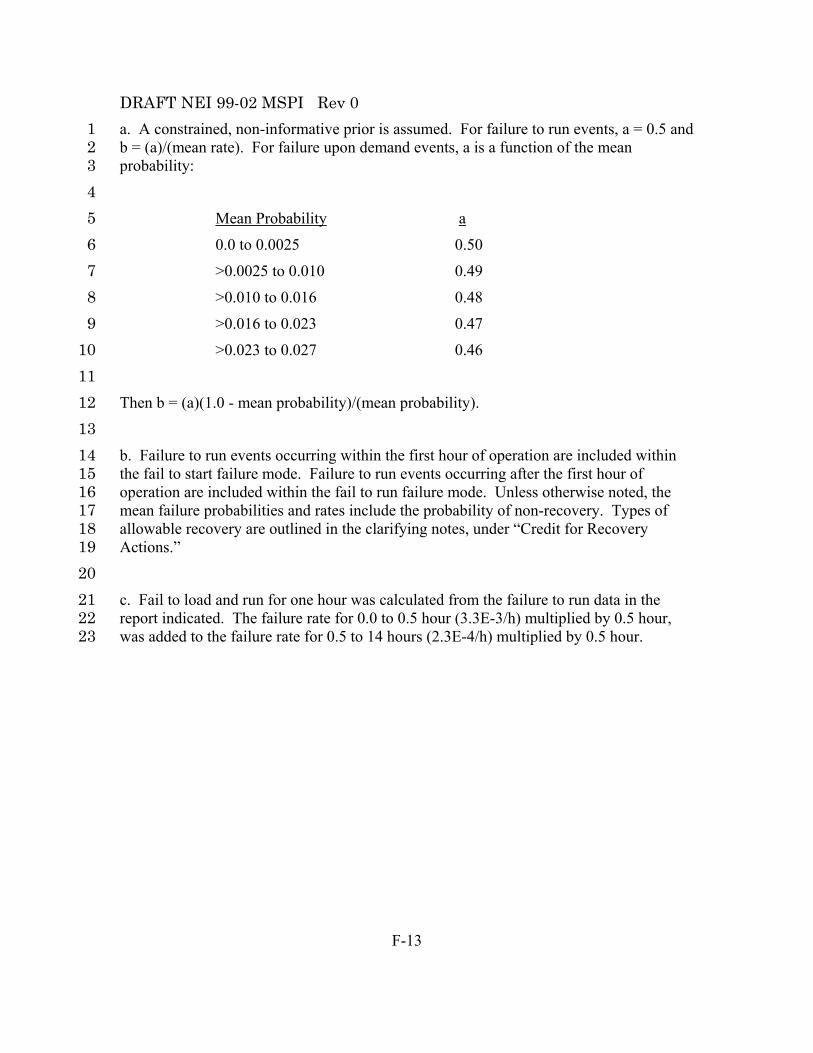
a. A constrained, non-informative prior is assumed. For failure to run events, a = 0.5 and 1 b = (a)/(mean rate). For failure upon demand events, a is a function of the mean 2 probability: 3 4
Mean Probability a 5 0.0 to 0.0025 0.50 6 >0.0025 to 0.010 0.49 7 >0.010 to 0.016 0.48 8 >0.016 to 0.023 0.47 9 >0.023 to 0.027 0.46 10
11 Then b = (a)(1.0 - mean probability)/(mean probability). 12 13 b. Failure to run events occurring within the first hour of operation are included within 14 the fail to start failure mode. Failure to run events occurring after the first hour of 15 operation are included within the fail to run failure mode. Unless otherwise noted, the 16 mean failure probabilities and rates include the probability of non-recovery. Types of 17 allowable recovery are outlined in the clarifying notes, under “Credit for Recovery 18 Actions.” 19 20 c. Fail to load and run for one hour was calculated from the failure to run data in the 21 report indicated. The failure rate for 0.0 to 0.5 hour (3.3E-3/h) multiplied by 0.5 hour, 22 was added to the failure rate for 0.5 to 14 hours (2.3E-4/h) multiplied by 0.5 hour.23
DRAFT NEI 99-02 MSPI Rev 0
F-14
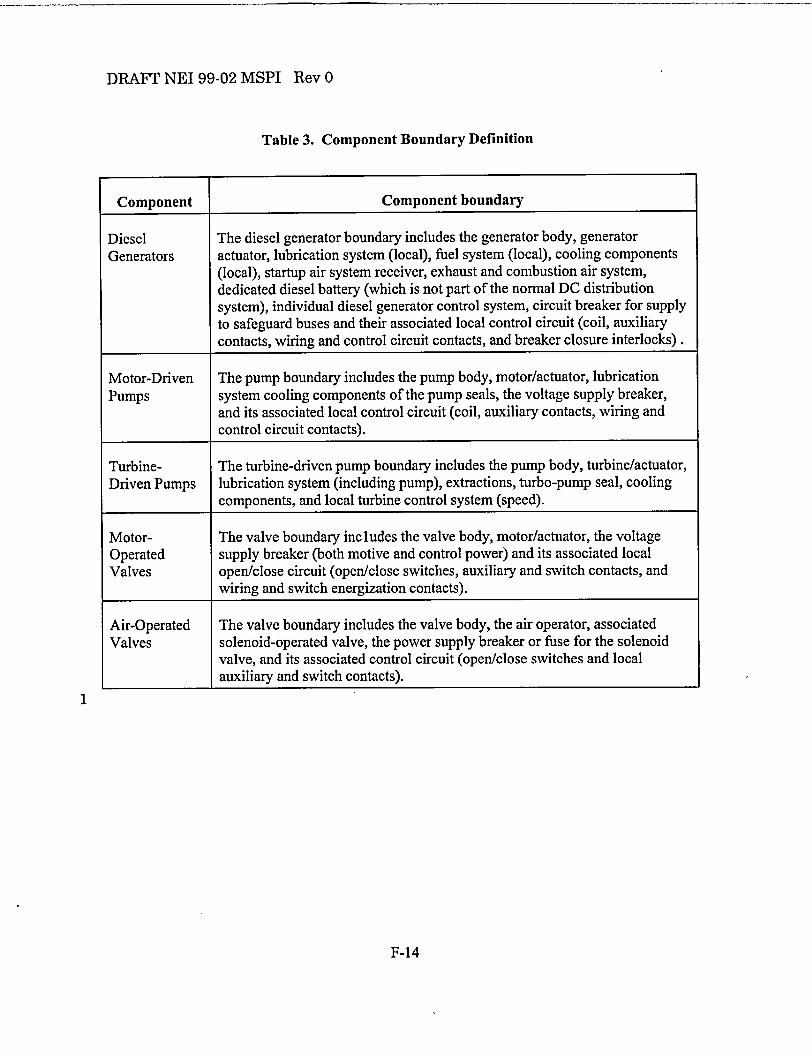
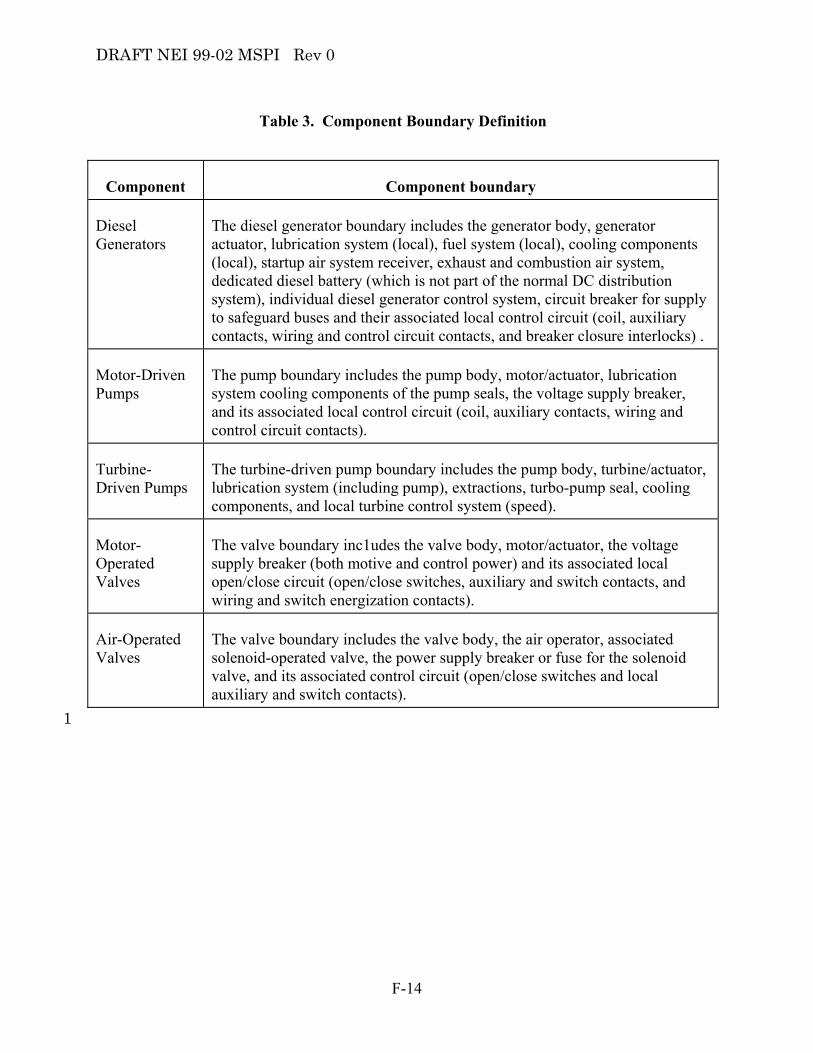
Table 3. Component Boundary Definition
Component
Component boundary Diesel Generators
The diesel generator boundary includes the generator body, generator actuator, lubrication system (local), fuel system (local), cooling components (local), startup air system receiver, exhaust and combustion air system, dedicated diesel battery (which is not part of the normal DC distribution system), individual diesel generator control system, circuit breaker for supply to safeguard buses and their associated local control circuit (coil, auxiliary contacts, wiring and control circuit contacts, and breaker closure interlocks) .
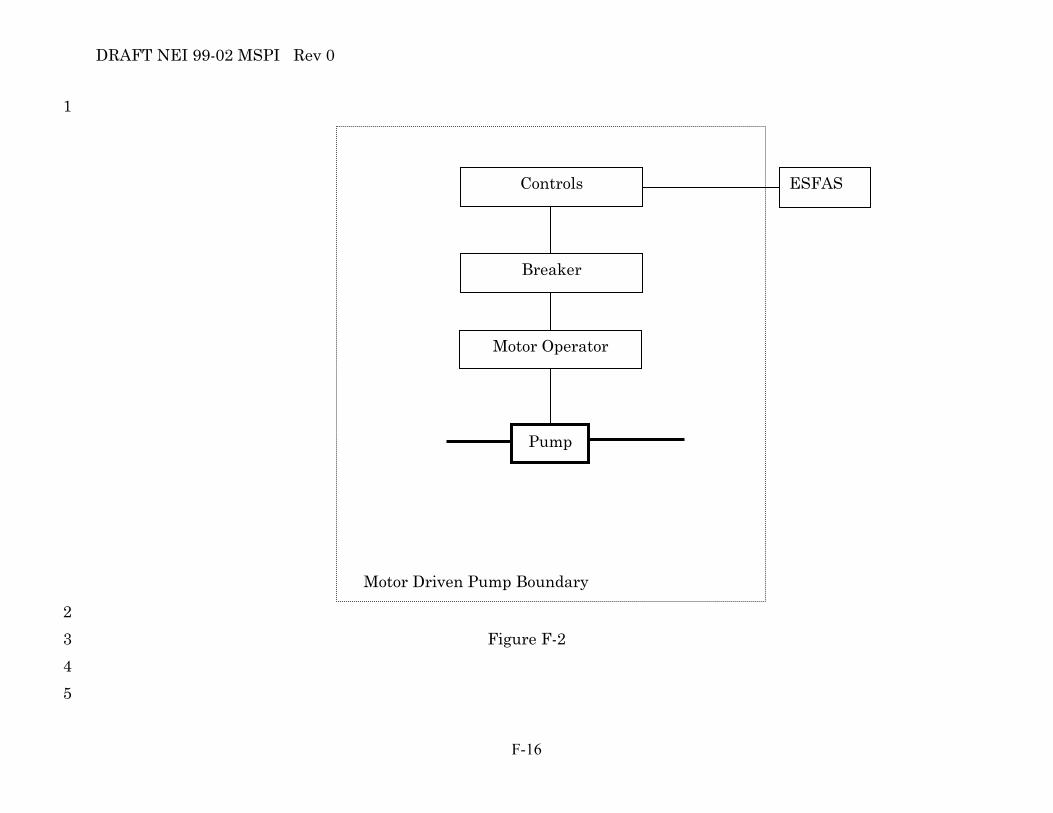
Motor-Driven Pumps
The pump boundary includes the pump body, motor/actuator, lubrication system cooling components of the pump seals, the voltage supply breaker, and its associated local control circuit (coil, auxiliary contacts, wiring and control circuit contacts).
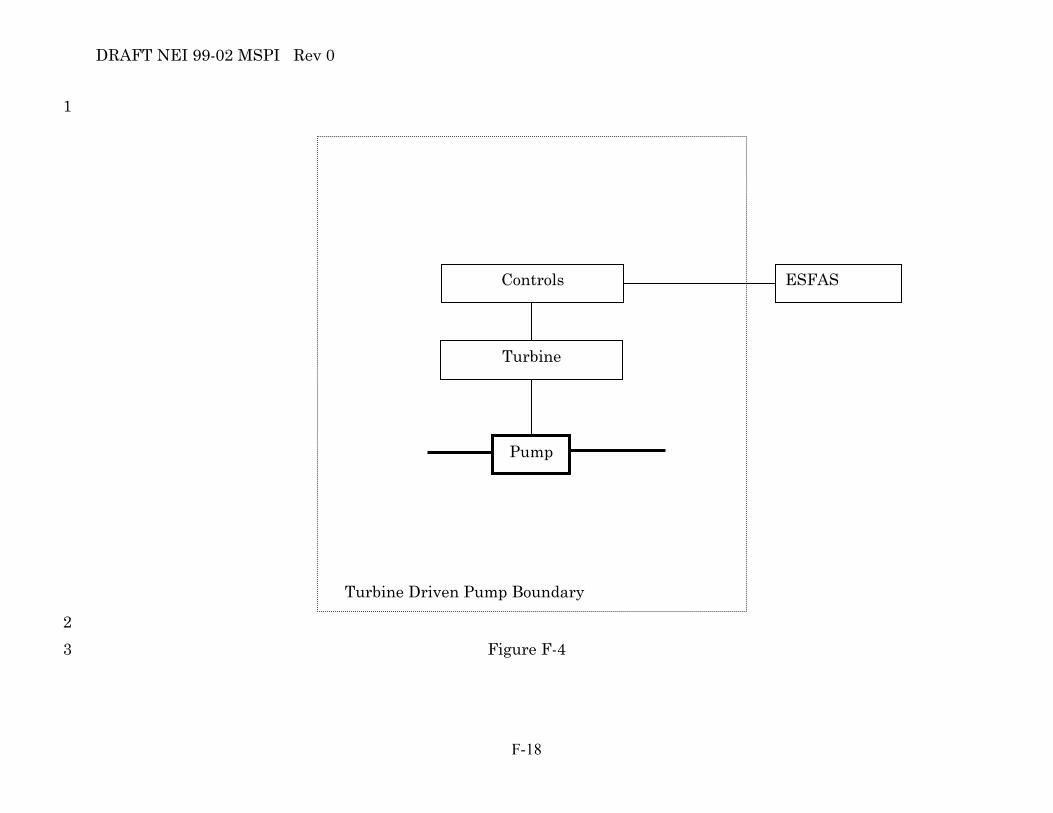
Turbine-Driven Pumps
The turbine-driven pump boundary includes the pump body, turbine/actuator, lubrication system (including pump), extractions, turbo-pump seal, cooling components, and local turbine control system (speed).
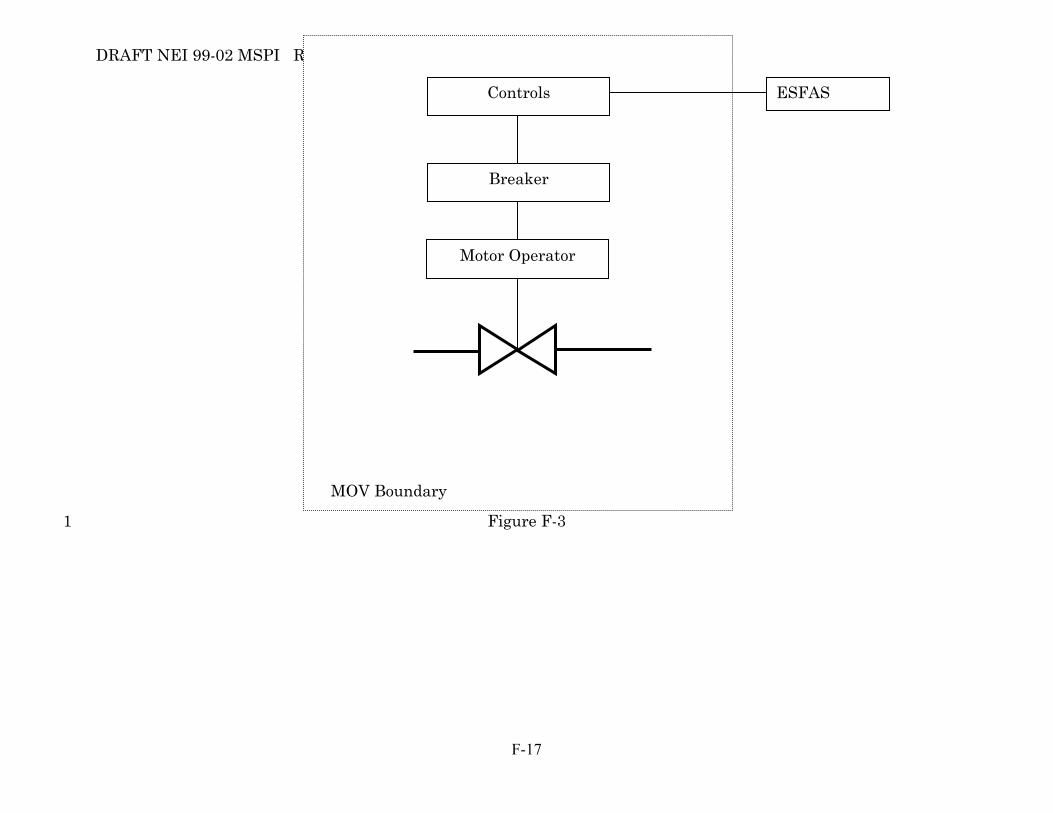
Motor-Operated Valves
The valve boundary inc1udes the valve body, motor/actuator, the voltage supply breaker (both motive and control power) and its associated local open/close circuit (open/close switches, auxiliary and switch contacts, and wiring and switch energization contacts).
Air-Operated Valves
The valve boundary includes the valve body, the air operator, associated solenoid-operated valve, the power supply breaker or fuse for the solenoid valve, and its associated control circuit (open/close switches and local auxiliary and switch contacts).
1
DRAFT NEI 99-02 MSPI Rev 0
F-15
1 2 3 4 5 6 7 8 9 10 11 12 13 14 15 16 17 18 19 20
21 22
Figure F-123
Diesel Engine
Control and Protection System
Starting Air System Receiver
Combustion Air System and Supply
Jacket Water
Fuel Oil System
Fuel Oil Day Tank
Generator
Exciter and Voltage Regulator
Exhaust System
Governor and Control System
Lubrication System
EDG Breaker
ESFAS/Sequencer
DC Power
Cooling Water
Class 1E Bus
EDG Boundary Isol. Valve
Fuel Storage and Transfer System
DRAFT NEI 99-02 MSPI Rev 0
F-16
1
2 Figure F-2 3
4 5
Controls
Breaker
Motor Operator
Motor Driven Pump Boundary
Pump
ESFAS
DRAFT NEI 99-02 MSPI Rev 0
F-17
Figure F-3 1
Controls
Breaker
Motor Operator
MOV Boundary
ESFAS
DRAFT NEI 99-02 MSPI Rev 0
F-18
1
2 Figure F-4 3
Controls
Turbine
Turbine Driven Pump Boundary
Pump
ESFAS
DRAFT NEI 99-02 MSPI Rev 0
F-19
1
TANK
Figure F-5
Active Components
Active Components
Non-active Components
Attachment 3RIS 2002-14, Sup. 1Page 1 of 1
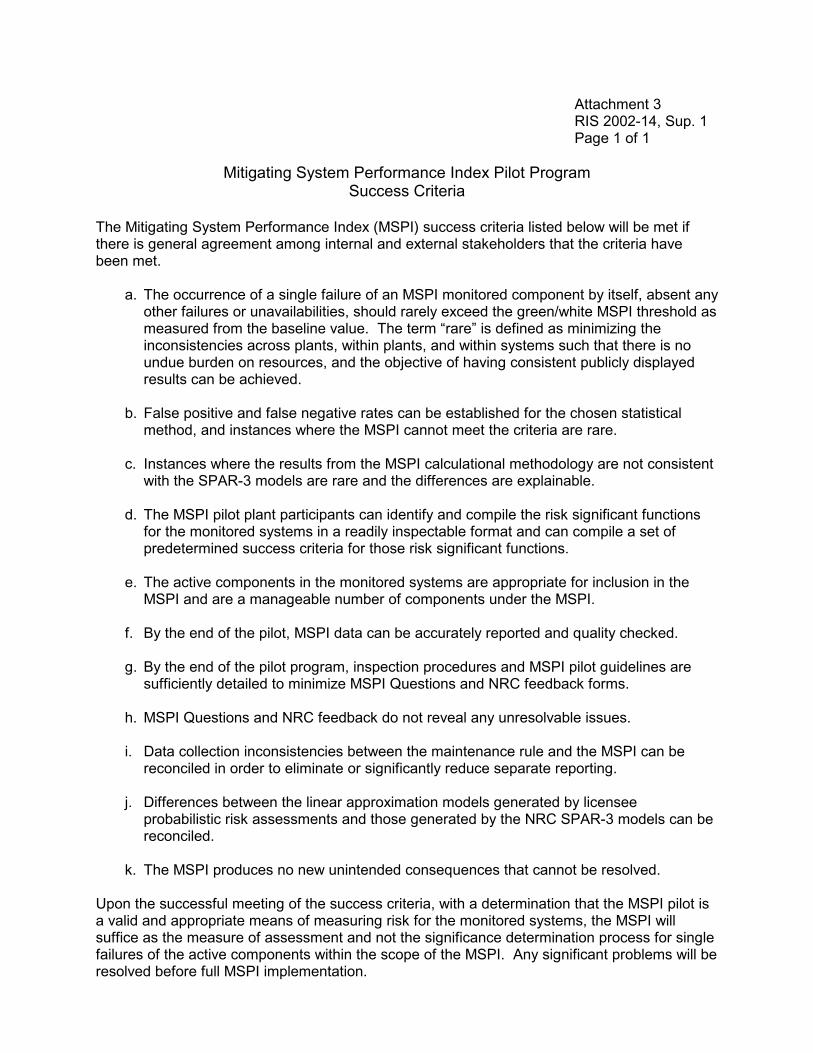
Mitigating System Performance Index Pilot ProgramSuccess Criteria
The Mitigating System Performance Index (MSPI) success criteria listed below will be met ifthere is general agreement among internal and external stakeholders that the criteria havebeen met.
a. The occurrence of a single failure of an MSPI monitored component by itself, absent anyother failures or unavailabilities, should rarely exceed the green/white MSPI threshold asmeasured from the baseline value. The term “rare” is defined as minimizing theinconsistencies across plants, within plants, and within systems such that there is noundue burden on resources, and the objective of having consistent publicly displayedresults can be achieved.
b. False positive and false negative rates can be established for the chosen statisticalmethod, and instances where the MSPI cannot meet the criteria are rare.
c. Instances where the results from the MSPI calculational methodology are not consistentwith the SPAR-3 models are rare and the differences are explainable.
d. The MSPI pilot plant participants can identify and compile the risk significant functionsfor the monitored systems in a readily inspectable format and can compile a set ofpredetermined success criteria for those risk significant functions.
e. The active components in the monitored systems are appropriate for inclusion in theMSPI and are a manageable number of components under the MSPI.
f. By the end of the pilot, MSPI data can be accurately reported and quality checked.
g. By the end of the pilot program, inspection procedures and MSPI pilot guidelines aresufficiently detailed to minimize MSPI Questions and NRC feedback forms.
h. MSPI Questions and NRC feedback do not reveal any unresolvable issues.
i. Data collection inconsistencies between the maintenance rule and the MSPI can bereconciled in order to eliminate or significantly reduce separate reporting.
j. Differences between the linear approximation models generated by licensee probabilistic risk assessments and those generated by the NRC SPAR-3 models can bereconciled.
k. The MSPI produces no new unintended consequences that cannot be resolved.
Upon the successful meeting of the success criteria, with a determination that the MSPI pilot isa valid and appropriate means of measuring risk for the monitored systems, the MSPI willsuffice as the measure of assessment and not the significance determination process for singlefailures of the active components within the scope of the MSPI. Any significant problems will beresolved before full MSPI implementation.