Embed Size (px)
Citation preview

NPR/Robert Wood Johnson Foundation/Harvard School of Public Health
______________________________________________________________
Education and Health in Schools: A Survey of Parents
Summary
September 2013

TABLE OF CONTENTS
PART ONE: EDUCATION
I. Grading the schools ................................................................................................. 1
II. Curriculum ............................................................................................................... 1
III. Career preparation ............................................................................................... 2
IV. Common core .......................................................................................................... 4
V. Values ......................................................................................................................... 4
VI. School security ....................................................................................................... 5
VII. Biggest problem .................................................................................................... 7
PART TWO: HEALTH IN SCHOOLS
VIII. Physical activity .................................................................................................. 8
IX. Stress ........................................................................................................................ 9
X. School start time ...................................................................................................... 10
XI. School lunch ............................................................................................................ 10

1
Education and Health in Schools
The survey was conducted August 6-September 8, 2013. The survey sample consisted of 1,368
adults who said they were one of the people in the household most knowledgeable about the
education of a randomly-chosen child in the household who attended a public or public charter
school in grades K-12 during the school year ending in May or June 2013. In this report, we refer
to this group of respondents as “parents” because 87% of respondents were parents or stepparents
of the child, but the total group also includes grandparents and other relatives who say they are
one of the people in the household most knowledgeable about the child’s education. All differences
noted in the text are statistically significant.
PART ONE: EDUCATION
I. GRADING THE SCHOOLS
Most parents give schools high grades; African Americans less likely to do so.
Despite the concerns of many experts about the performance of American schools, most parents
rate their schools highly. When asked to grade the school the child attends, a strong majority of
parents (82%) give the school an A (41%) or a B (41%). About one in six (17%) give the school a C
(14%), D (2%) or F (1%) rating. These results are very similar to other recent polls. One-third of
African Americans (33%) give a C, D or F rating to their child’s school, significantly more than
whites (15%) or Hispanics (14%). Surprisingly, there is no significant difference between the
proportion of lower income and upper income parents who give A or B to their child’s school.
II. CURRICULUM
Fewer parents say key curriculum topics getting too little emphasis than eight years ago,
but some still see important areas neglected.
In 2005 Gallup* asked parents to say whether their child’s school was giving too little, too much or
just the right amount of emphasis to a number of key curriculum areas. The current survey asked
the same question and found that in four areas, parents were less likely to say that the schools
were giving too little emphasis than eight years ago. The greatest change was seen in math,
where nearly a third (31%) said the school gave too little emphasis in 2005, while less than half
that (15%) say so today. Significant changes are also seen in physical education (35% in 2005, 25%
in 2013), science (31% in 2005, 23% in 2013), and preparing for standardized tests (24% in 2005,
11% in 2013). In only one area asked about in both surveys – arts and music – does the proportion
of parents saying too little emphasis remain virtually unchanged (32% in 2005, 28% in 2013).
In the current survey, more than one in five say their child’s school gives too little emphasis in four
areas: arts and music (28%), physical education (25%), technology and computers (24%), and
science (23%). One in five (20%) say the school puts too much emphasis on preparing for state
standardized tests.
* Gallup poll, August 8-11, 2005.

2
Parents’ perceptions about
whether schools are giving
appropriate emphasis to different
areas vary by the grade level of
their child. About three in ten
(29%) parents with children in
grades K-5 say the school does not
give enough emphasis to science,
significantly more than those with
children in grades 6-8 (15%) or 9-
12 (18%). About one in six
respondents with children in
grades 6-8 (16%) and 9-12 (19%)
say the school puts too little
emphasis on English, reading and
writing, compared to fewer than
one in ten (9%) of parents of K-5
students who say so.
Parents who give the school a C, D or F rating are more likely than those who give the school an A
or B to say that it gives too little emphasis across all aspects of the curriculum. Parents who give
their school a low grade are equally likely to say that the school gives too much (27%) or too little
(27%) emphasis to standardized test preparation. Only about four in ten (39%) of these parents
say that the school gives the right amount of emphasis to standardized test preparation,
significantly lower than two-thirds (67%) who say so among parents who give their school a A or B
grade overall.
In addition, white parents were more likely than African American or Hispanic parents to say that
schools put too much emphasis on test preparation (24% versus 15% and 16%).
III. CAREER PREPARATION
Many parents think schools not preparing students who will not attend college for
workforce.
About four in ten (42%) think their child’s school does not prepare students who choose not to go to
college to enter the workforce. Parents were more likely to say this if their child was a girl (49%)
than a boy (37%). They are less likely to say this if their child attended an
agricultural/vocational/technical school (26%) than other high schools (45%).Compared to the
number of parents saying the school does not prepare students to enter the workforce immediately
following high school, only half as many parents (21%) think the school their child attended does
not sufficiently prepare students for college.
Areas of Curriculum That Parents Say Get Too Little
Emphasis from Child’s School
Total
Student
grade level
K-5
Student
grade level
6-8
Student
grade level
9-12
School
grade A-B
School
grade C-F
Arts/music 28% 25% 30% 31% 26% 35%
PhysEd 25% 22% 26% 29% 23% 34%
Computers/tech 24% 23% 23% 26% 21% 36%
Science 23% 29% 15% 18% 19% 40%
Math 15% 15% 12% 17% 10% 37%English/reading/
writing14% 9% 16% 19% 9% 33%
Test prep 11% 12% 10% 11% 8% 27%
NPR/Robert Wood Johnson Foundation/Harvard School of Public Health, Education and Health in Schools poll, August 6-September 8, 2013.

3
Some see failure to prepare students for future careers.
The survey asked parents of
students in grade 9-12 whether
their child’s school was
sufficiently preparing that child
for their future career in a
number of ways. About three in
ten parents do not think the
school is preparing their child
sufficiently when it comes to
professional conduct and work
ethic (31%), foreign languages
(30%), and choosing areas of
study that would lead to a good
job (29%). About a quarter think
the school is not sufficiently
preparing their child when it
comes to presentation and
speaking skills (27%), computer
and technical skills (25%), and writing and research skills (24%). Just under one in five (19%) say
the schools are not giving sufficient preparation in science and math.
Parents who give schools poor grades much more likely to see failures to prepare
students.
Parents who gave their child’s school a C, D or F grade are more likely to say the school is not
preparing students for future careers in every way mentioned than parents who give the school an
A or B. A majority of parents (60%) who give low grades say that the schools are not preparing
students sufficiently when it comes to choosing areas of study that will lead to a good job,
compared to one in five (21%) of parents who give their child’s school an A or B. A similar number
(55%) of parents who give a C, D or F rating to the school say the school fails to sufficiently
prepare students in science and math, much higher than the one in ten (10%) of high-grading
parents who do so. A majority (54%) of parents giving a C, D, or F grade also say their child’s
school fails to sufficiently prepare students in professional conduct and work ethic, compared to a
quarter (25%) of parents who give their schools high grades.
Majority of students plan to go to college, but differences by sex.
When parents of students in grades 9-12 are asked about their child’s plans for after high school,
nearly two-thirds (63%) say their child will attend a four-year college. About one in seven (14%)
said they will go to a two-year college, and fewer than one in ten say they will enter a technical
training program (7%), get a job (5%), or join the military (4%). Parents of girls are more likely to
say their child would be going to a four year college (69%) than parents of boys (55%).
Parents’ Views on Whether School Is Sufficiently
Preparing Students for Future Careers
31%
30%
29%
27%
25%
24%
19%
25%
26%
21%
23%
19%
19%
10%
54%
45%
60%
46%
46%
46%
55%
Total School grade A-B School grade C-F
% of parents of child grade 9-12 saying child’s school is NOT sufficiently preparing
NPR/Robert Wood Johnson Foundation/Harvard School of Public Health, Education and Health in Schools poll, August 6-September 8, 2013.
Professional conduct
and work ethic
Foreign languages
Choosing areas of
study that will lead to
a good job
Presentation and
speaking skills
Computer and
technology skills
Writing and
research skills
Science and math

4
IV. COMMON CORE
Large numbers unaware of new common core standards; African Americans and
Hispanics more optimistic about potential effect.
The survey asked parents about their awareness of the “Common Core”, a set of standards that is
being adopted in many states for what students in all schools need to learn in each grade. About
four in ten (42%) parents report having heard nothing at all about the Common Core. Just under
six in ten (57%) have heard about the Common Core, including about a quarter (23%) saying they
have heard a lot. One-third (33%) say their child’s school has adopted the standards. The majority
of these (88%) are very or somewhat confident that the school will be able to implement the
Common Core standards successfully.
Among those who say the school has adopted the Common Core, almost half (47%) say the
standards will improve education at the school, while fewer than one in ten (7%) say it will worsen
education. About four in ten (38%) think the standards won’t make much difference. About two-
thirds of African Americans (68%) and Hispanics (66%) think the Common Core standards will
improve education in their child’s school, significantly more than the proportion of whites who
think so (38%).
V. VALUES
Belief that school values differ from those taught at home varies by race and overall
assessment of school.
About a quarter (24%) of parents say the values taught by their child’s school are dissimilar to
those taught at home, while about three-quarters (73%) of parents say their child’s school teaches
values very or somewhat like those they teach at home. This perception varies significantly by
race. About four in ten (42%) African American parents say their child’s school teaches values
dissimilar to the ones taught at home, significantly more than white (21%) or Hispanic (22%)
parents who say so. In addition, half (50%) of parents who give their school a C, D or F grade say
the school teaches dissimilar values, while only one in five (19%) of those who give their child’s
school an A or B grade say so.

5
VI. SCHOOL SECURITY
Parents report more high schools taking certain security precautions now than in 1999.
An ABC News/Washington Post poll
conducted in 1999 shortly after the
Columbine shootings asked parents
of high school students about six
steps their child’s school might take
to prevent violence there. In four
areas – trying to identify troubled
students, having police officers or
armed security guards, conducted
random searches of students
themselves, and using metal
detectors – the current poll finds
more parents of students in grades
9-12 reporting that their child’s
school does these things to prevent
violence. In the two other areas –
providing effective counseling and
conducting random searches of
student lockers – the proportion of parents saying their child’s school does this remains nearly
unchanged.
Majorities of parents in the current survey report that their child’s school requires visitors to be
checked in by a school official (87%), offers effective counseling and other assistance to troubled
students (76%), and tries to identify
students who may be prone to
violence (60%). Smaller numbers
report that the schools have police
officers or armed security guards on
patrol (50%), conducting random
searches of students’ lockers (30%)
and conduct random searches of
students themselves (21%). Just
under one in ten (9%) reports that
their child’s school uses metal
detectors at school entrances.
Parents of students in grades 9-12
were much more likely than
parents of children in lower grades
to report schools taking a number of
these steps to prevent violence.
NPR/Robert Wood Johnson Foundation/Harvard School of Public Health, Education and Health in Schools poll, August 6-September 8, 2013.
Steps Taken By Child’s School to Prevent Violence,
by Student Grade Level
2013 2013 2013 Grades K-5 Grades 6-8 Grades 9-12
Require all visitors to be checked in 88% 87% 85%
Offer effective counseling to troubled
students73% 81% 79%
Try to identify troubled students who
may be prone to violence57% 62% 64%
Have police officers or armed security
guards on patrol32% 62% 70%
Conduct random searches of students'
lockers15% 37% 47%
Conduct random searches of students
themselves13% 23% 31%
Use metal detectors at school
entrances7% 9% 12%
70%
64%
31%
12%
50%
56%
21%
5%
2013 1999
Try to identify troubled students
who may be prone to violence
Have police officers or armed
security guards
Steps Taken By High Schools to Prevent Violence,
2013 and 1999
Use metal detectors
Conduct random searches of
students themselves
NPR/Robert Wood Johnson Foundation/Harvard School of Public Health, Education and Health in Schools poll, August 6-September 8, 2013.
ABC News/Washington Post poll, April 22-25, 1999.
% of parents saying their grade 9-12 child’s school does each of the following

6
When asked to rate the overall
safety of their child’s school,
almost three-quarters of parents
(72%) say that the school their
child attended is extremely or
very safe, while just over a
quarter (27%) say it is somewhat,
not very or not at all safe. About
one in five (19%) say that the
level of security is too low.
Almost six in ten (57%) of parents
who give their child’s school an
overall grade of C, D or F say
that their child’s school
somewhat/not very/not at all,
much more than the one-fifth
(21%) of parents who give their
school a high overall grade who
say so. Four in ten African
American parents (40%) say their child’s school is somewhat/not very/not at all safe, more than
about one in four white parents (23%) who do. About eight in ten (81%) parents in households with
incomes of $75,000/year or more say their child’s school is extremely/very safe, significantly more
than the number of parents with households incomes under $25,000/year who say so (65%).
Those parents who rate their child’s school as extremely/very safe are more likely than parents
who rate their child’s school as somewhat/not too/not at all safe to report that the school requires
visitors to be checked in (89% versus 80%), offers effective counseling to troubled students (82%
versus 63%) and tries to identify troubled students who may be prone to violence (66% versus
45%). Parents who rate their child’s school as extremely/very safe were statistically no more likely
than parents who rate the safety of their child’s school lower to say that the school had taken other
steps to prevent violence, including having police or security guards, conducting random search of
student’s locker or students themselves, or using metal detectors.
Majorities of parents with kids in K-8 saw school security increase after Newtown, CT
shootings.
Although parents of children in high school reported more security precautions taken by their
child’s school than parents of children in grades K-8, parents of children in the lower grade levels
were more likely to report that school security had increased after the shooting in Newtown, CT
last year. About six in ten parents of children in grades K-5 (62%) and 6-8 (57%) report their
child’s school increased security precautions after the shooting last winter, more than the four in
ten (41%) parents of students in grades 9-12 who say their child’s school did so.
Some report safety issues in traveling to and from school.
In addition, a quarter (25%) of parents say their child is somewhat safe from crime and violence
while travelling to and from school, and fewer than one in twenty (4%) say their child is not too or
not at all safe, while seven in ten (70%) parents say their child is very safe. Similarly, almost three
in ten (27%) report that, when it comes to traffic, cars, lighting and other issues, their child is
89%
82%
66%
52%
30%
21%
10%
80%
63%
45%
46%
31%
20%
7%
Extremely/very safe
Somewhat/not too/not at all safe
Require all visitors to be checked in
Offer effective counseling to
troubled students
Try to identify troubled students
who may be prone to violence
Have police officers or armed
security guards
Steps Taken By Child’s School to Prevent Violence, by
Rating of School Safety
Use metal detectors
Conduct random searches of
students’ lockers
Conduct random searches of
students themselves
NPR/Robert Wood Johnson Foundation/Harvard School of Public Health, Education and Health in Schools poll, August 6-September 8, 2013.

7
somewhat safe travelling to and from school, and fewer than one in twenty say not too/not at all
safe (4%). About seven in ten (69%) say their child is very safe when it comes to cars, traffic,
lighting and other safety issues.
VII. BIGGEST PROBLEM
No consensus among parents about biggest school problem.
When parents are asked to describe in their own words the biggest problem in their child’s school,
no clear consensus emerges about which problem is the biggest. The top four problems, none of
which were mentioned by more than one in ten parents, were problems with teachers (10%), lack
of attention to individual students (9%), student behavior (8%), and problems with the school
administration (7%). The lack of agreement among parents on a single identifiable problem in the
schools may make education reforms difficult to implement at the school and district level. Among
those who gave their school a C, D or F grade, the top problems were problems with teachers (18%)
and administration (13%).

8
PART TWO: HEALTH IN SCHOOLS
VIII. PHYSICAL ACTIVITY
Significant numbers of parents give low grades to schools on supporting physical
activity.
When asked to grade their child’s
school on various ways in which
it supports physical activity,
about three in ten parents (28%)
gave their child’s school a C, D or
F grade on providing enough
time for physical education. Just
over four in ten (44%) gave their
child’s school a C, D, or F grade
on encouraging students to walk
or bike to school by providing
things like bike racks and
crossing guards or offering
incentive to students who walk
or bike. Just under three in ten
(18%) gave low grades to their
child’s school on providing
quality facilities for physical
exercise, like playgrounds, ball
fields or basketball courts. Parents of students in grades 9-12 were more likely to give low grades
on all three measures than parents of students in grades K-5.
Many parents report children not getting daily physical education.
CDC guidelines† suggest that school should provide daily physical education instruction to
students, but the survey finds just over a quarter of parents report their child meeting that
standard. About half of parents (49%) report that their child took physical education three days
(20%), four days (2%) or five days a week (27%), while just under half (46%) report their child has
physical education just two days (24%) or one day (15%) a week, or does not take physical
education at all (7%). About one in five (19%) report their child’s physical education classes were a
half-hour long or less, while half (50%) report PE was approximately forty-five minutes. Just over
a quarter (27%) say the class was an hour or more.
CDC guidelines also recommend that students in grades K-5 get 150 minutes of physical education
each week. Survey results indicate that many students are not getting this amount of physical
education. More than half of parents of students in grades K-5 report just one or two days of
physical education per week (56%), while less than one in five report daily physical education.
† Centers for Disease Control and Prevention, School Health Guidelines to Promote Healthy Eating and
Physical Activity, January 2013. http://www.cdc.gov/healthyyouth/npao/strategies.htm.
Parents Grades of Measures of School Support of
Physical Activity, By Student Grade Level
39%
24%
14%
43%
29%
20%
51%
33%
21%
K-5 6-8 9-12
% of parents giving schools a C, D or F grade for each
Encouraging
students to walk
or bike to school
Providing
enough time for
physical
exercise
Providing quality
facilities for
physical
exercise
NPR/Robert Wood Johnson Foundation/Harvard School of Public Health, Education and Health in Schools poll, August 6-September 8, 2013.

9
About one in three parents of
students in the lowest grade levels
report that physical education
classes were a half-hour or less
(29%).
The total recommended amount of
physical education for older
students is greater: 225 minutes a
week. Therefore, though parents of
students in grades 6-8 and 9-12 are
more likely to report their child
having longer and more frequent
physical education classes than in
lower grades, many of these
students are still not getting the
recommended amount of physical
education. Parents of students in
grades 9-12 were also more likely to report their child does not take physical education at all (18%)
than parents of children in K-5 (2%) or 6-8 (3%).
Most recess still free time, and some students are going without.
Some public health experts have suggested that offering structured games at recess could increase
physical activity, while others suggest free play time is more developmentally appropriate. One in
five (20%) parents of students in grades K-8 report that most of the time school offered structured
games and physical activity at recess, while two-thirds (67%) report that recess was free time for
children to play as they wish. About one in twelve (8%) don’t have recess at all. Suburban parents
are more likely to report no recess (15%) than urban parents (5%) or rural parents (4%).
In addition, about a third (32%) of parents report that the fields, playgrounds and other facilities
at their child’s school are only occasionally or never available for student use after school hours.
IX. STRESS
About a third of students experienced a lot of stress from something school-related.
The survey asked parents whether their child had had stress over the last school year from a
variety of potentially stressful school experiences. About a third (31%) say their child had
experienced a lot of stress from at least one of these. Nearly four in ten parents (38%) with
children in grades 9-12, and over a third (36%) of parents of children in grades 6-8 say their child
experienced a lot of stress. Just over one in five (22%) parents of children in grades K-5 reported
that their child had had a lot of stress, significantly less than the parents of children in higher
grades. Homework was the leading source of stress, with 16% of parents saying their child had
Amount of Physical Education Child Receives,
By Student Grade Level
2%
56%
18%
18%
29%
47%
19%
3%
29%
29%
35%
13%
57%
28%
18%
20%
16%
40%
5%
51%
41%
No PE
1 or 2 days/wk
3 days/wk
4 or 5 days/wk
1/2 hr or less
Approx 45 min
1 hr or more
K-5 6-8 9-12
NPR/Robert Wood Johnson Foundation/Harvard School of Public Health, Education and Health in Schools poll, August 6-September 8, 2013.
10
experienced a lot of stress from the quantity of homework they needed to do. About one in four
parents (24%) of high-school students say that homework caused their child a lot of stress.
IX. SCHOOL START TIME
One-third of parents report school start time before 8 AM.
A third (33%) of parents of
students in grades 1-12 report
that their child’s school day
starts before 8 AM. Research
suggests that early school start
times are in conflict with sleep
needs of adolescents.‡ Half (50%) of
parents of students in grades 9-
12 report a school start time
before 8 AM, with almost one in
five (18%) reporting a start time
before 7:30. These numbers are
significantly higher than the
number of parents of students in
grades 1-8 reporting early start
times.
X. SCHOOL LUNCH
Lunch hour? Not quite.
One in seven (14%) parents report their child is given fifteen minutes or less to eat lunch. The
American Academy of Pediatrics§ recommends that students be allotted no less than 20 minutes to
eat their lunch from the time they are seated with their meals. The majority of parents (64%) say
their child is given between 16 and 30 minutes for lunch. One in five (20%) parents of students in
grades K-5 say their child only gets fifteen minutes or less to eat, significantly more than parents
of children in grades 6-8 (13%) or 9-12 (7%) who say so.
‡ Wahlstrom, K. (January 01, 2002). Changing times: findings from the first longitudinal study of later high
school start times. NASSP [National Association of Secondary School Principals] Bulletin, 86, 633, 3-21. § National Association of School Nurses (U.S.), & American Academy of Pediatrics. (2005). Health, mental
health, and safety guidelines for schools. Scarborough, Me.: National Association of School Nurses.
School Start Time, By Student Grade Level
18%
46%
36%
32%
47%
19%
50%
34%
14%
Before 8 AM
8 AM-before8:30 AM
8:30 AM orlater
1-5 6-8 9-12
% of parents saying school starts for their child
NPR/Robert Wood Johnson Foundation/Harvard School of Public Health, Education and Health in Schools poll, August 6-September 8, 2013.

11
Parents report mix of healthy and unhealthy foods available for most students.
While a large majority (72%) of
parents report that they think the
school lunch available in their
child’s school is very or somewhat
healthy, one in five (20%) say
school lunch is very or somewhat
unhealthy. Most parents (78%)
report that fresh fruits and
vegetables are usually available at
school during the lunch hour.
Around half of parents say healthy
proteins like grilled chicken breast
or fish (55%), whole grains like
brown rice or whole wheat bread
(53%), fried foods like French fries
or fried chicken (48%) and cookies,
cake or other pastries (47%) are
available. Around one in five
reports that sugared soda (23%) or
candy (17%) are available to students. Similarly, about one in five (21%) report that their child’s
school has vending machines that sold unhealthy foods. One in ten (10%) parents say their child’s
school offers foods from fast-food chains in the cafeteria. Parents of students in higher grade levels
were more likely to report schools
having unhealthy foods available
in these ways than parents of
children in lower grades.
Vending Machines and Fast Food Chains,
by Student Grade Level
7%
4%
25%
15%
40%
16%
K-5 6-8 9-12
% of parents saying their child’s school…
Sells unhealthy
food in vending
machines
Offers food from
fast-food chains
in cafeteria
NPR/Robert Wood Johnson Foundation/Harvard School of Public Health, Education and Health in Schools poll, August 6-September 8, 2013.
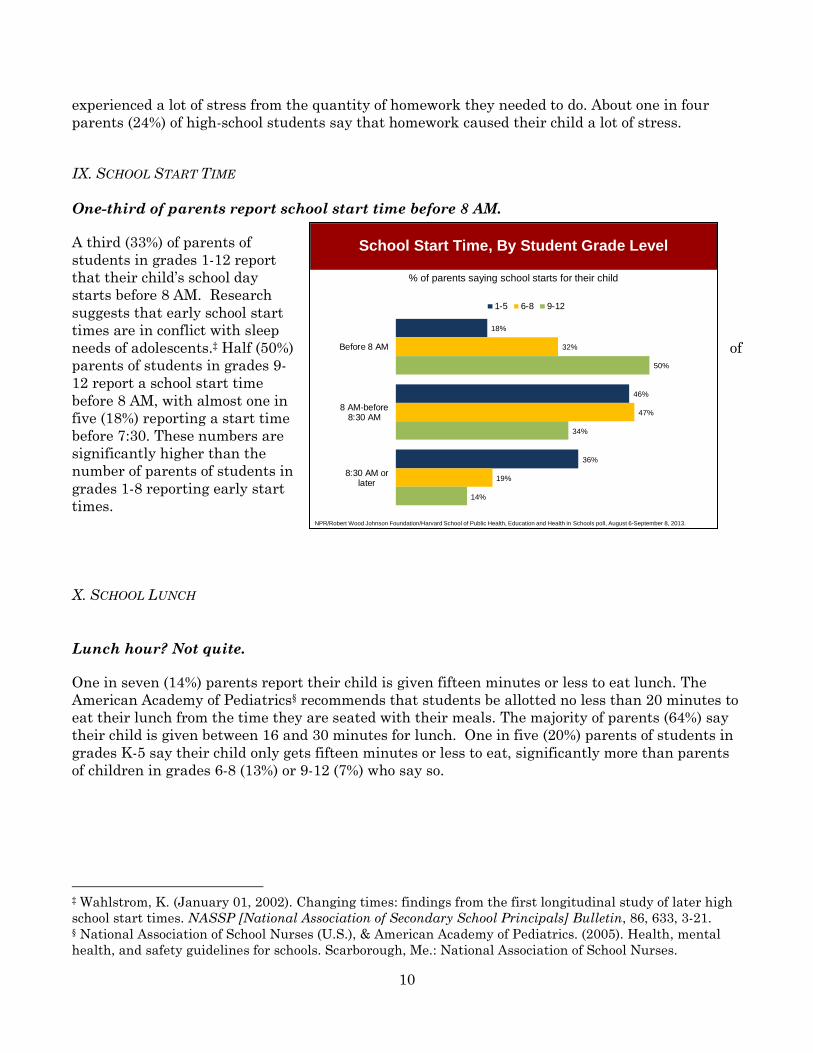
12
n=
Respondent race/ethnicity
White Non-Hispanic 932
Black Non-Hispanic 144
Hispanic 193
Grade in school
K-5 590
6-8 301
9-12 477
School rating
A-B 1145
C-F 217
Child gender, grades 9-12 only
Male 245
Female 229
School type, grades 9-12 only
Agricultural/vocational/technical 64
Other regular 404
School rating, grades 9-12 only
A-B 382
C-F 91
Respondent race/ethnicity, among those who
have heard of common core and say it is being
implemented in their child’s school
White Non-Hispanic 324
Black Non-Hispanic 50
Hispanic 58
School security
Extremely/very safe 1019
Somewhat/not very/not at all safe 344
Household income
<$25K 211
$25-49.9K 275
$50-74.9K 209
$75K+ 574
School location, grades K-8 only
Urban 184
Suburban 313
Small town 279
Rural 106

13
Methodology
This poll is part of an on-going series of surveys developed by researchers at the Harvard Opinion
Research Program (HORP) at the Harvard School of Public Health in partnership with the Robert
Wood Johnson Foundation and NPR. The research team consists of the following members at each
institution.
Harvard School of Public Health: Robert J. Blendon, Professor of Health Policy and Political
Analysis and Executive Director of HORP; John M. Benson, Research Scientist and Managing
Director of HORP; Kathleen J. Weldon, Research and Administrative Manager.
Robert Wood Johnson Foundation: Fred Mann, Associate Vice President, Communications;
Carolyn Miller, Senior Program Officer, Research and Evaluation; and Ari Kramer,
Communications Officer.
NPR: Anne Gudenkauf, Senior Supervising Editor, Science Desk; Joe Neel, Deputy Senior
Supervising Editor, Science Desk; Vickie Walton-James, Deputy Senior Supervising Editor,
National Desk; Matt Thompson, Editorial Product Manager.
Interviews were conducted via telephone (including both landline and cell phone) by SSRS of
Media (PA), August 6 – September 8, 2013, among a nationally representative sample of 1368
adults who said they were one of the people in their household most knowledgeable about the
education of the children in the household who attended a public school or public charter school in
grades K-12 during the school year ending in May or June 2013. The interviews were conducted in
English and Spanish. The margin of error for total respondents is +/-3.5 percentage points at the
95% confidence level.
Possible sources of non-sampling error include non-response bias, as well as question wording and
ordering effects. Non-response in telephone surveys produces some known biases in survey-derived
estimates because participation tends to vary for different subgroups of the population. To
compensate for these known biases and for variations in probability of selection, sample data are
weighted by landline/cellphone use, homeownership, Census region, number of adults in the
household, the demographics of a randomly-selected child who attended a public school or public
charter school in grades K-12 during the school year ending in May or June 2013 (sex, age, grade
in school, and race/ethnicity), and the number of such children in the household. Other techniques,
including random-digit dialing and replicate subsamples are used to ensure that the sample is
representative.

14
NPR is an award-winning, multimedia news organization and an influential force in American life.
In collaboration with more than 900 independent public radio stations nationwide, NPR strives to
create a more informed public – one challenged and invigorated by a deeper understanding and
appreciation of events, ideas and cultures. NPR reaches a growing audience of 27 million listeners
weekly; to find local stations and broadcast times for NPR programs, visit www.npr.org/stations
The Robert Wood Johnson Foundation focuses on the pressing health and healthcare issues facing
our country. As the nation’s largest philanthropy devoted exclusively to health and health care, the
Foundation works with a diverse group of organizations and individuals to identify solutions and
achieve comprehensive, measurable, and timely change. For more than 40 years the Foundation has
brought experience, commitment, and a rigorous, balanced approach to the problems that affect the
health and healthcare of those it serves. When it comes to helping Americans lead healthier lives
and get the care they need, the Foundation expects to make a difference in your lifetime. Follow the
Foundation on Twitter at www.rwjf.org/twitter<https://twitter.com/RWJF> or Facebook at
www.rwjf.org/facebook<https://www.facebook.com/RobertWoodJohnsonFoundation>.
Harvard School of Public Health is dedicated to advancing the public’s health through learning,
discovery and communication. More than 400 faculty members are engaged in teaching and
training the 1,000-plus student body in a broad spectrum of disciplines crucial to the health and
well-being of individuals and populations around the world. Programs and projects range from the
molecular biology of AIDS vaccines to the epidemiology of cancer; from risk analysis to violence
prevention; from maternal and children’s health to quality of care measurement; from health care
management to international health and human rights. For more information on the school, visit
www.hsph.harvard.edu.
1
NATIONAL PUBLIC RADIO/ROBERT WOOD JOHNSON FOUNDATION/
HARVARD SCHOOL OF PUBLIC HEALTH
EDUCATION AND HEALTH IN SCHOOLS POLL
Overall Results
This survey was conducted for National Public Radio, the Robert Wood Johnson Foundation,
and the Harvard School of Public Health via telephone by SSRS, an independent research
company. Interviews were conducted from August 6 – September 8, 2013, among a nationally
representative sample of 1,368 adults who said they were one of the people in their household
most knowledgeable about the education of the children in the household who attended a public
school or public charter school in grades K-12 during the school year ending in May or June
2013. The margin of error for total respondents is +/- 3.5 percentage points at the 95%
confidence level.
[TCHILDNAME] indicates the randomly-chosen child from the respondent’s household.
Table of Contents Page
I. Overall Assessments 2
II. School and Home 6
III. Common Core 7
IV. Career Preparation 8
V. Food at School 11
VI. Physical Activity 14
VII. School Security 15
VIII. School Commute and Safety 17
IX. Stress 19
X. School Hours 21
XI. Characteristics of Child’s School 23
XII. Demographics 24

2
I. OVERALL ASSESSMENTS Now I would like to ask you some questions about the school [TCHILDNAME] attended for the school year that ended in May or June of 2013. Q5. Using the A, B, C, D, and F scale like they do in schools, where A is excellent, B is good, C is
fair, D is poor and F is failing, what grade would you give the school [TCHILDNAME] attended?
A B C D F Don’t know/
Refused 41 41 14 2 1 1
Q6. What was the biggest problem in the school [TCHILDNAME] attended? (OPEN-ENDED)
Teacher-related (NET) 10
Teacher(s) are not good 5
Teacher turnover/temporary teachers *
Some good and some bad teachers/inconsistency in quality of teachers
1
Other teachers mentions 2
Lack of communication between teachers and the parents/students
2
Lack of attention to student/individual needs (NET) 9
Teacher to student ratio/too many students per teacher/class size too big
5
Lack of individual help/personal attention for students/one-on-one time
1
Lack of support/lack of help if falling behind/for kid's needs/special needs
1
Not being put in classes for his educational level 1
Other lack of student attention/individual needs mentions 1
Student behavior related (NET) 8
Bullying 3
Drugs *
Fights 1
Behavior issues of some students (general) 1
Discipline 1
Other student behavior related mentions 2
Administration-related (NET) 7
Principal is not good 1
The administration/administrators are not good 1
Lack of communication between school/staff and the 3

3
parents/students (general)
Not well organized (general) 1
Other administration/staff related mentions 1
Curriculum-related (NET) 5
Lack of faster paced/advanced/AP classes 1
Lack of variety of classes *
Poor language arts curriculum mentions *
Curriculum not strong/challenging enough 1
Standardized tests/too much emphasis on standardized tests 1
Not enough homework *
The academics/curriculum (non-specific) 1
Poor math curriculum *
Other curriculum related mentions 1
Funding (NET) 5
Lack of funding for book/supplies 1
Budget/funding/budget cuts (general) 3
Other funding mentions 1
General lack of learning (NET) 3
Children passing without understanding/learning 1
Poor quality education (general) 1
Other quality of education mentions 1
Facility-related (NET) 3
Facilities (old/built poorly/under construction/etc.) 2
Lack of parking *
Other facility related mentions 1
Overcrowding (NET) 3
Overcrowding 2
Too many kids (general) 1
Student population (NET) 2
Lack of diversity 1
Diversity/a lot of diversity *
Who is assigned to this school/the way the districts are zoned
*
Language issues of students (ESL students/language barriers/etc.)
1
Other student population mentions *
Transportation/location/traffic issues (NET) 2
Transportation/bus issues (lack of/not close enough to home/etc.)
1
Traffic issues (congestion/control/kids crossing street/etc.) 1
Location (too far from home/etc.) *
Program Related (NET) 1
Not enough/no physical education/exercise *
Sports/extracurricular activities *
Lack of programs to participate in (general) 1
Other program related mentions *
4
School security 1
Unhappy with the school lunches 1
Rules are too strict 1
Too much homework 1
Lack of counseling/good counseling *
Low test scores/ranking low in state for test scores *
Start time/end time *
Racism/discrimination *
Other 4
None/no problems 25
Don’t know/Refused 9
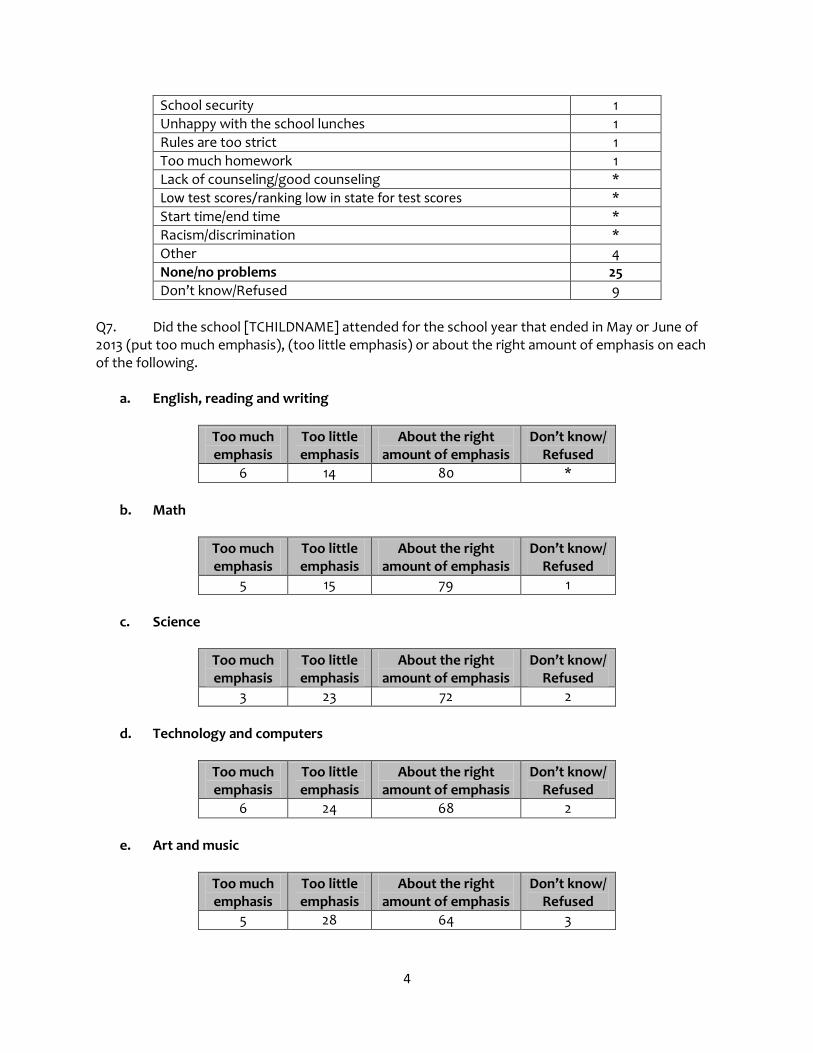
Q7. Did the school [TCHILDNAME] attended for the school year that ended in May or June of 2013 (put too much emphasis), (too little emphasis) or about the right amount of emphasis on each of the following.
a. English, reading and writing
Too much emphasis
Too little emphasis
About the right amount of emphasis
Don’t know/ Refused
6 14 80 *
b. Math
Too much emphasis
Too little emphasis
About the right amount of emphasis
Don’t know/ Refused
5 15 79 1
c. Science
Too much emphasis
Too little emphasis
About the right amount of emphasis
Don’t know/ Refused
3 23 72 2
d. Technology and computers
Too much emphasis
Too little emphasis
About the right amount of emphasis
Don’t know/ Refused
6 24 68 2
e. Art and music
Too much emphasis
Too little emphasis
About the right amount of emphasis
Don’t know/ Refused
5 28 64 3

5
f. Physical education
Too much emphasis
Too little emphasis
About the right amount of emphasis
Don’t know/ Refused
5 25 69 1
g. Preparing for state standardized tests
Too much emphasis
Too little emphasis
About the right amount of emphasis
Don’t know/ Refused
20 11 62 7

6
II. SCHOOL AND HOME Q8. Did you feel that the school [TCHILDNAME] attended for the school year that ended in May
or June 2013 taught attitudes and values very similar to those you teach at home, somewhat similar to those you teach at home, somewhat different from those you teach at home, or very different from those you teach at home?
Very similar
Somewhat similar
Somewhat different
Very different
Don’t know/
Refused
32 41 15 9 3
(Asked of respondents who felt attitudes/values in school were different than those at home, n=289) Q9. How concerned were you about this…?
Very Somewhat Not too Not at all Don’t know/
Refused
38 34 19 8 1
Q8/9. Values Combo Table
Values at home and school are similar 73
Values at home and school are different and you are 24
Very concerned 9
Somewhat concerned 8
Not too concerned 5
Not at all concerned 2
Don’t know/Refused 3
Q10. Do you feel that homework and other obligations from [TCHILDNAME]’s school interfered
with your family’s time together during the last school year or not? Q11. (If interfered) Did school obligations interfere with your family time a lot or a little?
Interfered a lot
Interfered a little
Did not interfere
Don’t know/
Refused
6 11 83 --

7
III. COMMON CORE Q12. The “common core” is a set of standards that is being adopted by many states for what
students in all schools need to learn in each grade. How much have you heard about the “common core”?
A lot A little Nothing at all Don’t
know/Refused
23 34 42 1
(Asked of total respondents who have heard about the common core) Q13. To the best of your knowledge, has the school that [TCHILDNAME] attended for the school
year that ended in May or June 2013 adopted the common core, or not? Q12/13. Common Core Combo Table
Heard about common core (NET) 57
Child’s school adopted it 33
Child’s school had not adopted it 12
Don’t know whether child’s school adopted it 12
Have not heard about common core 42
Don’t know/Refused 1
(Asked of total respondents who say child’s school has adopted the common core, n=466) Q14. Do you think that adopting the common core will improve education at [TCHILDNAME]’s
school, worsen education at [TCHILDNAME]’s school, or won’t it make much difference?
Improve education
Worsen education
Won’t make much difference
Don’t know/Refused
47 7 38 8
8
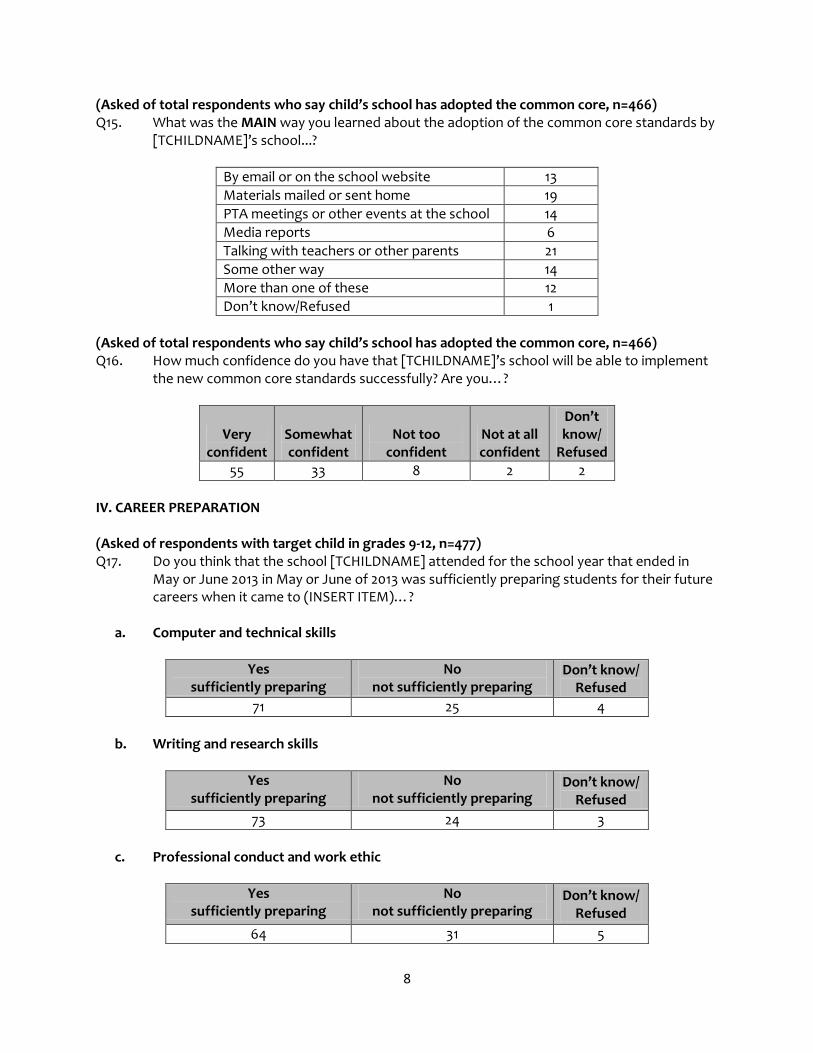
(Asked of total respondents who say child’s school has adopted the common core, n=466) Q15. What was the MAIN way you learned about the adoption of the common core standards by
[TCHILDNAME]’s school...?
By email or on the school website 13
Materials mailed or sent home 19
PTA meetings or other events at the school 14
Media reports 6
Talking with teachers or other parents 21
Some other way 14
More than one of these 12
Don’t know/Refused 1
(Asked of total respondents who say child’s school has adopted the common core, n=466) Q16. How much confidence do you have that [TCHILDNAME]’s school will be able to implement
the new common core standards successfully? Are you…?
Very confident
Somewhat confident
Not too confident
Not at all confident
Don’t know/
Refused
55 33 8 2 2
IV. CAREER PREPARATION (Asked of respondents with target child in grades 9-12, n=477) Q17. Do you think that the school [TCHILDNAME] attended for the school year that ended in
May or June 2013 in May or June of 2013 was sufficiently preparing students for their future careers when it came to (INSERT ITEM)…?
a. Computer and technical skills
Yes sufficiently preparing
No not sufficiently preparing
Don’t know/ Refused
71 25 4
b. Writing and research skills
Yes sufficiently preparing
No not sufficiently preparing
Don’t know/ Refused
73 24 3
c. Professional conduct and work ethic
Yes sufficiently preparing
No not sufficiently preparing
Don’t know/ Refused
64 31 5

9
d. Presentation and speaking skills
Yes sufficiently preparing
No not sufficiently preparing
Don’t know/ Refused
69 27 4
e. Choosing areas of study that would lead to a good job
Yes sufficiently preparing
No not sufficiently preparing
Don’t know/ Refused
69 29 2
f. Science and math
Yes sufficiently preparing
No not sufficiently preparing
Don’t know/ Refused
79 19 2
g. Foreign languages
Yes sufficiently preparing
No not sufficiently preparing
Don’t know/ Refused
62 30 8
(Asked of total respondents with target child in grades 9-12, n=477) Q2. For the school year that ended in May or June 2013, did [TCHILDNAME] attend an
agricultural, vocational or technical school, or not?
Agricultural Vocational Technical Some other school Don’t
know/Refused
3 7 6 82 2
(Asked of total respondents with target child in grades 9-12 not in an agricultural, vocational or technical school, n=404) Q18. Did [TCHILDNAME]’s school offer vocational and technical training courses – that is, hands-
on training related to a specific profession, such as electrician or dental assistant – or didn’t it offer such courses?
Yes, offered vocational and technical training
courses
No, did not offer vocational and technical training
courses
Don’t know/Refused
37 58 5

10
(Asked of total respondents with target child in a grades 9-12 in an agricultural, vocational or technical school or whose school offers vocational or technical training courses, n=234) Q19. Do you think that the vocational and technical training courses the school offered fit the
current job opportunities in your community, or not?
Yes, training courses fit current job opportunities
No, training courses do not fit current job opportunities
Don’t know/Refused
80 10 10
(Asked of total respondents with target child in grades 9-12, n=477) Q20. Do you feel that the school [TCHILDNAME] attended for the school year that ended in May
or June 2013 sufficiently prepares students for college, or not?
Sufficiently prepares Does not sufficiently prepare
Don’t know/Refused
77 21 2
(Asked of total respondents with target child in grades 9-12, n=477) Q21. Do you feel that [TCHILDNAME]’s school sufficiently prepares students who choose not to
go to college to enter the job market when they leave school, or not?
Sufficiently prepares Does not sufficiently prepare
Don’t know/Refused
50 42 8
(Asked of total respondents with target child in grades 9-12, n=477) Q22. (Which of the following do you think [TCHILDNAME] is most likely to do after high
school?/Which of the following is [TCHILDNAME] doing now?)
(Go/Going) to a four-year college 63
(Go/Going) to a two-year college 14
(Go/Going) into a technical training program 7
(Get/Getting) a job 5
(Join/Joining) the military 4
Something else 4
Don’t know/Refused 3
(Asked of total respondents with target child in grades 9-12, n=477) Q23. Do you feel that [TCHILDNAME] received appropriate advice from (his/her/his or her)
school about college or career planning or not?
Received appropriate advice
Did not receive appropriate advice
Don’t know/Refused
68 29 3

11
V. FOOD AT SCHOOL Q24. As best you could tell, how healthy was the lunch provided by the school [TCHILDNAME]
attended for the school year that ended in May or June of 2013? Would you say it was...?
Very healthy
Somewhat healthy
Somewhat unhealthy
Very unhealthy
Does not provide
lunch (vol)
Don’t know/
Refused
24 48 14 6 3 5
Q25. To the best of your knowledge, were the following foods available on most days to
[TCHILDNAME] at school during lunch hour, NOT including any foods (he/she/he or she) might bring from home.
a. Fresh fruits and vegetables
Yes,
available
No, not
available
I don’t know because child does not eat school
lunch (vol)
Does not provide
lunch (vol)
Don’t know/
Refused
78 8 7 3 4
(Asked of half-sample, n=685)
b. Whole grains, like brown rice or whole wheat bread
Yes,
available
No, not
available
I don’t know because child does not eat school lunch (vol)
Does not provide
lunch (vol)
Don’t know/
Refused
53 21 8 3 15
(Asked of half-sample, n=685)
c. Fried foods, like French fries or fried chicken
Yes,
available
No, not
available
I don’t know because child does not eat school lunch (vol)
Does not provide
lunch (vol)
Don’t know/
Refused
48 34 8 3 7
(Asked of half-sample, n=685)
d. Candy
Yes,
available
No, not
available
I don’t know because child does not eat school lunch (vol)
Does not provide
lunch (vol)
Don’t know/
Refused
17 67 8 3 5
12
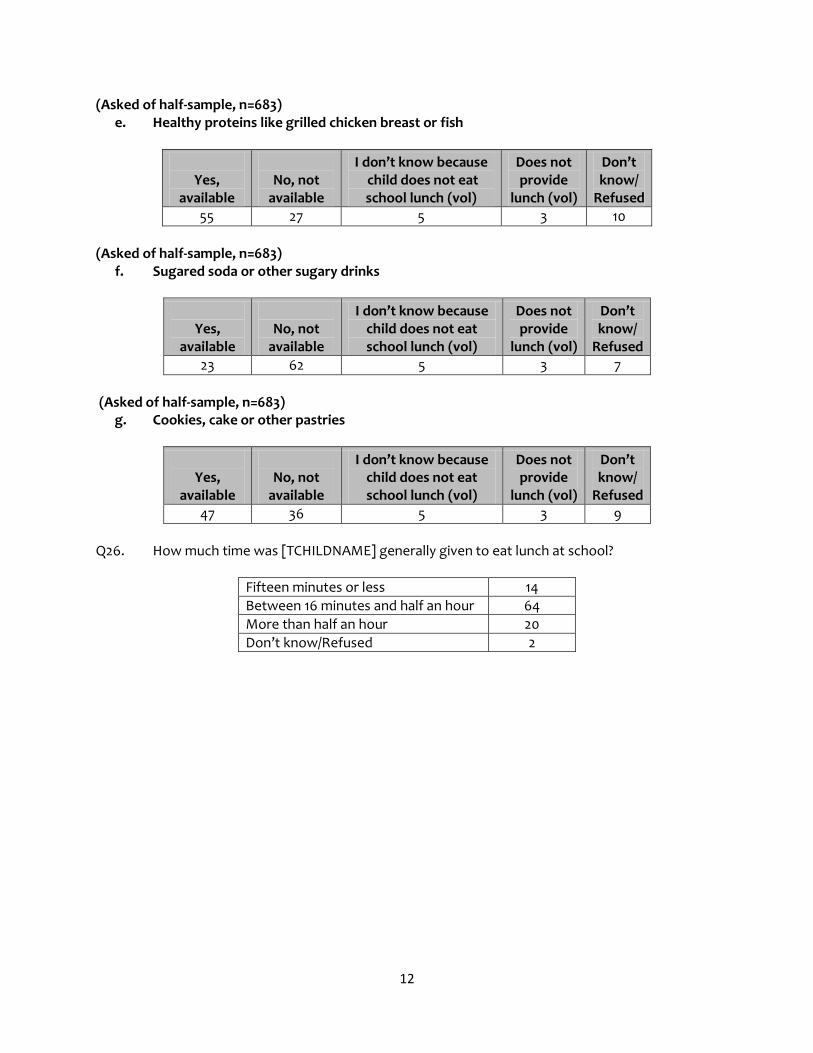
(Asked of half-sample, n=683) e. Healthy proteins like grilled chicken breast or fish
Yes,
available
No, not
available
I don’t know because child does not eat school lunch (vol)
Does not provide
lunch (vol)
Don’t know/
Refused
55 27 5 3 10
(Asked of half-sample, n=683)
f. Sugared soda or other sugary drinks
Yes,
available
No, not
available
I don’t know because child does not eat school lunch (vol)
Does not provide
lunch (vol)
Don’t know/
Refused
23 62 5 3 7
(Asked of half-sample, n=683)
g. Cookies, cake or other pastries
Yes,
available
No, not
available
I don’t know because child does not eat school lunch (vol)
Does not provide
lunch (vol)
Don’t know/
Refused
47 36 5 3 9
Q26. How much time was [TCHILDNAME] generally given to eat lunch at school?
Fifteen minutes or less 14
Between 16 minutes and half an hour 64
More than half an hour 20
Don’t know/Refused 2

13
Q27. What time of day did [TCHILDNAME]’s lunch period generally start?
Before 10 AM 2
From 10 AM to before 11 17
11 AM to before noon 58
Noon to before 1 PM 17
1 PM or later 2
Child’s lunch schedule varies by day (vol) 1
Don’t know/Refused 3
Q28. Were there vending machines at [TCHILDNAME]’s school that sold unhealthy foods, or not?
Yes, sold unhealthy foods
in vending machines
No, did not sell unhealthy foods
in vending machines
Don’t know/Refused
21 69 10
Q29. Did [TCHILDNAME]’s school offer foods from fast-food chains in the cafeteria, or not?
Offers foods from fast-food chains in the cafeteria
Does not offer foods From fast-food chains
in the cafeteria
Don’t know/ Refused
10 84 6
14
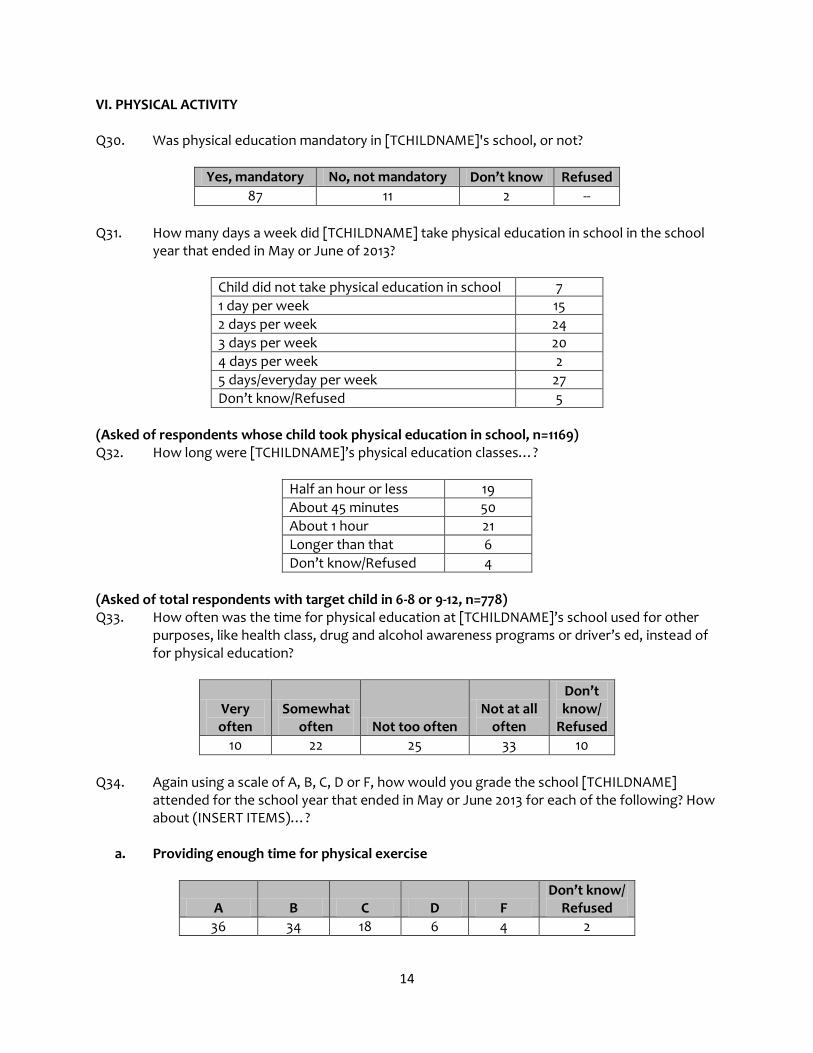
VI. PHYSICAL ACTIVITY Q30. Was physical education mandatory in [TCHILDNAME]'s school, or not?
Yes, mandatory
No, not mandatory Don’t know Refused
87 11 2 --
Q31. How many days a week did [TCHILDNAME] take physical education in school in the school
year that ended in May or June of 2013?
Child did not take physical education in school 7
1 day per week 15
2 days per week 24
3 days per week 20
4 days per week 2
5 days/everyday per week 27
Don’t know/Refused 5
(Asked of respondents whose child took physical education in school, n=1169) Q32. How long were [TCHILDNAME]’s physical education classes…?
Half an hour or less 19
About 45 minutes 50
About 1 hour 21
Longer than that 6
Don’t know/Refused 4
(Asked of total respondents with target child in 6-8 or 9-12, n=778) Q33. How often was the time for physical education at [TCHILDNAME]’s school used for other
purposes, like health class, drug and alcohol awareness programs or driver’s ed, instead of for physical education?
Very often
Somewhat often Not too often
Not at all often
Don’t know/
Refused
10 22 25 33 10
Q34. Again using a scale of A, B, C, D or F, how would you grade the school [TCHILDNAME]
attended for the school year that ended in May or June 2013 for each of the following? How about (INSERT ITEMS)…?
a. Providing enough time for physical exercise
A B C D F Don’t know/
Refused
36 34 18 6 4 2
15
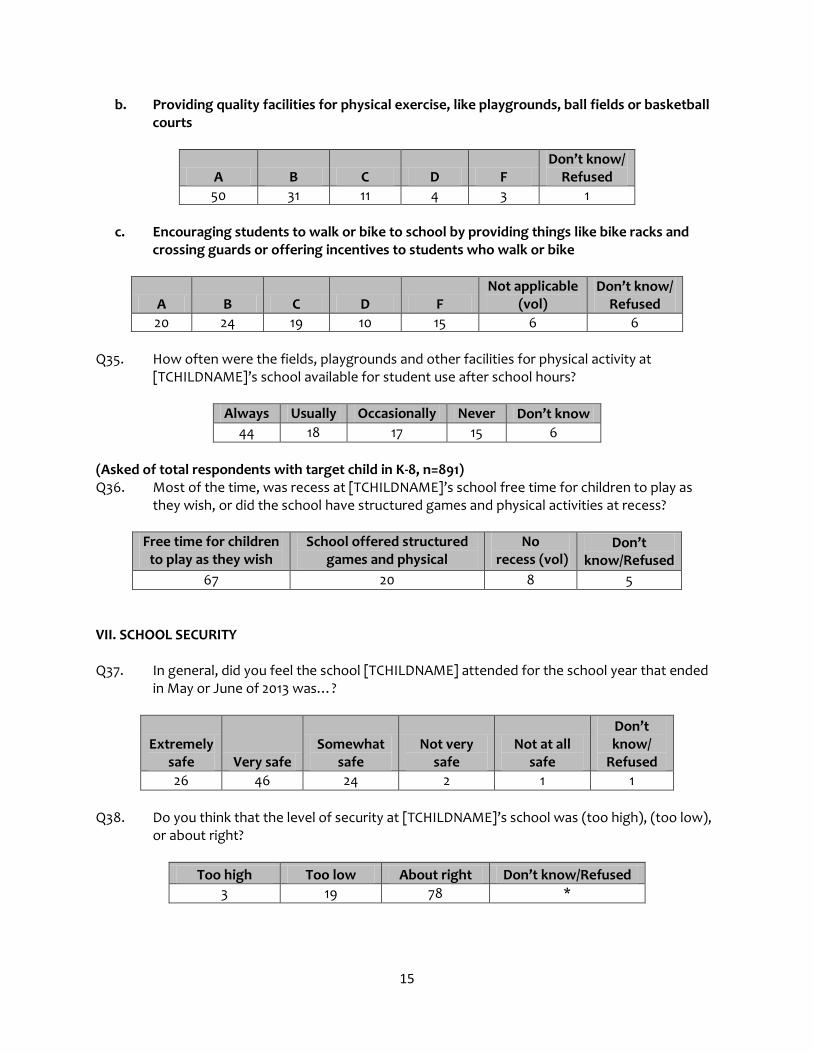
b. Providing quality facilities for physical exercise, like playgrounds, ball fields or basketball courts
A B C D F Don’t know/
Refused
50 31 11 4 3 1
c. Encouraging students to walk or bike to school by providing things like bike racks and
crossing guards or offering incentives to students who walk or bike
A B C D F Not applicable
(vol) Don’t know/
Refused
20 24 19 10 15 6 6
Q35. How often were the fields, playgrounds and other facilities for physical activity at
[TCHILDNAME]’s school available for student use after school hours?
Always Usually Occasionally Never Don’t know
44 18 17 15 6
(Asked of total respondents with target child in K-8, n=891) Q36. Most of the time, was recess at [TCHILDNAME]’s school free time for children to play as
they wish, or did the school have structured games and physical activities at recess?
Free time for children to play as they wish
School offered structured games and physical
activities
No recess (vol)
Don’t know/Refused
67 20 8 5
VII. SCHOOL SECURITY Q37. In general, did you feel the school [TCHILDNAME] attended for the school year that ended
in May or June of 2013 was…?
Extremely safe Very safe
Somewhat safe
Not very safe
Not at all safe
Don’t know/
Refused
26 46 24 2 1 1
Q38. Do you think that the level of security at [TCHILDNAME]’s school was (too high), (too low),
or about right?
Too high Too low About right Don’t know/Refused
3 19 78 *
16
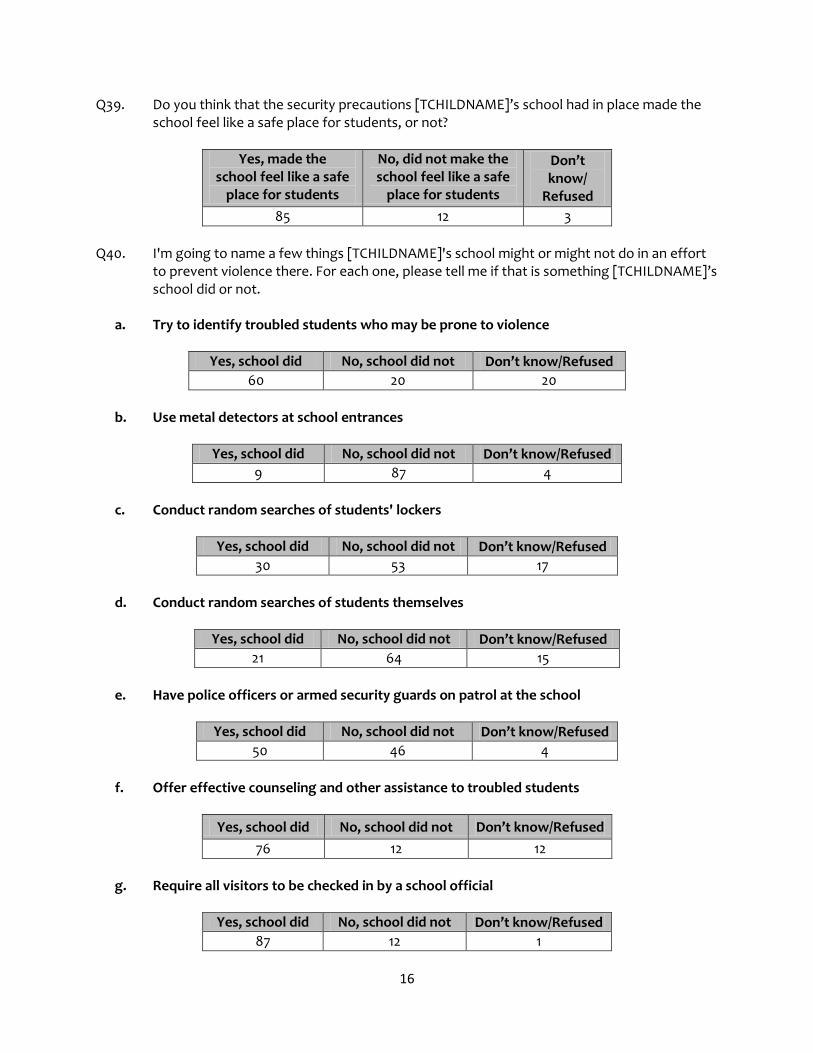
Q39. Do you think that the security precautions [TCHILDNAME]’s school had in place made the school feel like a safe place for students, or not?
Yes, made the school feel like a safe
place for students
No, did not make the school feel like a safe
place for students
Don’t know/
Refused
85 12 3
Q40. I'm going to name a few things [TCHILDNAME]'s school might or might not do in an effort
to prevent violence there. For each one, please tell me if that is something [TCHILDNAME]’s school did or not.
a. Try to identify troubled students who may be prone to violence
Yes, school did No, school did not Don’t know/Refused
60 20 20
b. Use metal detectors at school entrances
Yes, school did No, school did not Don’t know/Refused
9 87 4
c. Conduct random searches of students' lockers
Yes, school did No, school did not Don’t know/Refused
30 53 17
d. Conduct random searches of students themselves
Yes, school did No, school did not Don’t know/Refused
21 64 15
e. Have police officers or armed security guards on patrol at the school
Yes, school did No, school did not Don’t know/Refused
50 46 4
f. Offer effective counseling and other assistance to troubled students
Yes, school did No, school did not Don’t know/Refused
76 12 12
g. Require all visitors to be checked in by a school official
Yes, school did No, school did not Don’t know/Refused
87 12 1

17
Q41. As you may remember, last December, 26 people were killed in a mass shooting at an
elementary school in Connecticut. Following this shooting, did [TCHILDNAME]’s school increase security precautions, or not?
Yes, school increased security precautions
No, school did not increase security precautions
Don’t know/ Refused
54 39 7
VIII. SCHOOL COMMUTE AND SAFETY Q42. What form or forms of transportation did [TCHILDNAME] usually take to school? Did (he/she/he or she) walk, ride a bicycle, ride in a car, ride in a school bus, or take public transportation, like a public bus or subway?
Walk 13
Ride a bicycle 3
Ride in a car 48
Ride in a school bus 40
Take public transportation, like a public bus or subway
4
Other (vol) 1
Don’t know/Refused *
Q43. How long did it generally take for [TCHILDNAME] to get from home to school?
Less than ten minutes 37
Ten to less than twenty minutes 33
Twenty to less than thirty minutes 15
Thirty minutes to less than one hour 13
One hour or more 2
Don’t know/Refused *
Q44. How safe do you think [TCHILDNAME] was when travelling to and from school when it
came to crime and violence…?
Very safe Somewhat
safe Not very
safe Not at all
safe
Don’t know/
Refused
70 25 3 1 1
18
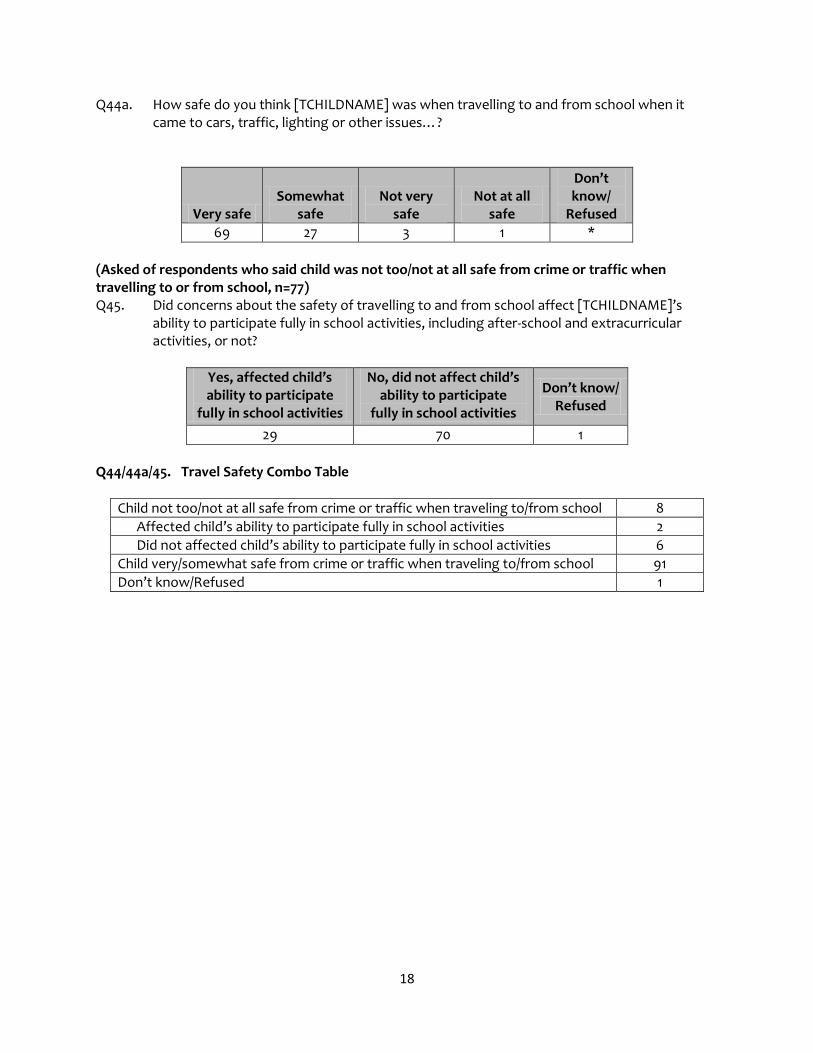
Q44a. How safe do you think [TCHILDNAME] was when travelling to and from school when it came to cars, traffic, lighting or other issues…?
Very safe Somewhat
safe Not very
safe Not at all
safe
Don’t know/
Refused
69 27 3 1 *
(Asked of respondents who said child was not too/not at all safe from crime or traffic when travelling to or from school, n=77) Q45. Did concerns about the safety of travelling to and from school affect [TCHILDNAME]’s
ability to participate fully in school activities, including after-school and extracurricular activities, or not?
Yes, affected child’s ability to participate
fully in school activities
No, did not affect child’s ability to participate
fully in school activities
Don’t know/ Refused
29 70 1
Q44/44a/45. Travel Safety Combo Table
Child not too/not at all safe from crime or traffic when traveling to/from school 8
Affected child’s ability to participate fully in school activities 2
Did not affected child’s ability to participate fully in school activities 6
Child very/somewhat safe from crime or traffic when traveling to/from school 91
Don’t know/Refused 1

19
IX. STRESS Q46. Today’s students may suffer from stress from many sources. For each of the following,
please tell me if you think it caused a lot of stress for [TCHILDNAME] over the school year that ended in May or June of 2013, a little stress for [TCHILDNAME], or it did not cause [TCHILDNAME] stress at all.
How about (INSERT FIRST ITEM)…? Did this cause a lot of stress, a little stress, or did it not cause stress at all?
a. Pressure from [TCHILDNAME]’s school to excel academically
Caused a lot of stress
Caused a little stress
Did not cause stress
at all
Don’t know/
Refused
10 42 48 *
b. The quantity of homework (he/she/he or she) needed to do
Caused a lot of stress
Caused a little stress
Did not cause stress
at all
Don’t know/
Refused
16 43 41 *
c. Bullying at school
Caused a lot of stress
Caused a little stress
Did not cause stress
at all
Don’t know/
Refused
10 30 58 2
d. Difficult relationships with other students
Caused a lot of stress
Caused a little stress
Did not cause stress
at all
Don’t know/
Refused
9 33 57 1
e. Violence or safety issues in (his/her/his or her) school or the surrounding neighborhood
Caused a lot of stress
Caused a little stress
Did not cause stress
at all
Don’t know/
Refused
4 19 76 1

20
f. Difficult relationships with particular teachers
Caused a lot of stress
Caused a little stress
Did not cause stress
at all
Don’t know/
Refused
7 28 64 1
Q46a-f Stress Combo table
One or more caused a lot of
stress None caused a
lot of stress
31 69
Q47. Did [TCHILDNAME]’s school provide counseling for students suffering from stress or other
mental health issues or not?
Yes, school provided counseling
No, school did not provide counseling
Don’t know/ Refused
67 19 14

21
X. SCHOOL HOURS Q48. What time did the school day start for [TCHILDNAME] for the school year that ended in May
or June 2013?
Kindergarten 1-12th grade
Before 7:00 AM 1 2
From 7:00 to before 7:30 AM 7 7
From 7:30 to before 8:00 AM 15 24
From 8:00 to before 8:30 AM 43 42
From 8:30 to before 9:00 AM 24 16
From 9:00 to before 9:30 AM 7 8
From 9:30 AM to before 10:00 AM -- 1
10:00 AM or later 3 *
Don’t Know/Refused * *
Q49. What time did the school day end for [TCHILDNAME]?
Kindergarten 1-12th grade
Before 12:00 noon 3 *
From 12:00 noon to before 1:00 PM 9 2
From 1:00 to before 2:00 PM 6 2
From 2:00 to before 2:30 PM 11 12
From 2:30 to before 3:00 PM 23 28
From 3:00 to before 3:30 PM 30 36
From 3:30 to before 4:00 PM 14 15
4:00 PM or later 4 5
Don’t Know/Refused * *
Hours In School Combo Table (Grades 1-12, n=1241)
1-12th grade
Less than 5 2
5 to under 5.5 hours 1
5.5 to under 6 hours 2
6 to under 6.5 hours 14
6.5 to under 7 hours 29
7 to under 7.5 hours 38
7.5 to under 8 hours 8
8 to under 8.5 hours 4
8.5 to under 9 hours *
9 or more hours 1
Don’t Know/Refused *

22
Hours In School Combo Table (Kindergarten, n=127)
Kindergarten
Less than 3 3
3 to under 4 hours 7
4 to under 5 hours 8
5 to under 6 hours 5
6 or more hours 77
Don’t Know/Refused *
23
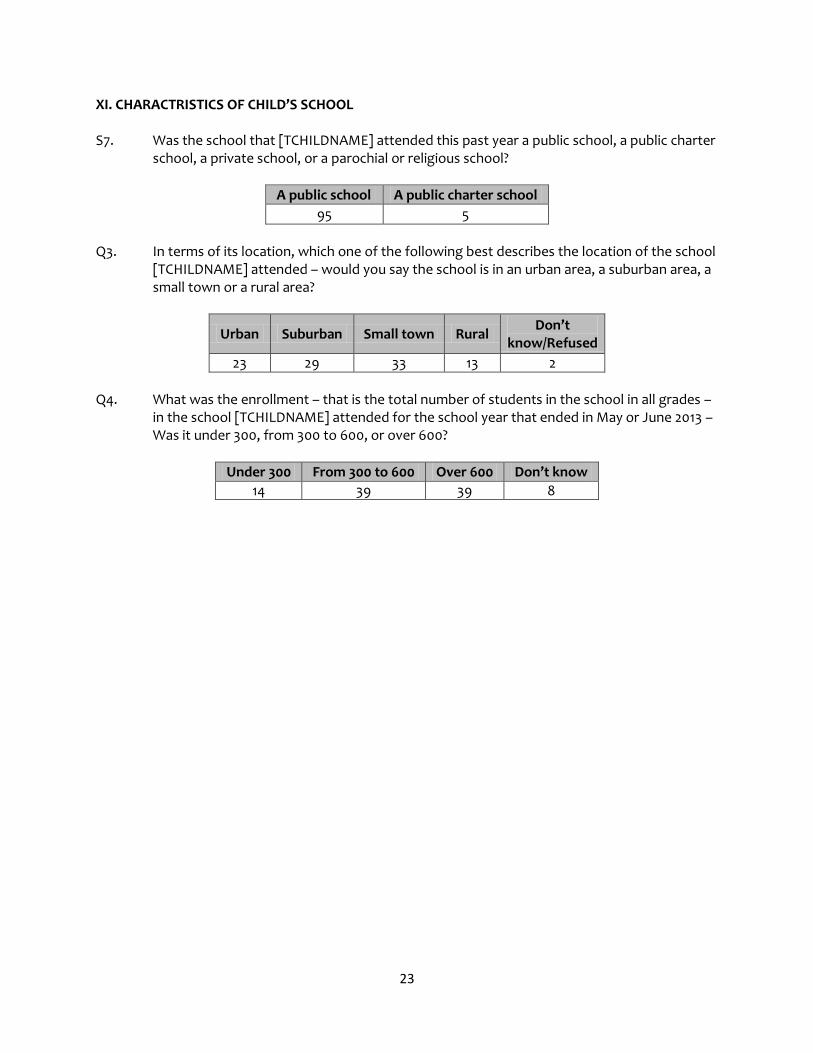
XI. CHARACTRISTICS OF CHILD’S SCHOOL S7. Was the school that [TCHILDNAME] attended this past year a public school, a public charter
school, a private school, or a parochial or religious school?
A public school A public charter school
95 5
Q3. In terms of its location, which one of the following best describes the location of the school
[TCHILDNAME] attended – would you say the school is in an urban area, a suburban area, a small town or a rural area?
Urban Suburban Small town Rural Don’t
know/Refused
23 29 33 13 2
Q4. What was the enrollment – that is the total number of students in the school in all grades –
in the school [TCHILDNAME] attended for the school year that ended in May or June 2013 – Was it under 300, from 300 to 600, or over 600?
Under 300 From 300 to 600 Over 600 Don’t know
14 39 39 8

24
XII. DEMOGRAPHICS DEMOGRAPHICS OF CHILD Number of children in the household who were enrolled in kindergarten through 12th grade for the school year that ended in May or June 2013.
One Two Three Four or more
58 30 9 3
S5a. How old is [TCHILDNAME]?
4-11 years old
12-14 years old
15+ years old 46 25 29
S6. And is [TCHILDNAME] a boy or a girl?
Boy Girl Refused
51 48 1
Q1. And what grade was [TCHILDNAME] enrolled in for the school year that ended in May or
June of 2013?
K-5th grade (NET) 47
Kindergarten 9
1st grade 11
2nd grade 9
3rd grade 7
4th grade 6
5th grade 5
6-8th grade (NET) 21
6th grade 7
7th grade 8
8th grade 6
9-12th grade (NET) 32
9th grade 9
10th grade 8
11th grade 8
12th grade 7

25
Race of Child
Hispanic (NET) 23
White 18
Black 3
Unspecified 2
Non-Hispanic (NET) 77
White 52
Black 15
Asian 3
Mixed 3
Native American 1
Other 1
Unspecified 2

26
DEMOGRAPHICS OF RESPONDENT Now I have just a few more questions that will be used to analyze the survey responses. Sex Record SEX of Respondent:
Male Female
35 65
Age D7. Could you please tell me your age? D7a. So could you tell me if you are between the ages of…?
18-24 25-34 35-49 50 or more Refused
7 21 51 20 1
Respondent Race
Hispanic (NET) 21
White 17
Black 2
Unspecified 2
Non-Hispanic (NET) 79
White 57
Black 13
Asian 3
Native American 2
Mixed 1
Other 1
Unspecified 2
Don’t know/Refused *
D8. Are you currently married, living with a partner, divorced, separated, widowed or have you
never been married?
Married 63
Living with a partner 8
Divorced 11
Separated 3
Widowed 2
Never been married 14
Refused *

27
D9. What is your relationship to (TCHILDNAME)?
Mother 57
Stepmother 1
Father 27
Stepfather 2
Grandfather 1
Grandmother 4
Aunt 1
Uncle 1
Brother 3
Sister 2
Other relative – male 1
Other relative - female *
Don’t know/Refused *
Household Composition Combo Table
Child lives with mother/step and father/step 65
Child does not live with mother/step and father/step (NET) 35
Child lives with mother/step but not with father/step 26
Child lives with father/step but not with mother/step 5
Neither parent/step reported in household 4
Unknown *
D12. What is the last grade of school you completed?
High School or less (NET) 35
Less than high school graduate 8
High school graduate 24
Technical school/Other 3
Some college (including Associate’s degree) 28
4 year college or more (NET) 37
Graduated college (4 year/Bachelor’s degree) 23
Graduate school or more 14
Refused 1

28
Phone Status
Cell phone only Both landline and cell Landline only
45 50 5
Household income
Less than $50,000 (NET) 48
Less than $15,000 13
$15,000 but less than $25,000 11
$25,000 but less than $30,000 7
$30,000 but less than $40,000 10
$40,000 but less than $50,000 6
Less than $50,000 unspecified 2
$50,000 or more (NET) 47
$50,000 but less than $75,000 15
$75,000 but less than $100,000 12
$50,000 but less than $100,000 (unspecified) *
$100,000 or more (SUBNET) 19
$100,000 but less than $150,000 11
150,000 but less than $200,000 5
$200,000 but less than $250,000 1
$250,000 and over 2
$100,000 or more (unspecified) 1
Don’t know/Refused 5
D16. Is the home in which you live owned or rented?
Own 63
Rent 36
Don’t know/Refused 1


![NATIONAL SENIOR CERTIFICATE NASIONALE SENIOR …...nsc/] = ¸ · ¨ © § npr | npr rt rt](https://img.pdfslide.us/doc/110x75/5f0f7c637e708231d4446671/national-senior-certificate-nasionale-senior-nsc-npr-npr-rt.jpg)