Embed Size (px)
Citation preview
Oxidative stress responses and lipid peroxidation damage are induced during 1
dehydration in the production of dry active wine yeasts 2
3
Elena Garre1,2, Françoise Raginel3, Antonio Palacios4, Anne Julien3 and Emilia 4
Matallana1,2* 5
6
1Departamento de Bioquímica y Biología Molecular, Universitat de València, Valencia, 7
SPAIN 8
2Departamento de Biotecnología, Instituto de Agroquímica y Tecnología de Alimentos, 9
CSIC, Valencia, SPAIN. 10
3Laboratory of Research and Development. Fermented Beverages Division. Lallemand 11
S.A.S., Toulouse, FRANCE 12
4Laboratory Excell Ibérica S.L.; Logroño, La Rioja, SPAIN 13
14
15
*Corresponding author: Departamento de Biotecnología, Instituto de Agroquímica y 16
Tecnología de Alimentos, CSIC, Apartado de Correos, 73. Burjassot (Valencia). E-17
46100 Spain. Telephone: 34 96 390 00 22. Fax: 34 96 363 63 01. e-mail: 18
20
Key words: Wine yeast dry active biomass, yeast dehydration, oxidative stress 21
Running title: Dehydration stress in dry active wine yeast production 22
23
ABSTRACT 24
The tolerance of the yeast Saccharomyces cerevisiae to desiccation is important for the 25
use of this microorganism in the wine industry, since active dry wine yeast is routinely 26
used as starter for must fermentations. Many studies have shown the complexity of the 27
cellular effects caused by water loss, including oxidative injuries on macromolecular 28
components. However the technological interest of yeast drying was not addressed in 29
those studies, and the dehydration conditions were far from the industrial practice. In 30
the present study a molecular approach was used to characterize the relevant injuring 31
conditions during pilot plant dehydrations under two different drying temperatures (i.e., 32
35 and 41ºC). We have analyzed expression changes for several stress gene markers and 33
we have determined two biochemical redox indicators (glutathione and lipid 34
peroxidation levels) during pilot plant dehydrations to produce active dry biomass, 35
according to the standard practice in industry. The main gene expression response 36
involves the induction of genes TRR1 and GRX5, corresponding to the two main redox 37
balance systems, thioredoxins and glutathione/glutaredoxins. Elevated glutathione 38
content and significant lipid peroxidation damage indicate the physiological impact of 39
the oxidative stress on cellular components. The comparison between commercial 40
stocks and pilot plant samples demonstrate the suitability of the molecular approach at 41
the pilot plant scale to study physiological traits of industrial yeast products. 42
43
1. Introduction 44
Must inoculation with selected yeast strains is nowadays a general winemaking practice 45
because the use of starters reduces the risk of sluggish fermentations and contributes to 46
reproducible sensorial properties and quality in wine. Often, these starters are 47
commercialized in active dry yeast form (ADY). The performance of dry yeast 48
products, including their fermentation capacity and flavour release, depends on the 49
genetic constitution of the selected yeast strain, but the industrial practice during 50
biomass propagation and desiccation is also important due to the presence of 51
environmental adverse conditions (Attfield, 1997; Pretorius, 2000). The technological 52
parameters of the biomass production process, such as energetic, kinetic and yield, have 53
been extensively evaluated and optimized. However, increasing numbers of molecular 54
studies are showing good correlations between the characteristic stress resistance of a 55
particular yeast strain and its performance to complete wine fermentations. Evaluations 56
of the yeast transient response to environmental challenges during the yeast biomass 57
propagation process and also during must fermentation have been performed and have 58
shed light on critical points of those processes (Gibson et al., 2008; Pérez-Torrado et al., 59
2005, 2009; Zuzuarregui et al., 2005; Zuzuarregui and del Olmo, 2004a, 2004b). 60
However, molecular analysis of yeast adaptation during the handling and drying steps 61
after wine yeast biomass propagation remains to be addressed. 62
ADY production begins with the propagation of yeast biomass in a multiple-stage 63
process (Chen and Chiger, 1985; Degre, 1993). The selected strain is inoculated in 64
aerated nutrient-supplemented molasses and then cultivated in a sequence of 65
consecutive batch and fed-batch fermentations in increasing volumes that ends with the 66
‘commercial’ fermentation. Along this process wine yeast cells suffer multiple 67
environmental challenges. In the initial batch phase, yeast cells are exposed to high 68
osmotic pressure, due to the elevated sugars concentration in the molasses, that elicits a 69
molecular stress response that activates glycerol synthesis (Pérez-Torrado et al., 2005). 70
Also, aeration leads to important oxidative stress and induces expression of genes 71
involved in ROS (reactive oxygen species) scavenging. During the fed-batch phase, the 72
feed rate is set to limit the sugar concentration in order to ensure respiratory metabolism 73
and increase the biomass yield. The respiratory metabolism causes oxidative stress and 74
the response to this injuring condition seems to be the most relevant molecular 75
adaptation (Pérez-Torrado et al., 2005, 2009; Shima et al., 2005). At the end of biomass 76
propagation, wine yeast cells are separated from the fermented media by centrifugation. 77
The resulting yeast cream is processed through a filter press or rotary vacuum filters to 78
obtain a product with the highest solids content. Usually, the filtered biomass is mixed 79
with emulsifiers and then it is extruded into strands. Finally, the extruded yeast strands 80
are dehydrated to obtain a product with less than 8 % residual moisture that is packed in 81
vacuum or inert atmosphere and stored for long time periods (Chen and Chiger, 1985). 82
Yeast cells endure various injuring environmental conditions, such as nutrient limitation 83
during several hours of maturation, and potentially a complex mix of different stresses 84
during the drying process. Dehydration is known to cause cell growth arrest and severe 85
damage to membranes and proteins (Potts, 1994; Singh et al., 2005). The removal of 86
water molecules causes protein denaturalization, aggregation, and loss of activity in an 87
irreversible manner (Prestrelski et al., 1993). Additionally, at the membrane level, 88
desiccation is associated with an increased package of polar groups of phospholipids 89
and formation of endovesicles leading to cell lysis during rehydration (Crowe et 90
al.,1992; Simonin et al., 2007). Recently, free radical damage has also been suggested 91
as one of the most important injuries during dehydration. Several studies with 92
laboratory yeast strains have shown an important accumulation of ROS during 93
dehydration resulting in denaturation of proteins, nucleic acid damage and lipid 94
peroxidation (Espindola et al., 2003; Pereira et al., 2003; França et al., 2005, 2007). As 95
a result, these environmental injuries affect negatively the fermentative capacity, the 96
viability and the vitality of cells. 97
In this work we have analyzed the molecular response of wine yeast strains during 98
dehydration experiments simulating the industrial desiccation process at the pilot plant 99
scale, by determining the expression profiles of several stress gene markers. The 100
predominant oxidative stress response has been more deeply defined by studying 101
several genes for specific oxidative defences and by determining biochemical indicators 102
of redox unbalance, such as glutathione content, and lipid peroxidation damages. The 103
relevance of these results in the industrial production of dry wine yeast biomass has 104
been confirmed by comparison to real commercial stocks from an ADY company. 105
106
2. Materials and methods 107
2.1. Strains 108
The industrial Saccharomyces cerevisiae strain T73 (CECT1894) has been used in this 109
study. It is a natural diploid wine strain isolated from Alicante (Spain) musts (Querol et 110
al., 1992), which has been commercialized by Lallemand, Inc. (Montreal, Canada). 111
2.2. Media and industrial cultivation 112
Industrial cultivation was performed according to the Laboratory of Research and 113
Development (Lallemand S.A.S.) protocol. Precultures and batch growth were 114
performed in MALT media, pH 4.80, containing 80 g sugars/L. Precultures were 115
incubated at 30 ºC over-night with shaking. Culture growth was monitored by 116
measuring the optical density at 600 nm (OD600) and cell counting in a Neubauer 117
camera. Precultures were used to inoculated 1−2 × 10⁶ cells/mL in 10 L of MALT 118
media in a bioreactor. Batch and fed-batch cultivations were performed in a BIOFLO 119
4500 Bioreactor (New Brunswick Scientific). The first step of industrial cultivation was 120
a 24 hours batch growth. Then, a part of the biomass and media was removed and the 121
remaining biomass (33.75 g) was used as inoculum for the fed-batch step. Before 122
starting the feeding, the volume was adjusted to 11 L with sterile water. During the fed-123
batch growth, the culture was fed with molasses media, pH 4.80, and containing 300 g 124
sugars/L and supplemented with NH4OH 5%, vitamins and minerals (pantothenic acid, 125
biotin, thiamine, zinc sulphate, magnesium sulphate, phosphoric acid and ammonium 126
hydroxide). Along the process, temperature (30 ºC), pH (4.80) and aeration (1 vvm) 127
were kept constant. The stirrer speed was 250 rpm for the first 7 hours and 400 rpm for 128
the remaining batch growth. During the fed-batch stage the stirrer speed was fluctuating 129
between 400 and 650 rpm depending on cells oxygen request. The minimum level of 130
dissolved oxygen was set to 15 %. At the end of the process, the fed was stopped for 131
1−2 hours before recovering the produced biomass. 132
2.3. Drying 133
The drying process was performed according to the Laboratory of Research and 134
Development (Lallemand S.A.S.) protocol. At the end of the fed-batch fermentation, 135
biomass was centrifugally separated (Westfalia Separator AG) from the fermented 136
media and subjected to several washing steps. A 3-fold concentrated yeast cream was 137
obtained, and a mix of sorbitan monoestearate and NaOH was added. Filtration of the 138
yeast cream was performed in a Büchner funnel and a vacuum pump to obtain a cake. 139
Then, the yeast cake was extruded through a perforate plate obtaining strands (1 mm 140
diameter). Extruded yeast strands were dried in a fluidized-bed dryer (Versa-Glatt 141
GPCC Type 1, USA) for 20 to 30 min. Air temperature was 60 ºC at the beginning of 142
the drying period, keeping the temperature of the biomass at 35 ºC or 41 ºC. The final 143
moisture content of the ADY was beneath 8 %. Some samples were taken along 144
handling and drying of biomass and its moisture contents were determined with a 145
moisture analyser (Sartorius MA30). 146
2.4. Determination of fermentative capacity 147
Samples containing 2.5 g (dry weight) of cells were rehydrated into 50 mL of warm 148
water (37 ºC) for 20 min (10 min statically and 10 min shaking). The rehydrated yeast 149
was used to inoculate 1 × 10⁷ cells/mL in 100 mL of YPGF media (10 % fructose, 10 % 150
glucose, 2 % peptone, 1 % yeast extract) and incubated at 30 ºC with shaking (140 151
rpm). The exact number of cells was determined by recounting in a Neubauer camera. 152
The production of CO2 was measured in a Chittick Apparatus (American association of 153
cereal chemists, 12-10) during 4 hours. The fermentative capacity was expressed as the 154
mean of last nine instantaneous rates. The instantaneous rate is the CO2 increment (mL) 155
by number of cells and by elapsed time between two consecutive measures (20 min). 156
2.5. RNA extraction and cDNA synthesis 157
Total RNA from 50 - 70 mg yeast cells was extracted with cycles of vigorous agitation 158
on a vortex in 0.5 mL LETS buffer (LiCl 0.1 M, EDTA 0.01 M pH 8.0, Tris-HCl 0.01 159
M pH 7.4, SDS 0.2 % (p/v)), 0.5 mL phenol pH 4.3 (AMRESCO) and 0.5 mL glass 160
beads. Supernatants were extracted with phenol:chloroform (5:1) (v:v) and 161
phenol:chloroform:isoamylic alcohol (25:24:1) (v:v:v). RNA precipitate was obtained 162
after incubation with 1 volume of LiCl 5 M at -20 ºC during at least 3 hours. The 163
quantity and the quality of the extracted RNA were checked spectrophotometrically and 164
by electrophoresis, respectively. 1 μg of total RNA was used for the synthesis of first 165
strand cDNA using the Transcriptor First Strand cDNA Synthesis Kit (Roche) in the 166
presence of random hexamer primers. The obtained product was RNA free and suitable 167
to be used in a quantitative real-time PCR. 168
2.6. Gene expression analysis by quantitative real-time PCR 169
PCR primers (Table 1) were designed with the available Gene Bank sequence data and 170
the Primer Express software (PE Applied Biosystems, Cheshire, UK) according to the 171
Roche Applied Science and the Bio-Rad Laboratories guidelines. Quantitative real-time 172
PCR was performed in a LightCycler 2.0 apparatus (Roche) using the LightCycler 173
FastStart DNA MasterPLUS SYBR Green I kit (Roche) for fluorescent labeling. 2.5 μL 174
cDNA was added to each reaction in a final volume of 10 μL. Real-time PCR reactions 175
using 1 pmol /μL of the corresponding oligonucleotides were performed under the 176
following conditions: 95 ºC for 10 min, followed by 40 cycles of 20 s at 95 ºC, 5 s at 55 177
ºC and 6 s at 72 ºC. At the end of the amplification cycles, a melting analysis was 178
conducted to verify the specificity of the reaction. This was carried out by heating the 179
amplification products from 65 °C to 95 °C at 0.1 °C/s and monitoring the decrease in 180
fluorescence. For each analyzed gene, a negative control was included and a standard 181
curve was made with serial dilutions of a pool of representative samples from each step 182
of the drying process (2 × 10⁻¹, 1 × 10⁻¹, 4 × 10⁻², 2 × 10⁻² and 1 × 10⁻², except for the 183
RDN18 gene that were 4 × 10⁻², 2 × 10⁻², 1 × 10⁻², 5 × 10⁻³, 2 × 10⁻³ and 1 × 10⁻³). The 184
2nd Derivative Maximum Method of LightCycler software was used to identify the Cp 185
(crossing point) of a sample and to transform it to cDNA values. As recently suggested 186
by different authors, several reference gene were used (Bustin et al., 2009) and the 187
results were normalized by using the normalization factor obtained from geNorm VBA 188
applet (Vandesompele et al., 2002). The expression of two standard reference genes 189
(ACT1, RDN18) and HSP12, a stress induced gene with a high and relatively constant 190
expression during dehydration (not shown). 191
2.7. Glutathione determination 192
100 mg of cells were resuspended in 8 mM HCl, 1.3 % (w/v) 5-sulphosalicylic acid (4 193
ºC). Cells were broken with 0.6 g glass beads in four cycles of 1 min agitation on a 194
vortex mixer, followed by 1 min on ice, and then incubated on ice for 15 min to 195
precipitate proteins. The supernatants obtained after centrifugation were used to 196
determine total and oxidized glutathione (GSSG) by a colorimetric assay (Griffith, 197
1980; Tietze, 1969). 200 μL of extract were added to 120 μL of enzymatic cocktail (0.4 198
mg/mL NADP+, 0.16 mg/mL glucose-6-phosphate, 3 μg/mL glucose-6-phosphate 199
dehydrogenase, 1 mU glutathione reductase, 0.2 M MES, 2 mM EDTA, 0.1 M sodium 200
phosphate buffer, pH 6.0) and 480 μL of 200 μM DTNB (5, 5'-dithiobis-(2-nitrobenzoic 201
acid)). The reaction mixture was incubated with shaking at room temperature in the dark 202
for 20 min and the absorbance at 412 nm was measured. To determine oxidized 203
glutathione, cell extracts were previously incubated with 1 M 2-vinylpyridine for 1 204
hour. A standard curve from 0 to 16 μM GSSG was prepared and processed as the 205
samples. Reduced glutathione (GSH) was calculated by subtraction between total and 206
oxidized glutathione. Results are expressed as nmoles of glutathione/mg of dry cell 207
weight. 208
2.8. Measurement of lipid peroxidation 209
The method based on the reaction of thiobarbituric acid with reactive species derived 210
from lipid peroxidation, particularly malondialdehyde (MDA), was used. Detection of 211
thiobarbituric acid reactive species (TBARS) was carried out by a colorimetric assay 212
described by Buege and Aust (1978) with some modifications (Espindola et al., 2003). 213
50 mg of cells were resuspended in 500 μL of 50 mM phosphate buffer, pH 6.0, 214
containing 10 % trichloroacetic acid, and 0.3 g glass beads were added. The samples 215
were broken by three cycles of 1 min agitation on a vortex mixer followed by 1 min on 216
ice. After centrifugation, supernatants were mixed with 0.1 mL of 0.1 M EDTA and 0.6 217
mL of 1 % (w/v) thiobarbituric acid in 0.05 M NaOH. The reaction mixture was 218
incubated at 100 ºC for 15 min and then cooled on ice for 5 min. The absorbance at 532 219
nm was measured. Lipid peroxidation is expressed as pmoles of malondialdehyde/mg of 220
dry cell weight. 221
2.9. Intracellular trehalose determination 222
Cell free extracts from 10 mg cells were obtained according to Parrou and François, 223
(1997). Trehalose was measured by enzymatic degradation with commercial trehalase 224
(Sigma). Released glucose was determined by the glucose oxidase/peroxidase assay. 225
The amount of trehalose is given in µg of trehalose/mg of dry cell weight. 226
227
3. Results 228
3.1. Residual moisture and physiological parameters in pilot plant and commercial 229
ADY products 230
Yeast biomass was obtained in pilot plant scale simulations of industrial process with a 231
biomass yield of 0.47 ± 0.01 g dry weight of cells/g of sucrose. Sorbitan monoestearate 232
and NaOH were added to the concentrated yeast cream obtained after centrifugation and 233
washing, and this initial product was used as reference for the parameters analyzed 234
during the dehydration experiments. The residual moisture was determined after every 235
step and the results are shown in Figure 1. The stabilized yeast cream was filtered to 236
remove about 30 % of residual moisture, and subsequently, the yeast cake was extruded 237
into fine strands to easier the drying. The water content did not change at this step. After 238
that, extruded yeast strands were fed into an air-lift dryer and hot air was blown through 239
the biomass at a sufficient power to keep yeast particles in suspension. During the 240
drying process, biomass maximal temperatures reached 35 ºC or 41 ºC. After 8 minutes 241
of drying, the water content diminished to 40 % at both temperatures (Fig. 1). At a 242
drying temperature of 41 ºC, the biomass showed a residual moisture beneath 8 % after 243
18 minutes of drying, and the moisture content in the final product was 4.77 % ± 0.26 244
%. In the drying at 35 ºC, the biomass reached the same level of dehydration after 28 245
minutes of drying, and the moisture content in the final product was 5.51 % ± 0.38 % 246
(Fig. 1). 247
The quality of final products (ADY) obtained in a pilot plant scale was compared to 248
three T73 commercial stocks supplied by Lallemand S.A.S. Trehalose content and 249
fermentative rate were analyzed as physiological parameters for pilot plant yeast creams 250
and ADY from 35 and 41 ºC drying protocols, and also for ADY commercial products. 251
The results of those determinations are shown in Table 2. The trehalose content in the 252
pilot plant yeast cream was 180.8 ± 16.5 μg of trehalose/mg of dry cell weight, it 253
slightly varied along the handling and dehydration processes, and it was not 254
significantly affected by the drying temperature (Table 2). However, trehalose 255
accumulated to higher levels in the three industrial stocks (A, B and C) with relatively 256
small differences between them (less than 10 %). No significant differences in 257
fermentative capacity were detected between pilot plant ADY samples, and their CO2 258
production rate was similar to the rate displayed by commercial stocks. 259
260
3.2. Transcriptional response of stress-related genes during the drying process at the 261
pilot plant scale 262
We have analyzed a collection of gene markers based on their specific induction by a 263
single stress condition in order to study the physiological adaptation of wine yeasts to 264
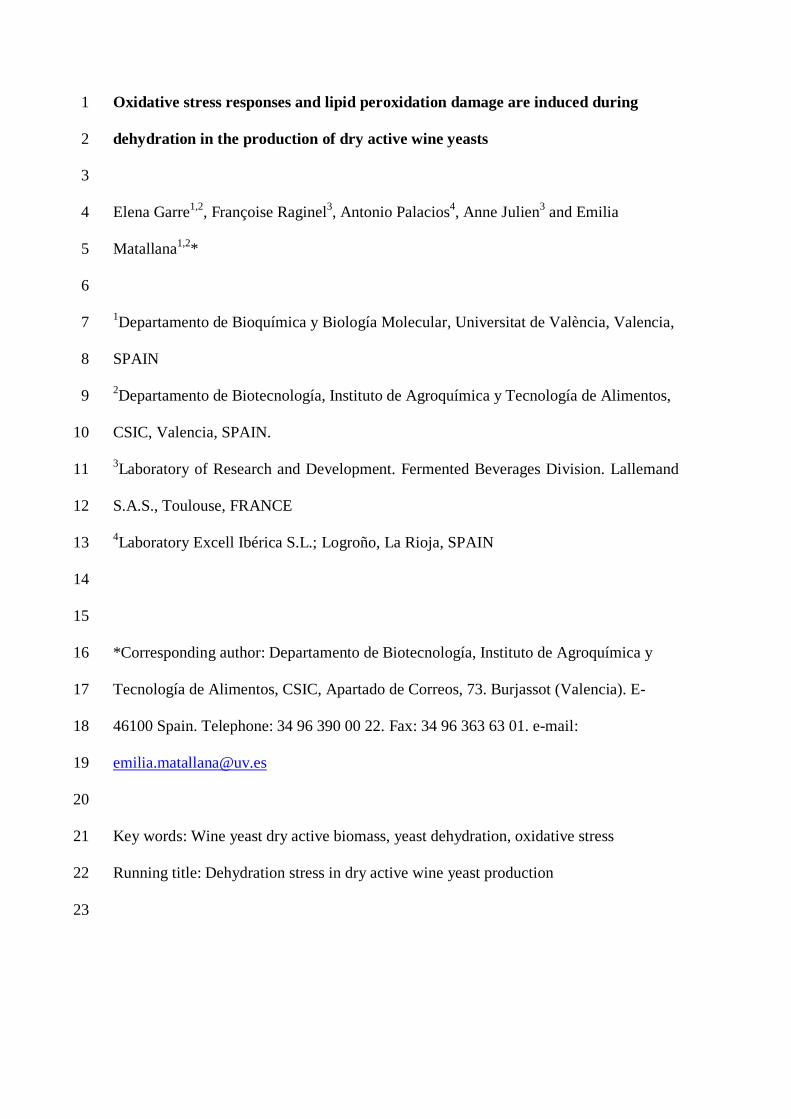
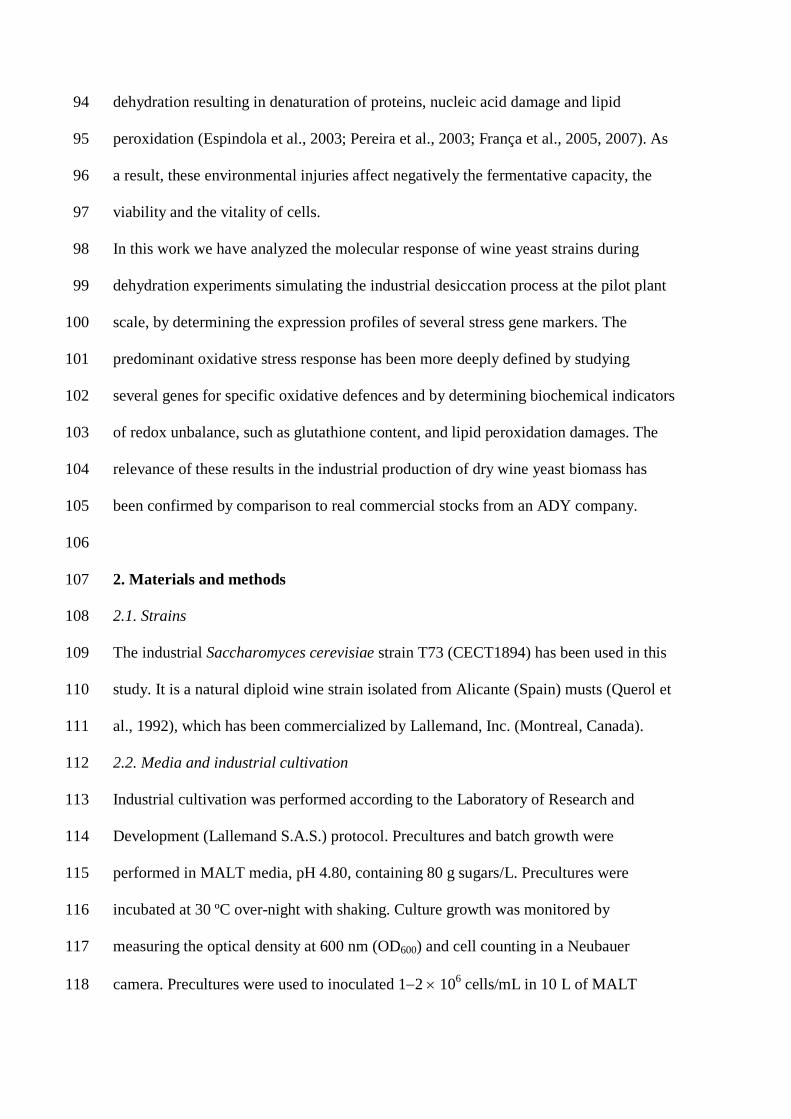
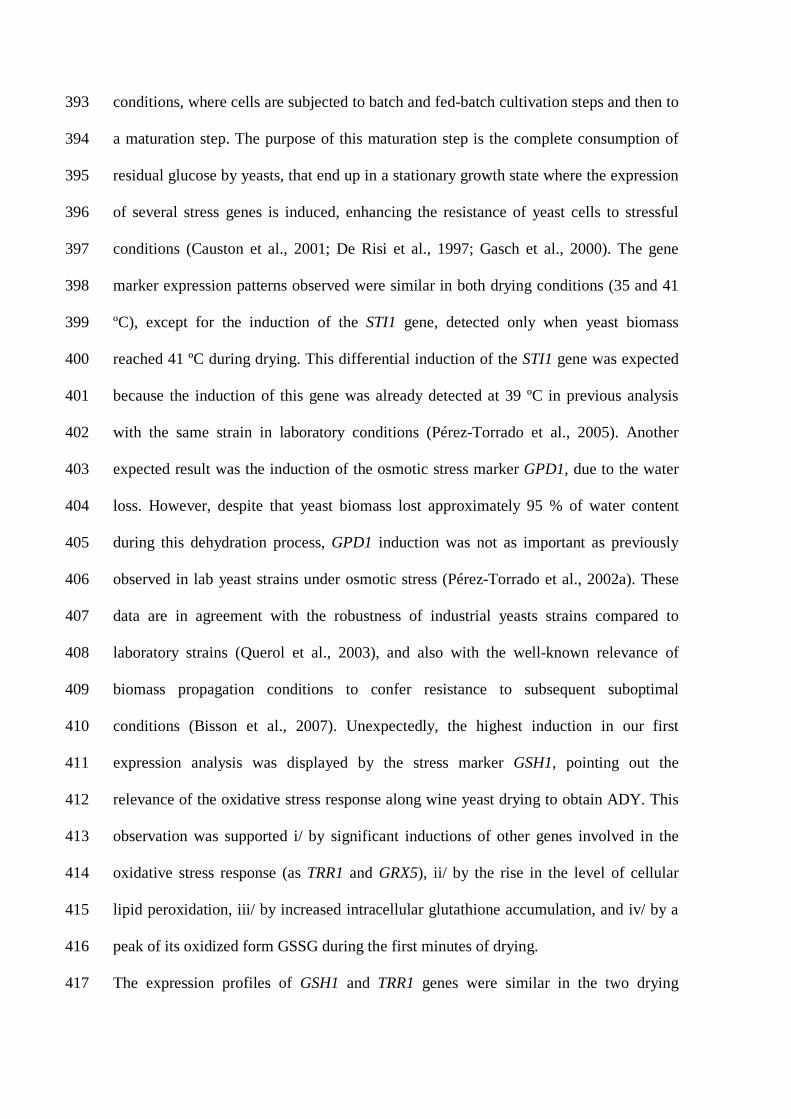
dehydration, the final industrial process in ADY production. Figure 2 shows the results 265
of the expression analysis for some of those gene markers along handling and drying of 266
wine yeast biomass in pilot plant scale. The analyzed gene markers were: STI1, 267
transcriptionally activated by the transcriptional factor Hsf1p during thermic stress, 268
GSH1 and TRX2, coding for proteins participating in antioxidants functions, GPD1, 269
involved in the high-osmolarity glycerol (HOG) response pathway, and HSP12, 270
regulated by the general stress response pathway through Msn2p/4p transcriptional 271
factors. Figure 2 shows the quantification of the mRNA levels of these stress genes 272
along drying processes at two different temperatures. As some differences were 273
observed in the expression of the marker genes in the cream samples, data along drying 274
were normalized to their corresponding expression in the cream. As can be seen, only 275
very small changes in the mRNA level of the analyzed genes were observed along the 276
first steps of the process, including filtration and extrusion of the yeast biomass. Higher 277
expression changes were observed mainly in samples obtained at different time points 278
during the step of drying at 35 ºC (Panel A) and 41 ºC (Panel B), and also in the active 279
dry yeast products. A 2-fold increase after 28 min of drying at 35 ºC was observed in 280
the mRNA levels of the GSH1 gene and more than 3-fold in the final ADY product. 281
Also the transcript level of the GPD1 gene was up to 2-fold higher in ADY (Fig. 2, 282
Panel A). A similar expression pattern was observed in biomass samples obtained along 283
drying at 41 ºC, but transcriptional changes were already detected after 18 min of drying 284
(Fig. 2, Panel B). Interestingly the expression of the additional gene marker STI1 285
increased at 41 ºC. The mRNA level in the ADY final product was 2-fold that in the 286
cream (Fig. 2, Panel B). 287
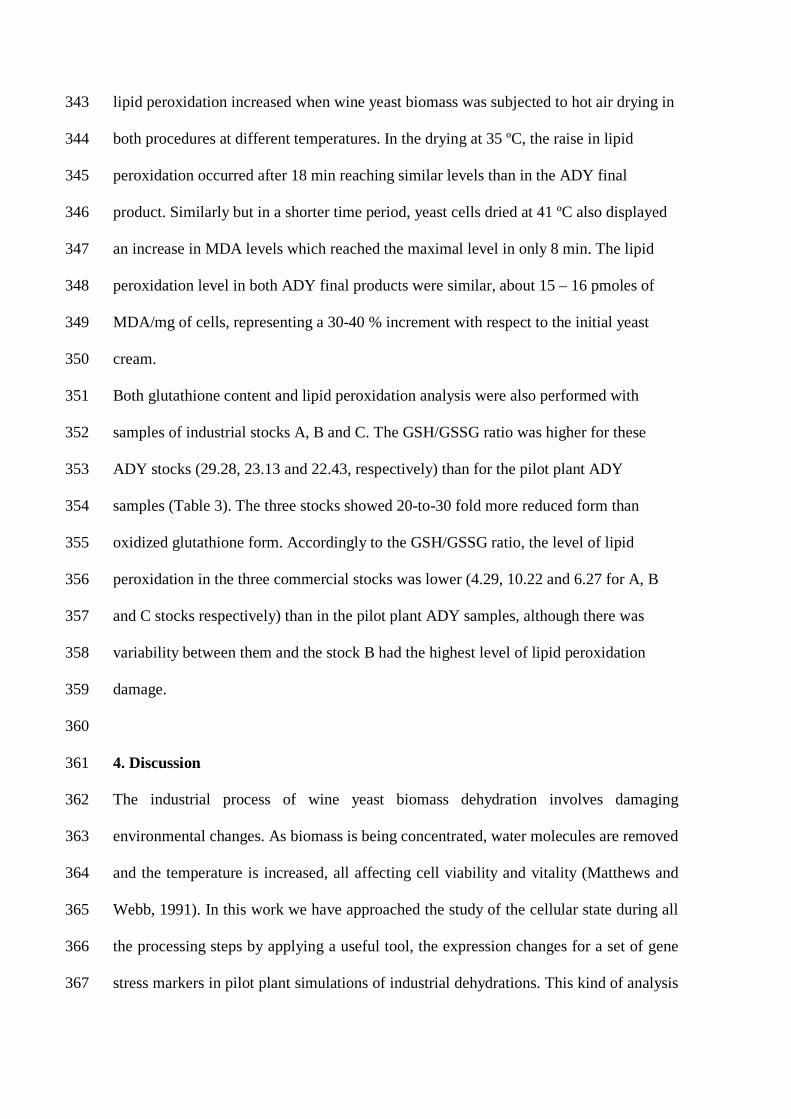
An equivalent study of gene marker expression was applied to the commercial ADY A, 288
B and C stocks. Because biomass yield and fermentative capacity of the ADY pilot and 289
industrial plants were similar, the cream yeast of the pilot plant was used to normalize 290
the mRNA levels of industrial stocks. Then, these levels were compared to those 291
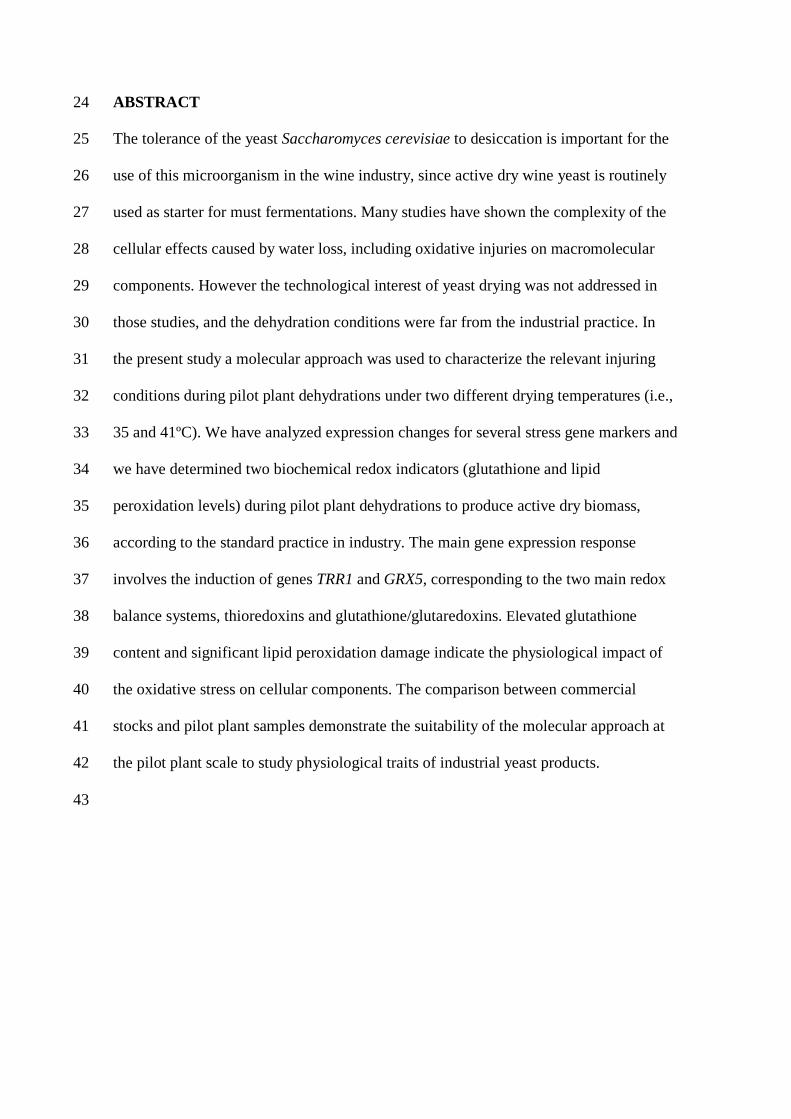
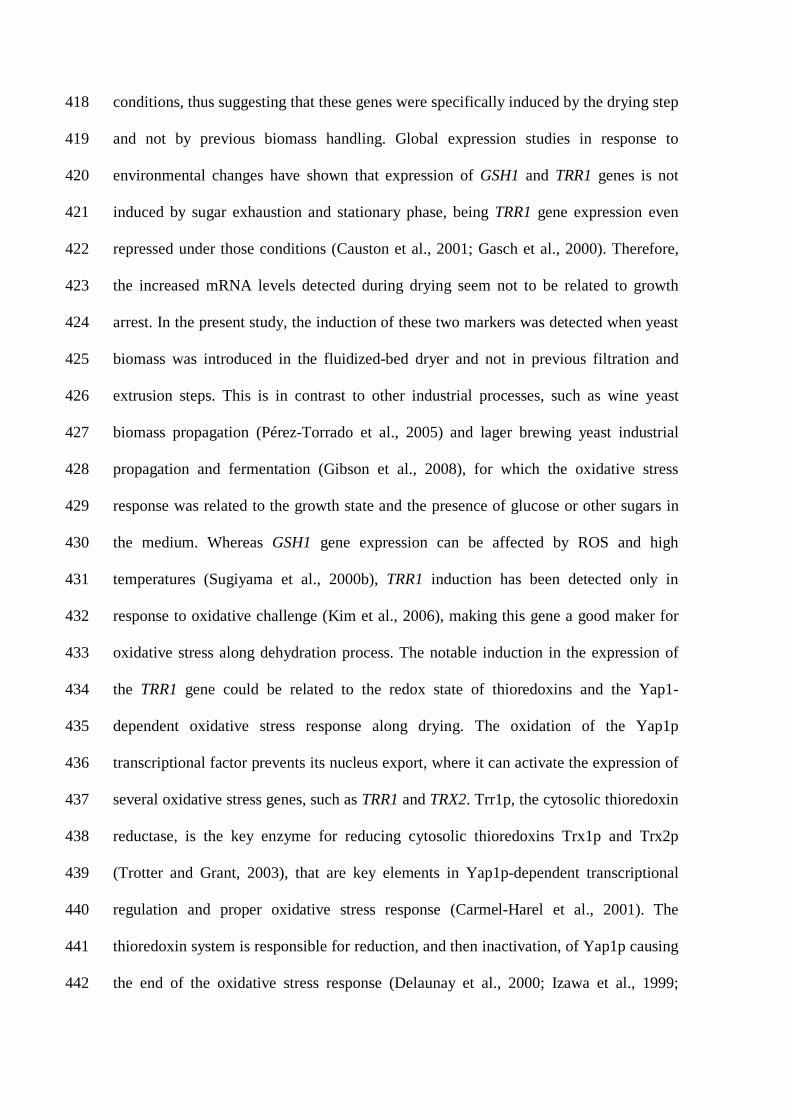
obtained during the pilot plant desiccation process. As shown in Figure 3 (Panel A) 292
mRNA levels for the induced stress gene markers in industrial stocks were higher than 293
in pilot plant ADY (see Fig. 2), and some gene induction differences were detected 294
among the three industrial stocks. Interestingly, we observed more than 4-fold increase 295
of GPD1 gene expression in all three industrial stocks, a 6-fold increase of GSH1 gene 296
in stocks A and B, similarly to pilot plant, and 5-fold induction in STI1 gene but only in 297
stock C. 298
299
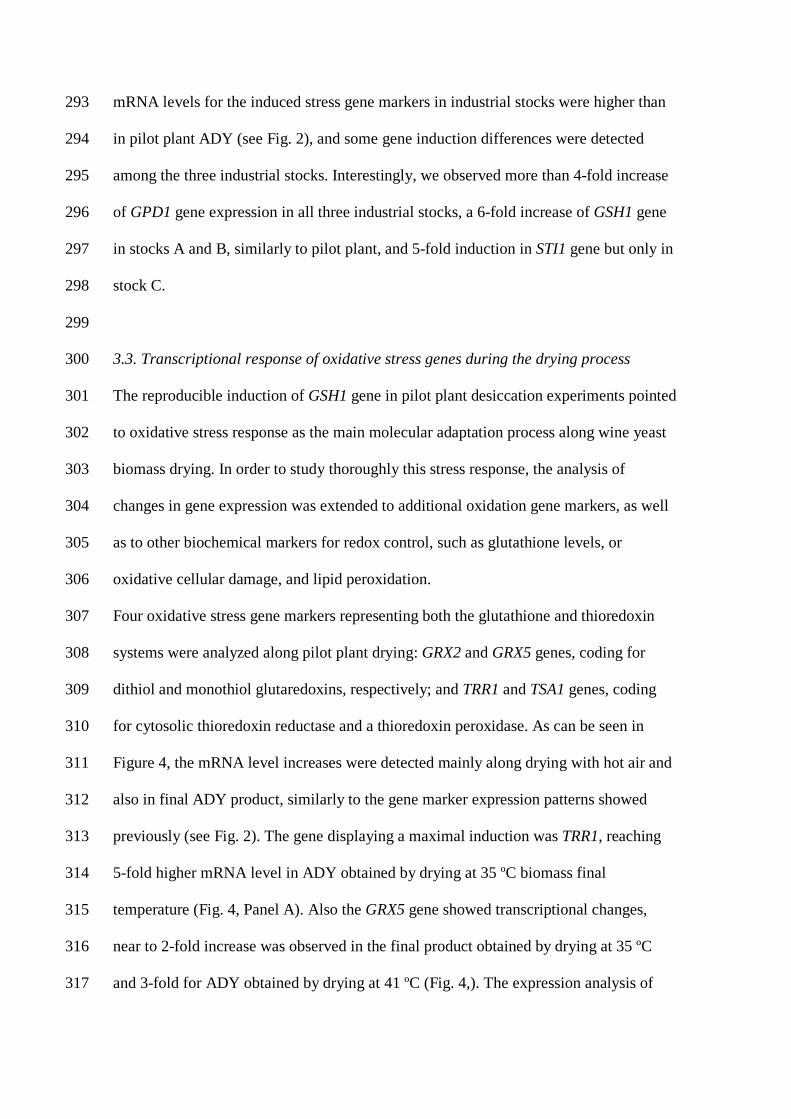
3.3. Transcriptional response of oxidative stress genes during the drying process 300
The reproducible induction of GSH1 gene in pilot plant desiccation experiments pointed 301
to oxidative stress response as the main molecular adaptation process along wine yeast 302
biomass drying. In order to study thoroughly this stress response, the analysis of 303
changes in gene expression was extended to additional oxidation gene markers, as well 304
as to other biochemical markers for redox control, such as glutathione levels, or 305
oxidative cellular damage, and lipid peroxidation. 306
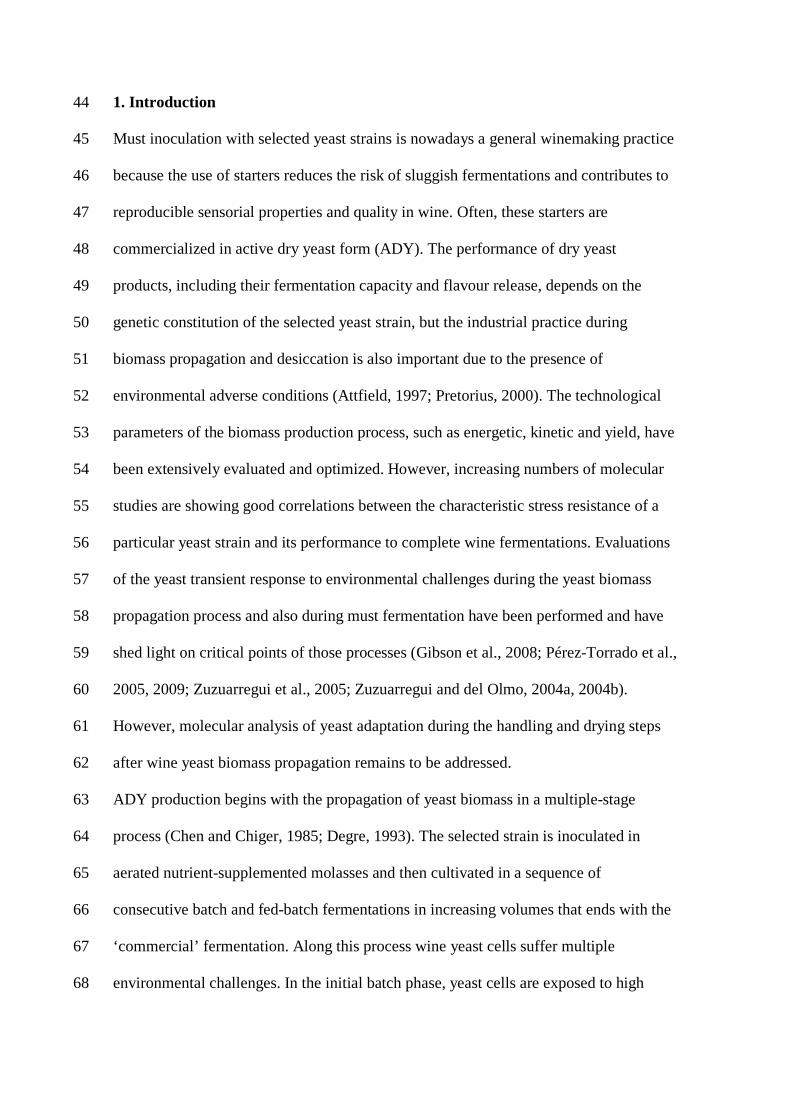
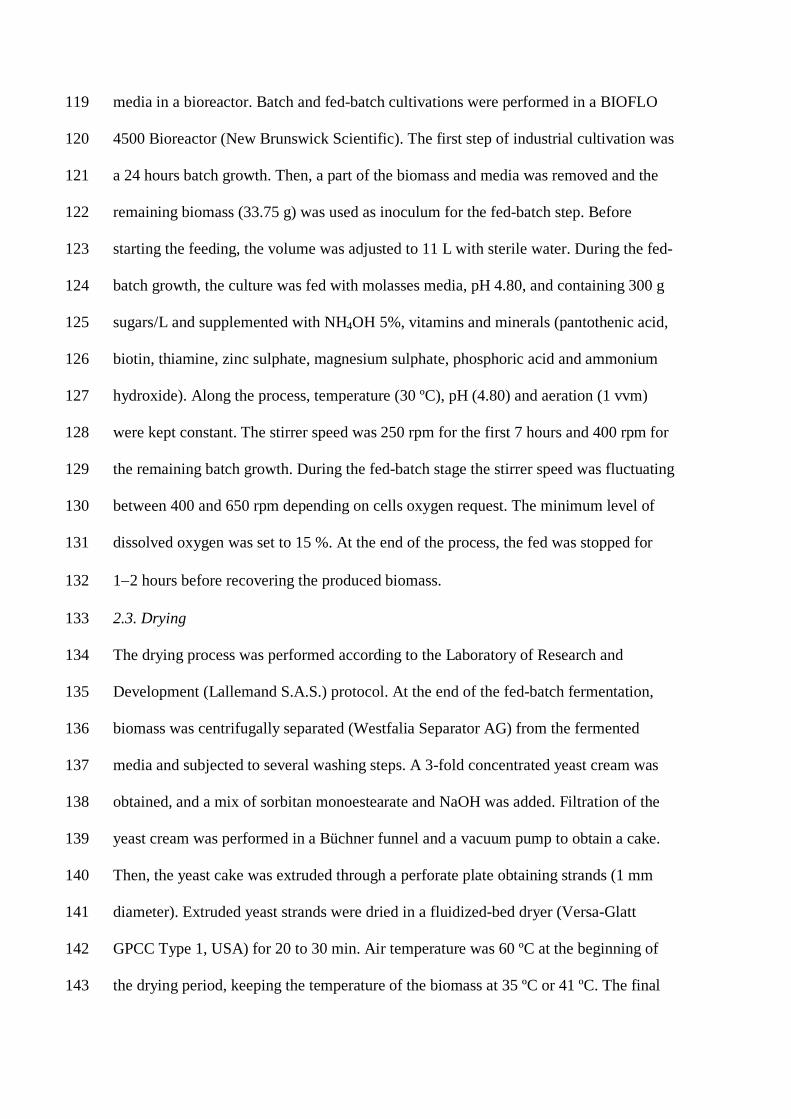
Four oxidative stress gene markers representing both the glutathione and thioredoxin 307
systems were analyzed along pilot plant drying: GRX2 and GRX5 genes, coding for 308
dithiol and monothiol glutaredoxins, respectively; and TRR1 and TSA1 genes, coding 309
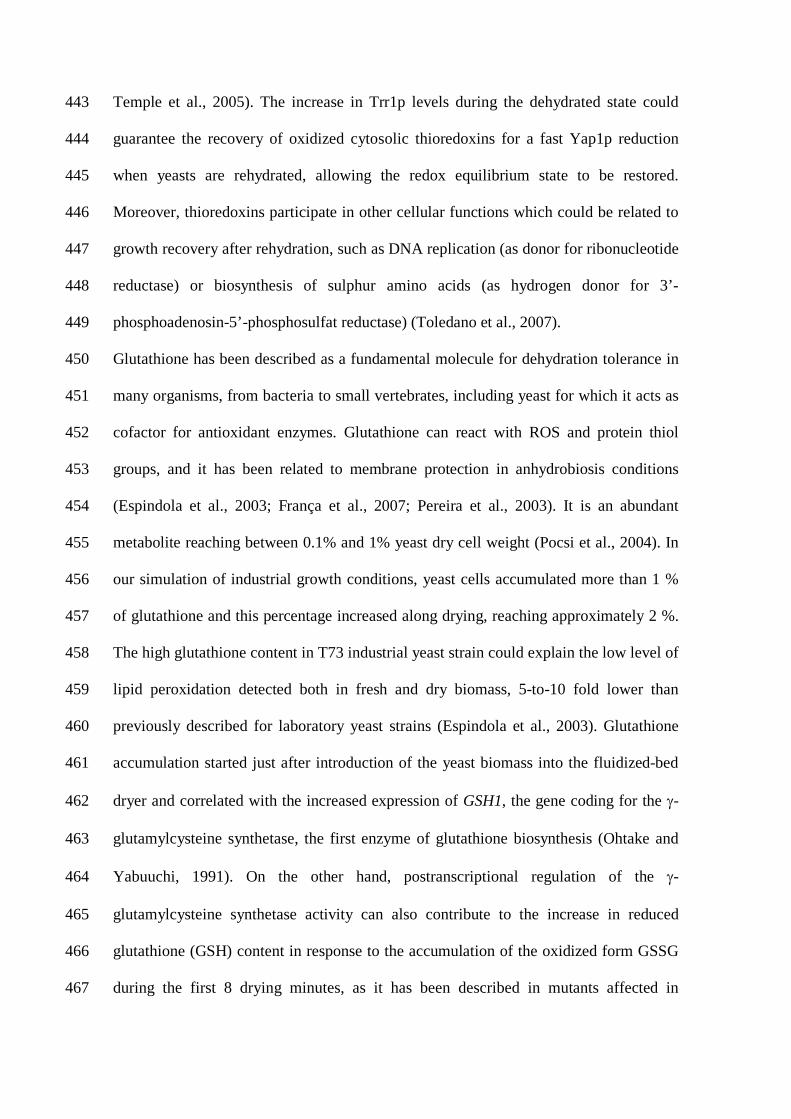
for cytosolic thioredoxin reductase and a thioredoxin peroxidase. As can be seen in 310
Figure 4, the mRNA level increases were detected mainly along drying with hot air and 311
also in final ADY product, similarly to the gene marker expression patterns showed 312
previously (see Fig. 2). The gene displaying a maximal induction was TRR1, reaching 313
5-fold higher mRNA level in ADY obtained by drying at 35 ºC biomass final 314
temperature (Fig. 4, Panel A). Also the GRX5 gene showed transcriptional changes, 315
near to 2-fold increase was observed in the final product obtained by drying at 35 ºC 316
and 3-fold for ADY obtained by drying at 41 ºC (Fig. 4,). The expression analysis of 317
oxidative stress markers was also carried out for the industrial stocks A, B and C (Fig. 318
3, Panel B), and the elevated expression of the TRR1 gene was again the most important 319
induction, close to a 8-fold rise in stock B. 320
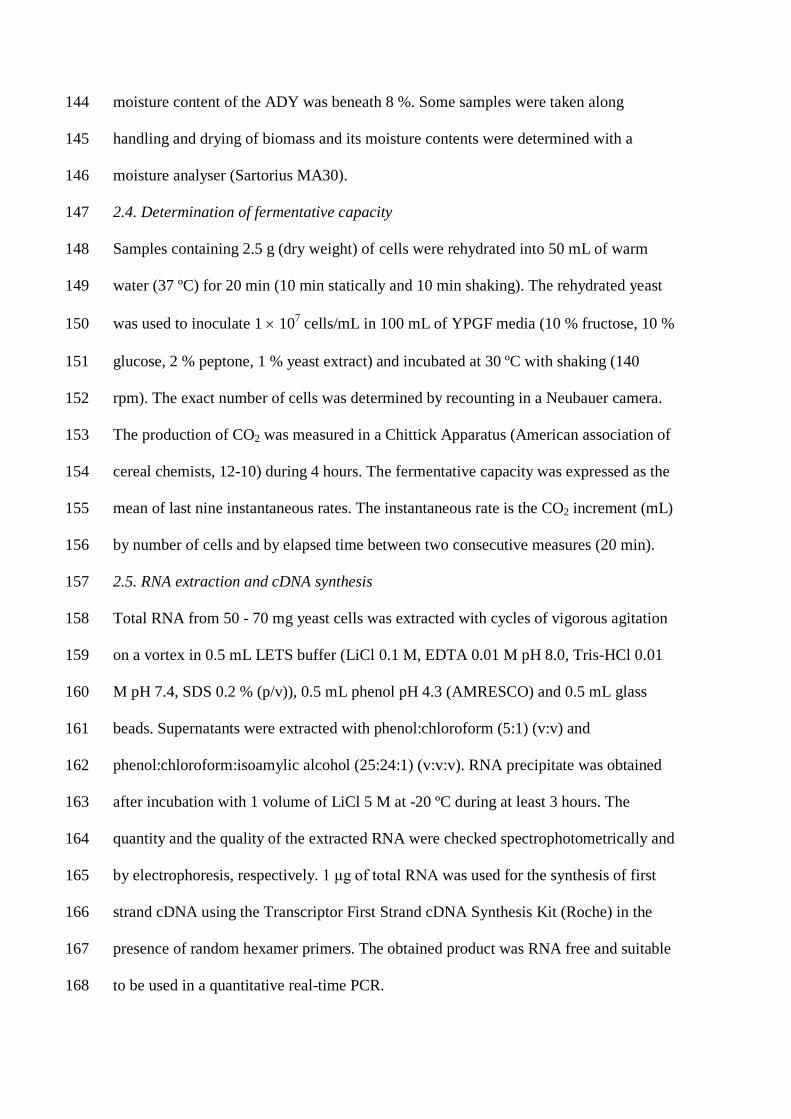
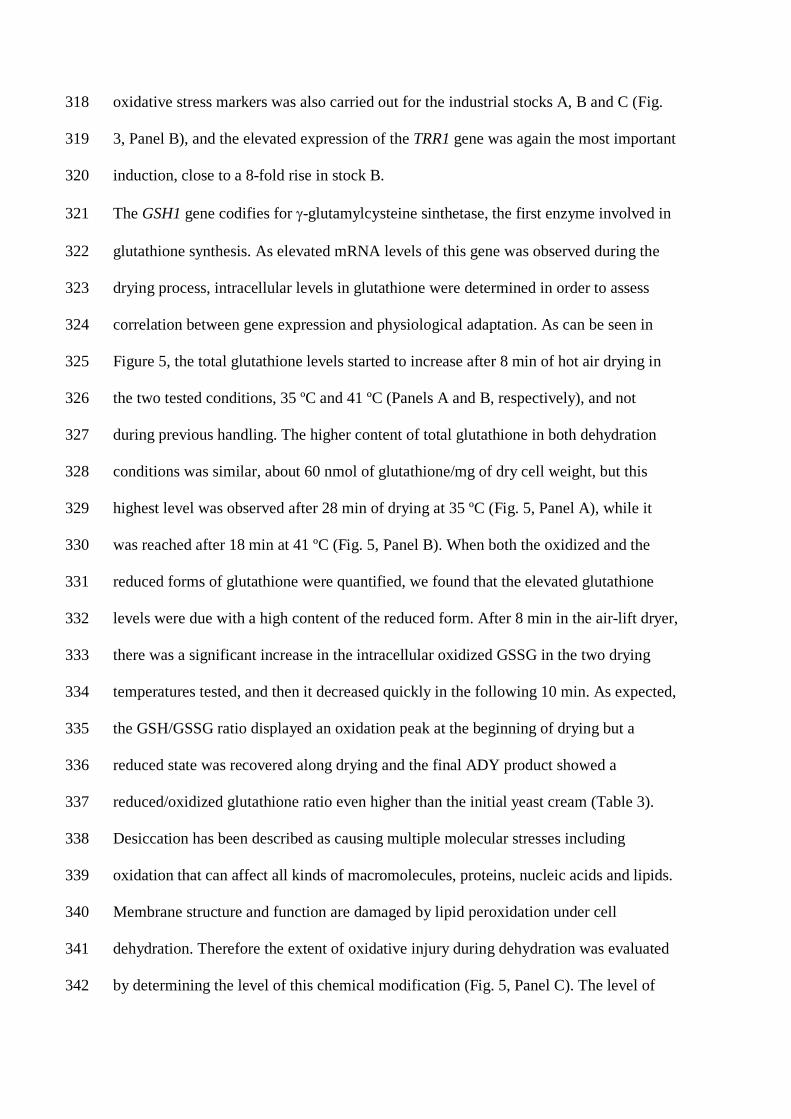
The GSH1 gene codifies for γ-glutamylcysteine sinthetase, the first enzyme involved in 321
glutathione synthesis. As elevated mRNA levels of this gene was observed during the 322
drying process, intracellular levels in glutathione were determined in order to assess 323
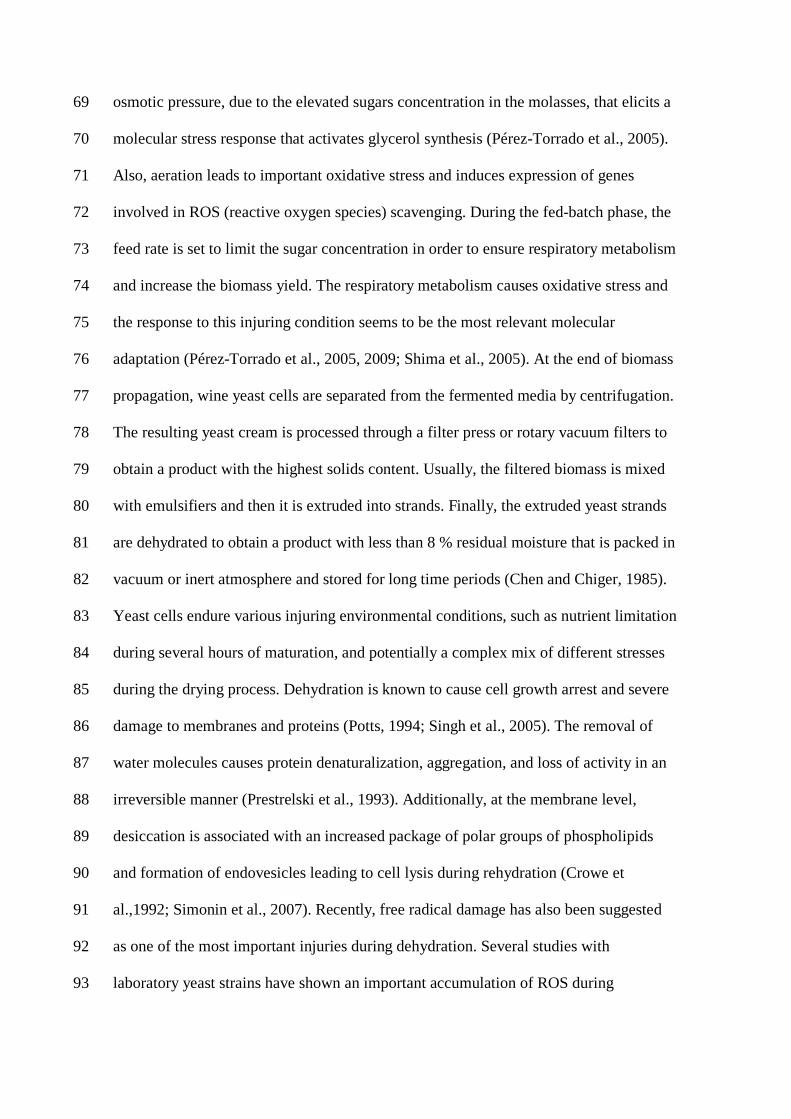
correlation between gene expression and physiological adaptation. As can be seen in 324
Figure 5, the total glutathione levels started to increase after 8 min of hot air drying in 325
the two tested conditions, 35 ºC and 41 ºC (Panels A and B, respectively), and not 326
during previous handling. The higher content of total glutathione in both dehydration 327
conditions was similar, about 60 nmol of glutathione/mg of dry cell weight, but this 328
highest level was observed after 28 min of drying at 35 ºC (Fig. 5, Panel A), while it 329
was reached after 18 min at 41 ºC (Fig. 5, Panel B). When both the oxidized and the 330
reduced forms of glutathione were quantified, we found that the elevated glutathione 331
levels were due with a high content of the reduced form. After 8 min in the air-lift dryer, 332
there was a significant increase in the intracellular oxidized GSSG in the two drying 333
temperatures tested, and then it decreased quickly in the following 10 min. As expected, 334
the GSH/GSSG ratio displayed an oxidation peak at the beginning of drying but a 335
reduced state was recovered along drying and the final ADY product showed a 336
reduced/oxidized glutathione ratio even higher than the initial yeast cream (Table 3). 337
Desiccation has been described as causing multiple molecular stresses including 338
oxidation that can affect all kinds of macromolecules, proteins, nucleic acids and lipids. 339
Membrane structure and function are damaged by lipid peroxidation under cell 340
dehydration. Therefore the extent of oxidative injury during dehydration was evaluated 341
by determining the level of this chemical modification (Fig. 5, Panel C). The level of 342
lipid peroxidation increased when wine yeast biomass was subjected to hot air drying in 343
both procedures at different temperatures. In the drying at 35 ºC, the raise in lipid 344
peroxidation occurred after 18 min reaching similar levels than in the ADY final 345
product. Similarly but in a shorter time period, yeast cells dried at 41 ºC also displayed 346
an increase in MDA levels which reached the maximal level in only 8 min. The lipid 347
peroxidation level in both ADY final products were similar, about 15 – 16 pmoles of 348
MDA/mg of cells, representing a 30-40 % increment with respect to the initial yeast 349
cream. 350
Both glutathione content and lipid peroxidation analysis were also performed with 351
samples of industrial stocks A, B and C. The GSH/GSSG ratio was higher for these 352
ADY stocks (29.28, 23.13 and 22.43, respectively) than for the pilot plant ADY 353
samples (Table 3). The three stocks showed 20-to-30 fold more reduced form than 354
oxidized glutathione form. Accordingly to the GSH/GSSG ratio, the level of lipid 355
peroxidation in the three commercial stocks was lower (4.29, 10.22 and 6.27 for A, B 356
and C stocks respectively) than in the pilot plant ADY samples, although there was 357
variability between them and the stock B had the highest level of lipid peroxidation 358
damage. 359
360
4. Discussion 361
The industrial process of wine yeast biomass dehydration involves damaging 362
environmental changes. As biomass is being concentrated, water molecules are removed 363
and the temperature is increased, all affecting cell viability and vitality (Matthews and 364
Webb, 1991). In this work we have approached the study of the cellular state during all 365
the processing steps by applying a useful tool, the expression changes for a set of gene 366
stress markers in pilot plant simulations of industrial dehydrations. This kind of analysis 367
has been often used to study the physiological state and yeast stress responses in 368
industrial processes (Higgins et al., 2003, Pérez-Torrado et al., 2002a, 2005, 2009; Riou 369
et al., 1997). In previous gene markers studies, an important osmotic stress was decribed 370
at the beginning of vinification, showed by the transcriptional induction of the GPD1 371
gene marker (Pérez-Torrado et al., 2002a; Zuzuarregui et al., 2005). The correlation 372
between stress resistance, risk of sluggish fermentation and HSP12 gene expression in 373
different wine yeast strains (Ivorra et al., 1999); and also the existence of oxidative 374
stress during wine yeast biomass production, indicated by TRX2 gene induction 375
depended on the strong aeration (Pérez-Torrado et al., 2005, 2009). 376
Recent studies on dehydration conditions in lab strains have also showed the existence 377
of oxidation changes and sensitivity to drying was correlated to oxidative stress 378
(Espindola et al., 2003; França et al., 2005, 2007; Pereira et al., 2003). In the present 379
study, molecular markers of this oxidative stress response along handling and drying 380
conditions simulating the industrial desiccation process of the wine yeast strain T73, 381
were described. This approach was relevant for assessing the performance of ADY. Due 382
to the particular conditions of desiccation, in which no cell growth occurs, the choice of 383
reference gene for normalization of mRNA level is difficult. Three genes were selected 384
for this purpose, two generally accepted reference genes (ACT1 and RDN18) and 385
HSP12, a stress response gene which expression is high and relatively constant along 386
dehydration (data not shown). By using this triple normalization quantitative differences 387
in transcriptional induction are reduced with respect to the values obtained when a 388
single normalizing gene is used. The inductions of gene marker expression in the wine 389
yeast strain T73 during desiccation were generally moderate although statistically 390
significant in some steps, such as hot air drying and final product. These results were 391
expected as fresh yeast biomass was obtained simulating the industrial growth 392
conditions, where cells are subjected to batch and fed-batch cultivation steps and then to 393
a maturation step. The purpose of this maturation step is the complete consumption of 394
residual glucose by yeasts, that end up in a stationary growth state where the expression 395
of several stress genes is induced, enhancing the resistance of yeast cells to stressful 396
conditions (Causton et al., 2001; De Risi et al., 1997; Gasch et al., 2000). The gene 397
marker expression patterns observed were similar in both drying conditions (35 and 41 398
ºC), except for the induction of the STI1 gene, detected only when yeast biomass 399
reached 41 ºC during drying. This differential induction of the STI1 gene was expected 400
because the induction of this gene was already detected at 39 ºC in previous analysis 401
with the same strain in laboratory conditions (Pérez-Torrado et al., 2005). Another 402
expected result was the induction of the osmotic stress marker GPD1, due to the water 403
loss. However, despite that yeast biomass lost approximately 95 % of water content 404
during this dehydration process, GPD1 induction was not as important as previously 405
observed in lab yeast strains under osmotic stress (Pérez-Torrado et al., 2002a). These 406
data are in agreement with the robustness of industrial yeasts strains compared to 407
laboratory strains (Querol et al., 2003), and also with the well-known relevance of 408
biomass propagation conditions to confer resistance to subsequent suboptimal 409
conditions (Bisson et al., 2007). Unexpectedly, the highest induction in our first 410
expression analysis was displayed by the stress marker GSH1, pointing out the 411
relevance of the oxidative stress response along wine yeast drying to obtain ADY. This 412
observation was supported i/ by significant inductions of other genes involved in the 413
oxidative stress response (as TRR1 and GRX5), ii/ by the rise in the level of cellular 414
lipid peroxidation, iii/ by increased intracellular glutathione accumulation, and iv/ by a 415
peak of its oxidized form GSSG during the first minutes of drying. 416
The expression profiles of GSH1 and TRR1 genes were similar in the two drying 417
conditions, thus suggesting that these genes were specifically induced by the drying step 418
and not by previous biomass handling. Global expression studies in response to 419
environmental changes have shown that expression of GSH1 and TRR1 genes is not 420
induced by sugar exhaustion and stationary phase, being TRR1 gene expression even 421
repressed under those conditions (Causton et al., 2001; Gasch et al., 2000). Therefore, 422
the increased mRNA levels detected during drying seem not to be related to growth 423
arrest. In the present study, the induction of these two markers was detected when yeast 424
biomass was introduced in the fluidized-bed dryer and not in previous filtration and 425
extrusion steps. This is in contrast to other industrial processes, such as wine yeast 426
biomass propagation (Pérez-Torrado et al., 2005) and lager brewing yeast industrial 427
propagation and fermentation (Gibson et al., 2008), for which the oxidative stress 428
response was related to the growth state and the presence of glucose or other sugars in 429
the medium. Whereas GSH1 gene expression can be affected by ROS and high 430
temperatures (Sugiyama et al., 2000b), TRR1 induction has been detected only in 431
response to oxidative challenge (Kim et al., 2006), making this gene a good maker for 432
oxidative stress along dehydration process. The notable induction in the expression of 433
the TRR1 gene could be related to the redox state of thioredoxins and the Yap1-434
dependent oxidative stress response along drying. The oxidation of the Yap1p 435
transcriptional factor prevents its nucleus export, where it can activate the expression of 436
several oxidative stress genes, such as TRR1 and TRX2. Trr1p, the cytosolic thioredoxin 437
reductase, is the key enzyme for reducing cytosolic thioredoxins Trx1p and Trx2p 438
(Trotter and Grant, 2003), that are key elements in Yap1p-dependent transcriptional 439
regulation and proper oxidative stress response (Carmel-Harel et al., 2001). The 440
thioredoxin system is responsible for reduction, and then inactivation, of Yap1p causing 441
the end of the oxidative stress response (Delaunay et al., 2000; Izawa et al., 1999; 442
Temple et al., 2005). The increase in Trr1p levels during the dehydrated state could 443
guarantee the recovery of oxidized cytosolic thioredoxins for a fast Yap1p reduction 444
when yeasts are rehydrated, allowing the redox equilibrium state to be restored. 445
Moreover, thioredoxins participate in other cellular functions which could be related to 446
growth recovery after rehydration, such as DNA replication (as donor for ribonucleotide 447
reductase) or biosynthesis of sulphur amino acids (as hydrogen donor for 3’-448
phosphoadenosin-5’-phosphosulfat reductase) (Toledano et al., 2007). 449
Glutathione has been described as a fundamental molecule for dehydration tolerance in 450
many organisms, from bacteria to small vertebrates, including yeast for which it acts as 451
cofactor for antioxidant enzymes. Glutathione can react with ROS and protein thiol 452
groups, and it has been related to membrane protection in anhydrobiosis conditions 453
(Espindola et al., 2003; França et al., 2007; Pereira et al., 2003). It is an abundant 454
metabolite reaching between 0.1% and 1% yeast dry cell weight (Pocsi et al., 2004). In 455
our simulation of industrial growth conditions, yeast cells accumulated more than 1 % 456
of glutathione and this percentage increased along drying, reaching approximately 2 %. 457
The high glutathione content in T73 industrial yeast strain could explain the low level of 458
lipid peroxidation detected both in fresh and dry biomass, 5-to-10 fold lower than 459
previously described for laboratory yeast strains (Espindola et al., 2003). Glutathione 460
accumulation started just after introduction of the yeast biomass into the fluidized-bed 461
dryer and correlated with the increased expression of GSH1, the gene coding for the γ-462
glutamylcysteine synthetase, the first enzyme of glutathione biosynthesis (Ohtake and 463
Yabuuchi, 1991). On the other hand, postranscriptional regulation of the γ-464
glutamylcysteine synthetase activity can also contribute to the increase in reduced 465
glutathione (GSH) content in response to the accumulation of the oxidized form GSSG 466
during the first 8 drying minutes, as it has been described in mutants affected in 467
NADPH production and unable to reduce GSSG (Ng et al., 2008). As previously 468
mentioned, GSH1 gene expression, and therefore glutathione synthesis, can be induced 469
by heat (Sugiyama et al., 2000b). This cross-linked response between heat and oxidative 470
stresses has been extensively described in the literature (Moraitis and Curran, 2004, 471
2007): it causes the induction of HSP genes by exposition to oxidant agents, and also 472
the accumulation of antioxidant proteins by exposition to high temperatures (Kim et al., 473
2006; Pereira et al., 2001; Sugiyama et al., 2000a, 2000b). It is difficult to assess the 474
causes for glutathione biosynthesis during the industrial drying process to obtain ADY, 475
because yeast biomass is subjected to the elimination of water molecules by high 476
temperatures, so both the factors could affect the accumulation of ROS. ROS 477
accumulation is likely due to high temperature because it increases mitochondrial 478
respiration whereas water loss favours free radicals formation and increases their 479
concentration (França et al., 2007; Leprince et al., 1994; Sugiyama et al., 2000b). In 480
addition to glutathione biosynthesis, ROS accumulation along drying can be deduced 481
from the increase of GSSG and lipid peroxidation levels (Espindola et al., 2003; França 482
et al., 2005; Pereira et al., 2003). 483
It is worth to note the fast reduction in the GSSG content after the initial peak, might be 484
achieved by the glutathione reductase Glr1p, because the high temperatures used for 485
drying can induce the expression of GLR1 (Kim et al., 2006). In some organism, like 486
lichens and plants, it has been observed that tolerance to dehydration is dependent on 487
the GSH/GSSG ratio and the capability to recover the reduced GSH form during the 488
process (Kranner, 2002; Kranner et al., 2002, 2006). Moreover, the apoptotic effect of 489
ROS accumulation is accentuated in yeast mutants unable to synthesize glutathione 490
(Madeo et al., 1999). Then, the great dehydration tolerance of the industrial T73 wine 491
yeast strain could be related to its capability to quickly reduce GSSG. 492
As mentioned, biochemical or physiological differences were not observed in final 493
biomass obtained by drying at 35 and 41 ºC, and fermentative capacity, trehalose and 494
glutathione contents, and lipid peroxidation levels were similar. The main temperature-495
dependent differences were the induction of the heat stress marker STI1 during 496
dehydration at 41 ºC, and also a higher expression of GRX5 at that temperature, in 497
addition to the earlier appearance of the molecular response. GRX5 expression is not 498
induced by oxidative agents, nor by hyperosmotic stress, or high temperatures 499
(Rodríguez-Manzaneque et al., 1999, 2002). Therefore, it is likely that the induction of 500
GRX5 described in the present study was not a direct consequence of the drying 501
temperature. Instead, it could be related to several consequences of water loss, that is 502
faster at 41 ºC than at 35 ºC. Water loss affects proteins and other cellular structures, 503
such as membranes and organelles, and also metallic ion concentration, and might be 504
driving the transcriptional induction of GRX5. 505
Pilot plant ADY production is a simplification of the real industrial process routinely 506
used by companies to test the performance of new strains and technological changes 507
before undertaking the high scale production. The comparison to real industrial stocks 508
showed some differences, such as lower level of oxidative damage by lipid 509
peroxidation, higher reduced glutathione content, and higher trehalose accumulation, 510
suggesting that pilot plant and industrial scales are not identical. However, those 511
differences are also found between different industrial stocks. When technologically 512
relevant parameters are compared, such as biomass yield (Jorgensen et al., 2002) and 513
fermentative capacity, similar results are obtained in both pilot plant and industrial 514
scales, suggesting that processes are similar enough to yield physiologically equivalent 515
products. Previous studies with baker’s yeasts (Van Hoek et al., 2000) showed a 516
correlation between the specific growth rate along the fed-batch stage and the 517
fermentative capacity of the final product suggesting that the performance of yeast 518
biomass for fermentation is dependent on the growth conditions, then reinforcing the 519
similarity between pilot plant and industrial ADY production scales. 520
Similarly, the stress gene expression analysis and the study of specific oxidative 521
markers gave the same results for both processes, being the same genes (GPD1, STI1, 522
GSH1 and TRR1) induced in all the experiments. These results suggested that pilot plant 523
scale experiments are suitable to study wine yeast biomass propagation and dehydration 524
processes, in despite of their complexity and variability. Further analyses are underway 525
in order to correlate the fitness of different wine yeast strains during ADY production to 526
their oxidative stress response capability. 527
528
Acknowledgements 529
This work was supported by grants AGL2002-01109, AGL 2005-00508 from the 530
“Ministerio de Educación y Ciencia” (MEC), and GRUPOS03/012 and 531
GVACOMP2007-157 from the “Generalitat Valenciana”, and has been developed in 532
part at the Laboratory of Research and Development (Lallemand S.A.S.). E.G. was a 533
fellow of the FPI program of the Ministerio de Educación y Ciencia (Spain). 534
535
References 536
Attfield, P. V., 1997. Stress tolerance: the key to effective strains of industrial baker's 537
yeast. Nature Biotechnology 15, 1351-1357. 538
Bisson, L. F., Karpel, J. E., Ramakrishnan, V.,Joseph L., 2007. Functional genomics of 539
wine yeast Saccharomyces cerevisiae. Advances in Food and Nutrition Research 540
53, 65-121. 541
Buege, J. A., Aust, S. D., 1978. Microsomal lipid peroxidation. Methods in 542
Enzymology 52, 302-310. 543
Bustin, S. A., Benes, V., Garson, J. A., Hellemans, J., Huggett, J., Kubista, M., Mueller, 544
R., Nolan, T., Pfaffl, M. W., Shipley, G. L., Vandesompele, J., Wittwer, C. T., 545
2009. The MIQE Guidelines: Minimum information for publication of 546
quantitative Real-Time PCR experiments. Clinical Chemistry 55, 611-622. 547
Carmel-Harel, O., Stearman, R., Gasch, A. P., Botstein, D., Brown, P. O., Storz, G., 548
2001. Role of thioredoxin reductase in the Yap1p-dependent response to 549
oxidative stress in Saccharomyces cerevisiae. Molecular Microbiology 39, 595-550
605. 551
Causton, H. C., Ren, B., Koh, S. S., Harbison, C. T., Kanin, E., Jennings, E. G., Lee, T. 552
I., True, H. L., Lander, E. S., Young, R. A., 2001. Remodeling of yeast genome 553
expression in response to environmental changes. Molecular Biology of the Cell 554
12, 323-337. 555
Chen, S. L., Chiger, M., 1985. Production of baker's yeast.. In Blanch, H. W., Drew, S., 556
Wang, D. I. C. (Eds.), Comprehensive Biotechnology. Pergamon Press, New 557
York, pp. 429-462. 558
Crowe, J. H., Hoekstra, F. A., Crowe, L. M., 1992. Anhydrobiosis. Annual Review of 559
Physiology 54, 579-599. 560
Degre, R., 1993. Selection and Commercial Cultivation of Wine Yeast and Bacteria. In 561
Fleet, G. H. (Ed.), Wine Microbiology and Biotechnology. Harwood Academic 562
Publishers, pp. 421-447. 563
Delaunay, A., Isnard, A. D., Toledano, M. B., 2000. H2O2 sensing through oxidation of 564
the Yap1 transcription factor. EMBO Journal 19, 5157-5166. 565
1.De Risi, J. L., Iyer, V. R., Brown, P. O., 1997. Exploring the metabolic and 566
genetic control of gene expression on a genomic scale. Science 278, 680-686. 567
Espindola, A. S., Gomes, D. S., Panek, A. D., Eleutherio, E. C., 2003. The role of 568
glutathione in yeast dehydration tolerance. Cryobiology 47, 236-241. 569
França, M. B., Panek, A. D.. Eleutherio, E. C., 2005. The role of cytoplasmic catalase in 570
dehydration tolerance of Saccharomyces cerevisiae. Cell Stress and Chaperones 571
10, 167-170. 572
França, M. B., Panek, A. D., Eleutherio, E. C., 2007. Oxidative stress and its effects 573
during dehydration. Comparative Biochemistry and Physiology. Part A: 574
Molecular and Integrative Physiology 146, 621-631. 575
Gasch, A. P., Spellman, P. T., Kao, C. M., Cármel-Harel, O., Eisen, M. B., Storz, G., 576
Botstein, D., Brown, P. O.. 2000. Genomic expression programs in the response 577
of yeast cells to environmental changes. Molecular Biology of the Cell 11, 4241-578
4257. 579
Gibson, B. R., Lawrence, S. J., Boulton, C. A., Box, W. G., Graham, N. S., Linforth, R. 580
S., Smart, K. A., 2008. The oxidative stress response of a lager brewing yeast 581
strain during industrial propagation and fermentation. FEMS Yeast Research 8, 582
574-585. 583
Griffith, O. W. 1980. Determination of glutathione and glutathione disulfide using 584
glutathione reductase and 2-vinylpyridine. Analytical Biochemistry 106, 207-585
212. 586
Higgins, V. J., Rogers, P. J., Dawes, I. W., 2003. Application of genome-wide 587
expression analysis to identify molecular markers useful in monitoring industrial 588
fermentations. Applied and Environmental Microbiology 69, 7535-7540. 589
Ivorra, C., Pérez-Ortín, J. E., del Olmo, M., 1999. An inverse correlation between stress 590
resistance and stuck fermentations in wine yeasts. A molecular study. 591
Biotechnology and Bioenginering 64, 698-708. 592
Izawa, S., Maeda, K., Sugiyama, K., Mano, J., Inoue, Y., Kimura. A., 1999. 593
Thioredoxin deficiency causes the constitutive activation of Yap1, an AP-1-like 594
transcription factor in Saccharomyces cerevisiae. Journal of Biological 595
Chemistry 274, 28459-28465. 596
Jorgensen, H., Olsson, L., Ronnow, B., Palmqvist, E. A., 2002. Fed-batch cultivation of 597
baker's yeast followed by nitrogen or carbon starvation: effects on fermentative 598
capacity and content of trehalose and glycogen. Applied Microbiology and 599
Biotechnology 59, 310-317. 600
Kim, I. S., Moon, H. Y., Yun, H. S.. Jin, I., 2006. Heat shock causes oxidative stress 601
and induces a variety of cell rescue proteins in Saccharomyces cerevisiae 602
KNU5377. Journal of Microbiology 44, 492-501. 603
Kranner, I., 2002. Glutathione status correlates with different degrees of desiccation 604
tolerance in three lichens. New Phytologist 154, 451-460. 605
Kranner, I., Beckett, R. P., Wornik, S., Zorn, M., Pfeifhofer, H. W., 2002. Revival of a 606
resurrection plant correlates with its antioxidant status. Plant Journal 31, 13-24. 607
Kranner, I., Birtic, S., Anderson, K. M., Pritchard, H. W., 2006. Glutathione half-cell 608
reduction potential: a universal stress marker and modulator of programmed cell 609
death? Free Radicals in Biology and Medicine 40, 2155-2165. 610
Leprince, O., Atherton, N. M., Deltour, R., Hendry, G., 1994. The Involvement of 611
Respiration in Free Radical Processes during Loss of Desiccation Tolerance in 612
Germinating Zea mays L. (An Electron Paramagnetic Resonance Study). Plant 613
Physiology 104, 1333-1339. 614
Madeo, F., Frohlich, E., Ligr, M., Grey, M., Sigrist, S. J., Wolf, D. H., Frohlich, K. U., 615
1999. Oxygen stress: a regulator of apoptosis in yeast. Journal of Cell Biology 616
145, 757-767. 617
Matthews, T. M., Webb, C., 1991. Culture systems. In Tuite, M. F., Oliver, S. G. (Eds.), 618
Biotechnolgy Handbooks 4. Saccharomyces. Plenum Press, pp. 249-282 619
Moraitis, C., Curran, B. P., 2004. Reactive oxygen species may influence the heat shock 620
response and stress tolerance in the yeast Saccharomyces cerevisiae. Yeast 21, 621
313-323. 622
Moraitis, C., Curran, B. P., 2007. Can the different heat shock response thresholds 623
found in fermenting and respiring yeast cells be attributed to their differential 624
redox states? Yeast 24, 653-666. 625
Ng, C. H., Tan, S. X., Perrone, G. G., Thorpe, G. W., Higgins, V. J., Dawes, I. W., 626
2008. Adaptation to hydrogen peroxide in Saccharomyces cerevisiae: the role of 627
NADPH-generating systems and the SKN7 transcription factor. Free Radicals in 628
Biology and Medicine 44, 1131-1145. 629
Ohtake, Y., Yabuuchi, S., 1991. Molecular cloning of the gamma-glutamylcysteine 630
synthetase gene of Saccharomyces cerevisiae. Yeast 7, 953-961. 631
Parrou, J. L., François, J., 1997. A simplified procedure for a rapid and reliable assay of 632
both glycogen and trehalose in whole yeast cells. Analytical Biochemistry 248, 633
186-188. 634
Pereira, M. D., Eleutherio, E. C., Panek, A. D., 2001. Acquisition of tolerance against 635
oxidative damage in Saccharomyces cerevisiae. BMC Microbiology 1, 11. 636
Pereira, E. J., Panek, A. D., Eleutherio, E. C., 2003. Protection against oxidation during 637
dehydration of yeast. Cell Stress and Chaperones 8, 120-124. 638
Pérez-Torrado, R., Carrasco, P., Aranda, A., Gimeno-Alcañiz, J., Pérez-Ortín, J. E., 639
Matallana, E., del Olmo, M., 2002a. Study of the first hours of microvinification 640
by the use of osmotic stress-response genes as probes. Systematic and Applied 641
Microbiology 25, 153-161. 642
Pérez-Torrado, R., Gimeno-Alcañiz, J. V., Matallana, E., 2002b. Wine yeast strains 643
engineered for glycogen overproduction display enhanced viability under 644
glucose deprivation conditions. Applied and Environmental Microbiology 68, 645
3339-3344. 646
Pérez-Torrado, R., Bruno-Bárcena, J. M., Matallana, E., 2005. Monitoring stress-related 647
genes during the process of biomass propagation of Saccharomyces cerevisiae 648
strains used for wine making. Applied Environmental Microbiology 71, 6831-649
6837. 650
Pérez-Torrado, R., Gómez-Pastor, R., Larsson, C., Matallana, E., 2009. Fermentative 651
capacity of dry active wine yeast requires a specific oxidative stress response 652
during industrial biomass growth. Applied Microbiology and Biotechnology 81, 653
951-960. 654
Pocsi, I., Prade, R. A., Penninckx, M. J., 2004. Glutathione, altruistic metabolite in 655
fungi. Advances in Microbial Physiology 49, 1-76. 656
Potts, M., 1994. Desiccation tolerance of prokaryotes. Microbiological Reviews 58, 657
755-805. 658
Prestrelski, S. J., Tedeschi, N., Arakawa, T., Carpenter, J. F., 1993. Dehydration-659
induced conformational transitions in proteins and their inhibition by stabilizers. 660
Biophysical Journal 65, 661-671. 661
Pretorius, I. S., 2000. Tailoring wine yeast for the new millennium: novel approaches to 662
the ancient art of winemaking. Yeast 16, 675-729. 663
Querol, A., Huerta, T., Barrio, E., Ramón, D., 1992. Dry yeast strain for use in 664
fermentation of Alicante wines: selection and DNA patterns. Journal of Food 665
Science 57, 183-185. 666
Querol, A., Fernández-Espinar, M. T., del Olmo, M. , Barrio, E., 2003. Adaptive 667
evolution of wine yeast. International Journal of Food Microbiology 86, 3-10. 668
Riou, C., Nicaud, J. M., Barre, P., Gaillardin, C., 1997. Stationary-phase gene 669
expression in Saccharomyces cerevisiae during wine fermentation. Yeast 13, 670
903-915. 671
Rodríguez-Manzaneque, M. T., Ros, J., Cabiscol, E., Sorribas, A., Herrero, E., 1999. 672
Grx5 glutaredoxin plays a central role in protection against protein oxidative 673
damage in Saccharomyces cerevisiae. Molecular and Cellular Biology 19, 8180-674
8190. 675
Rodríguez-Manzaneque, M. T., Tamarit, J., Belli, G., Ros, J., Herrero, E., 2002. Grx5 is 676
a mitochondrial glutaredoxin required for the activity of iron/sulfur enzymes. 677
Molecular Biology of the Cell 13, 1109-1121. 678
Shima, J., Kuwazaki, S., Tanaka, F., Watanabe, H., Yamamoto, H., Nakajima, R., 679
Tokashiki, T., Tamura, H., 2005. Identification of genes whose expressions are 680
enhanced or reduced in baker's yeast during fed-batch culture process using 681
molasses medium by DNA microarray analysis. International Journal of Food 682
Microbiology 102, 63-71. 683
Simonin, H., Beney, L., Gervais P., 2007. Sequence of occurring damages in yeast 684
plasma membrane during dehydration and rehydration: mechanisms of cell 685
death. Biochimica et Biophysica Acta 1768, 1600-1610. 686
Singh, J., Kumar, D., Ramakrishnan, N., Singhal, V., Jervis, J., Garst, J. F., Slaughter, 687
S. M., DeSantis, A. M., Potts, M., Helm, R. F., 2005. Transcriptional response 688
of Saccharomyces cerevisiae to desiccation and rehydration. Applied and 689
Environmental Microbiology 71, 8752-8763. 690
Sugiyama, K., Izawa, S., Inoue, Y., 2000a. The Yap1p-dependent induction of 691
glutathione synthesis in heat shock response of Saccharomyces cerevisiae. 692
Journal of Biological Chemistry 275, 5535-15540. 693
Sugiyama, K., Kawamura, A., Izawa, S., Inoue, Y., 2000b. Role of glutathione in heat-694
shock-induced cell death of Saccharomyces cerevisiae. Biochemical Journal 695
352, 71-78. 696
Temple, M. D., Perrone, G. G., Dawes, I. W., 2005. Complex cellular responses to 697
reactive oxygen species. Trends in Cellular Biology 15, 319-326. 698
Tietze, F., 1969. Enzymic method for quantitative determination of nanogram amounts 699
of total and oxidized glutathione: applications to mammalian blood and other 700
tissues. Analytical Biochemistry 27, 502-522. 701
Toledano, M. B., Kumar, C., Le, M. N., Spector, D., Tacnet, F., 2007. The system 702
biology of thiol redox system in Escherichia coli and yeast: differential 703
functions in oxidative stress, iron metabolism and DNA synthesis. FEBS Letters 704
581, 3598-3607. 705
Trotter, E. W., Grant, C. M., 2003. Non-reciprocal regulation of the redox state of the 706
glutathione-glutaredoxin and thioredoxin systems. EMBO Reports 4, 184-188. 707
Van Hoek, P., de Hulster E., van Dijken, J. P., Pronk, J. T., 2000. Fermentative capacity 708
in high-cell-density fed-batch cultures of baker's yeast. Biotechnology and 709
Bioengineering 68, 517-523. 710
Vandesompele, J., De Preter, K., Pattyn, F., Poppe, B., Van Roy, N., De Paepe, A., 711
Speleman, F., 2002. Accurate normalization of real-time quantitative RT-PCR 712
data by geometric averaging of multiple internal control genes. Genome Biology 713
3, RESEARCH0034. 714
Zuzuarregui, A., del Olmo, M., 2004a. Expression of stress response genes in wine 715
strains with different fermentative behavior. FEMS Yeast Research 4, 699-710. 716
Zuzuarregui, A., del Olmo, M., 2004b. Analyses of stress resistance under laboratory 717
conditions constitute a suitable criterion for wine yeast selection. Antonie Van 718
Leeuwenhoek 85, 271-280. 719
Zuzuarregui, A., Carrasco, P., Palacios, A., Julien, A., del Olmo, M., 2005. Analysis of 720
the expression of some stress induced genes in several commercial wine yeast 721
strains at the beginning of vinification. Journal of Applied Microbiology 98, 722
299-307. 723
Figure legends 724
Fig. 1. Moisture content in yeast biomass at different phases of handling and drying of 725
wine yeast T73 to obtain Active Dry Yeast (ADY). The yeast biomass was obtained and 726
handled in plant pilot production as described in Materials and Methods. Drying in air-727
lift dryer was performed keeping the yeast temperature at 35 ºC (black bars) or 41 ºC 728
(white bars) to obtain the final ADY product with moisture content beneath 8 %. The 729
residual moisture was determined in function of weight loss into a moisture analyser at 730
110 ºC until constant weight was reached. The mean and the standard error correspond 731
to four independent experiments. Significantly different at P < 0.01 (a). 732
Fig. 2. Pattern of gene markers expression during handling and drying of wine yeast 733
T73 to obtain ADY at pilot plant level. The expression of gene markers HSP12, STI1, 734
GPD1, GSH1 and TRX2 is shown during drying processes keeping the yeast 735
temperature at 35 ºC (Panel A) or 41 ºC (Panel B). Error bars stand for standard errors. 736
Significantly different from the cream at P-value < 0.01 (a), at P-value < 0.05 (b). 737
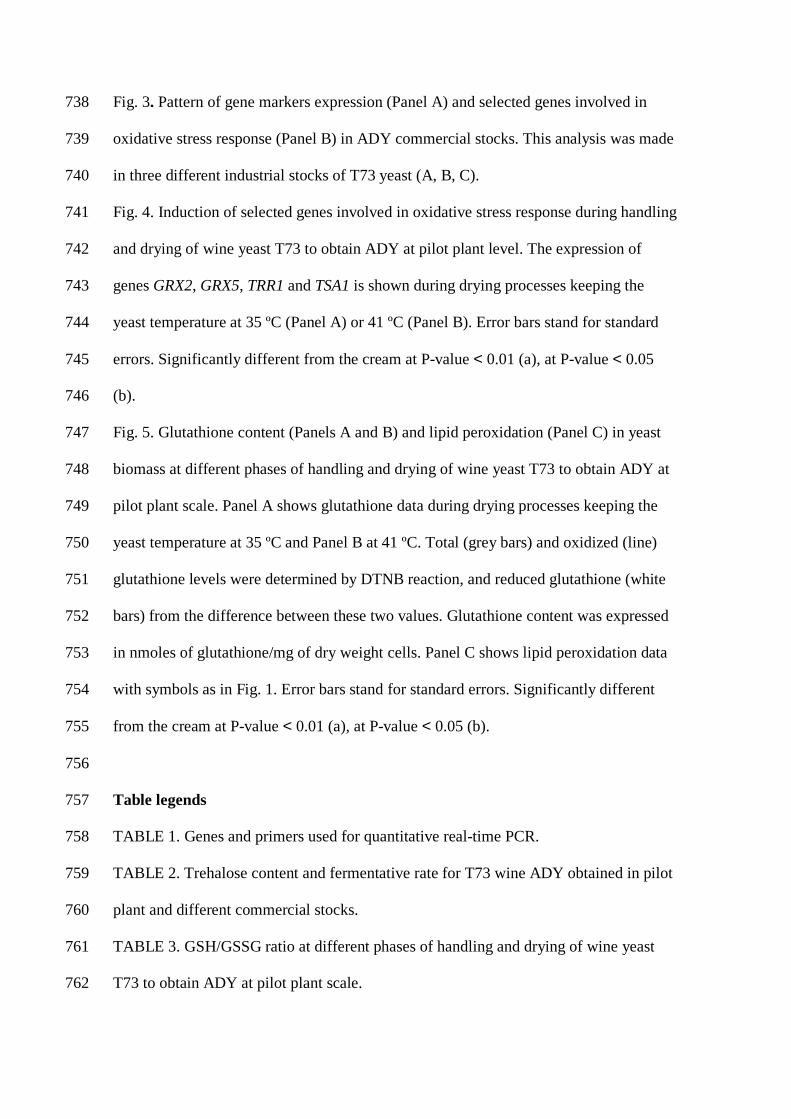
Fig. 3. Pattern of gene markers expression (Panel A) and selected genes involved in 738
oxidative stress response (Panel B) in ADY commercial stocks. This analysis was made 739
in three different industrial stocks of T73 yeast (A, B, C). 740
Fig. 4. Induction of selected genes involved in oxidative stress response during handling 741
and drying of wine yeast T73 to obtain ADY at pilot plant level. The expression of 742
genes GRX2, GRX5, TRR1 and TSA1 is shown during drying processes keeping the 743
yeast temperature at 35 ºC (Panel A) or 41 ºC (Panel B). Error bars stand for standard 744
errors. Significantly different from the cream at P-value < 0.01 (a), at P-value < 0.05 745
(b). 746
Fig. 5. Glutathione content (Panels A and B) and lipid peroxidation (Panel C) in yeast 747
biomass at different phases of handling and drying of wine yeast T73 to obtain ADY at 748
pilot plant scale. Panel A shows glutathione data during drying processes keeping the 749
yeast temperature at 35 ºC and Panel B at 41 ºC. Total (grey bars) and oxidized (line) 750
glutathione levels were determined by DTNB reaction, and reduced glutathione (white 751
bars) from the difference between these two values. Glutathione content was expressed 752
in nmoles of glutathione/mg of dry weight cells. Panel C shows lipid peroxidation data 753
with symbols as in Fig. 1. Error bars stand for standard errors. Significantly different 754
from the cream at P-value < 0.01 (a), at P-value < 0.05 (b). 755
756
Table legends 757
TABLE 1. Genes and primers used for quantitative real-time PCR. 758
TABLE 2. Trehalose content and fermentative rate for T73 wine ADY obtained in pilot 759
plant and different commercial stocks. 760
TABLE 3. GSH/GSSG ratio at different phases of handling and drying of wine yeast 761
T73 to obtain ADY at pilot plant scale. 762
TABLE 1. Genes and primers used for quantitative real-time PCR. 763 764
Primer Sequence (5′−3′) Gene Amplicon size (bp)a
Amplification efficiency b
18S.F TTGCGATAACGAACGAGACC RDN18
95 1.919 18S.R CATCGGCTTGAAACCGATAG ACT1.F CATGTTCCCAGGTATTGCCG ACT1
51 2.062
ACT1.R GCCAAAGCGGTGATTTCCT GPD1.F GGTGAGATCATCAGATTCGG GPD1
129 1.959
GPD1.R CCTAGCAACCTTGACGTTTC GRX2.F AATCCAAGGCCCTTGTGTTG GRX2
93 1.963
GRX2.R GTACAGTTTTTTGGCCCGAG GRX5.F GACCCAGAGCTACGTGAAG GRX5
119 1.935
GRX5.R CCAGAGCGTGCCATACTTG GSH1.F CCGGACAAAAAGGATTCTCC GSH1
88 1.838
GSH1.R CGGAATACGCAGCGTTCTC HSP12.F TGACAAGGCCGACAAGGTC HSP12
153 2.010
HSP12.R GCGGCTCCCATGTAATCTC STI1.F CGGAGGCGTATGTTAACCC STI1
84 2.108
STI1.R CATTCGGCCAATCACTCTTG TRR1.F GAAACCGATTTGCCAGTCAG TRR1
92 1.959
TRR1.R GCTTCATCAGTGTCGACTTG TRX2.F GCTGAAGTTTCTTCCATGCC TRX2
63 1.976
TRX2.R GACTCTGGTAACCTCCTTAC TSA1.F CCTTGAGATTGGTTGAAGCC TSA1
76 2.012
TSA1.R GCACCTGGAGTCCAGTTAC a bp, base. b Optimal theoretical efficiency value is 2. 765 766 767
768
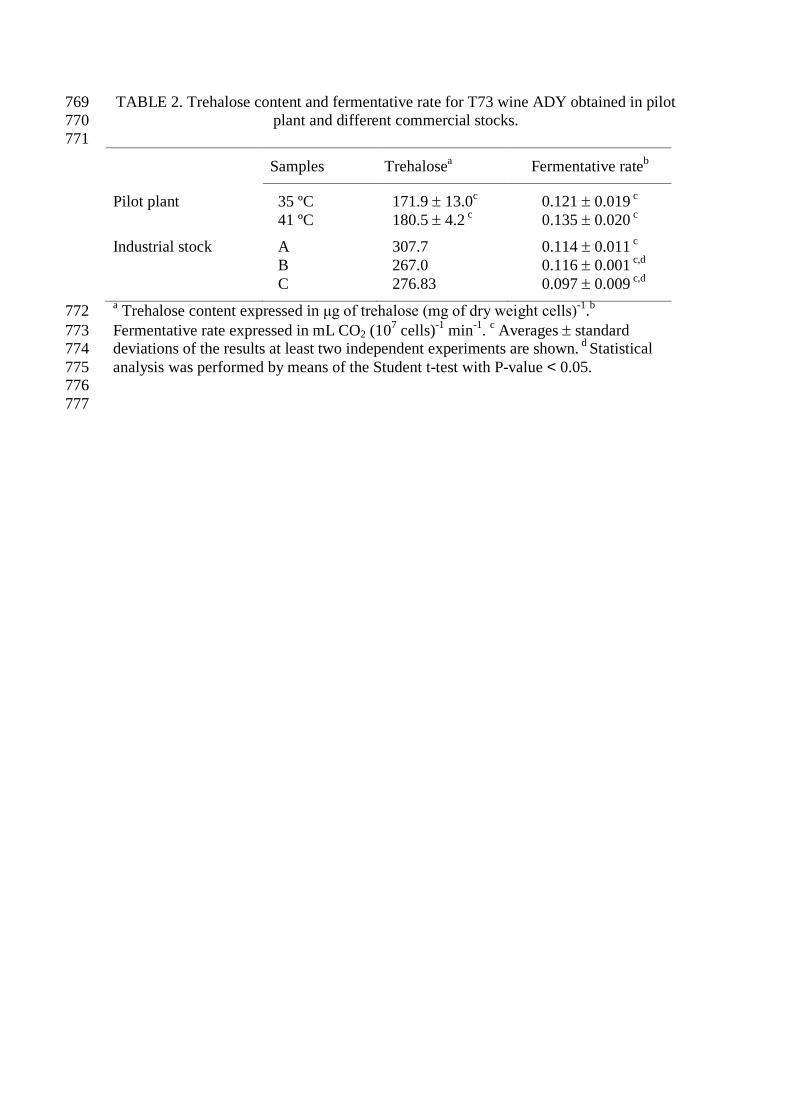
TABLE 2. Trehalose content and fermentative rate for T73 wine ADY obtained in pilot 769 plant and different commercial stocks. 770
771
Samples Trehalosea Fermentative rateb
Pilot plant 35 ºC 171.9 ± 13.0c 0.121 ± 0.019 c 41 ºC 180.5 ± 4.2 c 0.135 ± 0.020 c
Industrial stock A 307.7 0.114 ± 0.011 c B 267.0 0.116 ± 0.001 c,d C 276.83 0.097 ± 0.009 c,d a Trehalose content expressed in μg of trehalose (mg of dry weight cells)-1.b 772 Fermentative rate expressed in mL CO2 (107 cells)-1 min-1. c Averages ± standard 773 deviations of the results at least two independent experiments are shown. d Statistical 774 analysis was performed by means of the Student t-test with P-value < 0.05. 775 776
777
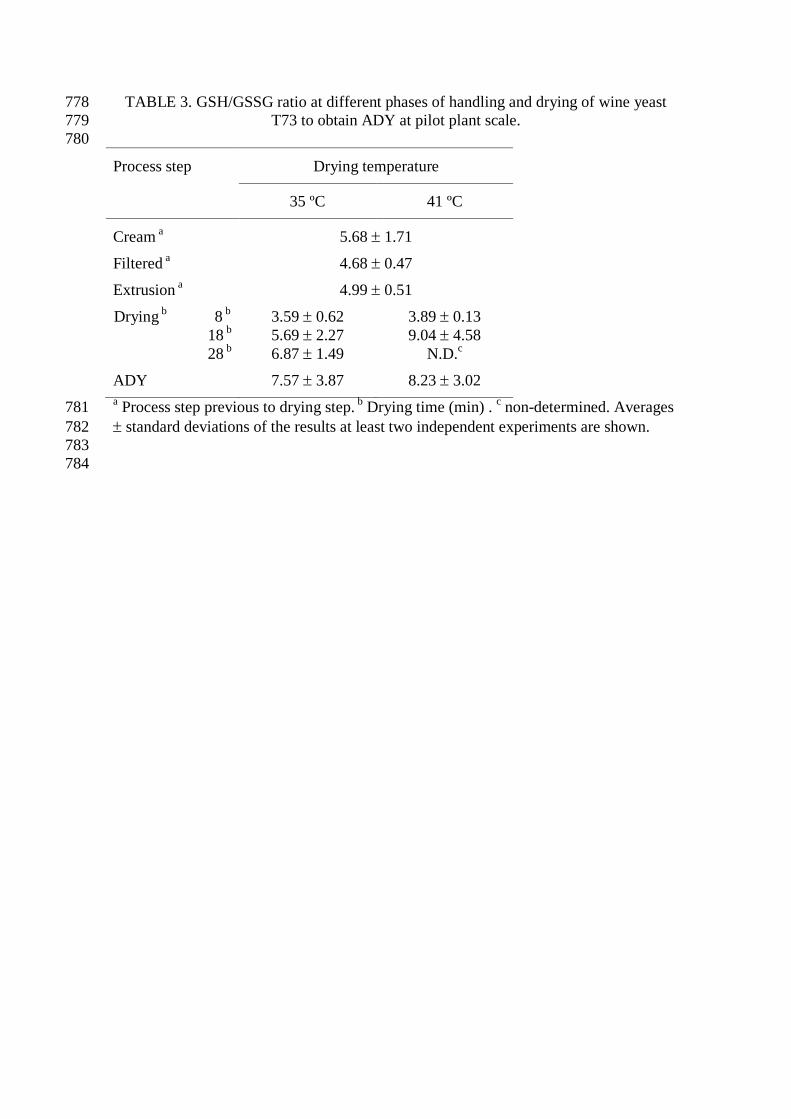
TABLE 3. GSH/GSSG ratio at different phases of handling and drying of wine yeast 778 T73 to obtain ADY at pilot plant scale. 779
780
Process step Drying temperature
35 ºC 41 ºC
Cream a 5.68 ± 1.71
Filtered a 4.68 ± 0.47
Extrusion a 4.99 ± 0.51
Drying b 8 b 3.59 ± 0.62 3.89 ± 0.13 18 b 5.69 ± 2.27 9.04 ± 4.58 28 b 6.87 ± 1.49 N.D.c
ADY 7.57 ± 3.87 8.23 ± 3.02 a Process step previous to drying step. b Drying time (min) . c non-determined. Averages 781 ± standard deviations of the results at least two independent experiments are shown. 782 783
784
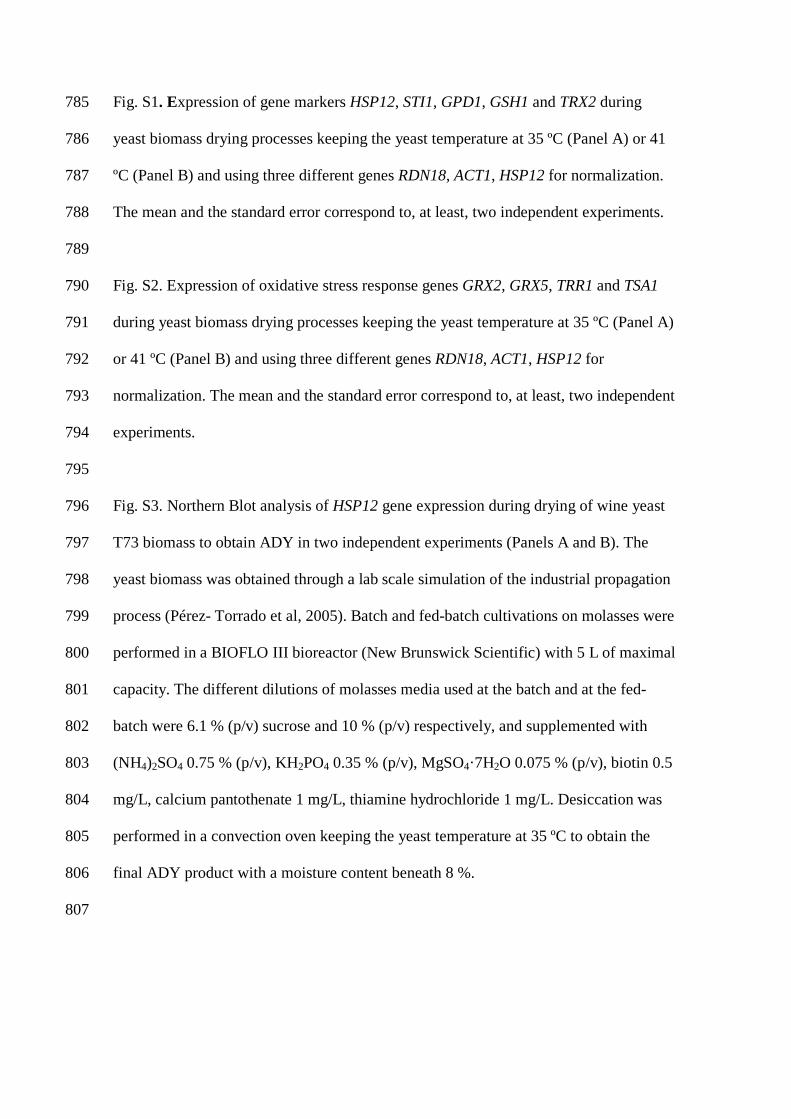
Fig. S1. Expression of gene markers HSP12, STI1, GPD1, GSH1 and TRX2 during 785
yeast biomass drying processes keeping the yeast temperature at 35 ºC (Panel A) or 41 786
ºC (Panel B) and using three different genes RDN18, ACT1, HSP12 for normalization. 787
The mean and the standard error correspond to, at least, two independent experiments. 788
789
Fig. S2. Expression of oxidative stress response genes GRX2, GRX5, TRR1 and TSA1 790
during yeast biomass drying processes keeping the yeast temperature at 35 ºC (Panel A) 791
or 41 ºC (Panel B) and using three different genes RDN18, ACT1, HSP12 for 792
normalization. The mean and the standard error correspond to, at least, two independent 793
experiments. 794
795
Fig. S3. Northern Blot analysis of HSP12 gene expression during drying of wine yeast 796
T73 biomass to obtain ADY in two independent experiments (Panels A and B). The 797
yeast biomass was obtained through a lab scale simulation of the industrial propagation 798
process (Pérez- Torrado et al, 2005). Batch and fed-batch cultivations on molasses were 799
performed in a BIOFLO III bioreactor (New Brunswick Scientific) with 5 L of maximal 800
capacity. The different dilutions of molasses media used at the batch and at the fed-801
batch were 6.1 % (p/v) sucrose and 10 % (p/v) respectively, and supplemented with 802
(NH4)2SO4 0.75 % (p/v), KH2PO4 0.35 % (p/v), MgSO4·7H2O 0.075 % (p/v), biotin 0.5 803
mg/L, calcium pantothenate 1 mg/L, thiamine hydrochloride 1 mg/L. Desiccation was 804
performed in a convection oven keeping the yeast temperature at 35 ºC to obtain the 805
final ADY product with a moisture content beneath 8 %. 806
807

808

4
3
2
1
0
5
6
cream filtered extrusion 8 18 ADY
Driying time (min)
mR
NA
rel
ativ
e le
vel
s
cream filtered extrusion 8 18 28
mR
NA
rel
ativ
e le
vel
s
Driying time (min)
4
3
2
1
0
5
6
ADY
A 35ºC
B 41ºC
a
a
a
a
a
a
aa
a
a
aaa
ab
b
b bb b
bb
b

A
B
C
0
1
2
3
4
5
6
7
HSP12 STI1 GPD1 GSH1 TRX2
Induction
B
0
1
2
3
4
5
6
7
8
9
GRX2 GRX5 TRR1 TSA1
Induction
A

0 10 20 30 40 50 A DY60
Dryingtime (min)
HSP12
rR NA
A
0 10 20 30 40 50 A DY60
Dryingtime (min)
HSP12
rR NA
B

0
10
20
30
40
50
60
70
cream filtered extrusion 8 18 28 ADY0
2
4
6
8
10
12
14
Tota
l glu
tath
ione
Red
uce
d g
luta
thio
ne
(GS
H)
Oxid
ized
glu
tath
ione
(GS
SG
)
Drying time (min)
0
10
20
30
40
50
60
70
crema filtrado extrusión 8' secado 18' secado producto f inal0
2
4
6
8
10
12
14
Tota
l glu
tath
ione
Red
uce
d g
luta
thio
ne
(GS
H)
Oxid
ized
glu
tath
ione
(GS
SG
)
Drying time (min)
cream extrusionfiltered 8 18 ADY
0
5
10
15
20
cream filtered extrusion 8 18 28 ADY
pm
ole
s M
DA
/mg c
ells
Drying time (min)
A 35ºC
B 41ºC
C
a
a
a
a
b
b
b
b
b
a
b
b
b


0
20
40
60
80
100
filtered extrusion 8 18 28 ADY
% re
sidu
al m
oist
ure
Drying time (min)
a

4
3
2
1
0cream filtered extrusion 8 18 28 ADY
mR
NA
rel
ativ
e le
vel
s
Driying time (min)
4
3
2
1
0cream filtered extrusion 8 18 ADY
Driying time (min)
mR
NA
rel
ativ
e le
vel
s
A 35ºC
B 41ºC
a
a
a
a
a
aa
aaaa
a
aa
a
a
aaab
bb
b
b
b
b
b
b
b

![ResearchApplication of simple fed-batch technique to ......and B-chains fused to carrier proteins in two different E. coli strains [8,9]. Nowadays, human insulin is produced as recombinant](https://img.pdfslide.us/doc/110x75/60ce0d94ffc8442c4a5c849d/researchapplication-of-simple-fed-batch-technique-to-and-b-chains-fused.jpg)