Embed Size (px)
Citation preview
You Have the Data…
Now What Do You Do With It?

Big Data

Agenda
1. LiveAnalytics Overview
2. San Antonio Spurs
• Properties
• Organization
• Data Strategies
3. Retention Model – Ongoing Strategic Usage
4. Broker Analytics – Future Strategic Usage

Data is Proliferating -
Exponentially

Agenda
There’s data…
…and then there’s
BIG DATA & ANALYTICS

Ticketmaster Has
Lots of Data
GLOBAL MONTHLY UNIQUE
ONLINE VISITORS
EVENTS
TICKETED
SPORTS TICKETS
PROCESSED
ECOMMERCE SITE
ON THE WEB
GLOBAL
CUSTOMER DATABASE
RECORDS

LiveAnalytics
•
•
•
•
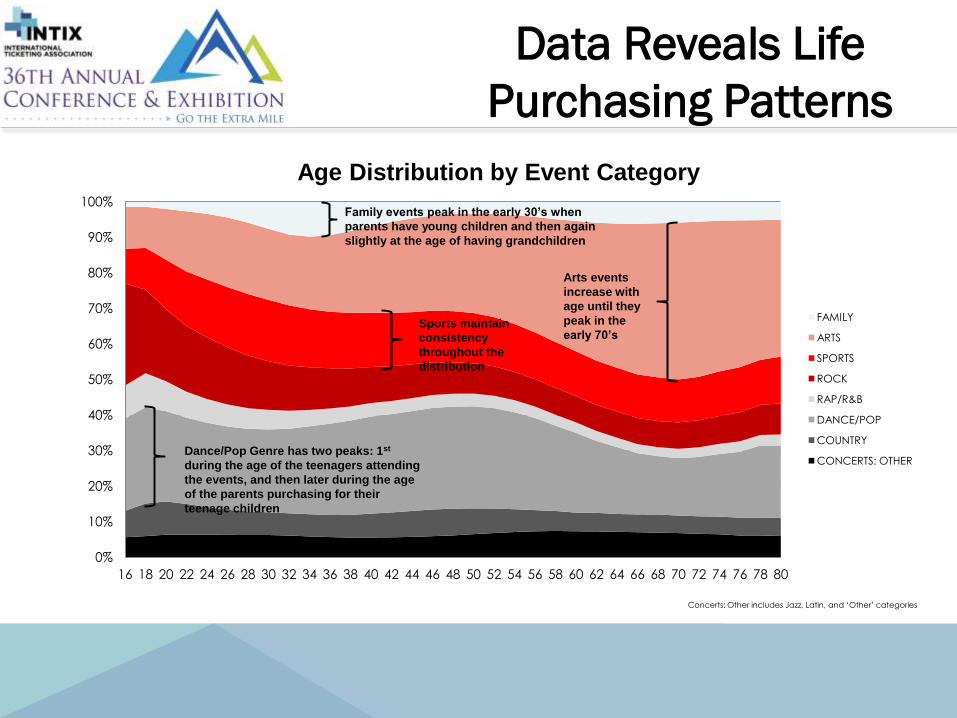
Data Reveals Life
Purchasing Patterns
0%
10%
20%
30%
40%
50%
60%
70%
80%
90%
100%
16 18 20 22 24 26 28 30 32 34 36 38 40 42 44 46 48 50 52 54 56 58 60 62 64 66 68 70 72 74 76 78 80
Age Distribution by Event Category
FAMILY
ARTS
SPORTS
ROCK
RAP/R&B
DANCE/POP
COUNTRY
CONCERTS: OTHER
Concerts: Other includes Jazz, Latin, and ‘Other’ categories
Family events peak in the early 30’s when
parents have young children and then again
slightly at the age of having grandchildren
Arts events
increase with
age until they
peak in the
early 70’s
Dance/Pop Genre has two peaks: 1st
during the age of the teenagers attending
the events, and then later during the age
of the parents purchasing for their
teenage children
Sports maintain
consistency
throughout the
distribution

Knowing Live Event Consumers: Demographics, Preferences and Behaviors
62% Child Present
33% Ages 18 - 34
32% $100K+ Income
$141 Spend / Event
$51 Price / Ticket
25% Purchase in Final
Week
LNE Data 3rd Party Data
100MM
US
Consumer
Records
12% Drive Luxury Cars
44% Repeat Buyers
We have data no one else in the world has and we partner with 3rd party data
providers so we can be even smarter about how we engage fans
300+
Attributes

The LiveAnalytics Product Suite
List Purchase
Fan Match
Fan Network
Custom Audience
Pricemaster
Initial Pricing
Forecast Analysis
Resale Analysis
Section Analysis
Broker Analysis
Fan Score
Prospecting Model
Retention Model
Hygiene
Profile Report
Buyer Analysis
Artist Recommendations
Primary Research
Fan Dashboard
Geo Maps
Market Profile Report
Conductor Searchlight


Spurs Sales Calendar
Key Dates → WNBA Schedule WNBA Season Begins AHL Schedule NBA Schedule AHL & NBA Seasons Begin NBA-DL Season Begins
↓ TEAM Jan Feb Mar Apr May June July Aug Sep Oct Nov Dec
SERVICE
Spurs Service Events Renewal Campaigns Relo / Upgrade & Add-
ons Pre-Season Touch Pre-season games First Touch Campiagns
Renewal Clean-ups
Spurs Sales Referrals, Playoffs, Suites Sell Groups to current fulls, lounges, snr
Stars Service Pre-season Touch Renewal Blitz Ongoing Renewal
Mad Club Renewals Summer Touch Pre-season Touch In-season Touch
ACCOUNT EXECUTIVES
New Full Deposits Sell New Fulls
Spurs Sales Playoff Strips Partial Renewals Partials Clean up
Spurs SNR SNRs Upgrade Partials SNR Campaign Launch SNR Push Oct-Dec
Stars Sales FSE Sales FSE Deposits
INSIDE SALES
Spurs Sales New Full Deposits Sell New Fulls
Spurs SNR SNRs SNRs
Stars Sales FSE Sales FSE Deposits
LIBERTY SALES Stars Sales FSE Sales FSE Deposits Group Initiatives & FEP
GROUP SALES
Spurs Group In-Season Groups Playoff Groups Deposits Group Presale In-Season Groups
Spurs Lounge Playoff Lounges Deposits In-Season Lounge
Stars Groups Groups
Other Groups Most Events Launch Groups
D-LEAGUE Austin Sales FSE and Groups In-Season Sales

Spurs LiveAnalytics
Product Usage
Prospect Model
Retention Model
Fan Match
Fan Score
FanNet
Premium CEN
Artists Affinity
Broker Analysis
Propensity Model
Custom Audience
Cancels Analysis
Pricemaster

Retention Model

Retention Model
Return
Upgrade
Downgrade No Return
► Current plan holders are
typically the most valuable
prospects for the next
season – modeling helps
keep them
► Custom models provide
risk scores on all plan
holders for likelihood not to
renew their plans the next
season
► Segment customer base
and focus on renewing
those most at risk
► Ensure plan holders keep
coming back year after
year
► Scores also tell you who
would be a good candidate
for a plan or quantity
upgrade
Maintain

Retention Model Methodology
The Modeling Process is reliant upon past season ticket accounts and whether those accounts
renewed or not. Some details:
• Transaction data for two seasons were extracted from the Archtics database.
• All transactions were expanded to the seat level.
• Inclusion/Exclusion Criteria
• Comp tickets were excluded from the sample.
• Only Full Season Plan buyers were included in the analysis.
• Only Personal and Corporate accounts were included.
• Must have purchased at least 1 FSE through Full Season Plan in 2012-13 Season
• Must have purchased all 41 games in 2012-13 Season
• Accounts upgraded/downgraded by more than 500 seats in 2012-13 season were
excluded from analysis.
• The following account types (based on their descriptions) were excluded:
• Broadcast, CEO/VP List, Chamber List, Employee, Game Ops, Group, High Schools,
Investor, Spon – Brdcst, Spon – Corp, Sponsor, Staff, Ticket Broker, Trade, USAA STH

Retention Model Historic Analysis
Modeling
• Logistic regression analysis was performed for each of the 3 segments: New
Personal accounts, Existing Personal accounts, and Corporate accounts.
• 2012-13 Season transaction and ticket activity data were used to predict 2013-14
Season renewal status.
• The renewal algorithm was applied to the 2013-14 Season FS Plan accounts,
and renewal probability was estimated for each account.
Outcome
• Renewal Status (Renewed vs. Non-Renewal)
Predictors
Tenure Ticket Activities Demographics
Tenure (Years)
New Account
Realization Rate
Posting Rate
Resale Success Rate
Profit Margin
Age
Gender
Household Income
Discretionary Income Index (DII)
Net Worth

Spurs Retention Model Predictors
54.7
55.1
49.7
0 20 40 60
Overall
Renewed
Non-Renewed
Age
42%
40%
60%
0% 20% 40% 60% 80%
Overall
Renewed
Non-Renewed
Presence of Children (0-17) in
Household
Kids in HH
correlates
negatively
with
renewing
Older age
correlates
positively with
renewing
Realization rate is a
consistently strong predictor

Spurs Retention Model Key Takeaways
• The retention model allows a partner to:
• Identify high-risk accounts with below average renewal probability
• Identify and proactively engage accounts with low ticket utilizations
• Approximately 3,000 Full Season accounts for the 2013-14 season were scored.
• About 17% of overall accounts were deemed at risk, representing well over $5M worth of
accounts.
• Overall, there were approximately 500 accounts with renewal probability less than 70%.
• New Personal accounts and Non-Renewing accounts had lower household income, net
worth, and discretionary income compared to Existing or Renewing accounts.
• Realization and Posting rates were found to be significant contributors in renewal of new
personal accounts, while Realization Rate and Tenure were significant for the renewal of
existing personal accounts.

Spurs Retention Model Use Case
• 2015-16 Renewal Campaign -> Starts Now!
• Retention Model is one of multiple tools to help project out
seats and revenue. (NBA, Reps knowledge, etc)
• Each rep has over 500 accounts, and it is imperative that
they Use Time Wisely. Scores allow them to identify and
focus on fence-sitters now.
• First Year Accounts (Rookies) are 15% of Renewal
Membership Business. Mgmt. expectation is for high
renewal %. Model allows reps to engage with rookies at
risk during holiday period.
Bottom line:
Retention Model = More Efficient/Effective Decision and Time
Mgmt!

Broker Analysis

Spurs Broker Overview
Purpose
Detailed and rich understanding of resale activities around Spurs tickets. By
better understanding, decisions can be made at:
1. Individual account level
2. Strategic business level
Methodology
Study historic data at Archtics transaction level. Track tickets from purchase
to usage. Segment by ticket types – ST, Singles, etc. Aggregate findings to
provide insights.
Deliverables
1. Comprehensive detailed report
2. Custom broker score that is used on each Spurs account
3. Views into child-parent relationships on tickets

Spurs Broker Overview - Macro
Approximately 10% of the Full Season accounts were identified as high potential
brokers (Score > 70), which possessed more than 35% of all Full Season tickets. NBA estimates 28% across all teams.
* Please note all numbers are slightly modified for proprietary purposes.
Confidential
Confidential

Spurs Broker Overview - Micro
• Account ID: XXXX
• Account Name: XXXXX
• Tickets purchased from the Spurs:
850
• Tickets purchased from other Spurs’
account holders: 88 (with 35 parent
accounts)
• Tickets resold through TE: 82 (with 19
child accounts)
• Non-Resold but attended tickets: 529
• Unused tickets: 202
• Profit = $2015, profit margin=51%
• Please note all numbers are slightly
modified for proprietary purposes.
Parent child account relationship

Spurs Broker Analytics Use Case
WHY DID SPURS USE BROKER ANALYTICS?
If team performance changes. which members and what inventory may be
impacted.
WHAT WAS PROCESS?
LiveA analyzed all ticket activity data to see who has “broker behavior” and to
find “hidden” brokers. We collectively reviewed findings.
HOW DID WE LEVERAGE?
Spurs used the findings to
• Find inventory to make pricing changes
• Better allocate open inventory for future memberships
• More effective communication strategies for all members – who to email
offers, drive traffic to aligned secondary sites (NBA.com)
• Reviewed game by game activity for predictive purposes.
BOTTOM LINE:
Spurs are more in control of our tickets, brand and customer relationships!

Questions?
Sharif Talukder
San Antonio Spurs
Dave Smrek
LiveAnalytics [email protected]
303-222-7857