Embed Size (px)
Citation preview

Investor PresentationNovember 9, 2021CONFIDENTIAL

Disclaimer
This presentation is for informational purposes only and contains general information about the activities of Ascent Resources, LLC and certain of its subsidiaries (collectively, “Ascent”) that does notpurport to be complete. Statements in this presentation are made as of the date hereof unless stated otherwise herein, and the delivery of this presentation at any subsequent time shall not under anycircumstances create an implication that the information contained herein is correct as of such subsequent time. Ascent is under no obligation to update or keep current the information contained in thispresentation. Market and competitive position data in this presentation has generally been obtained from industry publications and surveys or studies conducted by third-party sources. There arelimitations with respect to the availability, accuracy, completeness and comparability of such data. No representation or warranty, express or implied, is made as to, and no reliance should be placed on,the fairness, accuracy, completeness or correctness of the information or opinions contained herein and any reliance you place on them will be at your sole risk.
Non-GAAP Financial Measures
This presentation includes financial measures that are not in accordance with U.S. generally accepted accounting principles (“GAAP”), including, but not limited to free cash flow and adjustedEBITDAX. While Ascent believes that such measures are useful, they should not be used as a replacement for financial measures that are in accordance with GAAP. Please see additional disclosuresin our financials available at www.ascentresources.com.
Forward-Looking Statements
This presentation, and oral statements made in connection with this presentation, contain forward-looking statements, within the meaning of U.S. federal securities laws. Forward-looking statementsexpress views of the Company regarding future plans and expectations. They include, but are not limited to, statements that include words such as “may,” “could,” “would,” “should,” “believe,” “expect,”“anticipate,” “plan,” “estimate,” “target,” “project,” “plan,” “intend,” and similar words or expressions.
All statements, other than statements of historical fact included in this presentation, including statements regarding future operations, business strategy, financial position, prospects and past, present, orfuture values of the anticipated reserves, cash flows, income, costs, expenses, liabilities, and profits, if any, of the Company, are forward-looking statements. These statements are based on numerousassumptions and are subject to known and unknown risks and uncertainties. These assumptions may not materialize. Actual future results may vary materially from those expressed or implied in theseforward-looking statements, and our business, financial condition, and results of operations could be materially and adversely affected by numerous factors, including such known and unknown risks anduncertainties. As a result, forward-looking statements should be understood to be only predictions and statements of our current beliefs; they are not guarantees of performance.
All of the forward-looking statements in this presentation are based on management’s current beliefs, based on currently available information, as to the outcome and timing of future events, which maydiffer from actual outcomes due to our ability or inability to, among other things: manage changes in, and volatility of, natural gas, oil and NGL prices and the potential impact of such changes on ourasset carrying values; manage the effects of global pandemics, including COVID-19; predict and manage the effects of OPEC+ actions and agreements to set and maintain production levels; execute onthe assumptions regarding our drilling, development plan and future production; manage increases in costs of, fluctuation in availability of, and competition for, goods, services, oilfield equipment andpersonnel; cure any defects impairing title to our properties; execute on our financial strategy required to achieve our business plan and replace our reserves; mitigate opportunity costs and counterpartycredit risk regarding derivative instruments; manage contractual obligations with respect to infrastructure that are due regardless of use; manage pipeline and gathering system capacity constraints;mitigate credit risk posed by significant customers; mitigate uncertainty regarding our reserve estimates and future operating results; generate sufficient cash flow from operations to service ourindebtedness; mitigate any significant reduction in the borrowing base under our credit facility; mitigate the effects of negative shifts in investor sentiment and public perception toward the natural gasand oil industry on our ability to attract capital and obtain financing on favorable terms; manage restrictions and comply with obligations in our debt instruments; manage our leasehold assets that aresubject to leases that will expire unless production commences on the acreage; manage risks and cost of compliance with applicable laws and regulations, including environmental laws and regulations;respond to litigation and shifting government regulatory requirements with respect to unconventional resource recovery; retain key members of our senior management and key technical personnel;detect and successfully defend against cybersecurity threats and manage risks and cost of compliance with laws and regulations related to data privacy and protection; meet our plans, objectives,expectations, and intentions contained in this presentation; and recognize and mitigate other risks to our planned objectives described herein. The cautionary statements in this presentation expresslyqualify all of our forward-looking statements. The forward-looking statements speak only as of the date of this presentation and undue reliance should not be placed on these statements. We disclaimany obligation to update any forward-looking statements after the date of this presentation.
2

Premier Operator in the Utica Shale
One of the Largest Private Producers of Natural Gas in the United States
1) Ascent only owns a royalty interest in such acreage.
Fee Mineral Acreage
Dry Gas
Liquids Rich
Leasehold Acreage
Net Leasehold Acres: 262,500
Ascent Operated Minerals: 72,500
Third-Party Operated Minerals(1): 6,100
Total Acreage: 341,100
Q3 2021 Net Production ~2.0 bcfe/d
ESG focus and unwavering commitment to safety as our top priority at all levels
Operational and technical excellence drives industry-leading metrics and execution
Large, diverse asset base supports sustainable free cash flow
Disciplined financial strategy and commitment to free cash flow generation support long-term value creation
3

Clear Vision to Creating Maximum Value
.
1) Development costs are inclusive of all drilling, completions, facility and pad costs.
ESG - Leading with Intent➢ Enduring focus on employee and contractor health and safety
➢ Focused on minimizing our environmental impact and supporting our local communities and employees
➢ Best operating practices and technology focus drive low GHG/Methane emissions intensity and future reductions
➢ Driving to achieve carbon neutrality by 2025
Strong Balance Sheet and Robust Liquidity Profile➢ Focused financial strategy with no debt maturities until 2024, and $1.14 billion of liquidity
➢ Free cash flow will be used for absolute debt reduction until our leverage target of less than 2.0x is achieved
➢ Disciplined commodity hedging program protects cash flow and reduces volatility
World Class Resource and Execution➢ Unique combination of rock quality, pressure and deliverability supports best-in-class paybacks, returns and capital
efficiency
- Highest average 12-mo cumulative gas production in North America at 6.6 bcfe per well
➢ Approximately 341,000 net acres offer hydrocarbon optionality and nearly 15 years of inventory at current activity levels
- Contiguous acreage position allows for operational control and longer lateral development (avg. of 13,000’ for FY 2021)
- Scale supports right-sized operations and allows us to capture available efficiencies
- Mineral ownership reduces royalty burdens and enhances economics
Peer-Leading Margins Drive Sustainable Free Cash Flow➢ Economies of scale drive capital efficiencies, margins, and corporate returns
➢ Peer-leading LOE and G&A drive strong per-unit production margins
➢ Strategic FT portfolio offers flow assurance and access to premium out-of-basin markets (i.e. lower differentials)
➢ Lowest development costs in Appalachia at $571(1) per lateral foot in Q3 2021 ($611 in FY 2020)
➢ Generated $28 million of free cash flow in Q3 2021 and $120 million YTD, despite $289 million in YTD realized hedge losses
4

➢ Focused on reducing our environmental
impact and minimizing emissions
➢ Strive to achieve carbon neutrality by
2025
➢ Committed to reducing freshwater use
through optimization efforts (84% reuse
in Q3 2021)
➢ Minimize surface impacts by drilling
longer laterals to reduce land
disturbances in the local communities
➢ Leveraging our membership with AXPC,
The Environmental Partnership, and the
ONE Future Coalition to drive
improvements and reduce emissions
Setting the Course for a Sustainable Future
➢ Commitment to diversity and inclusivity
at all levels of the organization, with
31% of senior-level positions and 48%
of all corporate positions held by women
➢ Comprehensive safety program
demands safety-first approach
➢ Over 3,200 volunteer hours made
available annually to employees for
community service
➢ Partnered with Switch Energy Alliance to
promote energy education and reduce
energy poverty throughout the world
➢ Great Place to Work™ certified for the
past five years
➢ Diverse and experienced 12 member
Board consisting of 2 independent
directors, our CEO and 9 members
representing key equity investors
➢ Committed to sound corporate
governance that includes Audit,
Compensation and Environment,
Sustainability and Corporate
Responsibility Committees
➢ Management compensation is aligned
with a conservative balance sheet,
consistent free cash flow generation and
ESG excellence
➢ Cross-departmental Enterprise Risk
Management Committee tasked with
monitoring and mitigating risk
Social GovernanceEnvironmental
5

Leading Controllable Cost Structure
$0.07
$0.15
Ascent Peer Average
Peer G&A
Costs are 2x
Higher
Peer Leading G&A Cost Metrics Lowest Well Costs(1) in Appalachia
➢ G&A(2) averaged $0.07 per mcfe during Q3
2021
➢ Focus on overhead cost improvements
drives strong per-unit margins
➢ Well positioned to maintain / scale
operations without adding additional
employees
➢ Well costs averaged $571 per lateral foot
during Q3 2021
➢ Innovation and technological advances
continue to drive sustainable and
repeatable cost improvements
➢ Additional efficiency gains anticipated as
completed stages per day and drilling cycle
times continue to improve
$571
Marcellus Avg.$646
Utica Avg. $750
Ascent Peer Average
Marcellus /
Utica Peer D&C
Costs are
13% / 31%
Higher than
Ascent’s
Note: G&A peers include AR, CNX, EQT, GPOR, RRC, and SWN. Well cost peers include AR, EQT, GPOR, RRC, and SWN.
1) Wells costs include drilling, completions, facility and pad costs.
2) Excludes stock-based compensation expense. 6

6
8
12
15
19
2018 2019 2020 YTD 2021 Ascent Record
2,171'
2,789'
3,481'3,779'
6,211'
2018 2019 2020 YTD 2021 Ascent Record
20 20
18
17
10
2018 2019 2020 YTD 2021 Ascent Record
Track Record of Continued Improvement
Consistent Increase in Lateral Feet Drilled Per DaySpud to Rig Release Days Continue to Decline
Completed Stages per Day Drives Differentiation Lateral Length Increasing Through Development
Note: Annual operational metrics are based on full-year averages; Ascent records are based on single-well results.
9,748'
11,364'12,281'
13,168'
18,431'
2018 2019 2020 YTD 2021 Ascent Record
7

Creating Value Through Technology and Data
Value Creation
Technical Expertise
Core Data
Fiber Optics
3D Seismic
Real-Time Analytics
Comprehensive suite of core,
petrophysical and 3D seismic data
(covers 70% of acreage position)
Fiber optic installations used during
drilling, completions and production
operations
Real-time cluster and stage
efficiencies have driven optimal
proppant distributions and water
requirements at the lowest cost
Drilling and completion data monitored
in real-time and integrated to in-house
database for analysis
8

Innovation, Technology and Experience Driving Industry Leading Well Performance and Development
9
Spacing and completion design have been optimized through years of testing, R&D
and production results across a wide array of operating conditions
- Completed 50 wells with larger design (>2,000 lb per ft) since 2016-17, and compared results
against 100+ wells with base design (1,350 - 1,600 lb per ft)
- 4 years of production history validates our current completion / well spacing practices which
optimizes recovery while reducing offset well interference
More efficient completion design has been refined, utilizing fiber optics and
chemical tracers, to drain the reservoir in the most efficient manner
- Focused on efficient proppant distribution along the well bore
Optimized well spacing with a particular completion design achieves a higher
recovery factor with improved economics
- 3D seismic optimized lateral position and drilling of straighter, longer laterals
- Extensive core testing has substantially improved subsurface characterization and field
development
Facility upgrades, including automation, have enabled more efficient and
systematic production drawdown while accelerating paybacks and reducing F&D
costs
Note: Development and reserve assumptions based on Ascent internal estimates and represent fully-burdened well cost for 15,000’ lateral, including pad and facility costs. Natural gas in place of 90bcf per drilling
spacing unit assumed. Economics reflect 100% WI and 80% NRI, including internal estimates for differentials, GP&T and LOE.

6.66.5
5.7
4.5
4.3
Ascent(Utica Core)
UticaSouth Core
MarcellusNE PA
MarcellusSW PA
HaynesvilleLA Core
Best First Year Production (bcfe per well) Fastest 12 month Paybacks in the U.S.
Source: Enverus data as of October 14, 2021. Notes: Data limited to 2020+ wells with 12 months of production. Payback calculation based on first-year capital recovery from Enverus Single Well Model. Based on actual
12-month cumulative production. Lateral length data rounded to nearest 50 feet.
$2.50 Price Deck $3.50 Price Deck $4.50 Price Deck12,450’Avg. LL 11,700’ 8,600’ 10,700’ 7,400’
87%
71% 68% 73%
48%
160%
137%129%
113%100%
233%
203%189%
152% 152%
Ascent(Utica Core)
MarcellusNE PA
UticaSouth Core
HaynesvilleLA Core
MarcellusSW PA
➢ Highest 12-month average cumulative production in North
America
– 6.6 bcfe of cumulative production in the Utica core within initial
12 months
➢ Homogenous geology and operational planning / execution
delivering longer average laterals than any other play
➢ Ascent’s strong well productivity coupled with leading D&C
cost structure and extensive mineral position accelerate well
payout and maximize capital returns
Capital Efficiency and Well Performance Driving
Paybacks
10
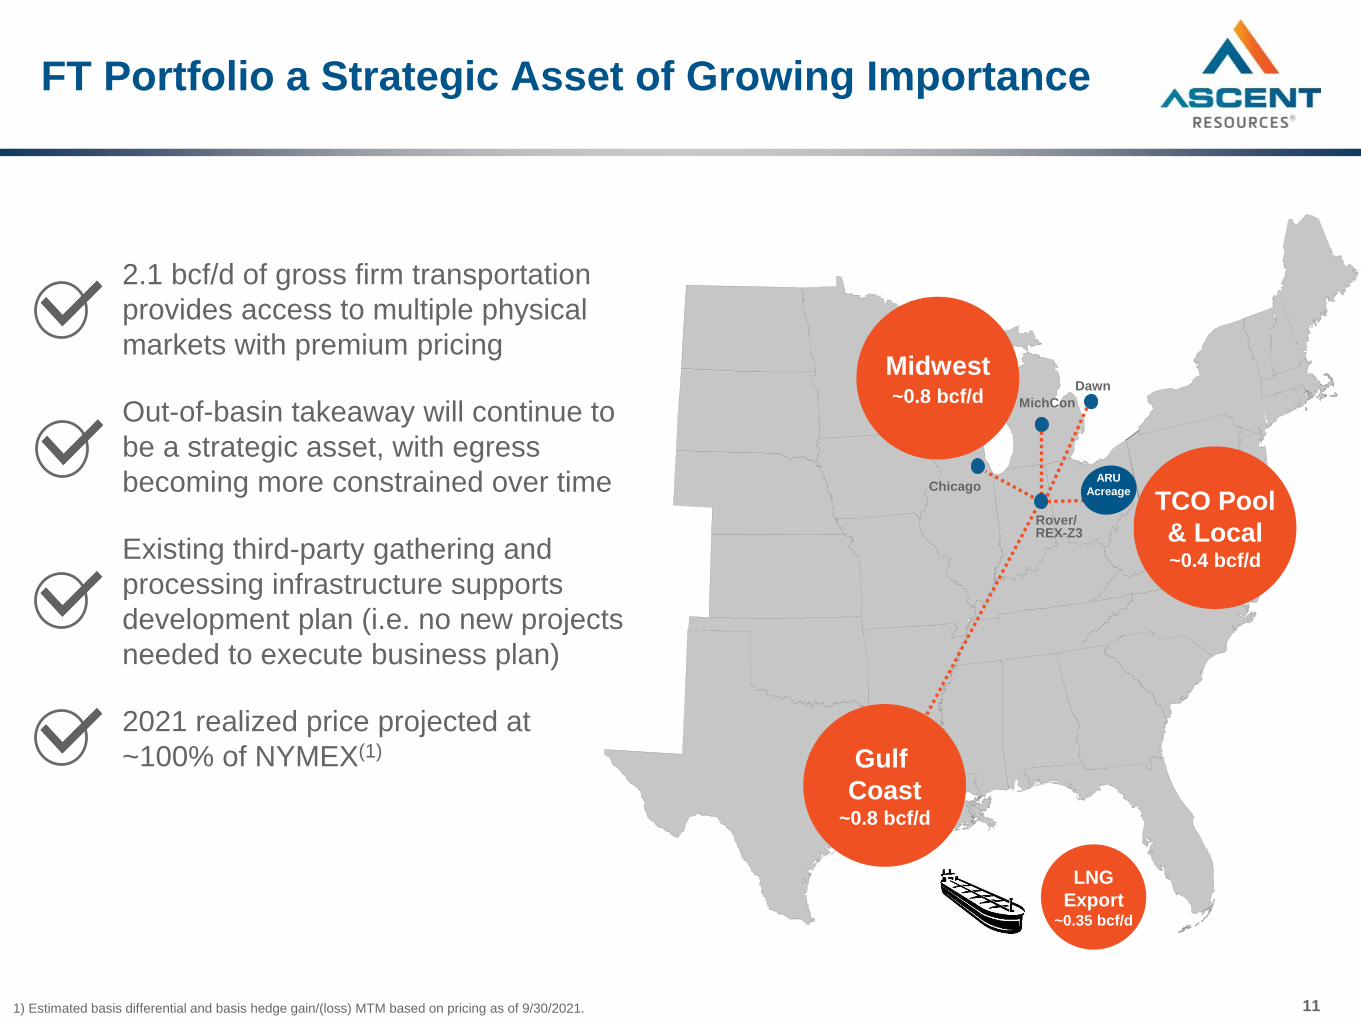
FT Portfolio a Strategic Asset of Growing Importance
1) Estimated basis differential and basis hedge gain/(loss) MTM based on pricing as of 9/30/2021.
Gulf
Coast~0.8 bcf/d
Midwest~0.8 bcf/d
TCO Pool
& Local~0.4 bcf/d
Chicago
MichCon
Dawn
Rover/ REX-Z3
ARU
Acreage
LNG
Export~0.35 bcf/d
2.1 bcf/d of gross firm transportation
provides access to multiple physical
markets with premium pricing
Out-of-basin takeaway will continue to
be a strategic asset, with egress
becoming more constrained over time
Existing third-party gathering and
processing infrastructure supports
development plan (i.e. no new projects
needed to execute business plan)
2021 realized price projected at
~100% of NYMEX(1)
11

Low Risk Capital Structure and Maturity ProfileD
eb
t M
atu
riti
es
(a
s o
f 9
/30
/21
)(1)
➢ Weighted average maturity profile of >5 years
➢ No debt maturities until 2024 and no term debt maturities until 2025
➢ Strong liquidity position of $1.14 billion
➢ Borrowing base reaffirmed at $1.85 billion in November 2021
➢ Long-term leverage target of <2.0x
12
9% Senior Notes
due 2027
7% Senior Notes
due 20268.25% Senior
Notes due 2028
10% Term Loan
due 20255.875% Senior
Notes due 2029Credit Facility
$543 $550$600
$348$300
$400
2021 2022 2023 2024 2025 2026 2027 2028 2029
121) Principal amount only.

Unique Value Proposition Relative to Peers
Sustainable Size and
Scale
Leading Cost Structure
Consistent Free Cash
Flow Generation
Strong and Improving
Balance Sheet
Strong Macro
Environment
Fastest Return
of Capital
Commitment to ESG and Responsible Operations
13

Appendix

Third Quarter 2021 Results & 2021 Annual Guidance
1) Excludes stock-based compensation expense.
2) Excludes capitalized interest.
Third Quarter 2021 Results
Production (mmcfe/d) 1,978
% Natural Gas 93%
Operating Expenses ($/mcfe)
LOE $0.13
GP&T 1.33
Taxes Other than Income 0.05
G&A(1) 0.07
Total Operating Expenses $1.58
Adj. EBITDAX ($mm) $250
CAPEX Incurred ($mm)
Drilling & Completions $150
Land 20
Capitalized Interest 12
Total CAPEX Incurred $181
Free Cash Flow ($mm) $28
Operations
Operated Rigs 4
Wells Spud 19
Wells Completed 20
Wells TIL’d 17
Average Lateral Length of Wells TIL’d 13,220’
Drilling, Completion, Facility and Pad Cost (per lat. ft.) $571
Updated Full-Year 2021 Guidance
Total Production range (mmcfe/d) 1,900 – 1,950
% Natural Gas 90% – 92%
Operating Expenses ($/mcfe)(1) $1.55 – $1.60
CAPEX Incurred ($mm)(2) $630 – $650
Free Cash Flow ($mm) $175 – $200
Operations / Well Counts
Operated Rigs 4
Wells Spud 70 – 75
Wells TIL’d 65 – 70
Average Lateral Length of TILs 13,000’
Drilling, Completion, Facility and Pad Cost (per lat. ft.) $550 – $575
15
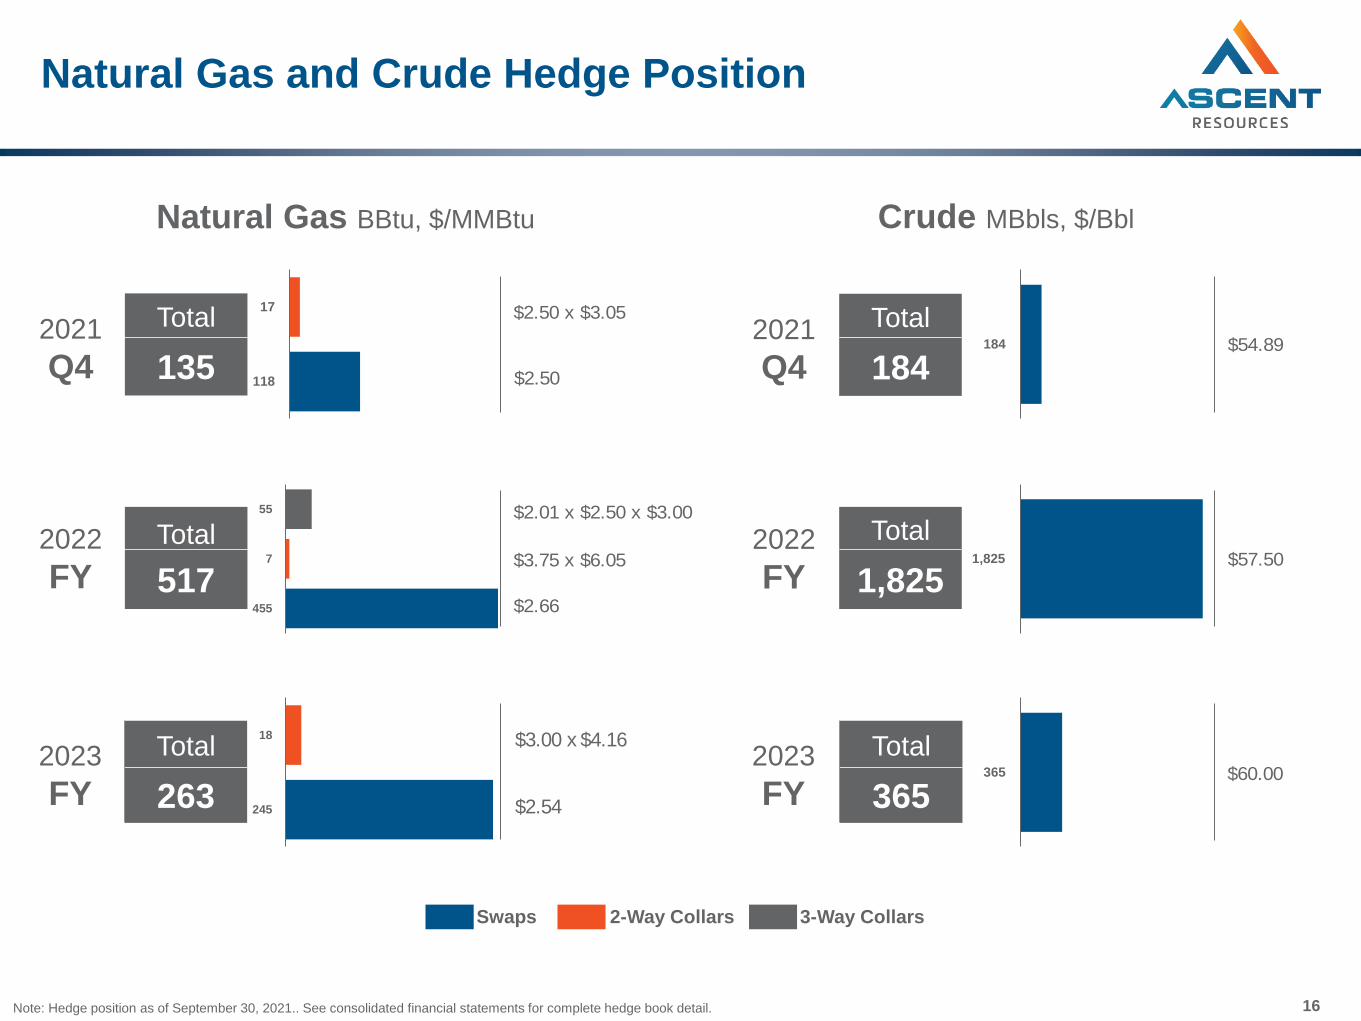
245
18
365
1,825
184
118
17
455
7
55
$2.50 x $3.05
Note: Hedge position as of September 30, 2021.. See consolidated financial statements for complete hedge book detail.
Natural Gas and Crude Hedge Position
2021
Q4
2022
FY
2023
FY
Total
135
Total
517
Total
263
Natural Gas BBtu, $/MMBtu Crude MBbls, $/Bbl
2021
Q4
2022
FY
2023
FY
Total
365
Swaps 2-Way Collars 3-Way Collars
$2.66
$3.75 x $6.05
$2.01 x $2.50 x $3.00
$57.50
$54.89
Total
184
Total
1,825
16
$3.00 x $4.16
$2.54
$60.00
$2.50

Natural Gas Provides Path to a Sustainable Future
Source: M.J. Bradley & Associates Benchmarking Methane and Other GHG Emissions Report (based on 2020 data).
Note: Oil peers include average of APA, CLR, CPE, DVN, LPI, MPC, MUR, OAS, PDCE, SM, and WLL, Peer group includes AR, CNX, EQT, GPOR, RRC and SWN.
Total GHG Emission (mm tons CO2e)
GHG Intensity (tons CO2e / MBoe)
17
1.6
1.0
0.7
0.5 0.4
0.3 0.2
0.2
Oil Peers Peer 1 Peer 2 Ascent Peer 3 Peer 4 Peer 5 Peer 6
19.5
4.8 4.3
3.6 2.5 2.1 2.0
1.4
Oil Peers Peer 1 Peer 4 Ascent Peer 5 Peer 2 Peer 3 Peer 6

EBITDAX and Adjusted EBITDAX Reconciliation
1) EBITDAX is defined as net income (loss) before exploration expenses, depreciation, depletion, and amortization, and interest expense, net.
2) Adjusted EBITDAX is defined as EBITDAX before changes in fair value of commodity derivatives, (gains) losses on purchases or exchanges of debt, stock-based compensation, change in fair value of contingent
payment right, and other non-recurring items.
($ in millions)Three Months Ended
September 30,
Nine Months Ended
September 30,
2021 2020 2021 2020
Net Loss ($1,256.4) ($552.4) ($1,916.3) ($758.1)
Adjustments to reconcile net loss to EBITDAX:
Exploration expenses 22.3 28.1 57.3 77.9
Depreciation, depletion and amortization 151.6 196.0 438.4 574.8
Interest expense, net 45.0 33.3 127.8 98.4
EBITDAX (Non-GAAP)(1) ($1,037.6) ($295.0) ($1,292.9) ($7.0)
Adjustments to reconcile EBITDAX to Adjusted EBITDAX:
Change in fair value of commodity derivatives 1,284.8 500.2 1,987.2 677.6
Change in fair value of contingent payment right 1.5 - 20.3 -
Losses (gains) on purchases or exchanges of debt - 3.6 3.8 (9.7)
Stock-based compensation 0.8 0.7 2.8 0.7
Non-recurring legal expense - - - 5.6
Adjusted EBITDAX (Non-GAAP)(2) $249.6 $209.5 $721.3 $667.3
18

Free Cash Flow Reconciliation
1) Discretionary cash flow is widely accepted as a financial indicator of a natural gas and oil company’s ability to generate cash which is used to internally fund exploration and development activities and service debt.
Ascent defines “discretionary cash flow” as net cash provided by operating activities before changes in operating assets and liabilities.
2) Free cash flow is an indictor of a company’s ability to generate funding to maintain or expand its asset base, make distributions and repurchase or extinguish debt. Ascent defines “free cash flow” as discretionary
cash flow less drilling and completion costs incurred, acquisition and leasehold costs incurred, capitalized interest incurred, non-recurring legal expense, financing commodity derivative settlements, debt exchange fees
and certain non-recurring items.
($ in millions)Three Months Ended
September 30,
Nine Months Ended
September 30,
2021 2020 2021 2020
Net Cash Provided by Operating Activities $160.9 $183.0 $554.7 $654.5
Adjustments to reconcile Net Cash Provided by Operating
Activities to Discretionary Cash Flow:
Changes in operating assets and liabilities 48.5 (6.0) 60.0 (79.5)
Discretionary Cash Flow (Non-GAAP)(1) $209.4 $177.0 $614.7 $575.1
Adjustments to reconcile Discretionary Cash Flow to Free
Cash Flow:
Drilling and completion costs incurred (149.6) (91.6) (410.0) (412.7)
Acquisition and leasehold costs incurred (20.1) (10.6) (38.0) (47.2)
Capitalized interest incurred (11.5) (19.5) (37.5) (64.1)
Financing commodity derivative settlements (2.4) - (11.2) -
Non-recurring legal expense - - - 5.6
Other 2.3 3.6 2.4 3.6
Free Cash Flow (Non-GAAP)(2) $28.1 $58.9 $120.4 $60.3
19