Embed Size (px)
Citation preview
Financial results for the six months ended September 30, 2009Appendix
November 6, 2009
1
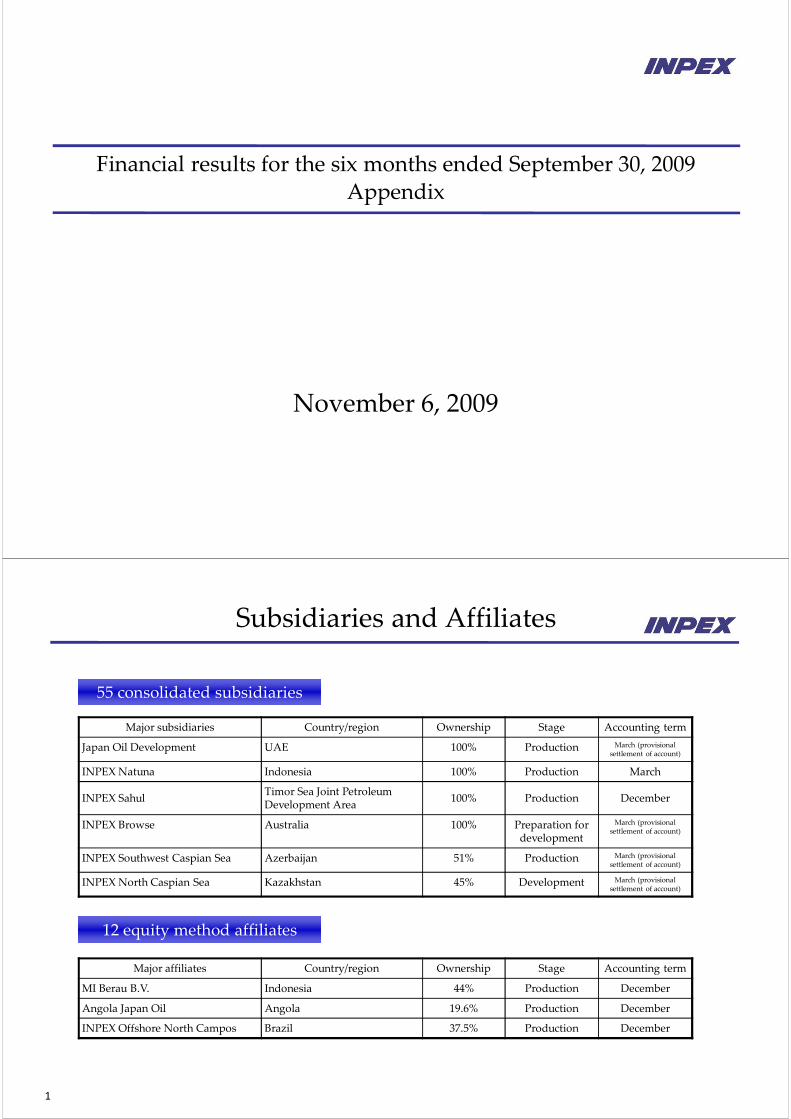
Subsidiaries and Affiliates
55 consolidated subsidiaries
12 equity method affiliates
Major subsidiaries Country/region Ownership Stage Accounting term
Japan Oil Development UAE 100% Production March (provisional settlement of account)
INPEX Natuna Indonesia 100% Production March
INPEX SahulTimor Sea Joint Petroleum Development Area
100% Production December
INPEX Browse Australia 100% Preparation for development
March (provisional settlement of account)
INPEX Southwest Caspian Sea Azerbaijan 51% Production March (provisional settlement of account)
INPEX North Caspian Sea Kazakhstan 45% Development March (provisional settlement of account)
Major affiliates Country/region Ownership Stage Accounting term
MI Berau B.V. Indonesia 44% Production December
Angola Japan Oil Angola 19.6% Production December
INPEX Offshore North Campos Brazil 37.5% Production December
2
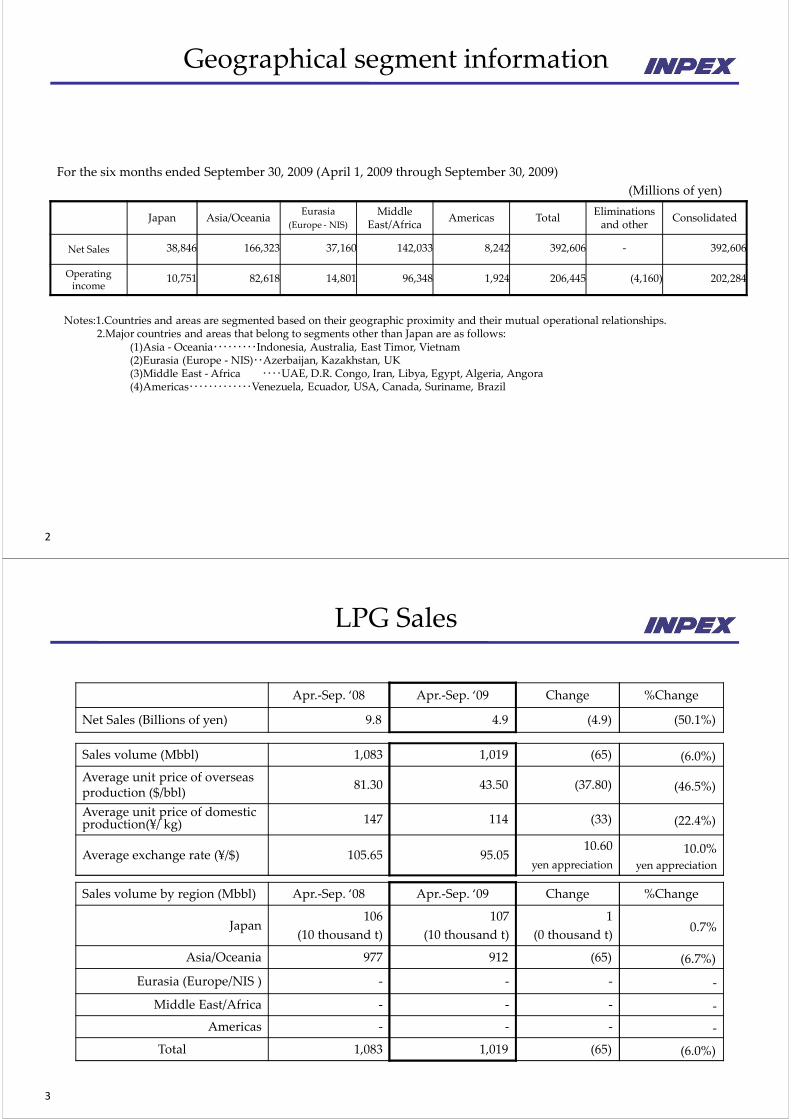
Geographical segment information
For the six months ended September 30, 2009 (April 1, 2009 through September 30, 2009)
(Millions of yen)
Japan Asia/OceaniaEurasia
(Europe ‐ NIS)
Middle East/Africa
Americas TotalEliminations and other
Consolidated
Net Sales 38,846 166,323 37,160 142,033 8,242 392,606 ‐ 392,606
Operating income
10,751 82,618 14,801 96,348 1,924 206,445 (4,160) 202,284
Notes:1.Countries and areas are segmented based on their geographic proximity and their mutual operational relationships.2.Major countries and areas that belong to segments other than Japan are as follows:
(1)Asia ‐ Oceania・・・・・・・・・Indonesia, Australia, East Timor, Vietnam(2)Eurasia (Europe ‐NIS)・・Azerbaijan, Kazakhstan, UK(3)Middle East ‐Africa ・・・・UAE, D.R. Congo, Iran, Libya, Egypt, Algeria, Angora(4)Americas・・・・・・・・・・・・・Venezuela, Ecuador, USA, Canada, Suriname, Brazil
3
LPG Sales
Sales volume (Mbbl) 1,083 1,019 (65) (6.0%)
Average unit price of overseas production ($/bbl)
81.30 43.50 (37.80) (46.5%)
Average unit price of domestic production(¥/ kg) 147 114 (33) (22.4%)
Average exchange rate (¥/$) 105.65 95.0510.60
yen appreciation
10.0% yen appreciation
Apr.‐Sep. ‘08 Apr.‐Sep. ‘09 Change %Change
Net Sales (Billions of yen) 9.8 4.9 (4.9) (50.1%)
Sales volume by region (Mbbl) Apr.‐Sep. ‘08 Apr.‐Sep. ‘09 Change %Change
Japan106
(10 thousand t)
107
(10 thousand t)
1
(0 thousand t)0.7%
Asia/Oceania 977 912 (65) (6.7%)
Eurasia (Europe/NIS ) ‐ ‐ ‐ ‐
Middle East/Africa ‐ ‐ ‐ ‐
Americas ‐ ‐ ‐ ‐
Total 1,083 1,019 (65) (6.0%)
4
EBIDAX
(Millions of yen) Apr.‐Sep. ‘08 Apr.‐Sep. ‘09 Change
Net income 104,028 47,645 (56,383) P/L
Minority interests 4,336 2,747 (1,589) P/L
Depreciation equivalent amount 48,295 48,366 71
Depreciation and amortization 19,675 19,919 244 C/F Depreciation under concession agreements and G&A
Amortization of goodwill 3,380 3,380 0 C/F
Recovery of recoverable accounts (capital expenditure)
25,240 25,067 (173) C/F Depreciation under PS contracts
Exploration cost equivalent amount 32,435 15,104 (17,331)
Exploration expenses 15,722 8,098 (7,624) P/L Exploration expense under concession agreements
Provision for allowance for recoverable accounts under production sharing
14,192 2,653 (11,539)P/L Exploration expense under PS contracts
Provision for exploration projects 2,521 4,353 1,832 P/L Exploration expense under PS contracts
Material non‐cash items (6,376) 2,477 8,853
Deferred income taxes (7,360) 2,336 9,696 P/L
Foreign exchange loss 984 141 (843) C/F
Net interest income, after tax (42) (1,161) (1,119) P/L After‐tax interest expense minus interest income
EBIDAX 182,676 115,178 (67,498)
5
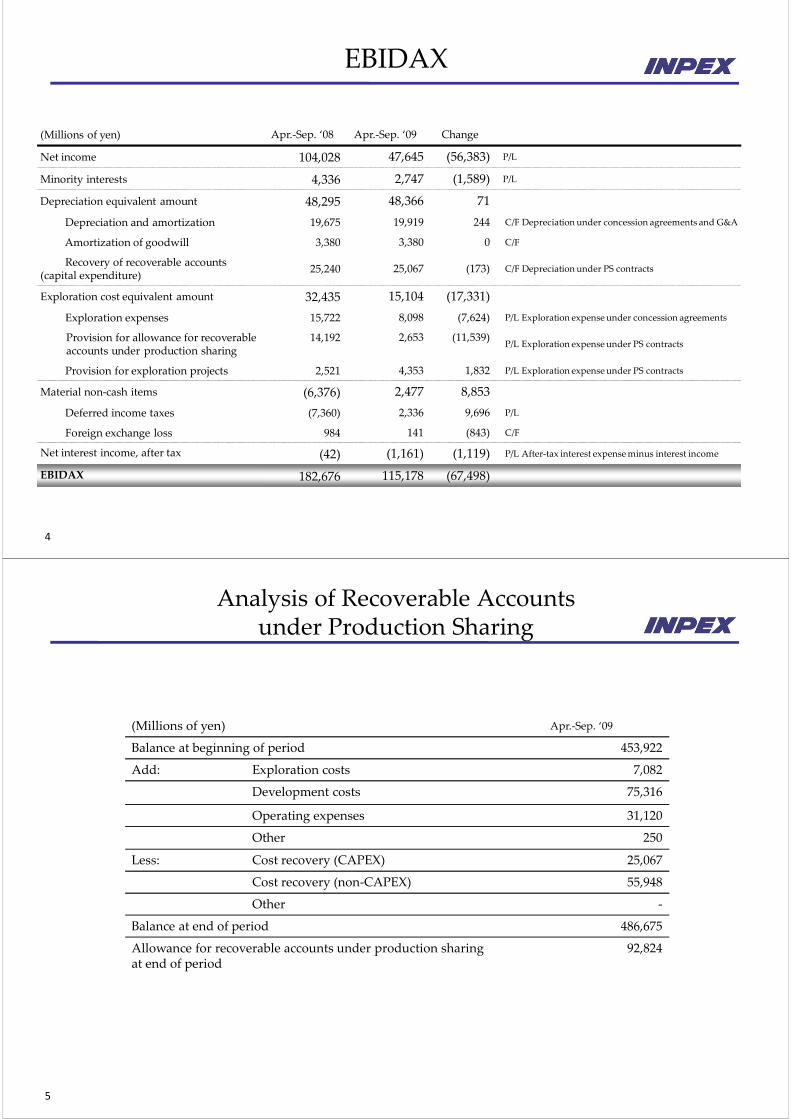
Analysis of Recoverable Accountsunder Production Sharing
(Millions of yen) Apr.‐Sep. ‘09
Balance at beginning of period 453,922
Add: Exploration costs 7,082
Development costs 75,316
Operating expenses 31,120
Other 250
Less: Cost recovery (CAPEX) 25,067
Cost recovery (non‐CAPEX) 55,948
Other ‐
Balance at end of period 486,675
Allowance for recoverable accounts under production sharing at end of period
92,824
6
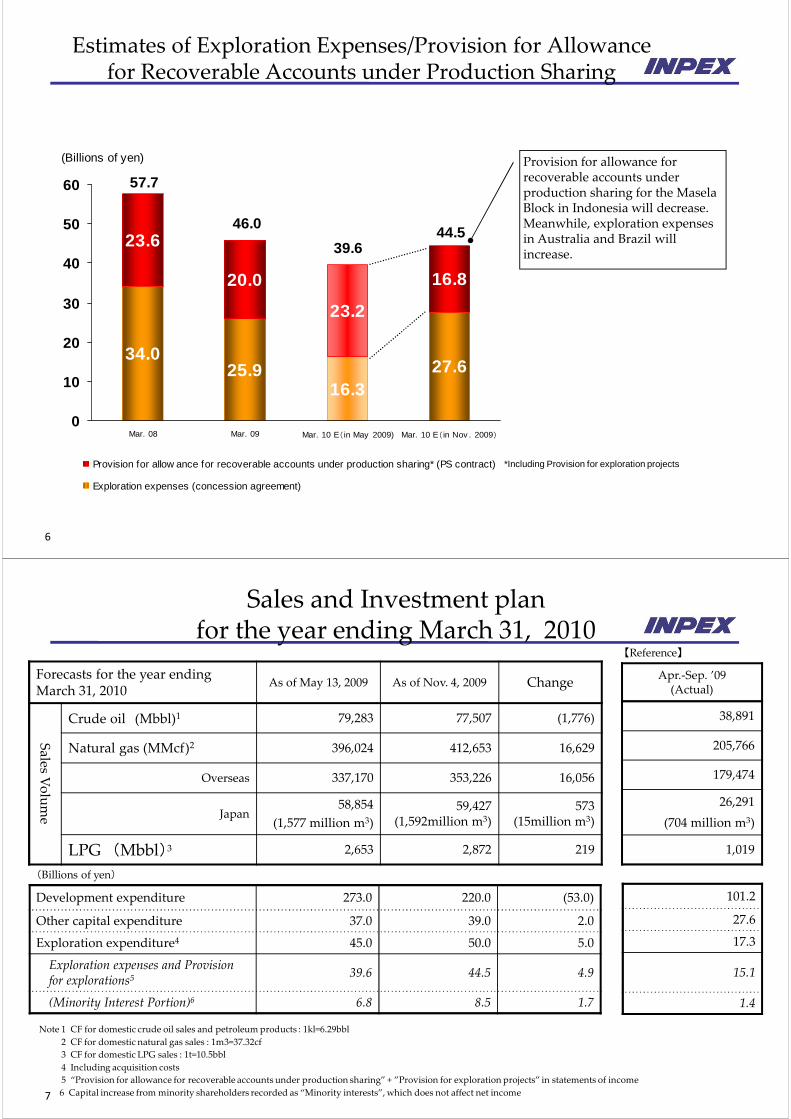
Estimates of Exploration Expenses/Provision for Allowance for Recoverable Accounts under Production Sharing
Provision for allowance for recoverable accounts under production sharing for the MaselaBlock in Indonesia will decrease.Meanwhile, exploration expenses in Australia and Brazil will increase.
34.025.9
16.327.6
23.6
20.0
23.2
16.8
0
10
20
30
40
50
60
Mar. 08 Mar. 09 Mar. 10 E(in May 2009) Mar. 10 E(in Nov . 2009)
Provision for allow ance for recoverable accounts under production sharing* (PS contract)
Exploration expenses (concession agreement)
(Billions of yen)
46.0
39.6
57.7
44.5
*Including Provision for exploration projects
7
Sales and Investment plan for the year ending March 31, 2010
Forecasts for the year ending March 31, 2010
As of May 13, 2009 As of Nov. 4, 2009 Change
Sales V
olume
Crude oil (Mbbl)1 79,283 77,507 (1,776)
Natural gas (MMcf)2 396,024 412,653 16,629
Overseas 337,170 353,226 16,056
Japan58,854
(1,577 million m3)
59,427(1,592million m3)
573(15million m3)
LPG (Mbbl)3 2,653 2,872 219
Apr.‐Sep. ’09(Actual)
38,891
205,766
179,474
26,291
(704 million m3)
1,019
Note 1 CF for domestic crude oil sales and petroleum products : 1kl=6.29bbl
2 CF for domestic natural gas sales : 1m3=37.32cf
3 CF for domestic LPG sales : 1t=10.5bbl
4 Including acquisition costs
5 “Provision for allowance for recoverable accounts under production sharing” + ”Provision for exploration projects” in statements of income
6 Capital increase from minority shareholders recorded as “Minority interests”, which does not affect net income
Development expenditure 273.0 220.0 (53.0)
Other capital expenditure 37.0 39.0 2.0
Exploration expenditure4 45.0 50.0 5.0
Exploration expenses and Provision for explorations5
39.6 44.5 4.9
(Minority Interest Portion)6 6.8 8.5 1.7
101.2
27.6
17.3
15.1
1.4
【Reference】
(Billions of yen)
8
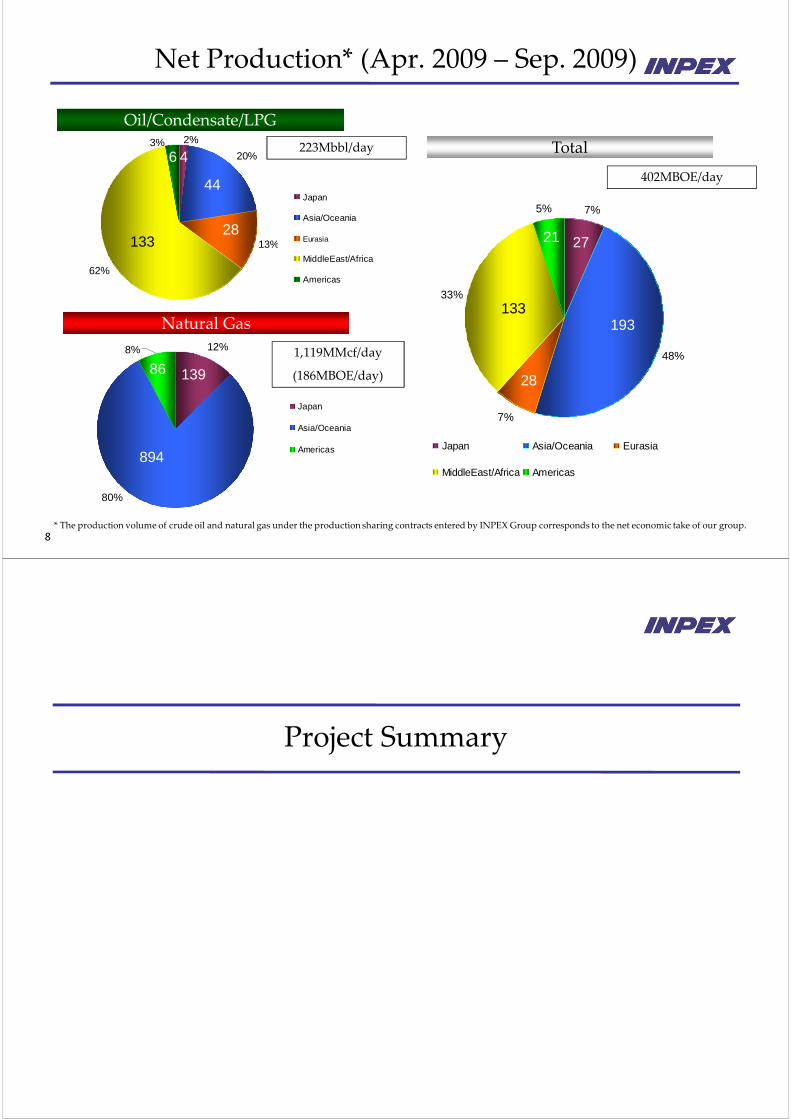
Net Production* (Apr. 2009 – Sep. 2009)
7%
48%
7%
33%
5%
Japan Asia/Oceania Eurasia
MiddleEast/Africa Americas
13%
20%
62%
2%3%
Japan
Asia/Oceania
Eurasia
MiddleEast/Africa
Americas
19312%8%
80%
Japan
Asia/Oceania
Americas
223Mbbl/day
27
28
133
21
4
44
28133
6
139
894
86
* The production volume of crude oil and natural gas under the production sharing contracts entered by INPEX Group corresponds to the net economic take of our group.
Oil/Condensate/LPG
Natural Gas
Total
1,119MMcf/day
(186MBOE/day)
402MBOE/day
Project Summary
10
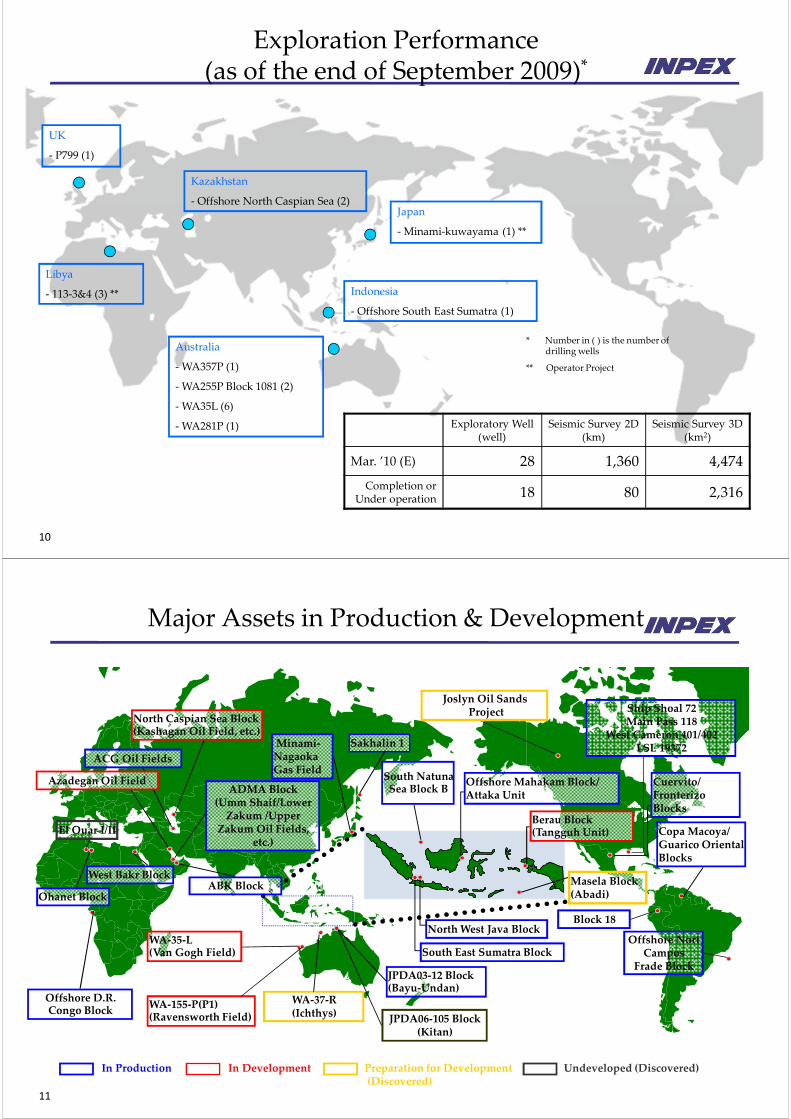
Exploration Performance (as of the end of September 2009)*
Japan
‐Minami‐kuwayama (1) **
Indonesia
‐ Offshore South East Sumatra (1)
Australia
‐WA357P (1)
‐WA255P Block 1081 (2)
‐WA35L (6)
‐WA281P (1)
Libya
‐ 113‐3&4 (3) **
Kazakhstan
‐ Offshore North Caspian Sea (2)
UK
‐ P799 (1)
Exploratory Well (well)
Seismic Survey 2D (km)
Seismic Survey 3D (km2)
Mar. ’10 (E) 28 1,360 4,474
Completion or Under operation 18 80 2,316
* Number in ( ) is the number of drilling wells
** Operator Project
11
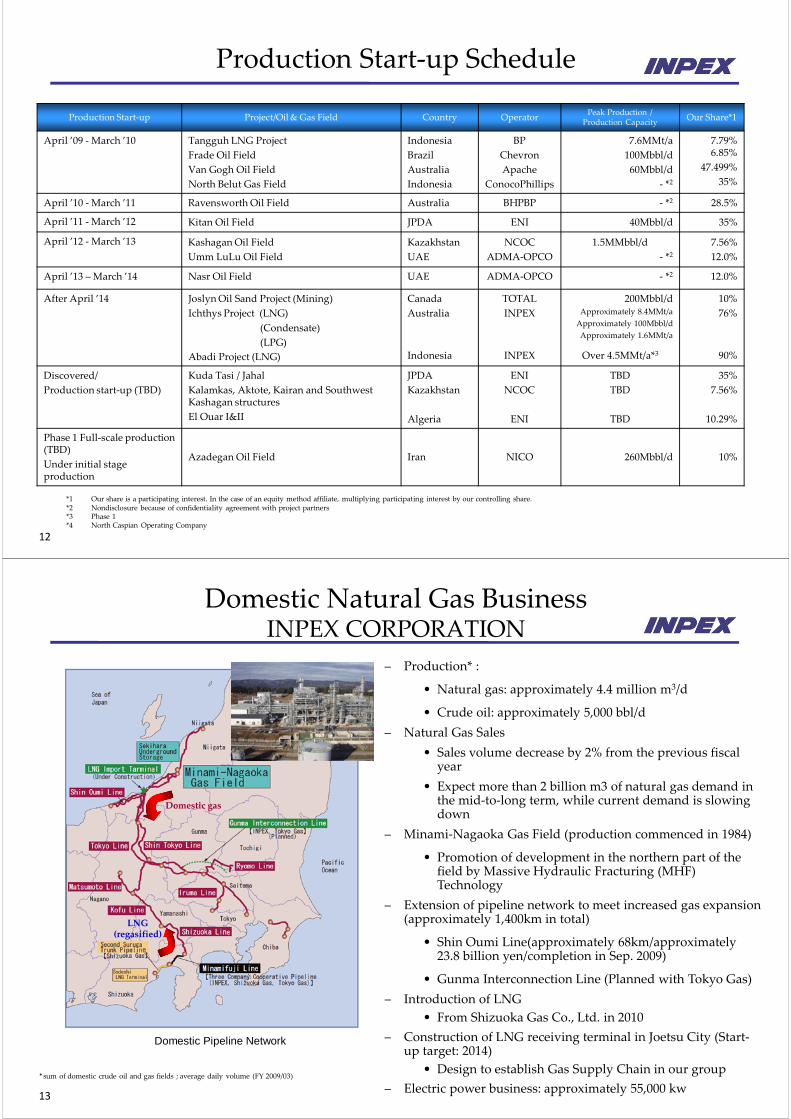
Major Assets in Production & Development
WA‐37‐R(Ichthys)
Block 18
JPDA06‐105 Block(Kitan)
Ship Shoal 72Main Pass 118
West Cameron 401/402LSL 19372
WA‐35‐L(Van Gogh Field)
Offshore D.R. Congo Block
In Production In Development Undeveloped (Discovered)Preparation for Development(Discovered)
Ohanet Block
West Bakr Block
El Ouar I/II
Azadegan Oil Field
North Caspian Sea Block(Kashagan Oil Field, etc.)
ACG Oil Fields
Minami‐Nagaoka Gas Field
Sakhalin 1
ABK Block
South Natuna Sea Block B
Joslyn Oil SandsProject
Offshore Mahakam Block/ Attaka Unit
Masela Block(Abadi)
Berau Block(Tangguh Unit)
Cuervito/ Fronterizo Blocks
Copa Macoya/ Guarico Oriental Blocks
Offshore Nort Campos
Frade Block
North West Java Block
South East Sumatra Block
JPDA03‐12 Block(Bayu‐Undan)
WA‐155‐P(P1)(Ravensworth Field)
ADMA Block(Umm Shaif/Lower Zakum /Upper
Zakum Oil Fields, etc.)
12
Production Start‐up Schedule
Production Start‐up Project/Oil & Gas Field Country OperatorPeak Production /
Production CapacityOur Share*1
April ’09 ‐March ’10 Tangguh LNG Project
Frade Oil Field
Van Gogh Oil Field
North Belut Gas Field
Indonesia
Brazil
Australia
Indonesia
BP
Chevron
Apache
ConocoPhillips
7.6MMt/a
100Mbbl/d
60Mbbl/d
‐ *2
7.79% 6.85%
47.499%
35%
April ’10 ‐March ’11 Ravensworth Oil Field Australia BHPBP ‐ *2 28.5%
April ’11 ‐March ’12 Kitan Oil Field JPDA ENI 40Mbbl/d 35%
April ’12 ‐March ’13 Kashagan Oil Field
Umm LuLu Oil Field
Kazakhstan
UAE
NCOC
ADMA‐OPCO
1.5MMbbl/d
‐ *27.56%
12.0%
April ’13 – March ’14 Nasr Oil Field UAE ADMA‐OPCO ‐ *2 12.0%
After April ’14 Joslyn Oil Sand Project (Mining)
Ichthys Project (LNG)
(Condensate)
(LPG)
Abadi Project (LNG)
Canada
Australia
Indonesia
TOTAL
INPEX
INPEX
200Mbbl/dApproximately 8.4MMt/a
Approximately 100Mbbl/d
Approximately 1.6MMt/a
Over 4.5MMt/a*3
10%
76%
90%
Discovered/
Production start‐up (TBD)
Kuda Tasi / Jahal
Kalamkas, Aktote, Kairan and Southwest Kashagan structures
El Ouar I&II
JPDA
Kazakhstan
Algeria
ENI
NCOC
ENI
TBD
TBD
TBD
35%
7.56%
10.29%
Phase 1 Full‐scale production (TBD)
Under initial stage production
Azadegan Oil Field Iran NICO 260Mbbl/d 10%
*1 Our share is a participating interest. In the case of an equity method affiliate, multiplying participating interest by our controlling share.*2 Nondisclosure because of confidentiality agreement with project partners*3 Phase 1*4 North Caspian Operating Company
13
Domestic Natural Gas BusinessINPEX CORPORATION
Domestic gas
LNG(regasified)
Domestic Pipeline Network
– Production* :
• Natural gas: approximately 4.4 million m3/d
• Crude oil: approximately 5,000 bbl/d
– Natural Gas Sales
• Sales volume decrease by 2% from the previous fiscal year
• Expect more than 2 billion m3 of natural gas demand in the mid‐to‐long term, while current demand is slowing down
– Minami‐Nagaoka Gas Field (production commenced in 1984)
• Promotion of development in the northern part of the field by Massive Hydraulic Fracturing (MHF) Technology
– Extension of pipeline network to meet increased gas expansion (approximately 1,400km in total)
• Shin Oumi Line(approximately 68km/approximately 23.8 billion yen/completion in Sep. 2009)
• Gunma Interconnection Line (Planned with Tokyo Gas)
– Introduction of LNG
• From Shizuoka Gas Co., Ltd. in 2010
– Construction of LNG receiving terminal in Joetsu City (Start‐up target: 2014)
• Design to establish Gas Supply Chain in our group
– Electric power business: approximately 55,000 kw
*sum of domestic crude oil and gas fields ; average daily volume (FY 2009/03)
14
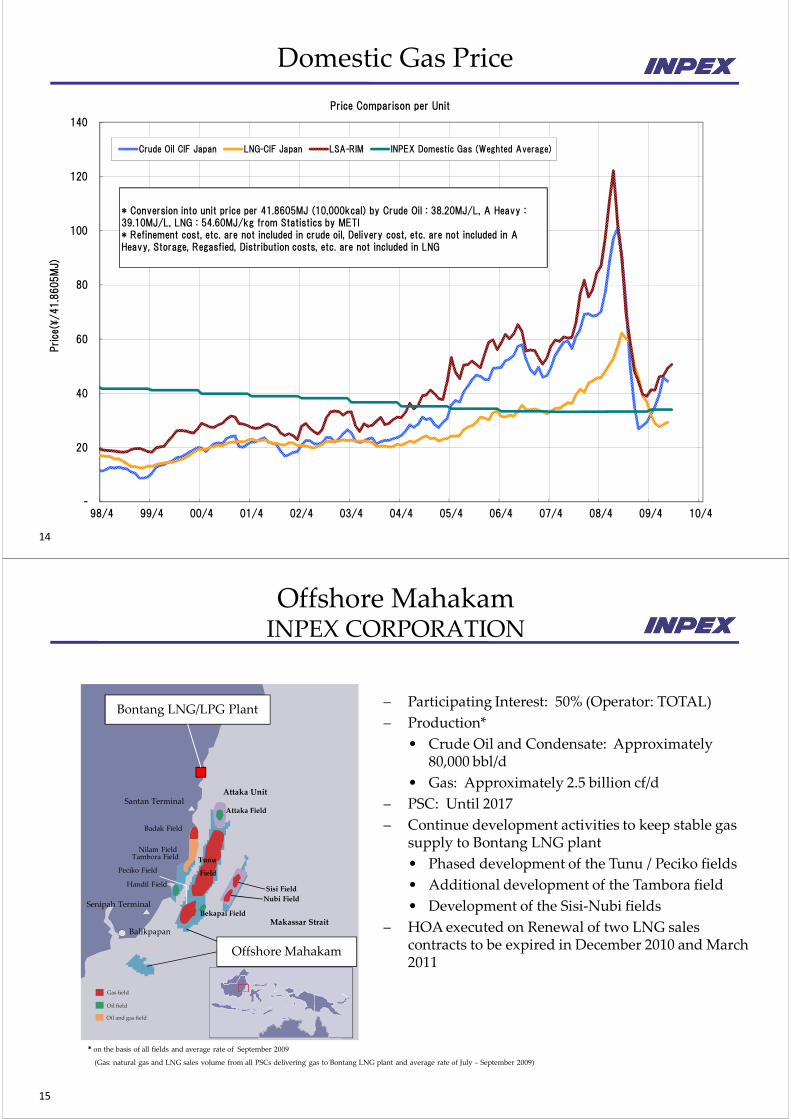
Domestic Gas Price
-
20
40
60
80
100
120
140
98/4 99/4 00/4 01/4 02/4 03/4 04/4 05/4 06/4 07/4 08/4 09/4 10/4
Price
(¥/41.8
605M
J)
Price Comparison per Unit
Crude Oil CIF Japan LNG-CIF Japan LSA-RIM INPEX Domestic Gas (Weghted Average)
* Conversion into unit price per 41.8605MJ (10,000kcal) by Crude Oil : 38.20MJ/L, A Heavy : 39.10MJ/L, LNG : 54.60MJ/kg from Statistics by METI* Refinement cost, etc. are not included in crude oil, Delivery cost, etc. are not included in A Heavy, Storage, Regasfied, Distribution costs, etc. are not included in LNG
15
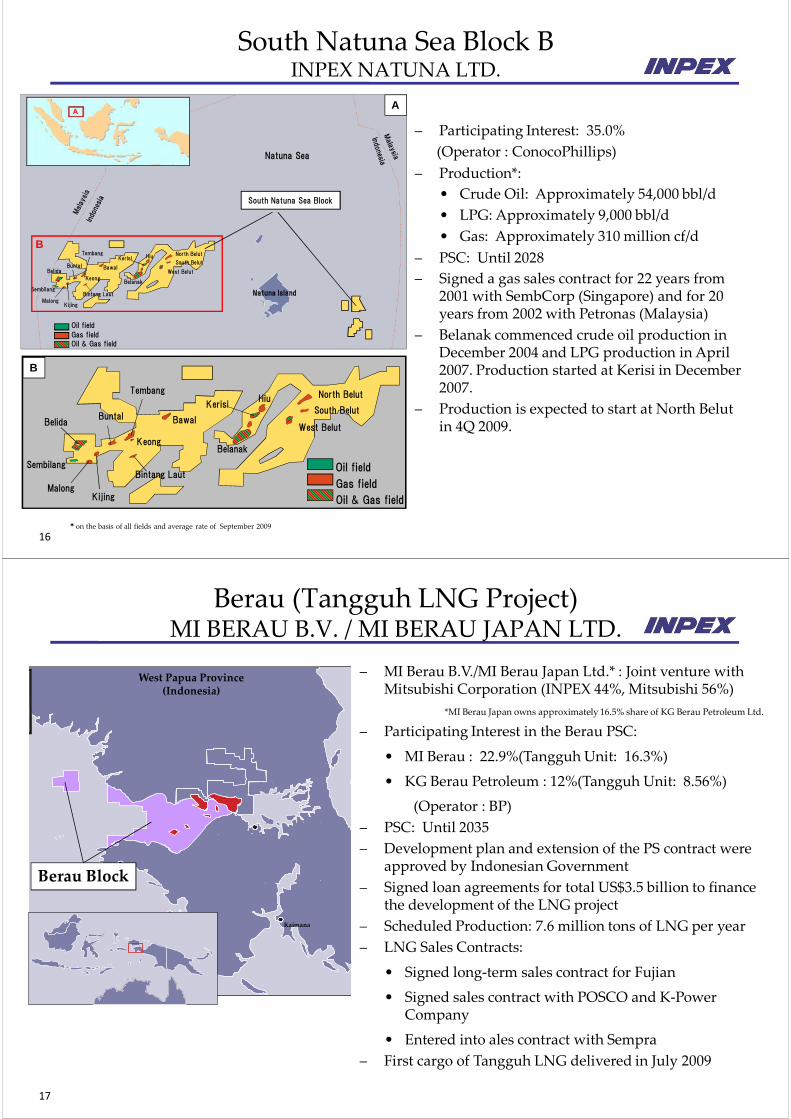
Offshore MahakamINPEX CORPORATION
Offshore Mahakam
Gas field
Oil field
Oil and gas field
Balikpapan
Santan TerminalAttaka Unit
Sisi Field
Nubi Field
Bekapai Field
Tunu
Field
Makassar Strait
Senipah Terminal
Handil Field
Attaka Field
Badak Field
Nilam Field
Peciko Field
Tambora Field
* on the basis of all fields and average rate of September 2009
(Gas: natural gas and LNG sales volume from all PSCs delivering gas to Bontang LNG plant and average rate of July – September 2009)
Bontang LNG/LPG Plant– Participating Interest: 50% (Operator: TOTAL)
– Production*
• Crude Oil and Condensate: Approximately 80,000 bbl/d
• Gas: Approximately 2.5 billion cf/d
– PSC: Until 2017
– Continue development activities to keep stable gas supply to Bontang LNG plant
• Phased development of the Tunu / Peciko fields
• Additional development of the Tambora field
• Development of the Sisi‐Nubi fields
– HOA executed on Renewal of two LNG sales contracts to be expired in December 2010 and March 2011
16
South Natuna Sea Block BINPEX NATUNA LTD.
– Participating Interest: 35.0%
(Operator : ConocoPhillips)
– Production*:
• Crude Oil: Approximately 54,000 bbl/d
• LPG: Approximately 9,000 bbl/d
• Gas: Approximately 310 million cf/d
– PSC: Until 2028
– Signed a gas sales contract for 22 years from 2001 with SembCorp (Singapore) and for 20 years from 2002 with Petronas (Malaysia)
– Belanak commenced crude oil production in December 2004 and LPG production in April 2007. Production started at Kerisi in December 2007.
– Production is expected to start at North Belut in 4Q 2009.
Natuna Sea
South Natuna Sea Block
Natuna Island
West Belut
South Belut
North BelutHiuKerisi
Belanak
BelidaBuntal
KijingMalong
Sembilang
Oil field
Gas fieldOil & Gas field
Bintang Laut
Keong
Tembang
Bawal
West Belut
South Belut
North BelutHiuKerisi
Belanak
BelidaBuntal
KijingMalong
SembilangBintang Laut
Keong
Tembang
Bawal
A
B
B
A
Oil field
Gas field
Oil & Gas field
* on the basis of all fields and average rate of September 2009
17
Berau (Tangguh LNG Project)MI BERAU B.V. / MI BERAU JAPAN LTD.
West Papua Province(Indonesia)
Berau Block
Kaimana
– MI Berau B.V./MI Berau Japan Ltd.* : Joint venture with Mitsubishi Corporation (INPEX 44%, Mitsubishi 56%)
*MI Berau Japan owns approximately 16.5% share of KG Berau Petroleum Ltd.
– Participating Interest in the Berau PSC:
• MI Berau : 22.9%(Tangguh Unit: 16.3%)
• KG Berau Petroleum : 12%(Tangguh Unit: 8.56%)
(Operator : BP)
– PSC: Until 2035
– Development plan and extension of the PS contract were approved by Indonesian Government
– Signed loan agreements for total US$3.5 billion to finance the development of the LNG project
– Scheduled Production: 7.6 million tons of LNG per year
– LNG Sales Contracts:
• Signed long‐term sales contract for Fujian
• Signed sales contract with POSCO and K‐Power Company
• Entered into ales contract with Sempra
– First cargo of Tangguh LNG delivered in July 2009
18
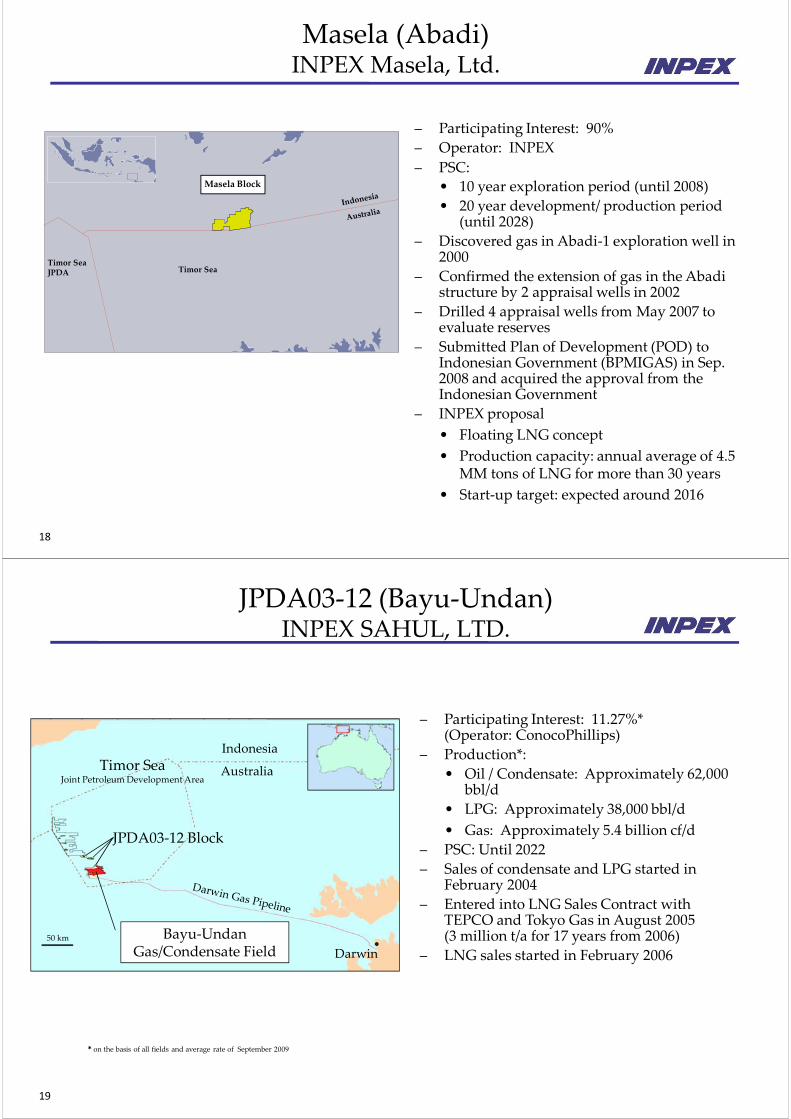
Masela (Abadi)INPEX Masela, Ltd.
Masela Block
Timor SeaJPDA Timor Sea
– Participating Interest: 90%
– Operator: INPEX
– PSC:
• 10 year exploration period (until 2008)
• 20 year development/ production period (until 2028)
– Discovered gas in Abadi‐1 exploration well in 2000
– Confirmed the extension of gas in the Abadi structure by 2 appraisal wells in 2002
– Drilled 4 appraisal wells from May 2007 to evaluate reserves
– Submitted Plan of Development (POD) to Indonesian Government (BPMIGAS) in Sep. 2008 and acquired the approval from the Indonesian Government
– INPEX proposal
• Floating LNG concept
• Production capacity: annual average of 4.5 MM tons of LNG for more than 30 years
• Start‐up target: expected around 2016
19
JPDA03‐12 (Bayu‐Undan)INPEX SAHUL, LTD.
– Participating Interest: 11.27%*(Operator: ConocoPhillips)
– Production*:
• Oil / Condensate: Approximately 62,000 bbl/d
• LPG: Approximately 38,000 bbl/d
• Gas: Approximately 5.4 billion cf/d
– PSC: Until 2022
– Sales of condensate and LPG started in February 2004
– Entered into LNG Sales Contract with TEPCO and Tokyo Gas in August 2005 (3 million t/a for 17 years from 2006)
– LNG sales started in February 2006Darwin
Bayu‐UndanGas/Condensate Field
Timor SeaJoint Petroleum Development Area
JPDA03‐12 Block
Australia
Indonesia
50 km
* on the basis of all fields and average rate of September 2009
20
Ichthys gas-condensate field
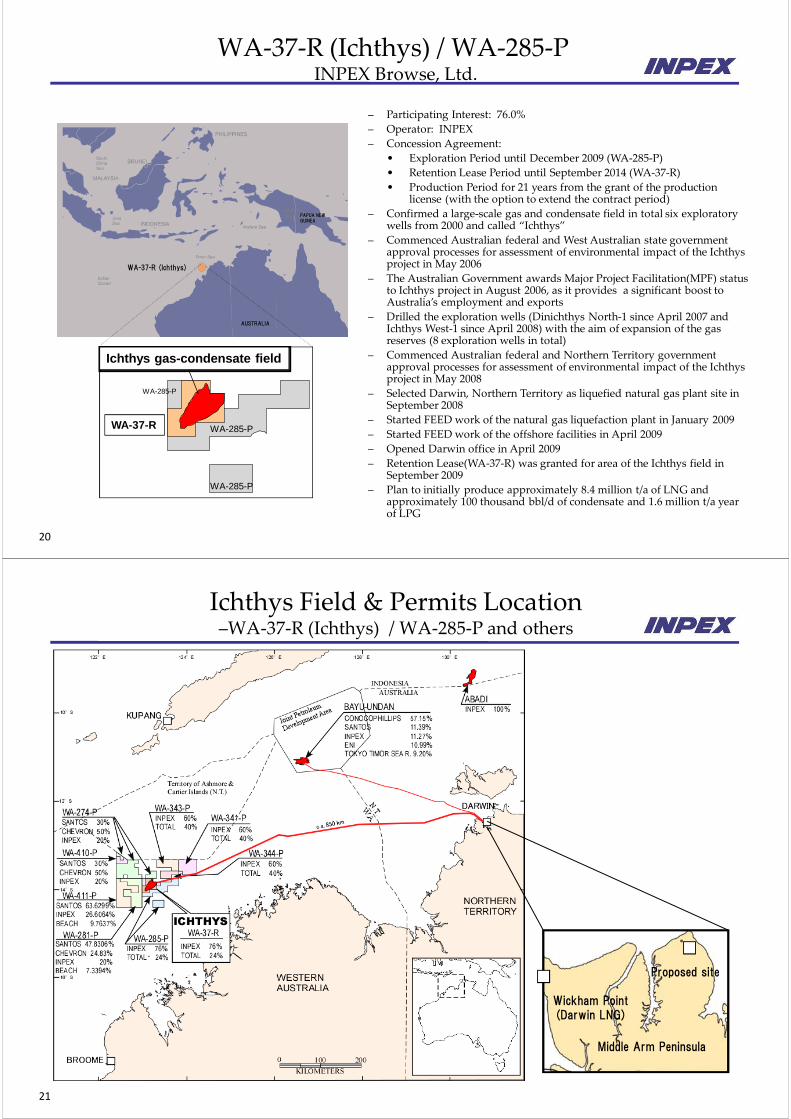
WA‐37‐R (Ichthys) / WA‐285‐P INPEX Browse, Ltd.
– Participating Interest: 76.0%
– Operator: INPEX
– Concession Agreement:
• Exploration Period until December 2009 (WA‐285‐P)
• Retention Lease Period until September 2014 (WA‐37‐R)
• Production Period for 21 years from the grant of the production license (with the option to extend the contract period)
– Confirmed a large‐scale gas and condensate field in total six exploratory wells from 2000 and called “Ichthys”
– Commenced Australian federal and West Australian state government approval processes for assessment of environmental impact of the Ichthys project in May 2006
– The Australian Government awards Major Project Facilitation(MPF) status to Ichthys project in August 2006, as it provides a significant boost to Australia’s employment and exports
– Drilled the exploration wells (Dinichthys North‐1 since April 2007 and Ichthys West‐1 since April 2008) with the aim of expansion of the gas reserves (8 exploration wells in total)
– Commenced Australian federal and Northern Territory government approval processes for assessment of environmental impact of the Ichthys project in May 2008
– Selected Darwin, Northern Territory as liquefied natural gas plant site in September 2008
– Started FEED work of the natural gas liquefaction plant in January 2009
– Started FEED work of the offshore facilities in April 2009
– Opened Darwin office in April 2009
– Retention Lease(WA‐37‐R) was granted for area of the Ichthys field in September 2009
– Plan to initially produce approximately 8.4 million t/a of LNG and approximately 100 thousand bbl/d of condensate and 1.6 million t/a year of LPG
WA-37-R (Ichthys)
PAPUA NEW GUINEA
AUSTRALIA
Ichthys gas-condensate field
WA-285-P
WA-37-R WA-285-P
WA-285-P
21
Ichthys Field & Permits Location–WA‐37‐R (Ichthys) / WA‐285‐P and others
Wickham Point(Darwin LNG)
Proposed site
Middle Arm Peninsula
22
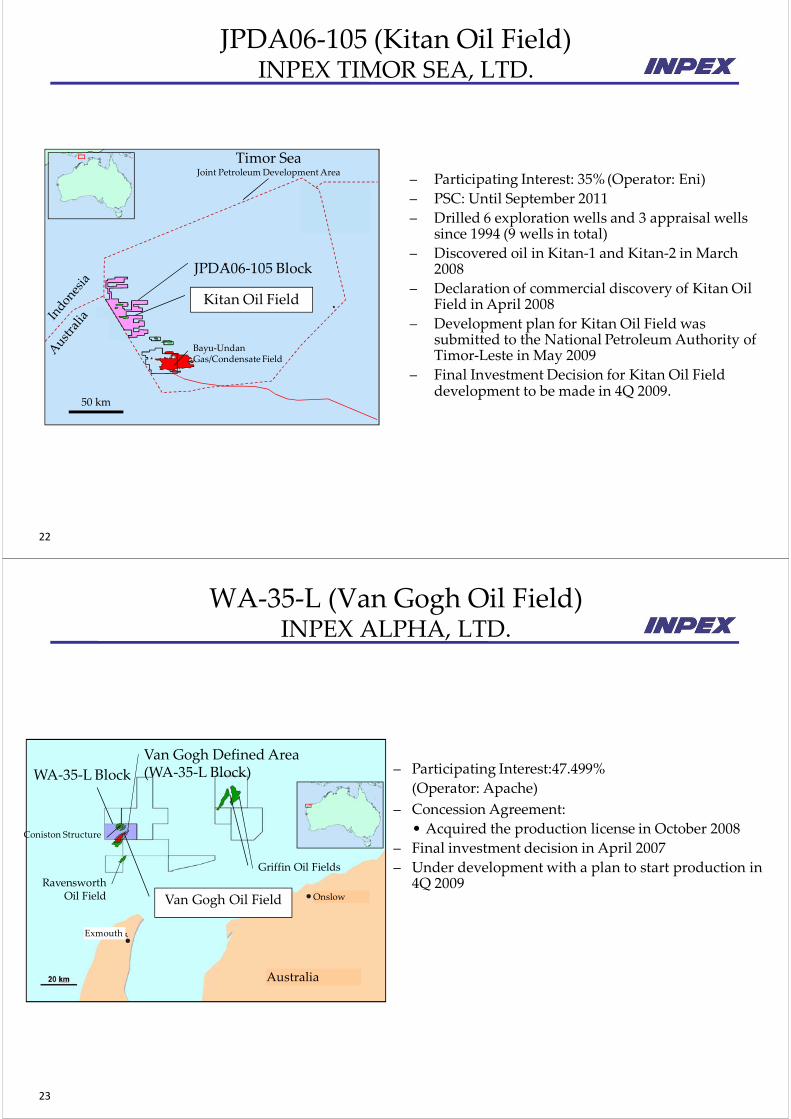
JPDA06‐105 (Kitan Oil Field)INPEX TIMOR SEA, LTD.
– Participating Interest: 35%(Operator: Eni)
– PSC: Until September 2011
– Drilled 6 exploration wells and 3 appraisal wells since 1994 (9 wells in total)
– Discovered oil in Kitan‐1 and Kitan‐2 in March 2008
– Declaration of commercial discovery of Kitan Oil Field in April 2008
– Development plan for Kitan Oil Field was submitted to the National Petroleum Authority of Timor‐Leste in May 2009
– Final Investment Decision for Kitan Oil Field development to be made in 4Q 2009.
Kitan Oil Field
JPDA06‐105 Block
50 km
Bayu‐UndanGas/Condensate Field
Timor SeaJoint Petroleum Development Area
23
WA‐35‐L (Van Gogh Oil Field)INPEX ALPHA, LTD.
– Participating Interest:47.499%
(Operator: Apache)
– Concession Agreement:
• Acquired the production license in October 2008
– Final investment decision in April 2007
– Under development with a plan to start production in 4Q 2009
Van Gogh Oil Field
Van Gogh Defined Area(WA‐35‐L Block)
Coniston Structure
Ravensworth Oil Field
Griffin Oil Fields
WA‐35‐L Block
Australia
Onslow
Exmouth
24
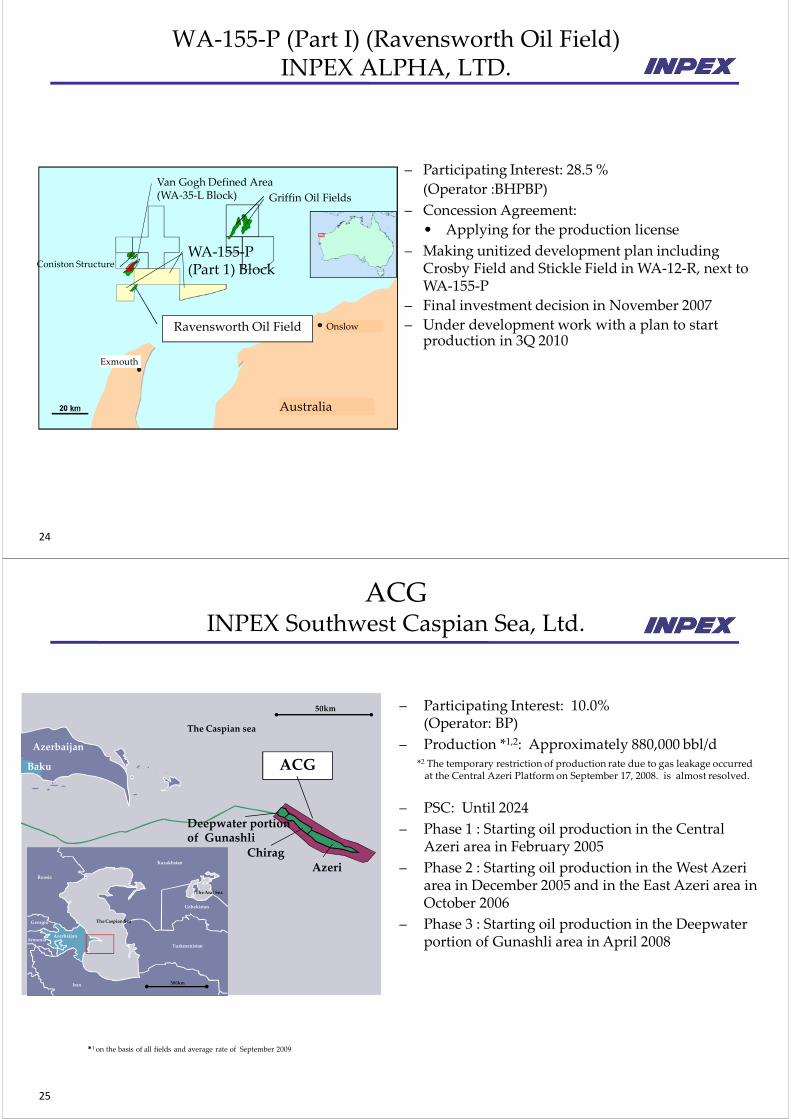
WA‐155‐P (Part I) (Ravensworth Oil Field) INPEX ALPHA, LTD.
– Participating Interest: 28.5 %
(Operator :BHPBP)
– Concession Agreement:
• Applying for the production license
– Making unitized development plan including Crosby Field and Stickle Field in WA‐12‐R, next to WA‐155‐P
– Final investment decision in November 2007
– Under development work with a plan to start production in 3Q 2010
Van Gogh Defined Area(WA‐35‐L Block)
Coniston Structure
Griffin Oil Fields
Australia
Onslow
Exmouth
Ravensworth Oil Field
WA‐155‐P(Part 1) Block
25
ACGINPEX Southwest Caspian Sea, Ltd.
ACG
Azerbaijan
Baku
Kazakhstan
The Aral Sea
Uzbekistan
Russia
Turkmenistan
ArmeniaAzerbaijan
Georgia
Iran
The Caspian Sea
500km
The Caspian sea
50km
ACG
Deepwater portionof Gunashli
ChiragAzeri
– Participating Interest: 10.0% (Operator: BP)
– Production *1,2: Approximately 880,000 bbl/d
– PSC: Until 2024
– Phase 1 : Starting oil production in the Central Azeri area in February 2005
– Phase 2 : Starting oil production in the West Azeri area in December 2005 and in the East Azeri area in October 2006
– Phase 3 : Starting oil production in the Deepwater portion of Gunashli area in April 2008
*2 The temporary restriction of production rate due to gas leakage occurred at the Central Azeri Platform on September 17, 2008. is almost resolved.
*1 on the basis of all fields and average rate of September 2009
26
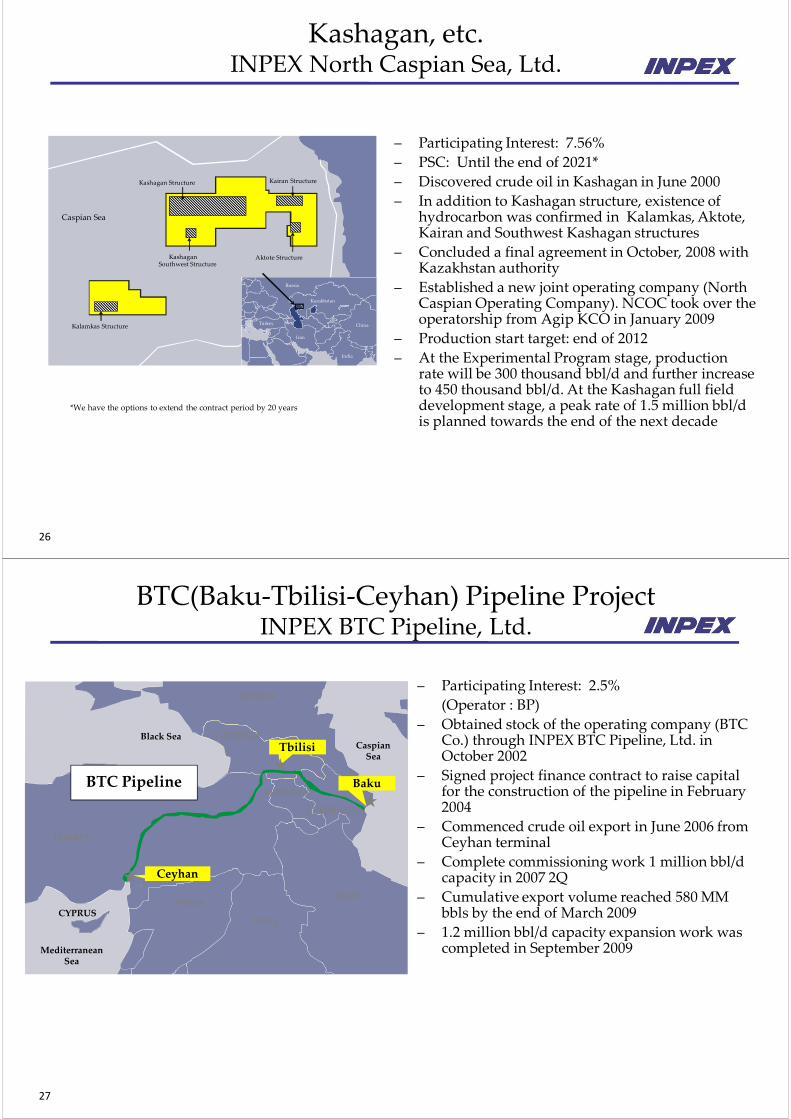
Kashagan, etc.INPEX North Caspian Sea, Ltd.
Kairan Structure
Caspian Sea
Aktote StructureKashaganSouthwest Structure
Kashagan Structure
Russia
Kazakhstan
China
India
Turkey
Iran
Kalamkas Structure
– Participating Interest: 7.56%
– PSC: Until the end of 2021*
– Discovered crude oil in Kashagan in June 2000
– In addition to Kashagan structure, existence of hydrocarbon was confirmed in Kalamkas, Aktote, Kairan and Southwest Kashagan structures
– Concluded a final agreement in October, 2008 with Kazakhstan authority
– Established a new joint operating company (North Caspian Operating Company). NCOC took over the operatorship from Agip KCO in January 2009
– Production start target: end of 2012
– At the Experimental Program stage, production rate will be 300 thousand bbl/d and further increase to 450 thousand bbl/d. At the Kashagan full field development stage, a peak rate of 1.5 million bbl/d is planned towards the end of the next decade
*We have the options to extend the contract period by 20 years
27
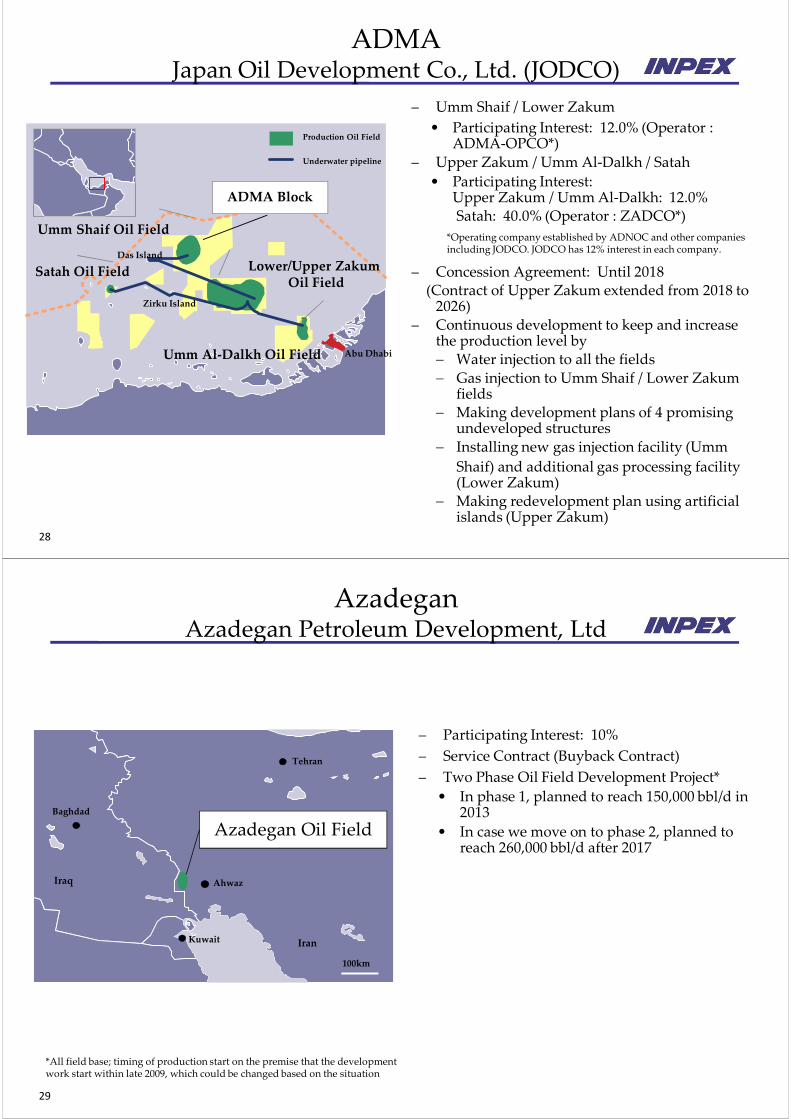
BTC(Baku‐Tbilisi‐Ceyhan) Pipeline ProjectINPEX BTC Pipeline, Ltd.
– Participating Interest: 2.5%
(Operator : BP)
– Obtained stock of the operating company (BTC Co.) through INPEX BTC Pipeline, Ltd. in October 2002
– Signed project finance contract to raise capital for the construction of the pipeline in February 2004
– Commenced crude oil export in June 2006 from Ceyhan terminal
– Complete commissioning work 1 million bbl/d capacity in 2007 2Q
– Cumulative export volume reached 580 MM bbls by the end of March 2009
– 1.2 million bbl/d capacity expansion work was completed in September 2009
BTC Pipeline
TbilisiBlack Sea
RUSSIA
GEORGIACaspian Sea
Mediterranean Sea
TURKEY
SYRIA
IRAQ
IRAN
Ceyhan
CYPRUS
AZERBAIJAN
ARMENIABaku
28
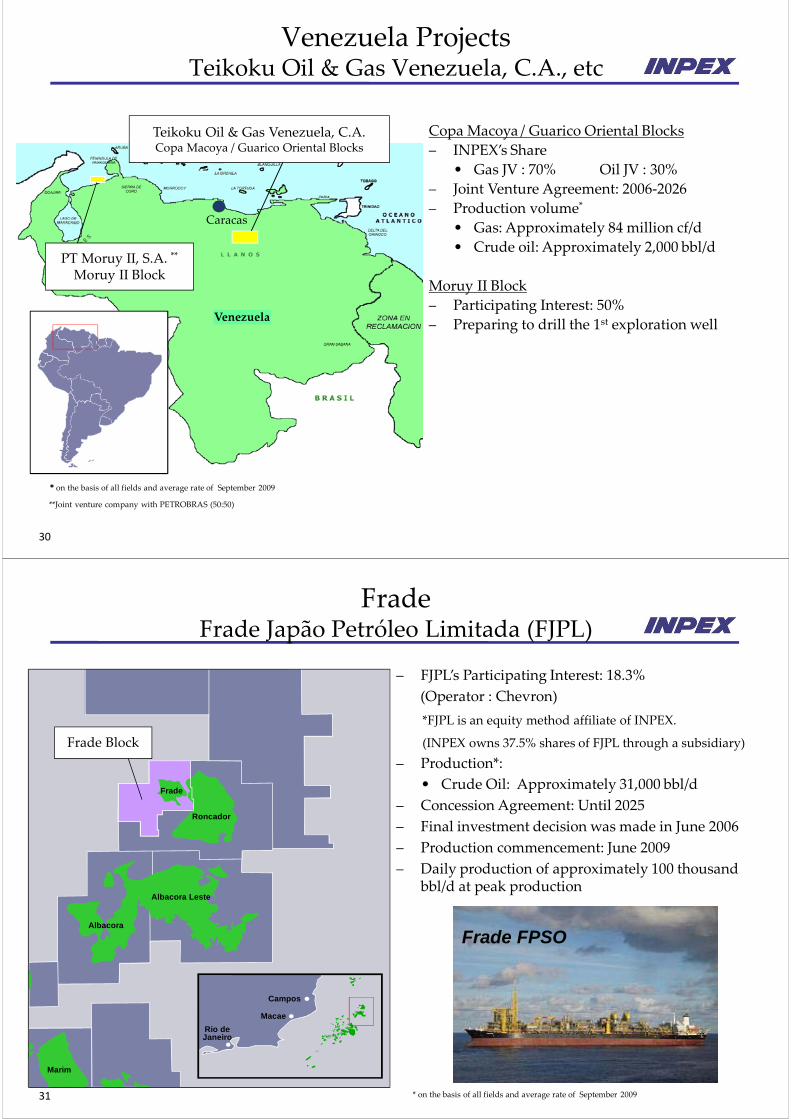
ADMAJapan Oil Development Co., Ltd. (JODCO)
– Umm Shaif / Lower Zakum
• Participating Interest: 12.0% (Operator : ADMA‐OPCO*)
– Upper Zakum / Umm Al‐Dalkh / Satah
• Participating Interest: Upper Zakum / Umm Al‐Dalkh: 12.0%Satah: 40.0% (Operator : ZADCO*)
– Concession Agreement: Until 2018(Contract of Upper Zakum extended from 2018 to 2026)
– Continuous development to keep and increase the production level by Water injection to all the fields Gas injection to Umm Shaif / Lower Zakum
fields Making development plans of 4 promising
undeveloped structures Installing new gas injection facility (Umm
Shaif) and additional gas processing facility(Lower Zakum)
Making redevelopment plan using artificial islands (Upper Zakum)
*Operating company established by ADNOC and other companies including JODCO. JODCO has 12% interest in each company.
Abu Dhabi
Production Oil Field
Zirku Island
Satah Oil Field
ADMA Block
Umm Shaif Oil Field
Lower/Upper Zakum Oil Field
Umm Al‐Dalkh Oil Field
Das Island
Underwater pipeline
29
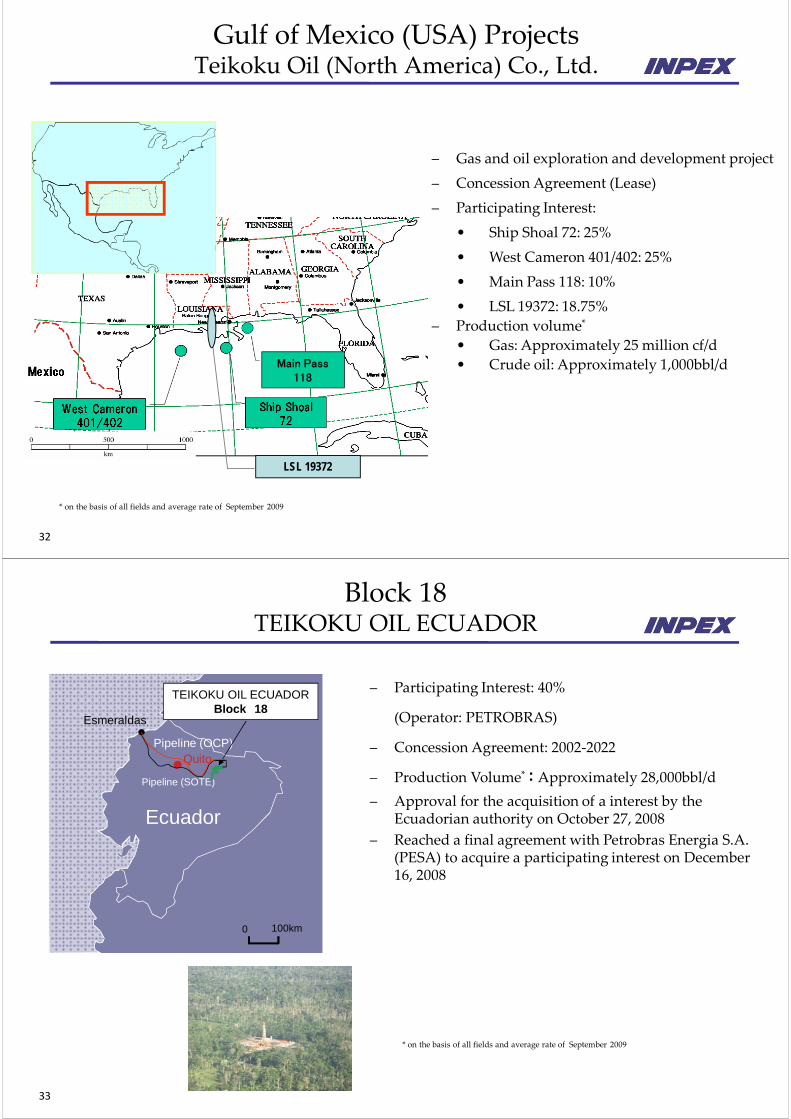
AzadeganAzadegan Petroleum Development, Ltd
– Participating Interest: 10%
– Service Contract (Buyback Contract)
– Two Phase Oil Field Development Project*
• In phase 1, planned to reach 150,000 bbl/d in 2013
• In case we move on to phase 2, planned to reach 260,000 bbl/d after 2017
*All field base; timing of production start on the premise that the development work start within late 2009, which could be changed based on the situation
Azadegan Oil Field
Tehran
Baghdad
Ahwaz
Kuwait
Iraq
Iran
100km
30
Venezuela ProjectsTeikoku Oil & Gas Venezuela, C.A., etc
*on the basis of all fields and average rate of September 2009
**Joint venture company with PETROBRAS (50:50)
Copa Macoya / Guarico Oriental Blocks
– INPEX’s Share
• Gas JV : 70% Oil JV : 30%
– Joint Venture Agreement: 2006‐2026
– Production volume*
• Gas: Approximately 84 million cf/d
• Crude oil: Approximately 2,000 bbl/d
Moruy II Block
– Participating Interest: 50%
– Preparing to drill the 1st exploration well
Caracas
Venezuela
Teikoku Oil & Gas Venezuela, C.A.Copa Macoya / Guarico Oriental Blocks
PT Moruy II, S.A. **
Moruy II Block
31
FradeFrade Japão Petróleo Limitada (FJPL)
– FJPL’s Participating Interest: 18.3%
(Operator : Chevron)
*FJPL is an equity method affiliate of INPEX.
(INPEX owns 37.5% shares of FJPL through a subsidiary)
– Production*:
• Crude Oil: Approximately 31,000 bbl/d
– Concession Agreement: Until 2025
– Final investment decision was made in June 2006
– Production commencement: June 2009
– Daily production of approximately 100 thousand bbl/d at peak production
Frade Block
Campos
Macae
Rio deJaneiro
Frade
Roncador
Albacora Leste
Albacora
Marim
Frade FPSO
* on the basis of all fields and average rate of September 2009
32
Gulf of Mexico (USA) ProjectsTeikoku Oil (North America) Co., Ltd.
– Gas and oil exploration and development project
– Concession Agreement (Lease)
– Participating Interest:
• Ship Shoal 72: 25%
• West Cameron 401/402: 25%
• Main Pass 118: 10%
• LSL 19372: 18.75%
– Production volume*
• Gas: Approximately 25 million cf/d
• Crude oil: Approximately 1,000bbl/d
LSL 19372
* on the basis of all fields and average rate of September 2009
Main Pass118
33
0 100km
Pipeline (OCP)
Pipeline (SOTE)
Ecuador
Quito
Esmeraldas
Block 18TEIKOKU OIL ECUADOR
TEIKOKU OIL ECUADORBlock 18
– Participating Interest: 40%
(Operator: PETROBRAS)
– Concession Agreement: 2002‐2022
– Production Volume* :Approximately 28,000bbl/d
– Approval for the acquisition of a interest by the Ecuadorian authority on October 27, 2008
– Reached a final agreement with Petrobras Energia S.A. (PESA) to acquire a participating interest on December 16, 2008
* on the basis of all fields and average rate of September 2009
34
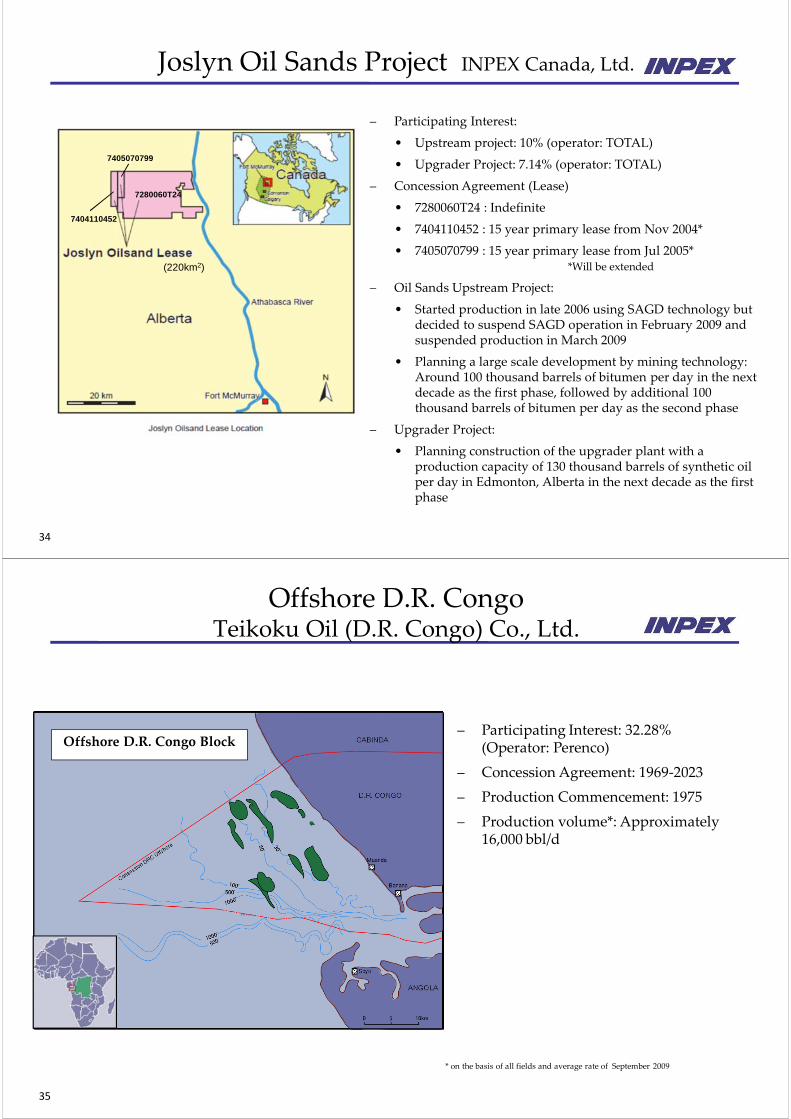
Joslyn Oil Sands Project INPEX Canada, Ltd.
7280060T24
7405070799
7404110452
(220km2)
– Participating Interest:
• Upstream project: 10% (operator: TOTAL)
• Upgrader Project: 7.14% (operator: TOTAL)
– Concession Agreement (Lease)
• 7280060T24 : Indefinite
• 7404110452 : 15 year primary lease from Nov 2004*
• 7405070799 : 15 year primary lease from Jul 2005**Will be extended
– Oil Sands Upstream Project:
• Started production in late 2006 using SAGD technology but decided to suspend SAGD operation in February 2009 and suspended production in March 2009
• Planning a large scale development by mining technology: Around 100 thousand barrels of bitumen per day in the next decade as the first phase, followed by additional 100 thousand barrels of bitumen per day as the second phase
– Upgrader Project:
• Planning construction of the upgrader plant with a production capacity of 130 thousand barrels of synthetic oil per day in Edmonton, Alberta in the next decade as the first phase
35
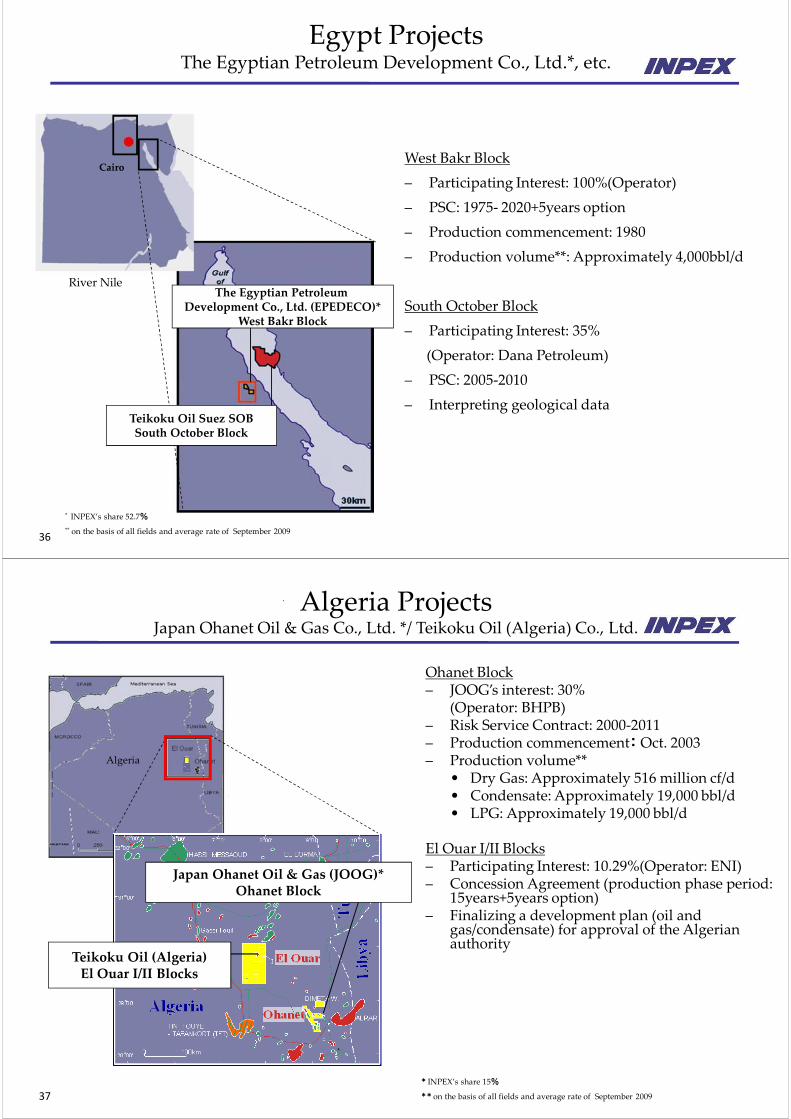
Offshore D.R. CongoTeikoku Oil (D.R. Congo) Co., Ltd.
– Participating Interest: 32.28%(Operator: Perenco)
– Concession Agreement: 1969‐2023
– Production Commencement: 1975
– Production volume*: Approximately 16,000 bbl/d
Offshore D.R. Congo Block
* on the basis of all fields and average rate of September 2009
36
Egypt ProjectsThe Egyptian Petroleum Development Co., Ltd.*, etc.
* INPEX’s share 52.7%
** on the basis of all fields and average rate of September 2009
Cairo
River NileThe Egyptian Petroleum
Development Co., Ltd. (EPEDECO)*West Bakr Block
Teikoku Oil Suez SOBSouth October Block
West Bakr Block
– Participating Interest: 100%(Operator)
– PSC: 1975‐ 2020+5years option
– Production commencement: 1980
– Production volume**: Approximately 4,000bbl/d
South October Block
– Participating Interest: 35%
(Operator: Dana Petroleum)
– PSC: 2005‐2010
– Interpreting geological data
37
Algeria ProjectsJapan Ohanet Oil & Gas Co., Ltd. */ Teikoku Oil (Algeria) Co., Ltd.
* INPEX’s share 15%
**on the basis of all fields and average rate of September 2009
Teikoku Oil (Algeria)El Ouar I/II Blocks
Japan Ohanet Oil & Gas (JOOG)*Ohanet Block
Algeria
Ohanet Block– JOOG’s interest: 30%
(Operator: BHPB)– Risk Service Contract: 2000‐2011– Production commencement: Oct. 2003– Production volume**
• Dry Gas: Approximately 516 million cf/d• Condensate: Approximately 19,000 bbl/d• LPG: Approximately 19,000 bbl/d
El Ouar I/II Blocks– Participating Interest: 10.29%(Operator: ENI)– Concession Agreement (production phase period:
15years+5years option)– Finalizing a development plan (oil and
gas/condensate) for approval of the Algerian authority
38
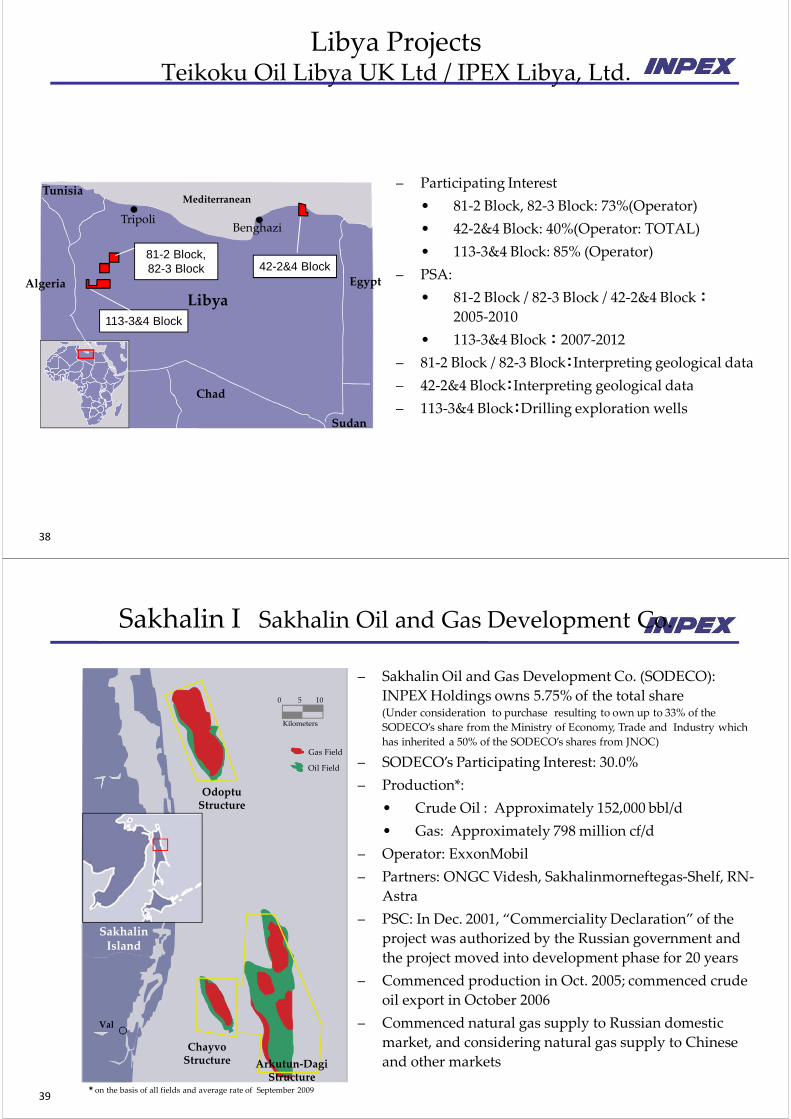
Libya ProjectsTeikoku Oil Libya UK Ltd / IPEX Libya, Ltd.
– Participating Interest
• 81‐2 Block, 82‐3 Block: 73%(Operator)
• 42‐2&4 Block: 40%(Operator: TOTAL)
• 113‐3&4 Block: 85% (Operator)
– PSA:
• 81‐2 Block / 82‐3 Block / 42‐2&4 Block :
2005‐2010
• 113‐3&4 Block : 2007‐2012
– 81‐2 Block / 82‐3 Block:Interpreting geological data
– 42‐2&4 Block:Interpreting geological data
– 113‐3&4 Block:Drilling exploration wells
TripoliBenghazi
LibyaAlgeria
Tunisia
Egypt
Chad
Sudan
Mediterranean
42-2&4 Block81-2 Block, 82-3 Block
113-3&4 Block
39
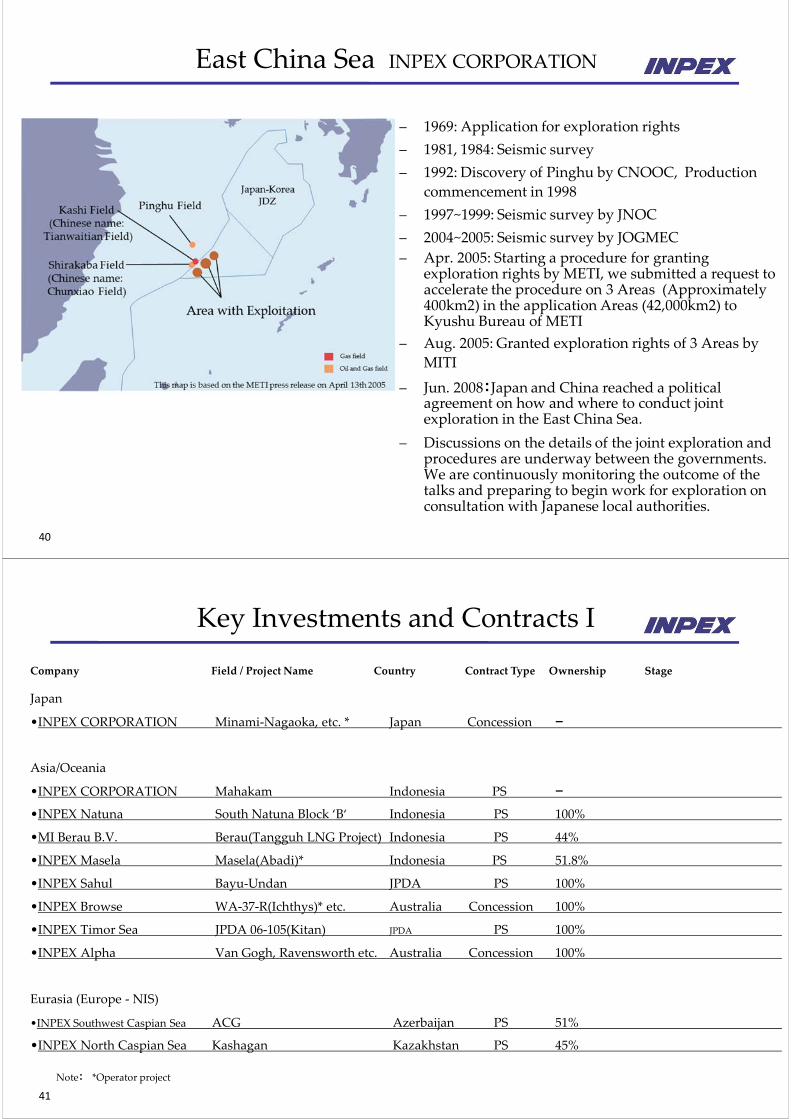
Sakhalin I Sakhalin Oil and Gas Development Co.
Chayvo Structure Arkutun‐Dagi
Structure
Odoptu Structure
Val
0 5 10
Kilometers
Gas Field
Oil Field
Sakhalin Island
– Sakhalin Oil and Gas Development Co. (SODECO):
INPEX Holdings owns 5.75% of the total share(Under consideration to purchase resulting to own up to 33% of the
SODECO’s share from the Ministry of Economy, Trade and Industry which
has inherited a 50% of the SODECO’s shares from JNOC)
– SODECO’s Participating Interest: 30.0%
– Production*:
• Crude Oil : Approximately 152,000 bbl/d
• Gas: Approximately 798 million cf/d
– Operator: ExxonMobil
– Partners: ONGC Videsh, Sakhalinmorneftegas‐Shelf, RN‐
Astra
– PSC: In Dec. 2001, “Commerciality Declaration” of the
project was authorized by the Russian government and
the project moved into development phase for 20 years
– Commenced production in Oct. 2005; commenced crude
oil export in October 2006
– Commenced natural gas supply to Russian domestic
market, and considering natural gas supply to Chinese
and other markets
*on the basis of all fields and average rate of September 2009
40
East China Sea INPEX CORPORATION
– 1969: Application for exploration rights
– 1981, 1984: Seismic survey
– 1992: Discovery of Pinghu by CNOOC, Production
commencement in 1998
– 1997~1999: Seismic survey by JNOC
– 2004~2005: Seismic survey by JOGMEC
– Apr. 2005: Starting a procedure for granting exploration rights by METI, we submitted a request to accelerate the procedure on 3 Areas (Approximately 400km2) in the application Areas (42,000km2) to Kyushu Bureau of METI
– Aug. 2005: Granted exploration rights of 3 Areas by
MITI
– Jun. 2008:Japan and China reached a political agreement on how and where to conduct joint exploration in the East China Sea.
– Discussions on the details of the joint exploration and procedures are underway between the governments. We are continuously monitoring the outcome of the talks and preparing to begin work for exploration on consultation with Japanese local authorities.
41
Japan
•INPEX CORPORATION Minami‐Nagaoka, etc. * Japan Concession ー
Asia/Oceania
•INPEX CORPORATION Mahakam Indonesia PS ー
•INPEX Natuna South Natuna Block ‘B‘ Indonesia PS 100%
•MI Berau B.V. Berau(Tangguh LNG Project) Indonesia PS 44%
•INPEX Masela Masela(Abadi)* Indonesia PS 51.8%
•INPEX Sahul Bayu‐Undan JPDA PS 100%
•INPEX Browse WA‐37‐R(Ichthys)* etc. Australia Concession 100%
•INPEX Timor Sea JPDA 06‐105(Kitan) JPDA PS 100%
•INPEX Alpha Van Gogh, Ravensworth etc. Australia Concession 100%
Eurasia (Europe ‐ NIS)
•INPEX Southwest Caspian Sea ACG Azerbaijan PS 51%
•INPEX North Caspian Sea Kashagan Kazakhstan PS 45%
Key Investments and Contracts I
Company Field / Project Name Country Contract Type Ownership Stage
Note: *Operator project
42
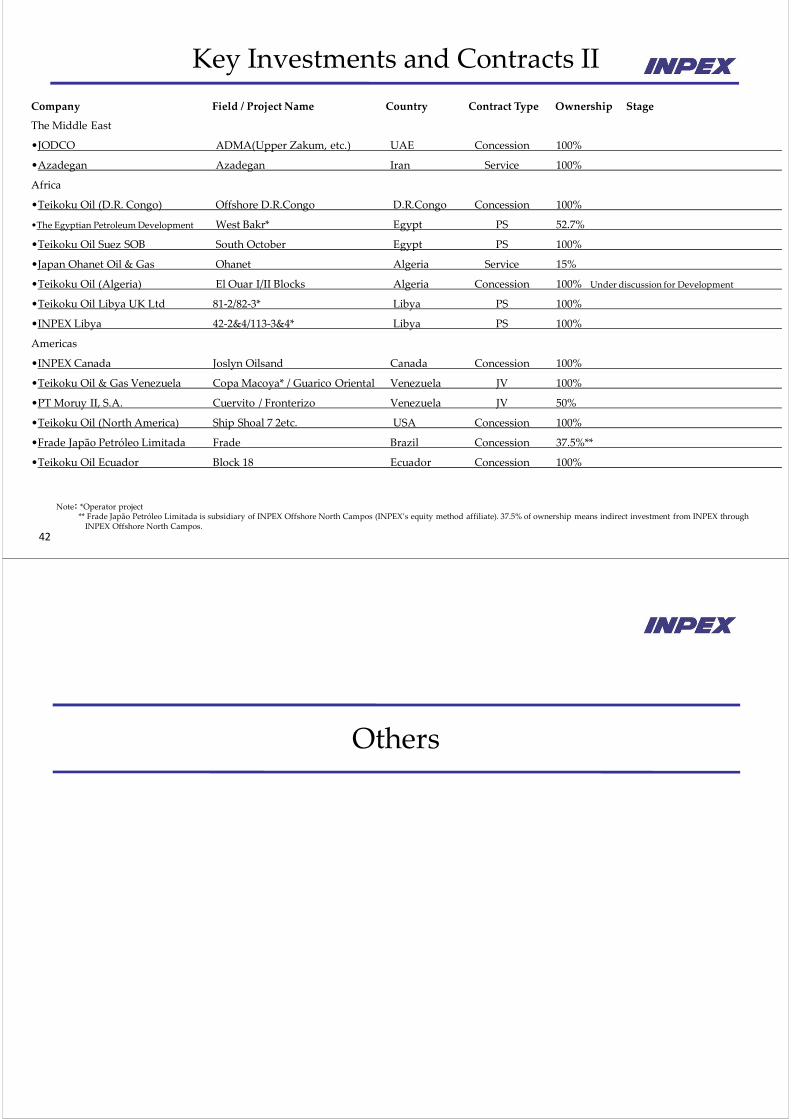
The Middle East
•JODCO ADMA(Upper Zakum, etc.) UAE Concession 100%
•Azadegan Azadegan Iran Service 100%
Africa
•Teikoku Oil (D.R. Congo) Offshore D.R.Congo D.R.Congo Concession 100%
•The Egyptian Petroleum Development West Bakr* Egypt PS 52.7%
•Teikoku Oil Suez SOB South October Egypt PS 100%
•Japan Ohanet Oil & Gas Ohanet Algeria Service 15%
•Teikoku Oil (Algeria) El Ouar I/II Blocks Algeria Concession 100% Under discussion for Development
•Teikoku Oil Libya UK Ltd 81‐2/82‐3* Libya PS 100%
•INPEX Libya 42‐2&4/113‐3&4* Libya PS 100%
Americas
•INPEX Canada Joslyn Oilsand Canada Concession 100%
•Teikoku Oil & Gas Venezuela Copa Macoya* / Guarico Oriental Venezuela JV 100%
•PT Moruy II, S.A. Cuervito / Fronterizo Venezuela JV 50%
•Teikoku Oil (North America) Ship Shoal 7 2etc. USA Concession 100%
•Frade Japão Petróleo Limitada Frade Brazil Concession 37.5%**
•Teikoku Oil Ecuador Block 18 Ecuador Concession 100%
Note: *Operator project** Frade Japão Petróleo Limitada is subsidiary of INPEX Offshore North Campos (INPEX’s equity method affiliate). 37.5% of ownership means indirect investment from INPEX throughINPEX Offshore North Campos.
Key Investments and Contracts II
Company Field / Project Name Country Contract Type Ownership Stage
Others
44
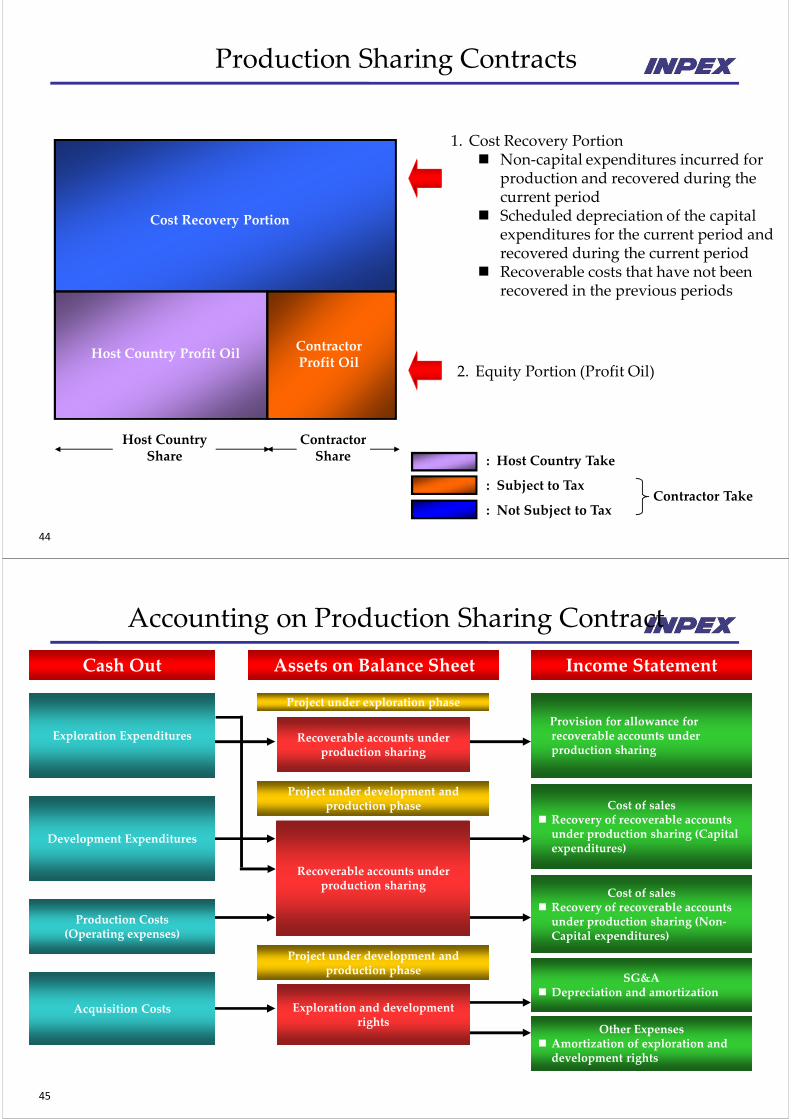
Production Sharing Contracts
: Host Country Take
: Subject to Tax
: Not Subject to Tax
1. Cost Recovery Portion Non‐capital expenditures incurred for
production and recovered during the current period
Scheduled depreciation of the capital expenditures for the current period and recovered during the current period
Recoverable costs that have not been recovered in the previous periods
2. Equity Portion (Profit Oil)
Contractor Take
Host CountryShare
ContractorShare
Cost Recovery Portion
Host Country Profit OilContractor Profit Oil
45
Accounting on Production Sharing Contract
Cash Out Assets on Balance Sheet Income Statement
SG&A Depreciation and amortization
Cost of sales Recovery of recoverable accounts under production sharing (Capital expenditures)
Project under exploration phase
Provision for allowance for recoverable accounts under production sharing
Project under development and production phase
Project under development and production phase
Other Expenses Amortization of exploration and development rights
Recoverable accounts under production sharing
Recoverable accounts under production sharing
Exploration and development rights
Acquisition Costs
Production Costs(Operating expenses)
Development Expenditures
Exploration Expenditures
Cost of sales Recovery of recoverable accounts under production sharing (Non‐Capital expenditures)
46
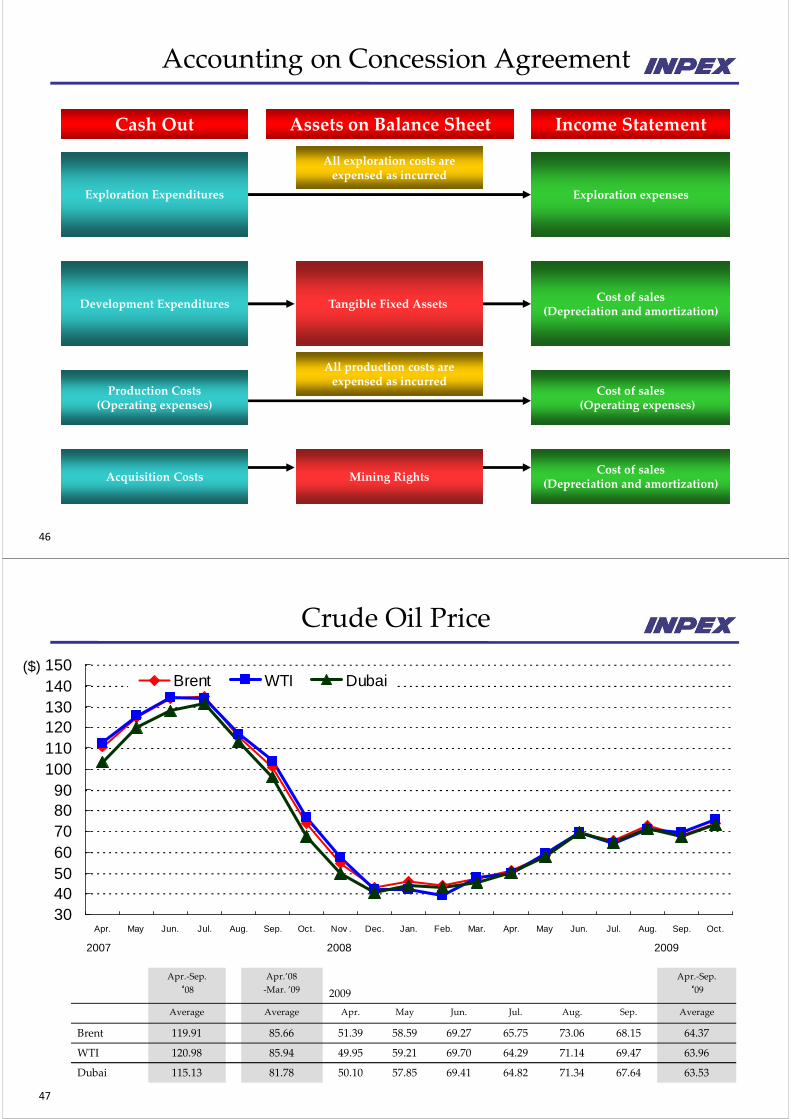
Accounting on Concession Agreement
Cash Out
Production Costs(Operating expenses)
Exploration Expenditures
Tangible Fixed Assets
Income Statement
Exploration expenses
Cost of sales(Depreciation and amortization)
Cost of sales(Operating expenses)
Cost of sales(Depreciation and amortization)
All exploration costs are expensed as incurred
Assets on Balance Sheet
All production costs are expensed as incurred
Acquisition Costs
Development Expenditures
Mining Rights
47
Crude Oil Price
30405060708090
100110120130140150
Apr. May Jun. Jul. Aug. Sep. Oct. Nov . Dec. Jan. Feb. Mar. Apr. May Jun. Jul. Aug. Sep. Oct.
Brent WTI Dubai($)
2007 2008 2009
Apr.‐Sep.
‘08
Apr.’08
‐Mar. ’09 2009
Apr.‐Sep.
‘09
Average Average Apr. May Jun. Jul. Aug. Sep. Average
Brent 119.91 85.66 51.39 58.59 69.27 65.75 73.06 68.15 64.37
WTI 120.98 85.94 49.95 59.21 69.70 64.29 71.14 69.47 63.96
Dubai 115.13 81.78 50.10 57.85 69.41 64.82 71.34 67.64 63.53