Embed Size (px)
Citation preview

November 5, 2009Faculty Senate
GENERAL FUND BUILDINGSCLASSROOM CONDITION ANALYSIS
Peter Strazdas, Associate VP, Facilities Management

AGENDA
Classroom’s First and Student’s First Initiative Update
Classroom Condition Analysis

CLASSROOMS FIRST AND STUDENT’S FIRST INITIATIVE UPDATE

STUDENTS FIRST INITIATIVE - HOUSING
NUMBER OF SERVICE REQUESTS RESPONDED TO SINCE
SEPTEMBER 2007: 912

CLASSROOM FIRST INITIATIVE
NUMBER OF SERVICE REQUESTS RESPONDED TO SINCE
SEPTEMBER 2008: 191
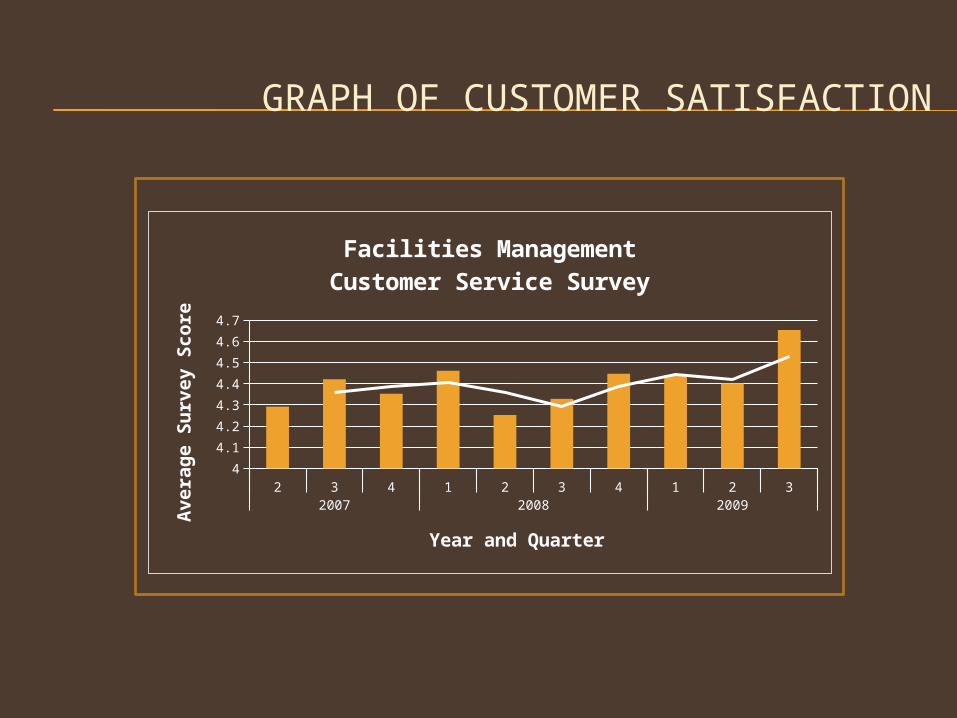
GRAPH OF CUSTOMER SATISFACTION
2 3 4 1 2 3 4 1 2 32007 2008 2009
4
4.1
4.2
4.3
4.4
4.5
4.6
4.7
Facilities ManagementCustomer Service Survey
Year and Quarter
Ave
rag
e S
urv
ey S
co
re

CLASSROOM CONDITION ANALYSIS

CLASSROOM CONDITION ANALYSIS METHODOLOGY
Classrooms were assessed by rating: Seating Ceilings Window Tx Walls & Doors
Ratings included the evaluation of: Safety Functionality of Space Visual Aesthetic
Ratings are interpreted on the following scale: 1 – Unacceptable: Immediate Repair and Replacement Needed 2 – Poor: Repair or Replacement in Near Future 3 – Below Average: Minor Repair and Attention Needed 4 – Average to Above Average: Moderate to Good Condition 5 – New: Excellent Condition
Poor quality, in need of immediate repair or replacement Red = 1.0-2.5Below average quality, will need either repair or replacement in the near future Blue = 2.6-3.5
Good quality, no repair or replacement needed at this time Yellow = 3.6-4.5
New or pristine quality Green = 4.6-5.0
Attributes not in room or room not accessible to team N/A
Flooring Windows Lighting White/Chalk Boards

CONDITION ANALYSIS THROUGH THE EYES OF STUDENTS
2007 Team 2008 Team
2009 Team
Jill Mitchell & Courtney Seiler
Ryan Tallon, Kris Kenz, Cindy Han, Shedrick Harrell, Jenifer Sulewski Chris Caprara & Eric Buckleitner

CONDITION ANALYSIS SUMMARY RESULTS
2007 2008 20093.8
3.9
4.0
4.1
4.2
4.3
4.4
4.0
4.1
4.3
Overall Campus Trend Av-erage
Year
Rati
ng
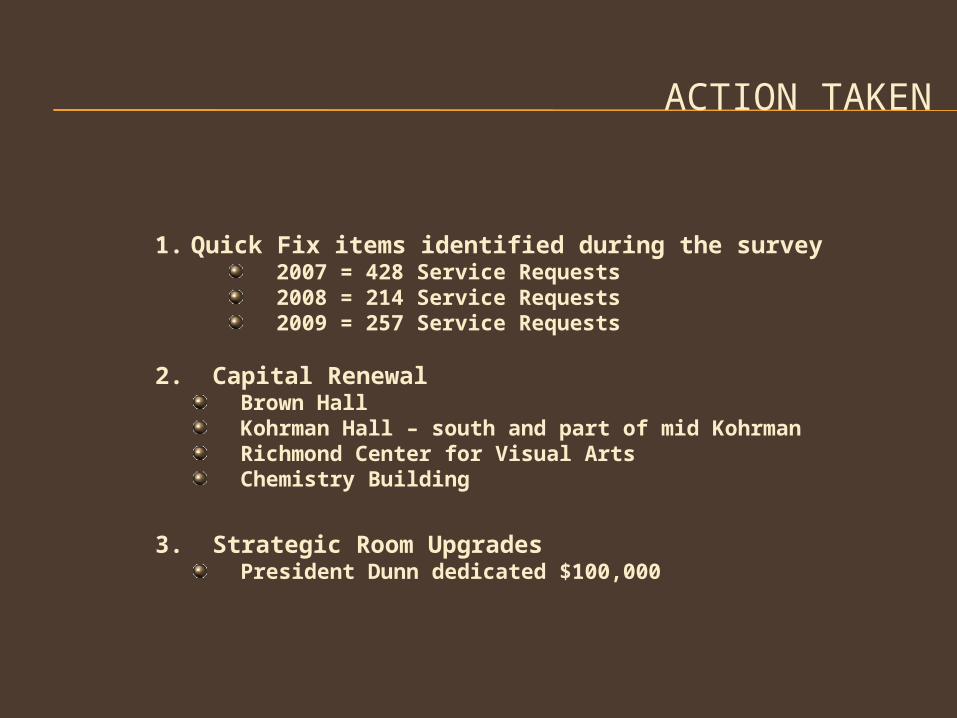
ACTION TAKEN
1. Quick Fix items identified during the survey 2007 = 428 Service Requests 2008 = 214 Service Requests 2009 = 257 Service Requests
2. Capital Renewal Brown Hall Kohrman Hall – south and part of mid Kohrman Richmond Center for Visual Arts Chemistry Building
3. Strategic Room Upgrades President Dunn dedicated $100,000
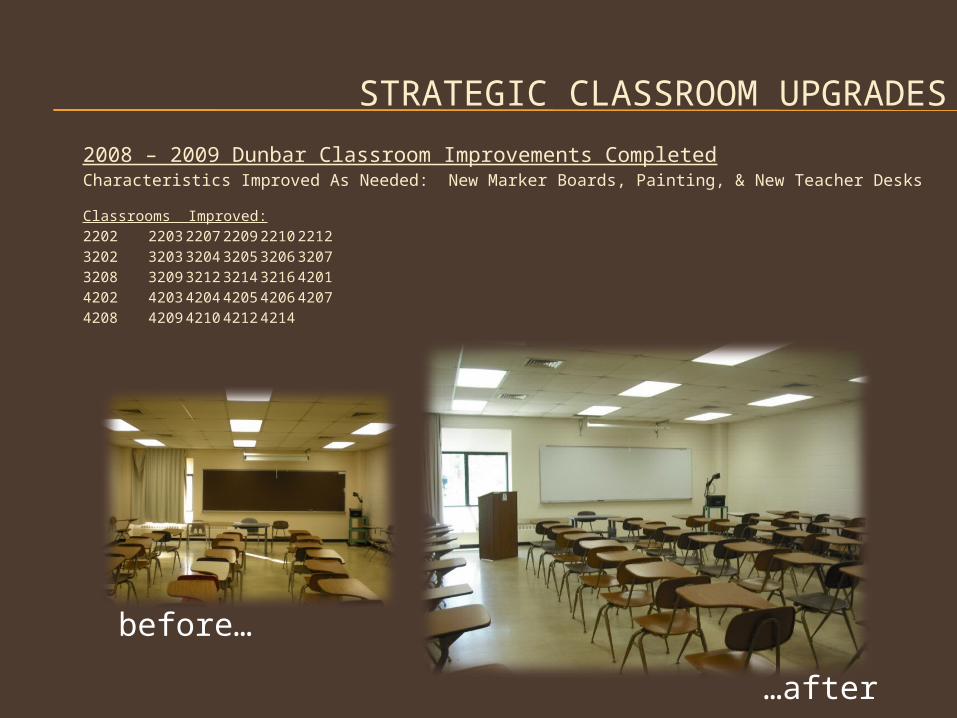
STRATEGIC CLASSROOM UPGRADES
2008 – 2009 Dunbar Classroom Improvements CompletedCharacteristics Improved As Needed: New Marker Boards, Painting, & New Teacher Desks
Classrooms Improved:2202 2203 2207 2209 2210 22123202 3203 3204 3205 3206 32073208 3209 3212 3214 3216 42014202 4203 4204 4205 4206 42074208 4209 4210 4212 4214
before…
…after
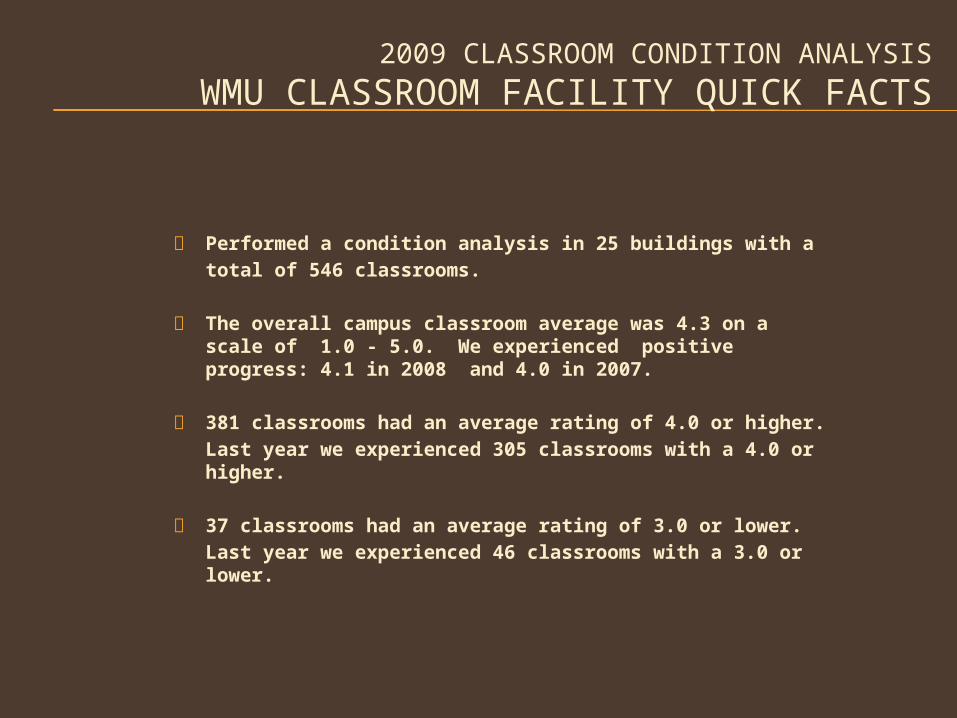
2009 CLASSROOM CONDITION ANALYSIS
WMU CLASSROOM FACILITY QUICK FACTS
Performed a condition analysis in 25 buildings with a total of 546 classrooms.
The overall campus classroom average was 4.3 on a scale of 1.0 - 5.0. We experienced positive progress: 4.1 in 2008 and 4.0 in 2007.
381 classrooms had an average rating of 4.0 or higher.
Last year we experienced 305 classrooms with a 4.0 or higher.
37 classrooms had an average rating of 3.0 or lower.
Last year we experienced 46 classrooms with a 3.0 or lower.

OVERVIEW OF 2009
3RD ANNUAL CONDITION ANALYSIS
Ceiling Averages
Poor quality, in need of immediate repair or replacement Red = 1.0-2.5
Below average quality, will need either repair or replacement in the near future Blue = 2.6-3.5
Good quality, no repair or replacement needed at this time Yellow = 3.6-4.5
New or pristine quality Green = 4.6-5.0
Attributes not in room or room not accessible to team N/A
4%
17%
38%
38%
Flooring Averages4%
21%
25%
46%
Ceiling Averages4%
13%
25%54%
Seating Averages4%
13%
29%46%
8%
Window Averages

Poor quality, in need of immediate repair or replacement Red = 1.0-2.5
Below average quality, will need either repair or replacement in the near future Blue = 2.6-3.5
Good quality, no repair or replacement needed at this time Yellow = 3.6-4.5
New or pristine quality Green = 4.6-5.0
Attributes not in room or room not accessible to team N/A
29%
21%
50%
Lighting Averages
17%
46%
33%
Wall Averages
25%
25%
50%
Door Averages
29%
4%54%
13%
Window Tx Averages
3RD ANNUAL CONDITION ANALYSIS

Poor quality, in need of immediate repair or replacement Red = 1.0-2.5
Below average quality, will need either repair or replacement in the near future Blue = 2.6-3.5
Good quality, no repair or replacement needed at this time Yellow = 3.6-4.5
New or pristine quality Green = 4.6-5.0
Attributes not in room or room not accessible to team N/A
2%
19%
28%49%
2%
Overall Space Averages
8%
29%
63%
Board Averages
3RD ANNUAL CONDITION ANALYSIS

OVERALL SUMMARY OF CLASSROOMS 2009Building # Clasrms # Classes % Classes Utlz. Ratio Flr Stg Clg Wdws Wdw Tx Ltg Wls Drs Bds Avg
McCracken 0 0 0 0 2.0 2.3 2.5 2.9 2.8 2.8 2.8 3.0 3.0 2.7
Sangren 48 373 10.84 .13 3.0 3.0 3.1 4.0 3.1 2.8 3.6 3.0 4.0 3.3
AT Building 5 9 .26 .56 3.7 4.2 3.0 3.8 3.7 3.8 3.6 4.0 4.5 3.8
Moore 9 93 2.70 .1 2.8 3.0 3.0 4.0 3.0 3.5 4.0 3.3 4.2 3.4
Dunbar 38 367 10.67 .1 3.9 3.2 3.4 4.4 3.8 4.0 3.7 3.4 4.2 3.8
N. Korhman 25 199 5.78 .13 3.0 3.2 3.5 4.1 3.2 3.2 3.9 3.3 4.4 3.5
Gilmore/Shaw 8 24 .70 .33 3.8 3.8 3.8 3.0 3.5 4.2 3.7 3.8 3.8 3.7
Friedmann 2 1 .03 2 4.3 4.0 3.8 N/A N/A 4.0 4.3 4.0 4.0 4.1
Sindecuse n/a n/a n/a n/a 3.8 4.2 4.5 4.0 3.7 4.2 4.0 4.0 4.5 4.1
Dalton 20 151 4.39 .13 3.7 3.8 3.8 3.9 2.0 4.3 4.2 4.2 4.3 3.8
Rood 40 236 6.86 .17 3.5 3.3 4.0 3.8 3.8 4.1 3.7 3.6 3.8 3.7
Everett 4 1 .03 4 4.1 3.8 4.6 4.0 3.8 4.0 3.6 4.0 4.0 3.9.90
Poor - Red Below Avg - Blue Good - Yellow Pristine - Green N/A - Black

OVERALL SUMMARY OF CLASSROOMS 2009Building # Clasrms # Classes % Classes Utlz. Ratio Flr Stg Clg Wdws Wdw Tx Ltg Wls Drs Bds Avg
Ellsworth 1 n/a n/a n/a 5.0 5.0 3.5 4.0 4.0 3.5 5.0 4.0 5.0 4.4
Schneider 41 415 12.06 .09 4.3 3.8 4.4 4.7 N/A 4.8 4.1 4.1 4.7 4.4
Knauss 4 40 1.16 .1 3.5 3.3 4.0 N/A N/A 4.0 4.0 3.9 4.3 3.9
SRC 11 171 4.97 .06 4.0 4.0 4.3 N/A N/A 4.1 4.1 4.1 4.4 4.1
Haenicke 3 7 .20 .43 4.0 3.8 4.5 4.0 4.0 4.5 3.8 3.8 3.0 3.9
Wood 39 250 7.27 .16 4.0 3.8 4.9 4.9 4.4 5.0 4.3 4.2 4.4 4.4
COE 80 400 11.62 .2 4.4 4.3 4.7 4.6 4.6 4.7 4.3 5.0 4.7 4.6
Lee Honors 2 11 .32 .18 5.0 4.5 4.0 4.0 4.0 4.0 3.8 4.0 4.0 4.1
Health & Human 53 208 6.04 .25 5.0 4.9 4.9 5.0 5.0 5.0 4.7 5.0 4.9 4.9
Chemistry 18 93 2.70 .19 4.9 5.0 4.9 5.0 5.0 5.0 5.0 5.0 5.0 5.0
Richmond Ctr 4 23 .67 .17 5.0 5.0 5.0 5.0 N/A 5.0 5.0 5.0 5.0 5.0
South Kohrman 16 n/a n/a n/a 4.8 4.4 5.0 4.9 5.0 5.0 4.9 4.9 4.6 4.8
Brown Hall 40 312 9.07 .13 5.0 5.0 5.0 5.0 5.0 5.0 5.0 5.0 5.0 5.0
Average 21 161 4.68 .45 4.0 3.9 4.1 4.2 3.9 4.2 4.1 4.1 4.3 4.1
Poor - Red Below Avg - Blue Good - Yellow Pristine - Green N/A - Black

ROOD AND DUNBAR
Dunbar Hall 3.2 3.9 3.4 4.4 3.8 4.0 3.7 3.4 4.2 3.8
Building Seating Flooring Ceiling WindowsWindow
Tx Lighting Walls Doors Boards Overall Avg
Rood Hall 3.3 3.5 4.0 3.8 3.8 4.1 3.7 3.6 3.8 3.7

Building Seating Flooring Ceiling Windows Window Tx Lighting Walls Doors Boards Overall Avg
GILMORE / SHAW THEATRE
Gilmore/Shaw Theatre 3.8 3.8 3.8 3.0 3.5 4.2 3.7 3.8 3.8 3.7

N. Korhman 3.2 3.0 3.5 4.1 3.2 3.2 3.9 3.3 4.4 3.5
Building Seating Flooring Ceiling WindowsWindow
Tx Lighting Walls Doors Boards Overall Avg
NORTH KOHRMAN

Dalton Center 3.8 3.7 3.8 3.9 2.0 4.3 4.2 4.2 4.3 3.8
Building Seating Flooring Ceiling Windows Window Tx Lighting Walls Doors Boards Overall Avg
Moore Hall 3.0 2.8 3.0 4.0 3.0 3.5 4.0 3.3 4.2 3.4
DALTON AND MOORE

THANK YOU!
Facilities Management Department


![UAB Faculty Senate Secretary Job Description · Associate Chair of the UAB Faculty Senate [Associate Chair of the Faculty; Associate Chair of the Senate] Job Description . 1. Serves](https://img.pdfslide.us/doc/110x75/5ce7d2ae88c993082d8d74aa/uab-faculty-senate-secretary-job-description-associate-chair-of-the-uab-faculty.jpg)