Embed Size (px)
Citation preview
RESTRICTED
European Commission Services European Central Bank Single Resolution Board
1
MONITORING REPORT ON RISK REDUCTION INDICATORS1
–
NOVEMBER 2018
Executive Summary
This is the third edition of the monitoring report on risk reduction indicators,2 produced at the
request of the President of the Eurogroup (PEG). As per his letter to the President of the Euro
Summit of 25 June 2018, this is a regular monitoring exercise. The aim of risk reduction
monitoring reports is to provide an updated assessment of how risks are evolving within the
banking union (BU) so as to inform political decisions on the entry into force of the next steps
in risk sharing. The report has been prepared jointly by the European Commission, the
European Central Bank and the Single Resolution Board (SRB).
An overview of all quantitative indicators confirms that, on aggregate, and based on the
available data, banks’ capital and liquidity positions have continued to improve. At the same
time, banks' leverage has decreased while loss-absorbing capacity has increased. Non-
performing loans (NPLs) on banks' balance sheets have continued to decline. In addition,
progress has continued to be made with the legislative processes for several risk reduction
measures at EU and national level (see Annex I and Annex II respectively).
There have been a number of methodological changes compared to the previous iteration of
the report which may result in slightly different values compared to the previous edition; key
messages observed in previous reports remain unchanged. For further details of those
methodological changes, please refer to the Annexes of the report.
1 Report prepared for the 15 November 2018 Eurogroup Working Group meeting. 2 November 2017: https://www.consilium.europa.eu/media/31936/note-presenting-a-stock-take-of-financial-reforms.pdf and Annexes.
RESTRICTED
European Commission Services European Central Bank Single Resolution Board
2
Overview of main developments:
Capital
position
Leverage
ratio
Liquidity and
Net Stable
Funding
position
The average Common Equity Tier 1 (CET1) Capital ratio has improved by 2.8 percentage points (pp) to 13.8% since the
establishment of the BU
►Most Member States (MS) now exhibit higher CET1 Capital ratios than four years ago
►Following consecutive improvements in the average CET1 Capital ratio until Q4 2017, Q2 2018 figures saw a 0.5 pp
decrease in the CET1 Capital ratio which is mainly attributed to a reduction in CET 1 Capital*, also linked to the
IAS39/IFRS9 migration**
Banks have, on average, reduced their leverage by 1.1 pp as the average Leverage ratio improved from 4.0% in Q4
2014 to 5.1% in Q2 2018
The liquidity and net funding position of banks, as measured by the Liquidity Coverage Ratio (LCR) and the Net
Stable Funding Ratio (NSFR), continues to be strong. The average LCR and NSFR have consistently been above
the 100% minimum fully loaded requirements since the inception of the SSM
►Improvements in the NSFR from 101.9% in Q4 2014 to 113.2% in Q2 2018 further indicate that the funding profile of
banks has, on average, become more robust over the last few years
NPLs
The average NPL ratio has decreased by 3.5 pp since Q4 2014, reaching 4.4% in Q2 2018
►NPL ratios have decreased for almost all MS, with larger decreases for MS with high NPL ratios
MREL
Overall, banks have made progress in building up their Minimum Requirement for Eligible Liabilities (MREL)
capacity in order to reach the steady-state requirement as set by the SRB. The total MREL still needed to reach the
level of the requirement is approximately 7.9% of the total requirement.
* In particular the ‘accumulated other comprehensive income’ and ‘retained earnings’ categories
** A number of firms chose to take the full deduction rather than making use of the transitional arrangements
3
Assessment of Risk Reduction indicators
This section assesses (a) the evolution of selected indicators at MS level and (b) how the level
of risk in the BU has been affected.
1. Capital position
Quantitative indicators
• Fully Loaded Common Equity Tier 1 (CET1) Capital Ratio: Ratio of fully loaded
CET1 capital / total risk weighted assets (RWAs) (Indicator 1: Charts 1.1 and 1.2)3
• Fully Loaded Tier 1 (Tier 1) Capital Ratio: Fully loaded Tier 1 capital / total RWAs
(Indicator 2: Charts 2.1 and 2.2)4
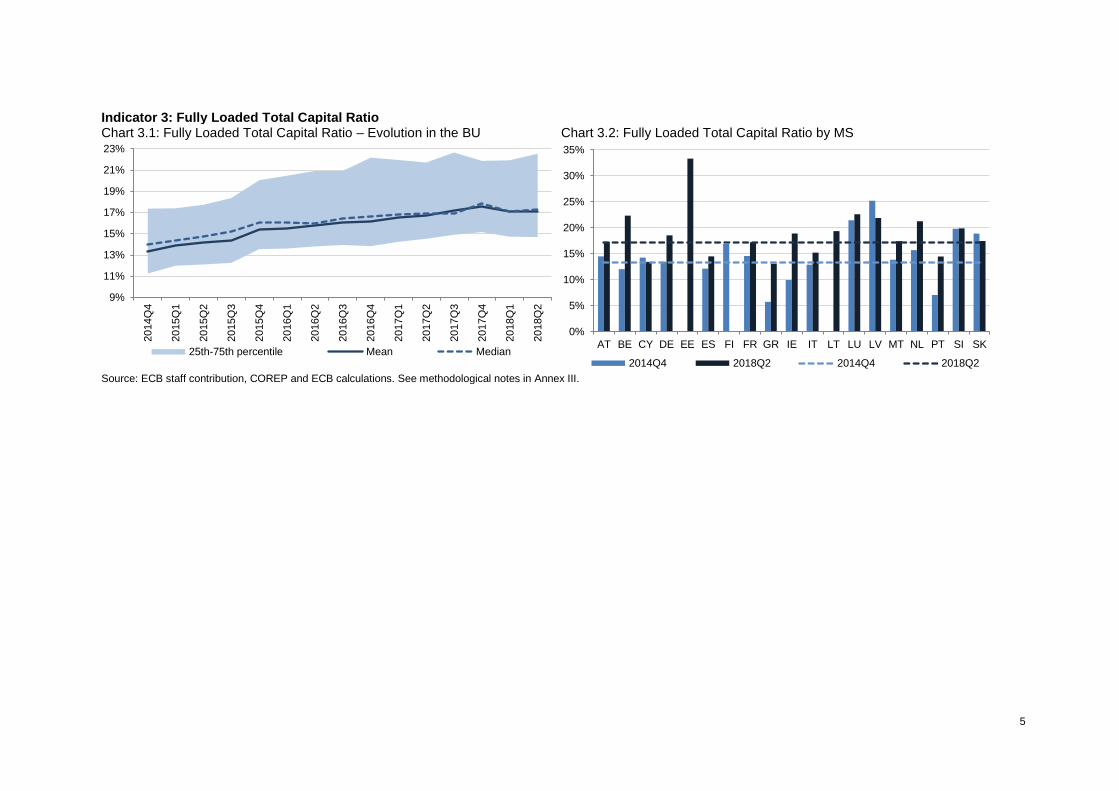
• Fully Loaded Total Capital Ratio: Fully loaded total capital / total RWAs ratio
(Indicator 3: Charts 3.1 and 3.2)5
Commentary
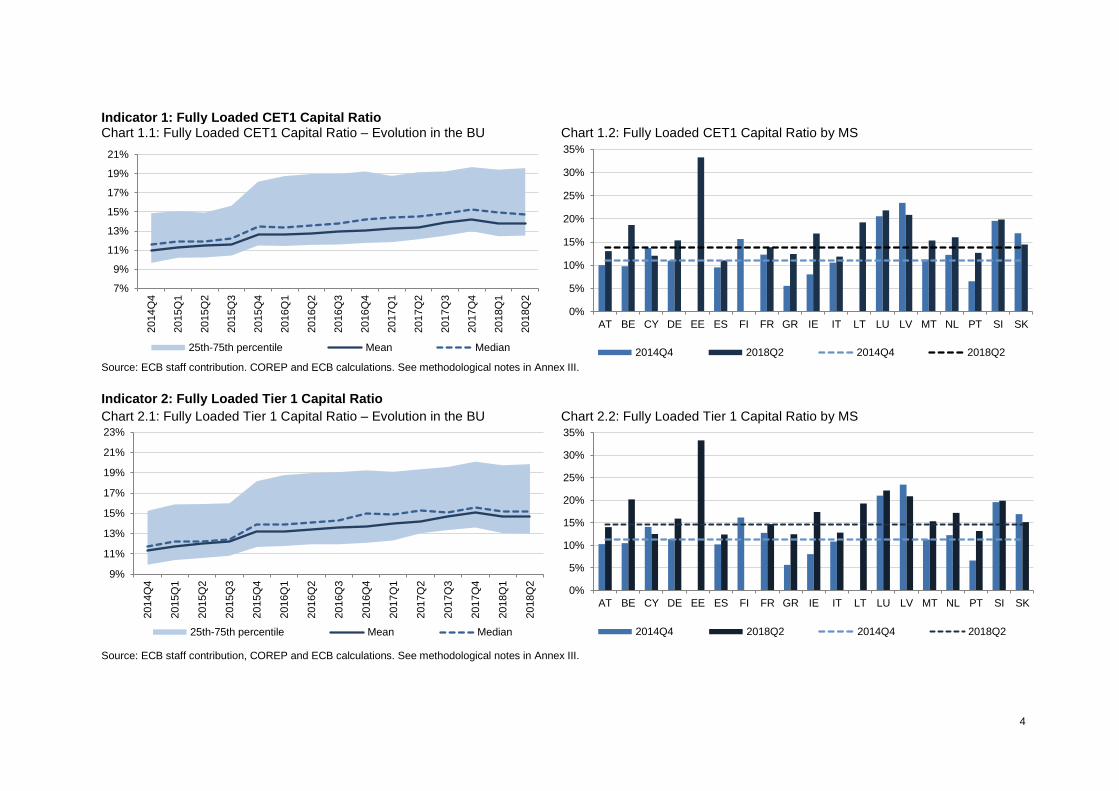
• CET1 Capital Ratio. Since the end of 2014, the BU weighted average CET1 ratio has
improved by 2.8 pp to 13.8% in Q2 2018. Compared with Q4 2017, Q2 2018 marked a
0.5 pp decrease in the CET1 ratio. This change is mainly due to a reduction in CET1
capital, which in turn is driven by “accumulated other comprehensive income” and
“retained earnings” (and also linked to the IAS39/IFRS9 migration as a number of firms
chose to take the full deduction rather than making use of the transitional
arrangements).6
• CET1, Tier 1 and Total Capital Ratios. Except for the recent drops in Q1 and Q2
2018, there has been a long-term improvement for all three capital measures across
banks. (Charts 1.1, 2.1, and 3.1).
• MS-specific developments. There have been notable improvements for MS with low
capital ratios in 2014, including GR, IE, PT and BE.
3 The CET1 Capital Ratio indicates the extent to which an institution can absorb losses on a going concern basis using CET1 capital resources. 4 The Tier 1 Capital Ratio indicates the extent to which an institution can absorb losses on a going concern basis using Tier 1 capital resources (i.e. CET.1 and additional Tier 1 capital resources). 5 The Total Capital Ratio indicates the extent to which an institution can absorb losses on a going concern basis using Total Capital resources (i.e. CET.1 and additional Tier 1 capital resources as well as Tier 2 capital). 6 On 1 January 2018, IFRS 9 became effective for EU firms. Regulation (EU) 2017/2395 foresees a five year transitional arrangement, allowing institutions to phase in the immediate (‘Day 1’) capital impact. Institutions should decide whether to apply those transitional arrangements and inform the competent authority accordingly.
4
Indicator 1: Fully Loaded CET1 Capital Ratio Chart 1.1: Fully Loaded CET1 Capital Ratio – Evolution in the BU Chart 1.2: Fully Loaded CET1 Capital Ratio by MS
Source: ECB staff contribution. COREP and ECB calculations. See methodological notes in Annex III.
Indicator 2: Fully Loaded Tier 1 Capital Ratio
Chart 2.1: Fully Loaded Tier 1 Capital Ratio – Evolution in the BU Chart 2.2: Fully Loaded Tier 1 Capital Ratio by MS
Source: ECB staff contribution, COREP and ECB calculations. See methodological notes in Annex III.
7%
9%
11%
13%
15%
17%
19%
21%2014Q
4
2015Q
1
2015Q
2
2015Q
3
2015Q
4
2016Q
1
2016Q
2
2016Q
3
2016Q
4
2017Q
1
2017Q
2
2017Q
3
2017Q
4
2018Q
1
2018Q
2
25th-75th percentile Mean Median
0%
5%
10%
15%
20%
25%
30%
35%
AT BE CY DE EE ES FI FR GR IE IT LT LU LV MT NL PT SI SK
2014Q4 2018Q2 2014Q4 2018Q2
9%
11%
13%
15%
17%
19%
21%
23%
2014Q
4
2015Q
1
2015Q
2
2015Q
3
2015Q
4
2016Q
1
2016Q
2
2016Q
3
2016Q
4
2017Q
1
2017Q
2
2017Q
3
2017Q
4
2018Q
1
2018Q
2
25th-75th percentile Mean Median
0%
5%
10%
15%
20%
25%
30%
35%
AT BE CY DE EE ES FI FR GR IE IT LT LU LV MT NL PT SI SK
2014Q4 2018Q2 2014Q4 2018Q2
5
Indicator 3: Fully Loaded Total Capital Ratio Chart 3.1: Fully Loaded Total Capital Ratio – Evolution in the BU Chart 3.2: Fully Loaded Total Capital Ratio by MS
Source: ECB staff contribution, COREP and ECB calculations. See methodological notes in Annex III.
9%
11%
13%
15%
17%
19%
21%
23%2014Q
4
2015Q
1
2015Q
2
2015Q
3
2015Q
4
2016Q
1
2016Q
2
2016Q
3
2016Q
4
2017Q
1
2017Q
2
2017Q
3
2017Q
4
2018Q
1
2018Q
2
25th-75th percentile Mean Median
0%
5%
10%
15%
20%
25%
30%
35%
AT BE CY DE EE ES FI FR GR IE IT LT LU LV MT NL PT SI SK
2014Q4 2018Q2 2014Q4 2018Q2
6
2. Leverage
Structural measure
• When adopted, the risk reduction package7 will introduce a binding leverage ratio to
prevent institutions from accumulating excessive leverage as well as a leverage ratio
buffer requirement for institutions qualifying as global systemically important institutions
(G-SIIs). The leverage ratio is intended to reinforce the risk-based capital requirements
with a simple, non-risk-based ‘backstop’.
Quantitative indicator
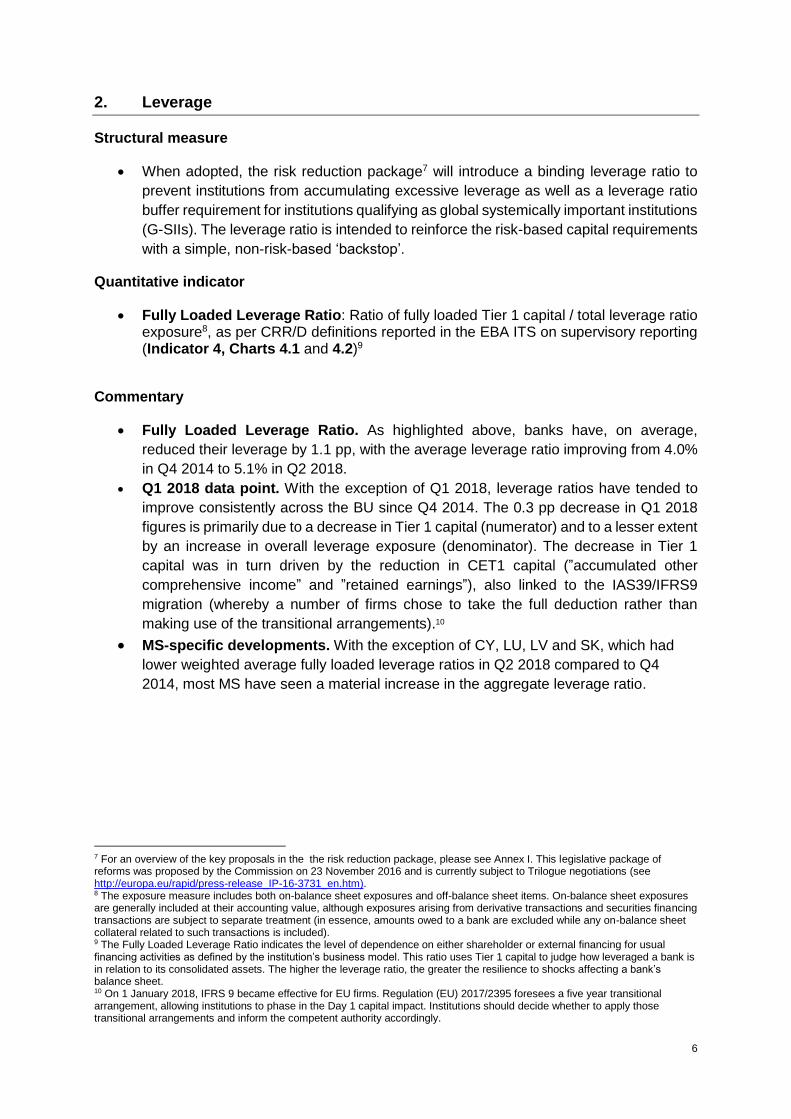
• Fully Loaded Leverage Ratio: Ratio of fully loaded Tier 1 capital / total leverage ratio exposure8, as per CRR/D definitions reported in the EBA ITS on supervisory reporting (Indicator 4, Charts 4.1 and 4.2)9
Commentary
• Fully Loaded Leverage Ratio. As highlighted above, banks have, on average,
reduced their leverage by 1.1 pp, with the average leverage ratio improving from 4.0%
in Q4 2014 to 5.1% in Q2 2018.
• Q1 2018 data point. With the exception of Q1 2018, leverage ratios have tended to
improve consistently across the BU since Q4 2014. The 0.3 pp decrease in Q1 2018
figures is primarily due to a decrease in Tier 1 capital (numerator) and to a lesser extent
by an increase in overall leverage exposure (denominator). The decrease in Tier 1
capital was in turn driven by the reduction in CET1 capital (”accumulated other
comprehensive income” and ”retained earnings”), also linked to the IAS39/IFRS9
migration (whereby a number of firms chose to take the full deduction rather than
making use of the transitional arrangements).10
• MS-specific developments. With the exception of CY, LU, LV and SK, which had
lower weighted average fully loaded leverage ratios in Q2 2018 compared to Q4
2014, most MS have seen a material increase in the aggregate leverage ratio.
7 For an overview of the key proposals in the the risk reduction package, please see Annex I. This legislative package of reforms was proposed by the Commission on 23 November 2016 and is currently subject to Trilogue negotiations (see http://europa.eu/rapid/press-release_IP-16-3731_en.htm). 8 The exposure measure includes both on-balance sheet exposures and off-balance sheet items. On-balance sheet exposures are generally included at their accounting value, although exposures arising from derivative transactions and securities financing transactions are subject to separate treatment (in essence, amounts owed to a bank are excluded while any on-balance sheet collateral related to such transactions is included). 9 The Fully Loaded Leverage Ratio indicates the level of dependence on either shareholder or external financing for usual financing activities as defined by the institution’s business model. This ratio uses Tier 1 capital to judge how leveraged a bank is in relation to its consolidated assets. The higher the leverage ratio, the greater the resilience to shocks affecting a bank’s balance sheet. 10 On 1 January 2018, IFRS 9 became effective for EU firms. Regulation (EU) 2017/2395 foresees a five year transitional arrangement, allowing institutions to phase in the Day 1 capital impact. Institutions should decide whether to apply those transitional arrangements and inform the competent authority accordingly.
7
Indicator 4: Leverage Ratio Chart 4.1: Fully Loaded Leverage Ratio – Evolution in the BU Chart 4.2: Fully Loaded Leverage Ratio by MS
Source: ECB staff contribution, COREP, ECB calculations. See methodological notes in Annex.
2%
3%
4%
5%
6%
7%
8%
9%2014Q
4
2015Q
1
2015Q
2
2015Q
3
2015Q
4
2016Q
1
2016Q
2
2016Q
3
2016Q
4
2017Q
1
2017Q
2
2017Q
3
2017Q
4
2018Q
1
2018Q
2
25th-75th percentile Mean Median
0%
2%
4%
6%
8%
10%
12%
14%
16%
18%
AT BE CY DE EE ES FI FR GR IE IT LT LU LV MT NL PT SI SK
2014Q4 2018Q2 2014Q4 2018Q2
8
3. Liquidity and funding position
Structural measure
• When adopted, the risk reduction package11 will introduce a binding net stable funding
ratio (NSFR) to address previous excessive reliance on short-term wholesale funding
and to reduce long-term funding risk.
Quantitative indicators
• Fully Loaded Liquidity Coverage Ratio (LCR): Ratio of liquidity buffer / net liquidity
outflow (Indicator 5: Charts 5.1 and 5.2)12
• Fully Loaded NSFR: Ratio of available stable funding (ASF) / required stable funding
(RSF) (as reported in SSM Short Term Exercise and Basel III monitoring exercise
templates), (Indicator 6: Charts 6.1 and 6.2)13
Commentary
• Fully Loaded LCR. On a BU aggregate level, the mean and median weighted average
LCR figures have been above the minimum fully phased-in requirement of 100% since
the start of the reporting period in Q4 2014.
• Fully Loaded NSFR. On a BU aggregate level, the mean and median weighted
average NSFR figures have been above the minimum fully phased-in requirement of
100% since the first reporting point in Q4 2014 and the weighted average has improved
further by 11.3 pp to 113.2% since then.
• MS-specific NSFR developments. Almost all MS met the fully phased-in minimum
requirement of 100% in Q2 2018.
11 For an overview of the key proposals in the risk reduction package, please see Annex I. This legislative package of reforms was proposed by the Commission on 23 November 2016 and is currently subject to Trilogue negotiations (see http://europa.eu/rapid/press-release_IP-16-3731_en.htm). 12 The fully loaded LCR indicates whether an institution has an adequate stock of unencumbered high-quality liquid assets (HQLA) that can be converted into cash with little or no loss of value in private markets, to meet its liquidity needs for a 30 calendar-day liquidity stress scenario. 13 The NSFR indicates the ASF (calculated using liabilities) as a percentage of the RSF (calculated using assets).

9
Indicator 5: Fully Loaded Liquidity Coverage Ratio (LCR)
Chart 5.1: Fully Loaded LCR – evolution in the BU Chart 5.2: Fully Loaded LCR by MS
Source: ECB staff contribution. COREP, STE and ECB calculations. The figures for Greek banks should be interpreted carefully as external factors are hindering the use of the LCR as a measure of progress on risk reduction for these banks. See methodological notes in Annex III.
Indicator 6: Fully Loaded NSFR
Chart 6.1: NSFR – Evolution in the BU Chart 6.2: NSFR by MS
Source: STE, ECB calculations. The values for Austria, Belgium, Germany, Ireland, Italy, Malta and the Netherlands in 2014 Q4 might be affected by missing data for a small number of banks. See methodological notes in Annex III
80%
100%
120%
140%
160%
180%
200%
220%
240%
2014Q
4
2015Q
1
2015Q
2
2015Q
3
2015Q
4
2016Q
1
2016Q
2
2016Q
3
2016Q
4
2017Q
1
2017Q
2
2017Q
3
2017Q
4
2018Q
1
2018Q
2
25th-75th percentile Mean Median
0%
100%
200%
300%
400%
500%
600%
AT BE CY DE EE ES FI FR GR IE IT LT LU LV MT NL PT SI SK
2014Q4 2018Q2 2014Q4 2018Q2
80%
90%
100%
110%
120%
130%
140%
2014Q
4
2015Q
1
2015Q
2
2015Q
3
2015Q
4
2016Q
1
2016Q
2
2016Q
3
2016Q
4
2017Q
1
2017Q
2
2017Q
3
2017Q
4
2018Q
1
2018Q
2
25th-75th percentile Mean Median
0%
20%
40%
60%
80%
100%
120%
140%
160%
AT BE CY DE EE ES FI FR GR IE IT LT LU LV MT NL PT SI SK
2014Q4 2018Q2 2014Q4 2018Q2
10
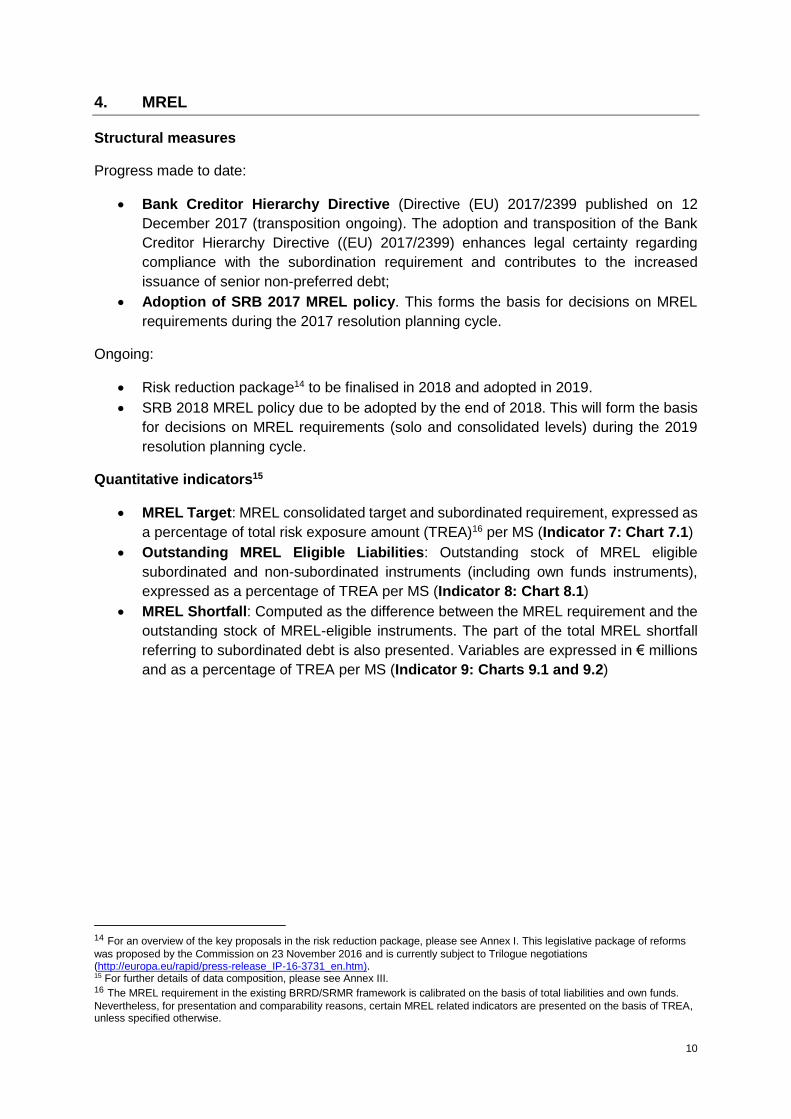
4. MREL
Structural measures
Progress made to date:
• Bank Creditor Hierarchy Directive (Directive (EU) 2017/2399 published on 12
December 2017 (transposition ongoing). The adoption and transposition of the Bank
Creditor Hierarchy Directive ((EU) 2017/2399) enhances legal certainty regarding
compliance with the subordination requirement and contributes to the increased
issuance of senior non-preferred debt;
• Adoption of SRB 2017 MREL policy. This forms the basis for decisions on MREL
requirements during the 2017 resolution planning cycle.
Ongoing:
• Risk reduction package14 to be finalised in 2018 and adopted in 2019.
• SRB 2018 MREL policy due to be adopted by the end of 2018. This will form the basis
for decisions on MREL requirements (solo and consolidated levels) during the 2019
resolution planning cycle.
Quantitative indicators15
• MREL Target: MREL consolidated target and subordinated requirement, expressed as
a percentage of total risk exposure amount (TREA)16 per MS (Indicator 7: Chart 7.1)
• Outstanding MREL Eligible Liabilities: Outstanding stock of MREL eligible
subordinated and non-subordinated instruments (including own funds instruments),
expressed as a percentage of TREA per MS (Indicator 8: Chart 8.1)
• MREL Shortfall: Computed as the difference between the MREL requirement and the
outstanding stock of MREL-eligible instruments. The part of the total MREL shortfall
referring to subordinated debt is also presented. Variables are expressed in € millions
and as a percentage of TREA per MS (Indicator 9: Charts 9.1 and 9.2)
14 For an overview of the key proposals in the risk reduction package, please see Annex I. This legislative package of reforms
was proposed by the Commission on 23 November 2016 and is currently subject to Trilogue negotiations (http://europa.eu/rapid/press-release_IP-16-3731_en.htm). 15 For further details of data composition, please see Annex III. 16 The MREL requirement in the existing BRRD/SRMR framework is calibrated on the basis of total liabilities and own funds.
Nevertheless, for presentation and comparability reasons, certain MREL related indicators are presented on the basis of TREA, unless specified otherwise.

RESTRICTED
11
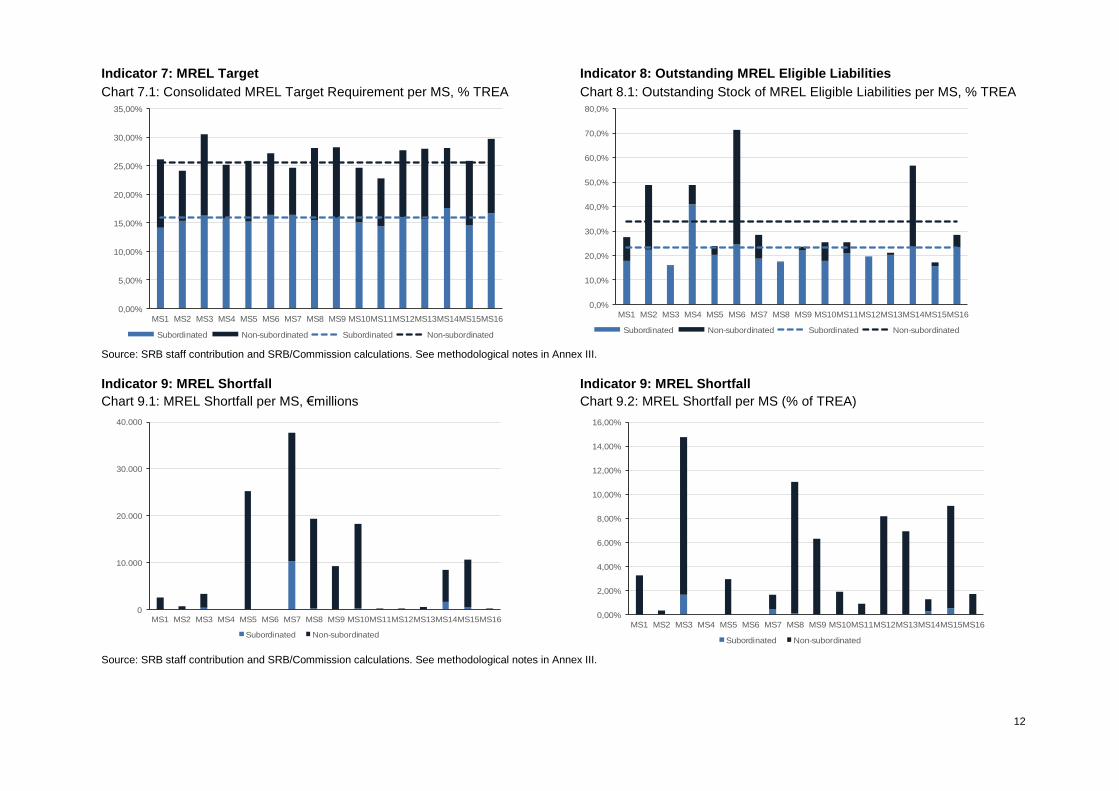
Commentary
• Outstanding stock of MREL eligible subordinated and non-subordinated
instruments. Banks under the SRB remit are making progress in issuing new MREL
eligible instruments and adjusting their balance sheets. As at 31 December 2017, the
stock of MREL eligible instruments accounted for 33.8% of TREA, of which more than
two thirds was composed of subordinated instruments. On average, subordinated
instruments account for a substantial percentage of TREA (23.1%).
• MREL shortfall. 14 of the 16 MS display a shortfall. That said, the bulk of the shortfall
remains concentrated in 5 MS. Overall, the total shortfall amounts to €136,616 million.
In relative terms, the proportion is moderate, at around 2% of TREA. Of the above-
mentioned total shortfall, the subordinated part is low, standing at €13,348 million,
which reflects both the gradual approach of the SRB in terms of subordination policy
deployment and the shift to more subordinated issuances. As at 31 December 2017,
total MREL needs represented approximately 7.9% of the total consolidated MREL
requirement.
Qualitative assessment
• Sector consolidation. According to the SRB’s 2017 annual report,17 the number of
institutions under its remit fell from 139 in 2016 (of which 130 were banking groups) to
127 in 2017 (of which 119 were banking groups). Thus, over the course of 2017, a total
of 12 institutions left the SRB’s remit due to mergers and acquisitions, liquidation,
withdrawal of banking licenses and bank restructuring activities.
• Increasing number of resolution plans. As part of the 2017 resolution planning cycle,
the SRB drafted 106 resolution plans in its capacity as of home resolution authority for
groups under its remit as well as 5 resolution plans as a host resolution authority. Thus,
it drafted a total of 111 resolution plans, an increase of 13% compared with 2016.
Resolution plans for banks and groups representing 83% of all banks and groups under
the SRB’s remit have been completed (as at the end of 2017).
17 https://srb.europa.eu/sites/srbsite/files/srb_annual_report_2017_en_0.pdf
12
Indicator 7: MREL Target Indicator 8: Outstanding MREL Eligible Liabilities
Chart 7.1: Consolidated MREL Target Requirement per MS, % TREA Chart 8.1: Outstanding Stock of MREL Eligible Liabilities per MS, % TREA
Source: SRB staff contribution and SRB/Commission calculations. See methodological notes in Annex III.
Indicator 9: MREL Shortfall Indicator 9: MREL Shortfall
Chart 9.1: MREL Shortfall per MS, €millions Chart 9.2: MREL Shortfall per MS (% of TREA)
Source: SRB staff contribution and SRB/Commission calculations. See methodological notes in Annex III.
0,00%
5,00%
10,00%
15,00%
20,00%
25,00%
30,00%
35,00%
MS1 MS2 MS3 MS4 MS5 MS6 MS7 MS8 MS9 MS10MS11MS12MS13MS14MS15MS16
Subordinated Non-subordinated Subordinated Non-subordinated
0,0%
10,0%
20,0%
30,0%
40,0%
50,0%
60,0%
70,0%
80,0%
MS1 MS2 MS3 MS4 MS5 MS6 MS7 MS8 MS9 MS10MS11MS12MS13MS14MS15MS16
Subordinated Non-subordinated Subordinated Non-subordinated
0
10.000
20.000
30.000
40.000
MS1 MS2 MS3 MS4 MS5 MS6 MS7 MS8 MS9 MS10MS11MS12MS13MS14MS15MS16
Subordinated Non-subordinated
0,00%
2,00%
4,00%
6,00%
8,00%
10,00%
12,00%
14,00%
16,00%
MS1 MS2 MS3 MS4 MS5 MS6 MS7 MS8 MS9 MS10MS11MS12MS13MS14MS15MS16
Subordinated Non-subordinated
13
5. NPLs
Structural measures
• Legislative proposals (“NPL Package”). In March 2018 the Commission proposed
legislative measures on NPLs that aim to speed up progress already made in reducing
NPLs and prevent their renewed build-up. Both proposals are currently being discussed
by co-legislators.
o The proposal for a regulation introducing common minimum coverage levels for
newly originated exposures that become non-performing will make banks set
aside funds to cover the risks associated with future non-performing exposures
(NPEs) (“prudential backstop”). In October 2018, negotiations in the Council
resulted in the successful agreement of a general approach.
o The proposal for a directive on credit servicers, credit purchasers and the
recovery of collateral will provide banks with an efficient out-of-court value
recovery mechanism for secured loans and will encourage the development of
secondary markets where banks can sell their NPLs to investors and make use
of specialist credit servicers
• National legislative measures. Several EU MS have adopted or amended legislation
with the aim of reducing NPLs (see Annex II). About half of the MS have implemented
legal reforms relating to insolvency and foreclosure (CY, GR, ES, IT, IE, LV, HU, PT
and SK), the cooperative or savings bank sectors (ES, IT and LT), legislation governing
new sales of loans legislation (IE, CY) or the introduction of a subsidy scheme (CY).
Other measures
• AMC blueprint. As part of the March 2018 NPL package the Commission published a
staff working document providing non-binding technical guidance (a so-called
“blueprint”) on how national asset management companies (AMCs) can be set up.
• EU-wide NPE guidelines. Based on the ECB’s guidance to SSM banks on NPLs the
EBA issued guidelines on the management of non-performing and forborne exposures
in October 2018. The objective of these guidelines is to achieve effective and efficient
management of exposures, as well as a sustainable reduction in the amount of NPLs
in banks’ balance sheets.
• Supervisory expectations on NPL provisioning. In March 2018, the ECB published
an Addendum to its qualitative NPL guidance specifying the ECB’s supervisory
expectations as regards prudent levels of provisions for exposures that become non-
performing after 1 April 2018. Moreover, the ECB announced in July 2018 that it would
engage with each supervised institution to define its supervisory expectations with
regards to the stock of NPLs with the aim of achieving consistent coverage of NPL
stock and flow over the medium-term.
• Enhanced disclosure requirements on asset quality and NPEs for all EU banks.
Based on the ECB’s NPL guidance, the EBA has developed guidelines specifying a
common content and uniform disclosure formats on information on NPEs, forborne
exposures and foreclosed assets that banks should disclose.
• Improved loan tape information. In order to strengthen data infrastructure with regard
to uniform and standardised data for NPLs, the EBA issued templates on loan tape
monitoring in December 2017 and updated them in September 2018. These
RESTRICTED
14
standardised NPL templates are not part of supervisory reporting, but banks and
investors are encouraged to use them in their transactions.
Quantitative indicators
• Gross NPE Ratio: Ratio of gross non-performing exposures18 (NPEs) / total gross
loans, advances and debt securities (Indicator 10: Charts 10.1 and 10.2)
• Gross NPL Ratio: Ratio of gross non-performing loans19 (NPLs) / total gross loans and
advances (Indicator 11: Charts 11.1 and 11.2)
• Net NPL Ratio: Ratio of non-performing loans and advances net of allowances and
other adjustments to total net loans and advances (Indicator 12: Charts 12.1 and 12.2)
• NPL Coverage Ratio: Ratio of accumulated allowances and credit risk adjustments /
total gross NPLs20 (Indicator 13: Charts 13.1 and 13.2)
• Collateral coverage ratio: Ratio of collateral received for non-performing loans and
advances to total gross NPLs21 (Indicator 14: Charts 14.1 and 14.2)
Commentary
• NPE, NPL and Net NPL Ratio. There has been progress on NPE, NPL and the net
NPL ratio both in terms of weighted average and all across the distribution since Q4
2014.22
• MS-specific developments for NPEs, NPLs and Net NPL Ratios. There has been
progress in most MS, with larger decreases for countries with high levels of NPEs (CY,
IE, IT and PT). In GR, NPL stocks decreased, but the impact on the ratio was offset by
a decline in total loans.
• Weighted Average NPL Coverage Ratio. The weighted average NPL coverage ratio
improved slightly.23 A more significant increase in the weighted average was observed
between Q4 2017 and Q1 2018, due to both an increase in allowances and a decrease
in NPLs.
• MS-specific developments for Average NPL Coverage Ratio. There were
improvements in coverage for 8 of the 13 MS in the sample over this period, including
several high-NPL countries (CY, GR, IT and PT), while IE and NL recorded the largest
declines in average coverage.
• Collateral Coverage Ratio. The percentage of NPLs covered by collateral decreased
from 40.0% in Q4 2014 to 34.6% in Q2 2018, which in turn led to a larger percentage
of unsecured NPL exposures.
18 The gross NPE ratio indicates the credit risk arising from loans, advances and debt securities. Loans, advances and debt securities are reported gross of allowances and credit risk adjustments. 19 The gross NPL ratio indicates the credit risk arising from loans and advances. Non-performing loans and advances are reported gross of allowances and credit risk adjustments. 20 The NPL coverage ratio indicates the extent to which losses on NPLs are covered by provisions. 21 The collateral coverage ratio indicates the extent to which NPLs are secured by collateral such as movable and immovable property, amongst others. 22 In particular, the interquartile range (25th to 75th percentiles) has narrowed for all three measures, which was mainly attributable to the large decrease observed for the 75th percentile. 23 Across the distribution, the interquartile range has widened over the last year, driven by both a decrease in the 25th percentile and an increase in the 75th percentile.
RESTRICTED
15
• MS-specific developments for the Collateral Coverage Ratio. 4 out of 13 MS in the
sample have seen an increase in collateral coverage over this period, while the other
9 have seen declines.
Qualitative assessment
• NPL reduction initiatives. More than half of the MS have taken steps to reduce NPLs
– e.g. by means of sales of NPLs (GR, ES, IT, IE, CY and PT), transfers of legacy
assets to external asset management companies (ES and IE), securitisation schemes
supported by state guarantees (IT), and improved arrears management and NPL
workouts in banks (DE, IE, EE, ES, CY, LT and LV).
• Q3 2018 developments. Since June 2018, various credit institutions in CY have made
significant progress in tackling NPLs (creation of a residual entity and removal of a
sizeable NPL portfolio from outside banking systems, as well as the sale of NPL
portfolios to AMCs), as have credit institutions in ES (large portfolio disposals by two
major banks and acceleration of balance sheet clean-up).
• Secondary markets. Activity on secondary markets for NPLs is growing in some MS
(IT, IE, ES, GR, CY and PT). Interest from investors is rising and the volume of NPL-
related transactions is increasing.
16
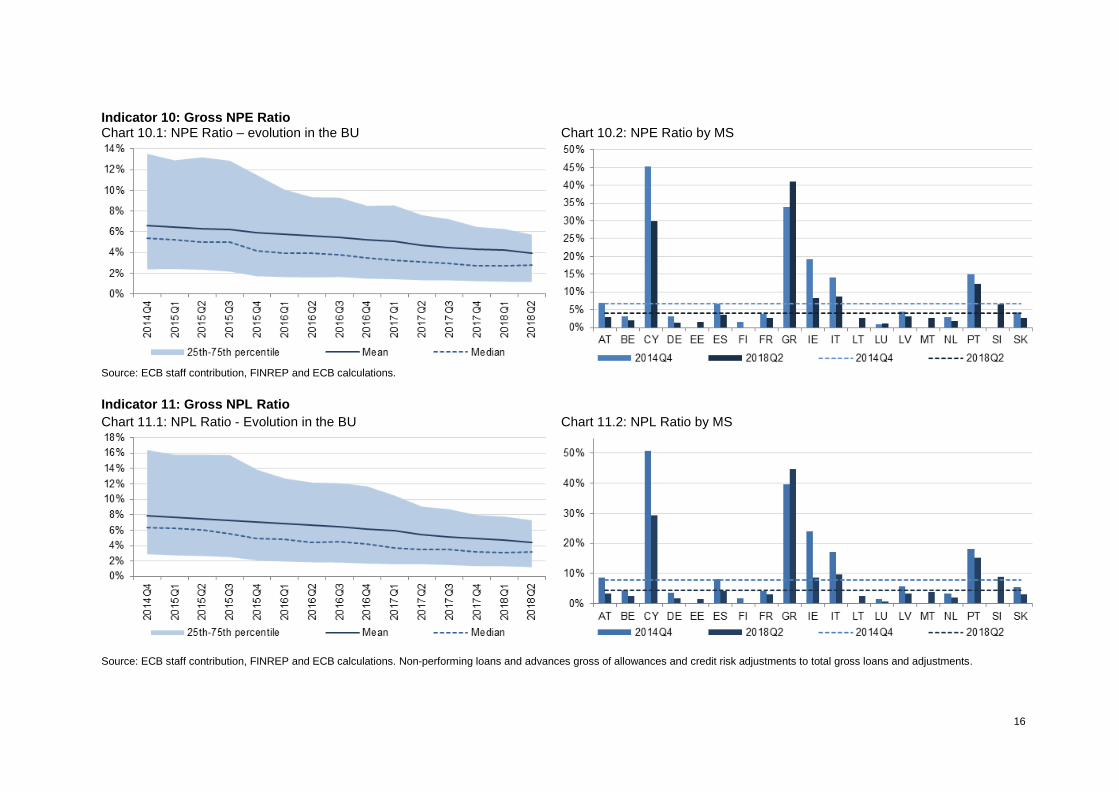
Indicator 10: Gross NPE Ratio Chart 10.1: NPE Ratio – evolution in the BU Chart 10.2: NPE Ratio by MS
Source: ECB staff contribution, FINREP and ECB calculations.
Indicator 11: Gross NPL Ratio
Chart 11.1: NPL Ratio - Evolution in the BU Chart 11.2: NPL Ratio by MS
Source: ECB staff contribution, FINREP and ECB calculations. Non-performing loans and advances gross of allowances and credit risk adjustments to total gross loans and adjustments.
17
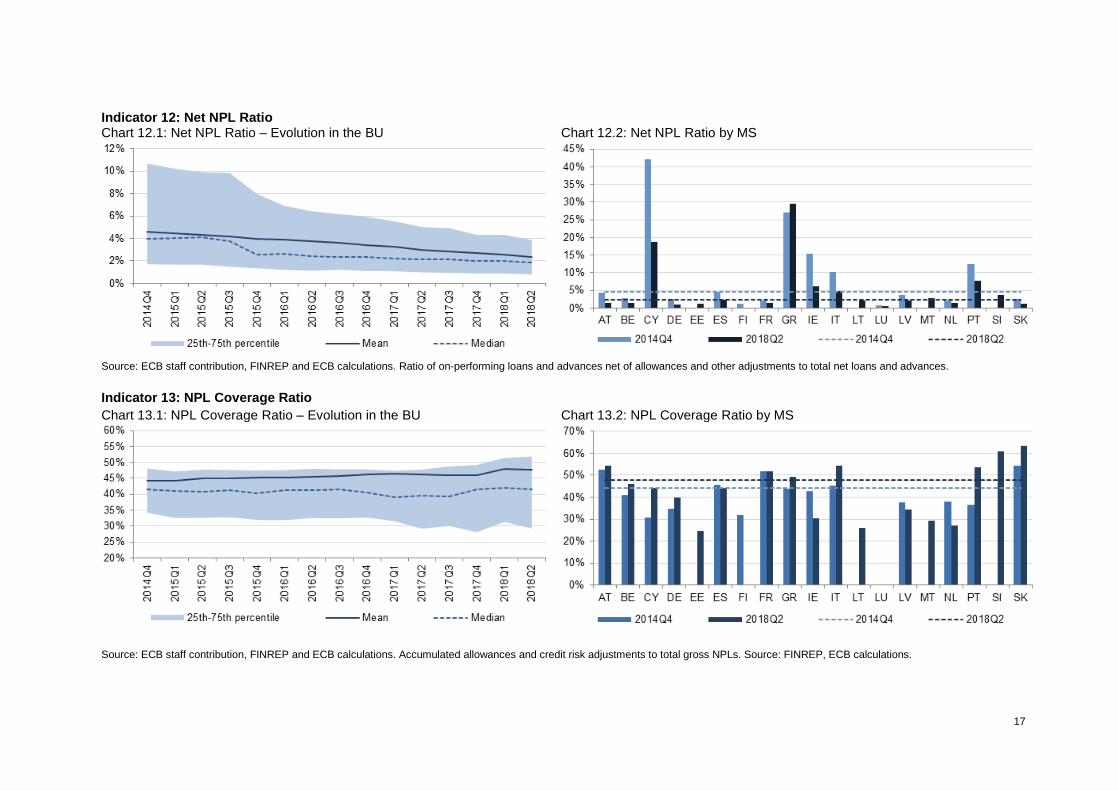
Indicator 12: Net NPL Ratio Chart 12.1: Net NPL Ratio – Evolution in the BU Chart 12.2: Net NPL Ratio by MS
Source: ECB staff contribution, FINREP and ECB calculations. Ratio of on-performing loans and advances net of allowances and other adjustments to total net loans and advances.
Indicator 13: NPL Coverage Ratio
Chart 13.1: NPL Coverage Ratio – Evolution in the BU Chart 13.2: NPL Coverage Ratio by MS
Source: ECB staff contribution, FINREP and ECB calculations. Accumulated allowances and credit risk adjustments to total gross NPLs. Source: FINREP, ECB calculations.

RESTRICTED DRAFT
18
Indicator 14: Collateral Coverage Ratio Chart 14.1: Collateral Coverage Ratio – Evolution in the BU Chart 14.2: Collateral Coverage Ratio by MS
Source: ECB staff contribution, FINREP and ECB calculations. Collateral received on non-performing loans and advances to total gross NPLs.
RESTRICTED
19
Overview of Annexes
Annex I provides an update on relevant legislative measures. This list includes both risk
reduction and risk sharing measures which are already in force or under negotiation.
Annex II presents details of other national measures that have been adopted in addition to
transposing agreed EU legislation. This list of national measures, which is not exhaustive,
provides details of some of the key measures covered by the semester country surveillance
reports.
Annex III contains the methodological notes covering data sources, the scope of the analysis,
time series samples, the metrics used, confidentiality criteria applied, the treatment of missing
data and caveats applied to the charts displayed.
Annex IV presents formulae with reference to the ITS data points used to compute the different
indicators.
RESTRICTED
20
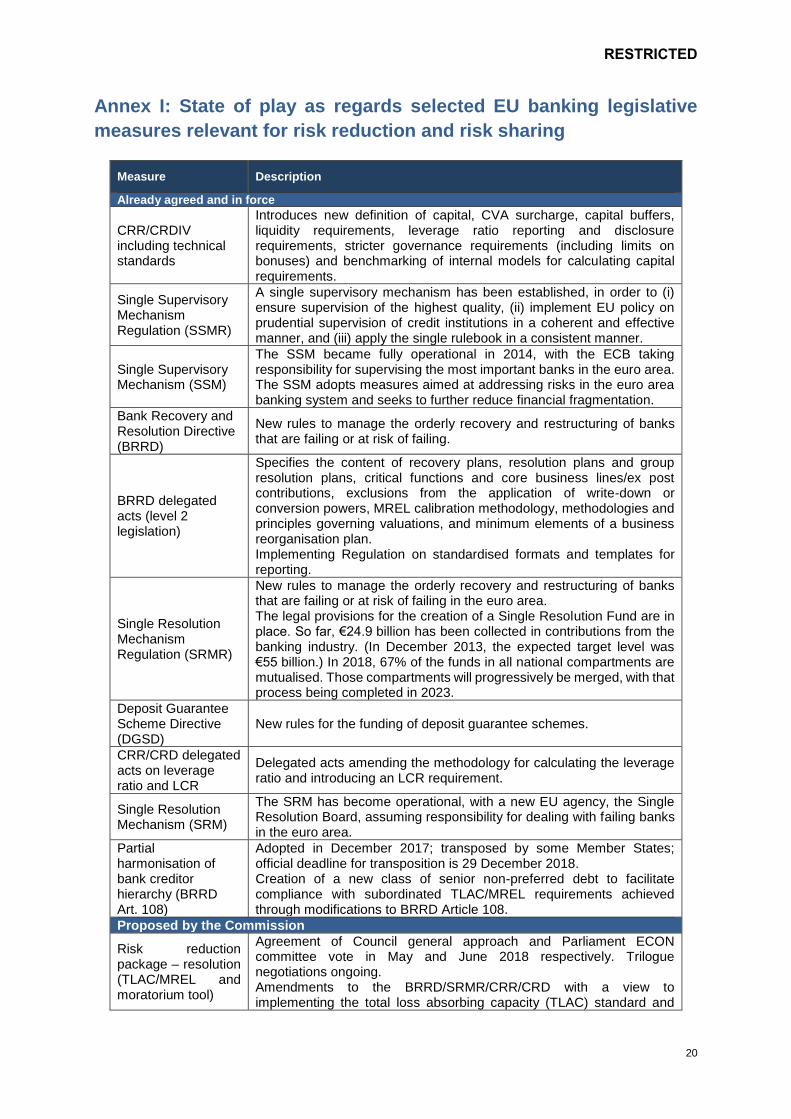
Annex I: State of play as regards selected EU banking legislative
measures relevant for risk reduction and risk sharing
Measure Description
Already agreed and in force
CRR/CRDIV including technical standards
Introduces new definition of capital, CVA surcharge, capital buffers, liquidity requirements, leverage ratio reporting and disclosure requirements, stricter governance requirements (including limits on bonuses) and benchmarking of internal models for calculating capital requirements.
Single Supervisory Mechanism Regulation (SSMR)
A single supervisory mechanism has been established, in order to (i) ensure supervision of the highest quality, (ii) implement EU policy on prudential supervision of credit institutions in a coherent and effective manner, and (iii) apply the single rulebook in a consistent manner.
Single Supervisory Mechanism (SSM)
The SSM became fully operational in 2014, with the ECB taking responsibility for supervising the most important banks in the euro area. The SSM adopts measures aimed at addressing risks in the euro area banking system and seeks to further reduce financial fragmentation.
Bank Recovery and Resolution Directive (BRRD)
New rules to manage the orderly recovery and restructuring of banks that are failing or at risk of failing.
BRRD delegated acts (level 2 legislation)
Specifies the content of recovery plans, resolution plans and group resolution plans, critical functions and core business lines/ex post contributions, exclusions from the application of write-down or conversion powers, MREL calibration methodology, methodologies and principles governing valuations, and minimum elements of a business reorganisation plan. Implementing Regulation on standardised formats and templates for reporting.
Single Resolution Mechanism Regulation (SRMR)
New rules to manage the orderly recovery and restructuring of banks that are failing or at risk of failing in the euro area. The legal provisions for the creation of a Single Resolution Fund are in place. So far, €24.9 billion has been collected in contributions from the banking industry. (In December 2013, the expected target level was €55 billion.) In 2018, 67% of the funds in all national compartments are mutualised. Those compartments will progressively be merged, with that process being completed in 2023.
Deposit Guarantee Scheme Directive (DGSD)
New rules for the funding of deposit guarantee schemes.
CRR/CRD delegated acts on leverage ratio and LCR
Delegated acts amending the methodology for calculating the leverage ratio and introducing an LCR requirement.
Single Resolution Mechanism (SRM)
The SRM has become operational, with a new EU agency, the Single Resolution Board, assuming responsibility for dealing with failing banks in the euro area.
Partial harmonisation of bank creditor hierarchy (BRRD Art. 108)
Adopted in December 2017; transposed by some Member States; official deadline for transposition is 29 December 2018. Creation of a new class of senior non-preferred debt to facilitate compliance with subordinated TLAC/MREL requirements achieved through modifications to BRRD Article 108.
Proposed by the Commission
Risk reduction package – resolution (TLAC/MREL and moratorium tool)
Agreement of Council general approach and Parliament ECON committee vote in May and June 2018 respectively. Trilogue negotiations ongoing. Amendments to the BRRD/SRMR/CRR/CRD with a view to implementing the total loss absorbing capacity (TLAC) standard and

RESTRICTED
21
Measure Description
reviewing the minimum requirement for own funds and eligible liabilities (MREL), implementing the MREL allocation within groups (internal MREL). Amendments to the BRRD with a view to harmonising moratorium tools and ensuring more proportionate recognition of bail-in powers in third countries.
Risk reduction package – prudential (CRR/CRD review)
Agreement of Council General Approach and Parliament ECON committee vote in May and June 2018 respectively. Trilogue negotiations ongoing. Amendments to the CRR/CRDIV to, inter alia, implement and finalise remaining Basel reforms, including the introduction of: - a binding leverage ratio; - a binding net stable funding ratio; - more risk-sensitive capital requirements, particularly in the area of market risk, counterparty credit risk and exposures to central counterparties; - more stringent large exposure limits for G-SIIs. Amendments to enhance consolidated supervision (requirement for third-country groups to set up an EU-based intermediate parent undertaking (IPU) or authorisation requirements for (mixed) financial holding companies). Amendments to allow for cross-border capital and liquidity waivers, subject to safeguards. Proportionality-enhancing amendments, which are intended to reduce undue administrative burdens and improve banks' lending capacity.
Insolvency law Council general approach agreed. Proposal for a directive on preventive restructuring framework, second chances and measures to increase the efficiency of restructuring, insolvency and discharge procedures.
Investment firms Prudential banking supervision for large investment firms.
Measures to address NPLs
Interpretation of existing supervisory powers aimed at addressing potential under-provisioning of NPLs.
Blueprint on the setting-up of national AMCs.
Proposal for a directive on credit servicers, credit purchasers and the recovery of collateral.
Fostering of transparency and improvements to data infrastructure on NPLs.
Benchmarking of national loan enforcement (including insolvency) systems from a bank creditor perspective.
Proposal for a regulation amending the Capital Requirements Regulation which introduces statutory prudential backstops to prevent the build-up of future NPLs without sufficient loan loss coverage and a common definition of NPEs.
Measures building on the improvements introduced by IFRS9 (i.e. higher and earlier loan loss provisioning for credit risk).
Sovereign bond-backed securities (SBBSs)
An enabling framework for securities that allows for pooling and possibly tranching of sovereign bonds from different Member States.
RESTRICTED
22
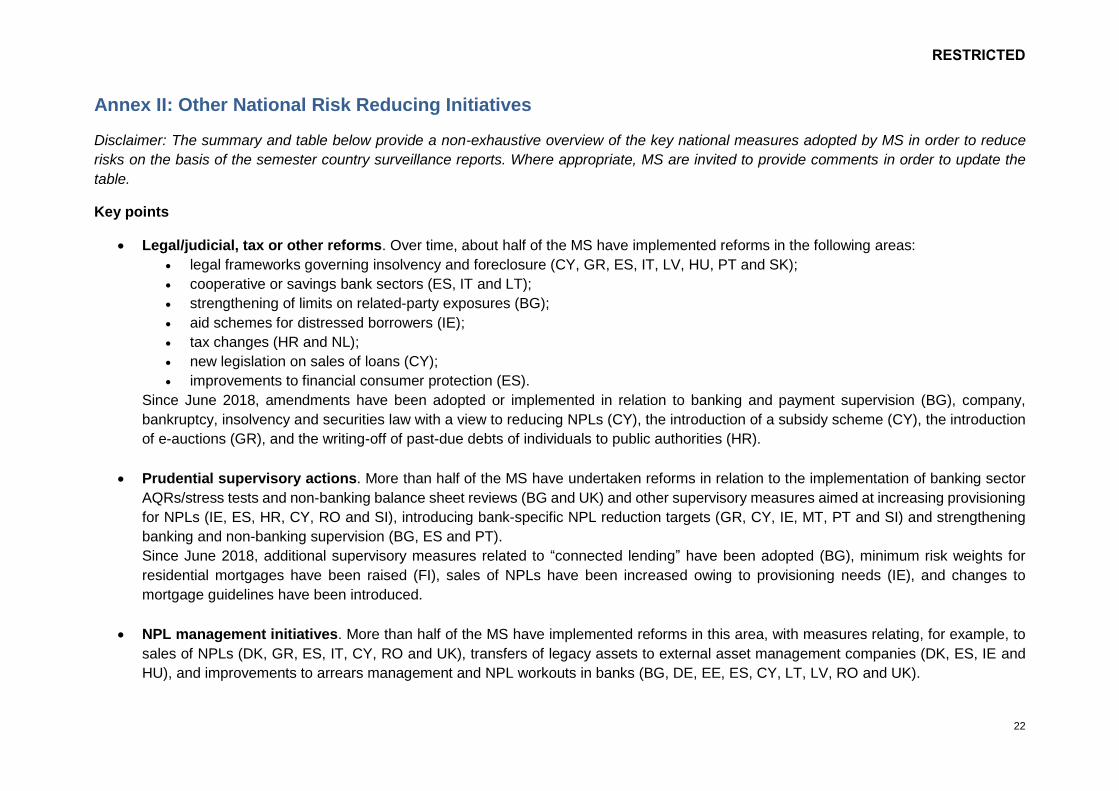
Annex II: Other National Risk Reducing Initiatives
Disclaimer: The summary and table below provide a non-exhaustive overview of the key national measures adopted by MS in order to reduce
risks on the basis of the semester country surveillance reports. Where appropriate, MS are invited to provide comments in order to update the
table.
Key points
• Legal/judicial, tax or other reforms. Over time, about half of the MS have implemented reforms in the following areas:
• legal frameworks governing insolvency and foreclosure (CY, GR, ES, IT, LV, HU, PT and SK);
• cooperative or savings bank sectors (ES, IT and LT);
• strengthening of limits on related-party exposures (BG);
• aid schemes for distressed borrowers (IE);
• tax changes (HR and NL);
• new legislation on sales of loans (CY);
• improvements to financial consumer protection (ES).
Since June 2018, amendments have been adopted or implemented in relation to banking and payment supervision (BG), company,
bankruptcy, insolvency and securities law with a view to reducing NPLs (CY), the introduction of a subsidy scheme (CY), the introduction
of e-auctions (GR), and the writing-off of past-due debts of individuals to public authorities (HR).
• Prudential supervisory actions. More than half of the MS have undertaken reforms in relation to the implementation of banking sector
AQRs/stress tests and non-banking balance sheet reviews (BG and UK) and other supervisory measures aimed at increasing provisioning
for NPLs (IE, ES, HR, CY, RO and SI), introducing bank-specific NPL reduction targets (GR, CY, IE, MT, PT and SI) and strengthening
banking and non-banking supervision (BG, ES and PT).
Since June 2018, additional supervisory measures related to “connected lending” have been adopted (BG), minimum risk weights for
residential mortgages have been raised (FI), sales of NPLs have been increased owing to provisioning needs (IE), and changes to
mortgage guidelines have been introduced.
• NPL management initiatives. More than half of the MS have implemented reforms in this area, with measures relating, for example, to
sales of NPLs (DK, GR, ES, IT, CY, RO and UK), transfers of legacy assets to external asset management companies (DK, ES, IE and
HU), and improvements to arrears management and NPL workouts in banks (BG, DE, EE, ES, CY, LT, LV, RO and UK).
RESTRICTED
23
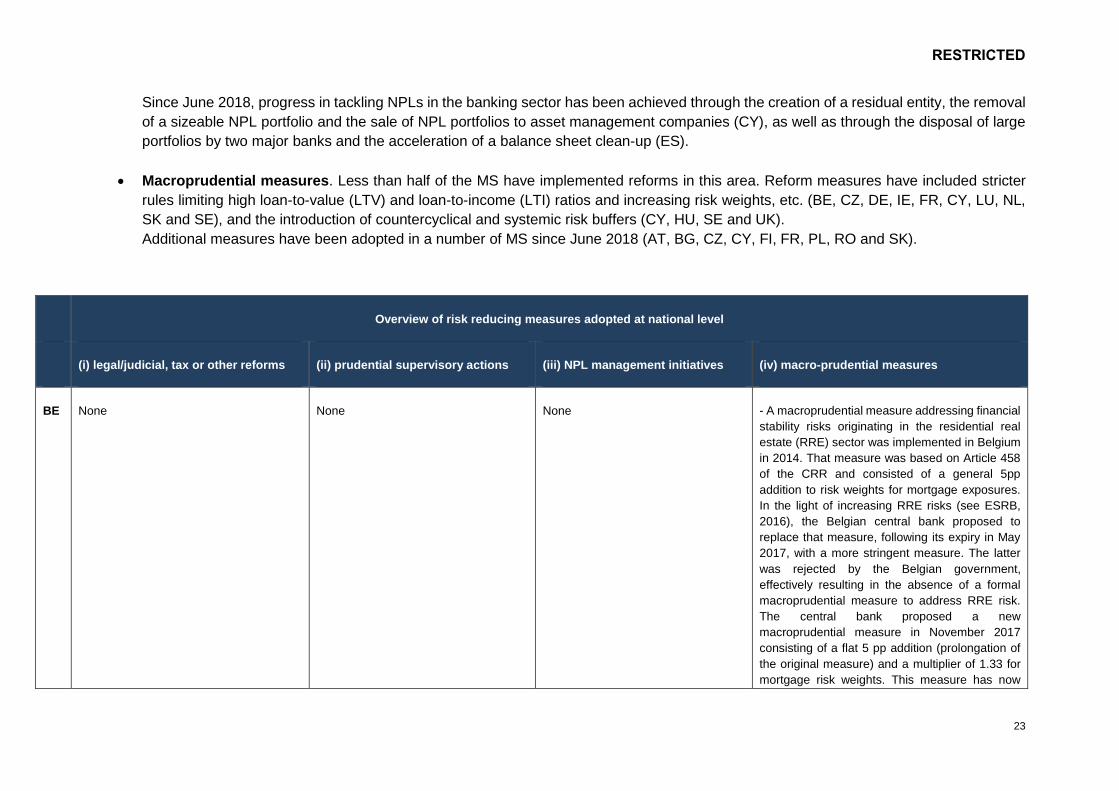
Since June 2018, progress in tackling NPLs in the banking sector has been achieved through the creation of a residual entity, the removal
of a sizeable NPL portfolio and the sale of NPL portfolios to asset management companies (CY), as well as through the disposal of large
portfolios by two major banks and the acceleration of a balance sheet clean-up (ES).
• Macroprudential measures. Less than half of the MS have implemented reforms in this area. Reform measures have included stricter
rules limiting high loan-to-value (LTV) and loan-to-income (LTI) ratios and increasing risk weights, etc. (BE, CZ, DE, IE, FR, CY, LU, NL,
SK and SE), and the introduction of countercyclical and systemic risk buffers (CY, HU, SE and UK).
Additional measures have been adopted in a number of MS since June 2018 (AT, BG, CZ, CY, FI, FR, PL, RO and SK).
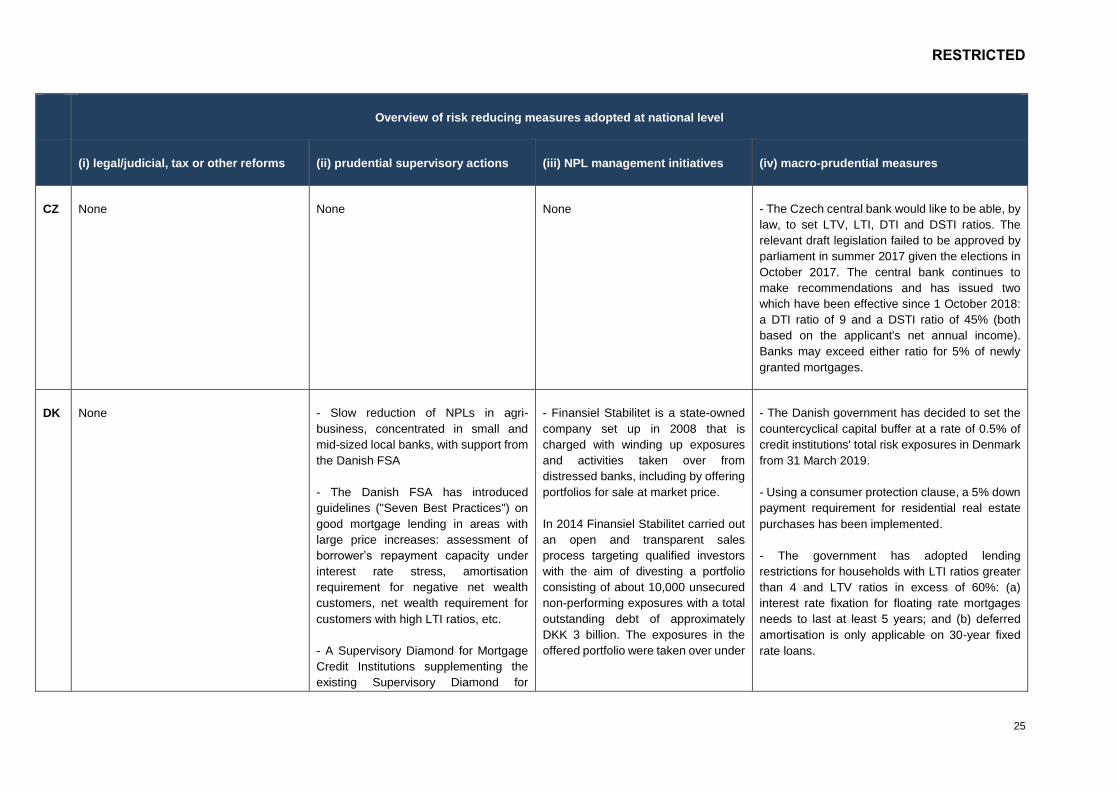
Overview of risk reducing measures adopted at national level
(i) legal/judicial, tax or other reforms (ii) prudential supervisory actions (iii) NPL management initiatives (iv) macro-prudential measures
BE None None None - A macroprudential measure addressing financial
stability risks originating in the residential real
estate (RRE) sector was implemented in Belgium
in 2014. That measure was based on Article 458
of the CRR and consisted of a general 5pp
addition to risk weights for mortgage exposures.
In the light of increasing RRE risks (see ESRB,
2016), the Belgian central bank proposed to
replace that measure, following its expiry in May
2017, with a more stringent measure. The latter
was rejected by the Belgian government,
effectively resulting in the absence of a formal
macroprudential measure to address RRE risk.
The central bank proposed a new
macroprudential measure in November 2017
consisting of a flat 5 pp addition (prolongation of
the original measure) and a multiplier of 1.33 for
mortgage risk weights. This measure has now
RESTRICTED
24
Overview of risk reducing measures adopted at national level
(i) legal/judicial, tax or other reforms (ii) prudential supervisory actions (iii) NPL management initiatives (iv) macro-prudential measures
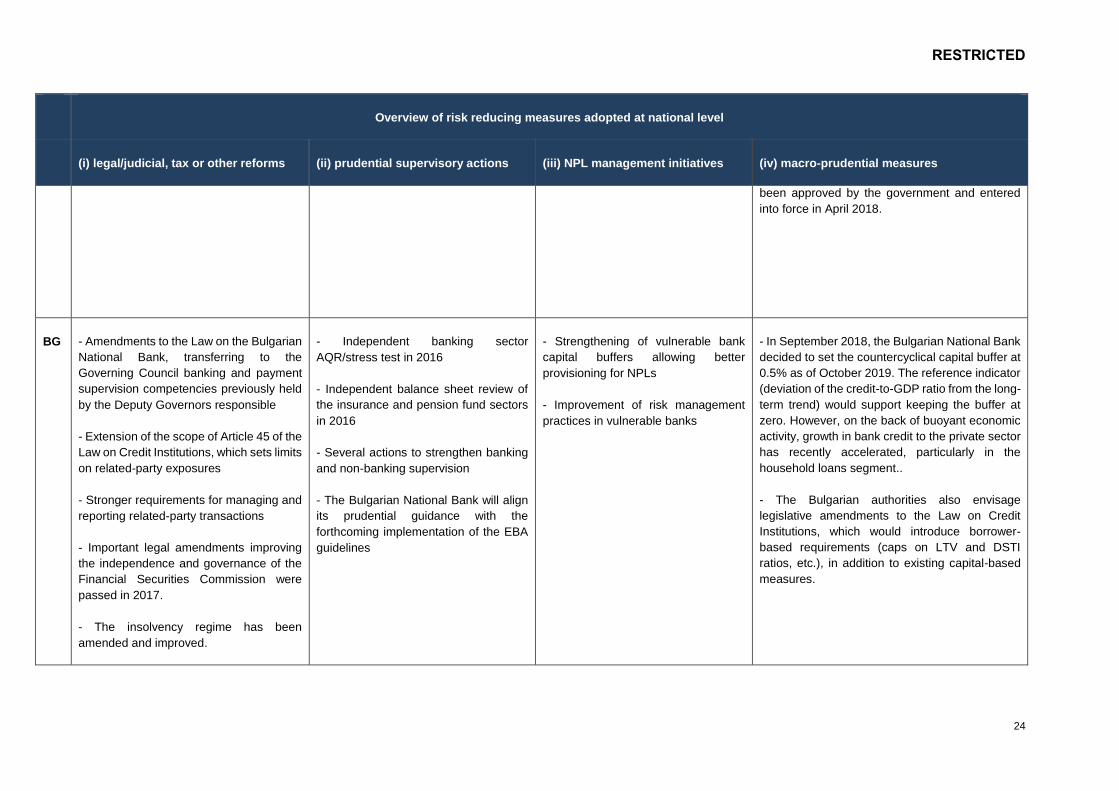
been approved by the government and entered
into force in April 2018.
BG - Amendments to the Law on the Bulgarian
National Bank, transferring to the
Governing Council banking and payment
supervision competencies previously held
by the Deputy Governors responsible
- Extension of the scope of Article 45 of the
Law on Credit Institutions, which sets limits
on related-party exposures
- Stronger requirements for managing and
reporting related-party transactions
- Important legal amendments improving
the independence and governance of the
Financial Securities Commission were
passed in 2017.
- The insolvency regime has been
amended and improved.
- Independent banking sector
AQR/stress test in 2016
- Independent balance sheet review of
the insurance and pension fund sectors
in 2016
- Several actions to strengthen banking
and non-banking supervision
- The Bulgarian National Bank will align
its prudential guidance with the
forthcoming implementation of the EBA
guidelines
- Strengthening of vulnerable bank
capital buffers allowing better
provisioning for NPLs
- Improvement of risk management
practices in vulnerable banks
- In September 2018, the Bulgarian National Bank
decided to set the countercyclical capital buffer at
0.5% as of October 2019. The reference indicator
(deviation of the credit-to-GDP ratio from the long-
term trend) would support keeping the buffer at
zero. However, on the back of buoyant economic
activity, growth in bank credit to the private sector
has recently accelerated, particularly in the
household loans segment..
- The Bulgarian authorities also envisage
legislative amendments to the Law on Credit
Institutions, which would introduce borrower-
based requirements (caps on LTV and DSTI
ratios, etc.), in addition to existing capital-based
measures.
RESTRICTED
25
Overview of risk reducing measures adopted at national level
(i) legal/judicial, tax or other reforms (ii) prudential supervisory actions (iii) NPL management initiatives (iv) macro-prudential measures
CZ None None None - The Czech central bank would like to be able, by
law, to set LTV, LTI, DTI and DSTI ratios. The
relevant draft legislation failed to be approved by
parliament in summer 2017 given the elections in
October 2017. The central bank continues to
make recommendations and has issued two
which have been effective since 1 October 2018:
a DTI ratio of 9 and a DSTI ratio of 45% (both
based on the applicant's net annual income).
Banks may exceed either ratio for 5% of newly
granted mortgages.
DK None - Slow reduction of NPLs in agri-
business, concentrated in small and
mid-sized local banks, with support from
the Danish FSA
- The Danish FSA has introduced
guidelines ("Seven Best Practices") on
good mortgage lending in areas with
large price increases: assessment of
borrower’s repayment capacity under
interest rate stress, amortisation
requirement for negative net wealth
customers, net wealth requirement for
customers with high LTI ratios, etc.
- A Supervisory Diamond for Mortgage
Credit Institutions supplementing the
existing Supervisory Diamond for
- Finansiel Stabilitet is a state-owned
company set up in 2008 that is
charged with winding up exposures
and activities taken over from
distressed banks, including by offering
portfolios for sale at market price.
In 2014 Finansiel Stabilitet carried out
an open and transparent sales
process targeting qualified investors
with the aim of divesting a portfolio
consisting of about 10,000 unsecured
non-performing exposures with a total
outstanding debt of approximately
DKK 3 billion. The exposures in the
offered portfolio were taken over under
- The Danish government has decided to set the
countercyclical capital buffer at a rate of 0.5% of
credit institutions' total risk exposures in Denmark
from 31 March 2019.
- Using a consumer protection clause, a 5% down
payment requirement for residential real estate
purchases has been implemented.
- The government has adopted lending
restrictions for households with LTI ratios greater
than 4 and LTV ratios in excess of 60%: (a)
interest rate fixation for floating rate mortgages
needs to last at least 5 years; and (b) deferred
amortisation is only applicable on 30-year fixed
rate loans.
RESTRICTED
26
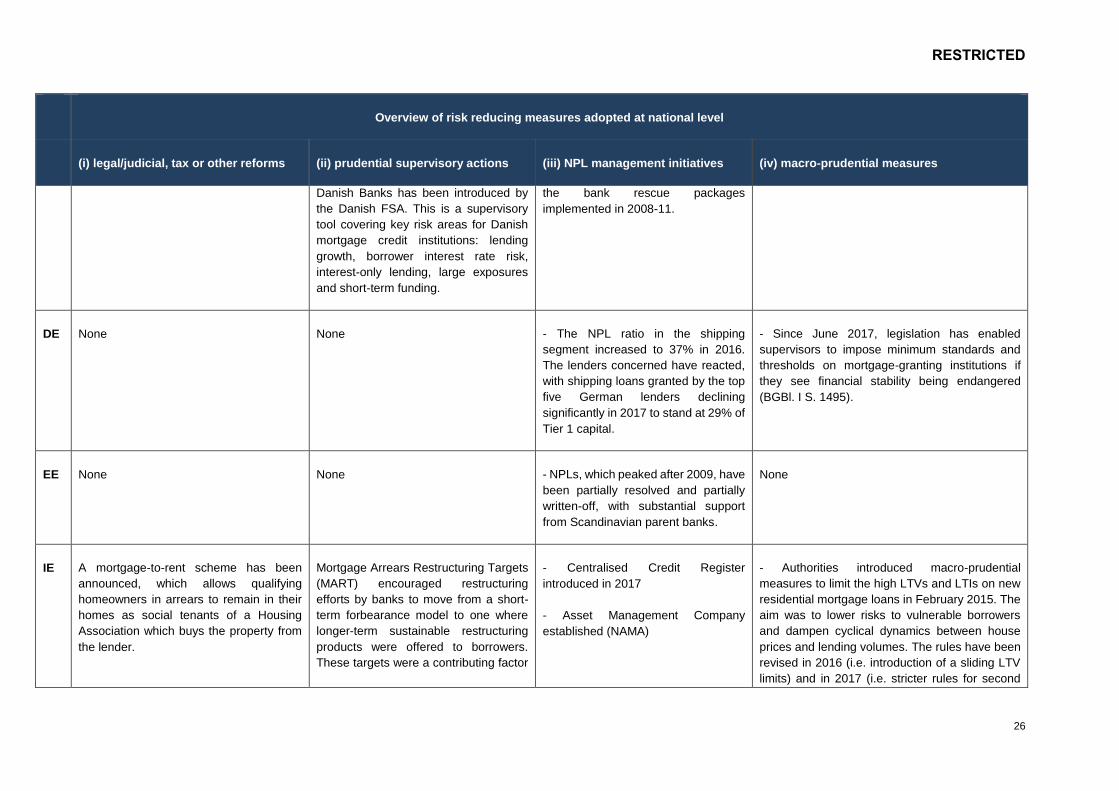
Overview of risk reducing measures adopted at national level
(i) legal/judicial, tax or other reforms (ii) prudential supervisory actions (iii) NPL management initiatives (iv) macro-prudential measures
Danish Banks has been introduced by
the Danish FSA. This is a supervisory
tool covering key risk areas for Danish
mortgage credit institutions: lending
growth, borrower interest rate risk,
interest-only lending, large exposures
and short-term funding.
the bank rescue packages
implemented in 2008-11.
DE None
None
- The NPL ratio in the shipping
segment increased to 37% in 2016.
The lenders concerned have reacted,
with shipping loans granted by the top
five German lenders declining
significantly in 2017 to stand at 29% of
Tier 1 capital.
- Since June 2017, legislation has enabled
supervisors to impose minimum standards and
thresholds on mortgage-granting institutions if
they see financial stability being endangered
(BGBl. I S. 1495).
EE None None - NPLs, which peaked after 2009, have
been partially resolved and partially
written-off, with substantial support
from Scandinavian parent banks.
None
IE A mortgage-to-rent scheme has been
announced, which allows qualifying
homeowners in arrears to remain in their
homes as social tenants of a Housing
Association which buys the property from
the lender.
Mortgage Arrears Restructuring Targets
(MART) encouraged restructuring
efforts by banks to move from a short-
term forbearance model to one where
longer-term sustainable restructuring
products were offered to borrowers.
These targets were a contributing factor
- Centralised Credit Register
introduced in 2017
- Asset Management Company
established (NAMA)
- Authorities introduced macro-prudential
measures to limit the high LTVs and LTIs on new
residential mortgage loans in February 2015. The
aim was to lower risks to vulnerable borrowers
and dampen cyclical dynamics between house
prices and lending volumes. The rules have been
revised in 2016 (i.e. introduction of a sliding LTV
limits) and in 2017 (i.e. stricter rules for second
RESTRICTED
27
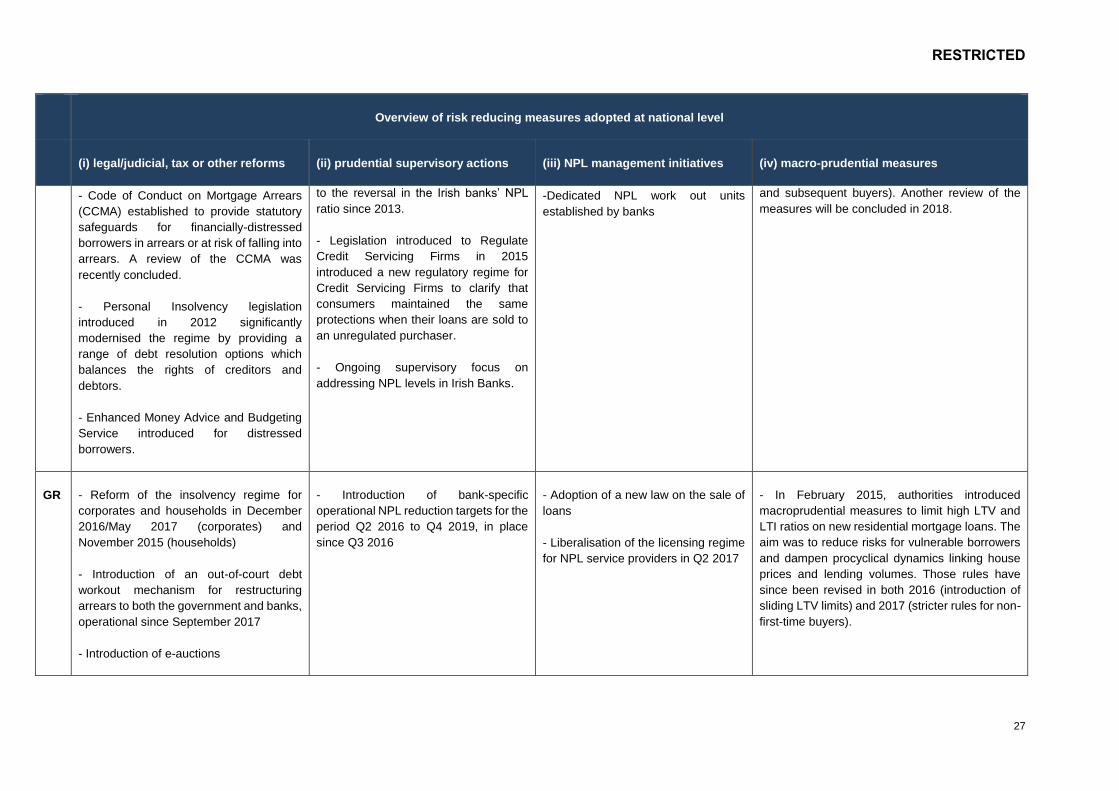
Overview of risk reducing measures adopted at national level
(i) legal/judicial, tax or other reforms (ii) prudential supervisory actions (iii) NPL management initiatives (iv) macro-prudential measures
- Code of Conduct on Mortgage Arrears
(CCMA) established to provide statutory
safeguards for financially-distressed
borrowers in arrears or at risk of falling into
arrears. A review of the CCMA was
recently concluded.
- Personal Insolvency legislation
introduced in 2012 significantly
modernised the regime by providing a
range of debt resolution options which
balances the rights of creditors and
debtors.
- Enhanced Money Advice and Budgeting
Service introduced for distressed
borrowers.
to the reversal in the Irish banks’ NPL
ratio since 2013.
- Legislation introduced to Regulate
Credit Servicing Firms in 2015
introduced a new regulatory regime for
Credit Servicing Firms to clarify that
consumers maintained the same
protections when their loans are sold to
an unregulated purchaser.
- Ongoing supervisory focus on
addressing NPL levels in Irish Banks.
-Dedicated NPL work out units
established by banks
and subsequent buyers). Another review of the
measures will be concluded in 2018.
GR - Reform of the insolvency regime for
corporates and households in December
2016/May 2017 (corporates) and
November 2015 (households)
- Introduction of an out-of-court debt
workout mechanism for restructuring
arrears to both the government and banks,
operational since September 2017
- Introduction of e-auctions
- Introduction of bank-specific
operational NPL reduction targets for the
period Q2 2016 to Q4 2019, in place
since Q3 2016
- Adoption of a new law on the sale of
loans
- Liberalisation of the licensing regime
for NPL service providers in Q2 2017
- In February 2015, authorities introduced
macroprudential measures to limit high LTV and
LTI ratios on new residential mortgage loans. The
aim was to reduce risks for vulnerable borrowers
and dampen procyclical dynamics linking house
prices and lending volumes. Those rules have
since been revised in both 2016 (introduction of
sliding LTV limits) and 2017 (stricter rules for non-
first-time buyers).
RESTRICTED
28
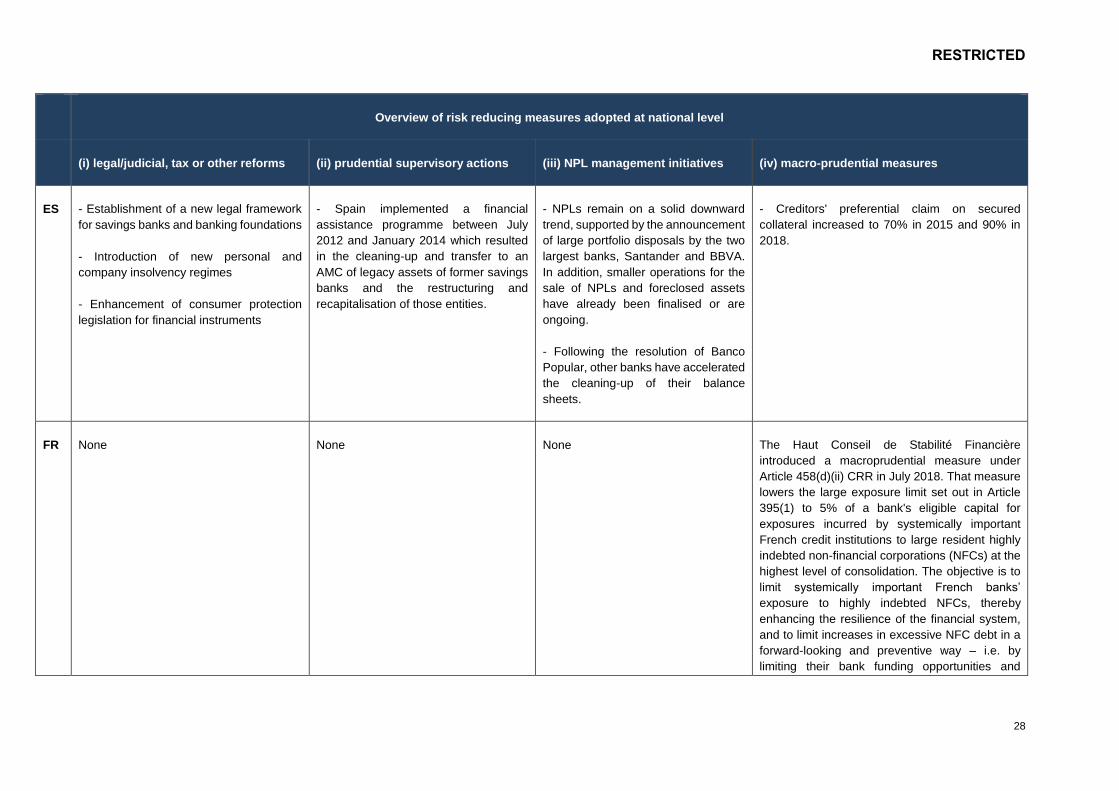
Overview of risk reducing measures adopted at national level
(i) legal/judicial, tax or other reforms (ii) prudential supervisory actions (iii) NPL management initiatives (iv) macro-prudential measures
ES - Establishment of a new legal framework
for savings banks and banking foundations
- Introduction of new personal and
company insolvency regimes
- Enhancement of consumer protection
legislation for financial instruments
- Spain implemented a financial
assistance programme between July
2012 and January 2014 which resulted
in the cleaning-up and transfer to an
AMC of legacy assets of former savings
banks and the restructuring and
recapitalisation of those entities.
- NPLs remain on a solid downward
trend, supported by the announcement
of large portfolio disposals by the two
largest banks, Santander and BBVA.
In addition, smaller operations for the
sale of NPLs and foreclosed assets
have already been finalised or are
ongoing.
- Following the resolution of Banco
Popular, other banks have accelerated
the cleaning-up of their balance
sheets.
- Creditors' preferential claim on secured
collateral increased to 70% in 2015 and 90% in
2018.
FR None
None
None
The Haut Conseil de Stabilité Financière
introduced a macroprudential measure under
Article 458(d)(ii) CRR in July 2018. That measure
lowers the large exposure limit set out in Article
395(1) to 5% of a bank's eligible capital for
exposures incurred by systemically important
French credit institutions to large resident highly
indebted non-financial corporations (NFCs) at the
highest level of consolidation. The objective is to
limit systemically important French banks’
exposure to highly indebted NFCs, thereby
enhancing the resilience of the financial system,
and to limit increases in excessive NFC debt in a
forward-looking and preventive way – i.e. by
limiting their bank funding opportunities and
RESTRICTED
29
Overview of risk reducing measures adopted at national level
(i) legal/judicial, tax or other reforms (ii) prudential supervisory actions (iii) NPL management initiatives (iv) macro-prudential measures
sending a signal to the markets regarding the
increased leverage of large French NFCs.
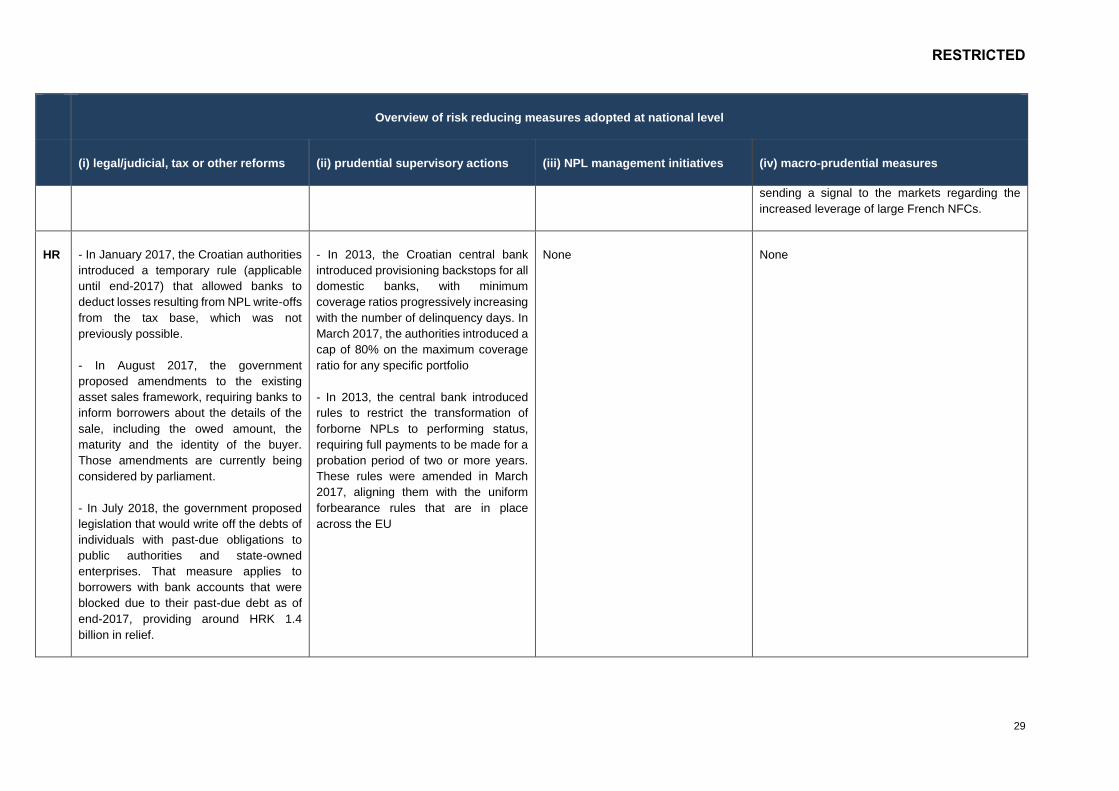
HR
- In January 2017, the Croatian authorities
introduced a temporary rule (applicable
until end-2017) that allowed banks to
deduct losses resulting from NPL write-offs
from the tax base, which was not
previously possible.
- In August 2017, the government
proposed amendments to the existing
asset sales framework, requiring banks to
inform borrowers about the details of the
sale, including the owed amount, the
maturity and the identity of the buyer.
Those amendments are currently being
considered by parliament.
- In July 2018, the government proposed
legislation that would write off the debts of
individuals with past-due obligations to
public authorities and state-owned
enterprises. That measure applies to
borrowers with bank accounts that were
blocked due to their past-due debt as of
end-2017, providing around HRK 1.4
billion in relief.
- In 2013, the Croatian central bank
introduced provisioning backstops for all
domestic banks, with minimum
coverage ratios progressively increasing
with the number of delinquency days. In
March 2017, the authorities introduced a
cap of 80% on the maximum coverage
ratio for any specific portfolio
- In 2013, the central bank introduced
rules to restrict the transformation of
forborne NPLs to performing status,
requiring full payments to be made for a
probation period of two or more years.
These rules were amended in March
2017, aligning them with the uniform
forbearance rules that are in place
across the EU
None None
RESTRICTED
30
Overview of risk reducing measures adopted at national level
(i) legal/judicial, tax or other reforms (ii) prudential supervisory actions (iii) NPL management initiatives (iv) macro-prudential measures
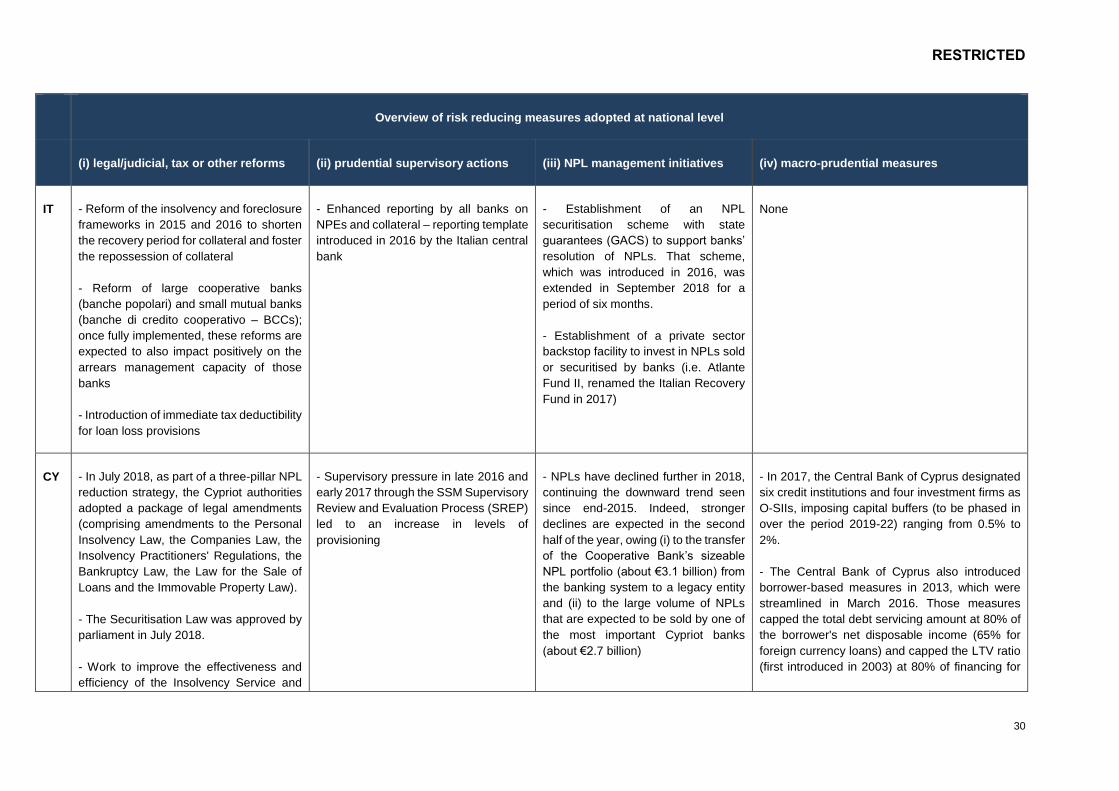
IT - Reform of the insolvency and foreclosure
frameworks in 2015 and 2016 to shorten
the recovery period for collateral and foster
the repossession of collateral
- Reform of large cooperative banks
(banche popolari) and small mutual banks
(banche di credito cooperativo – BCCs);
once fully implemented, these reforms are
expected to also impact positively on the
arrears management capacity of those
banks
- Introduction of immediate tax deductibility
for loan loss provisions
- Enhanced reporting by all banks on
NPEs and collateral – reporting template
introduced in 2016 by the Italian central
bank
- Establishment of an NPL
securitisation scheme with state
guarantees (GACS) to support banks’
resolution of NPLs. That scheme,
which was introduced in 2016, was
extended in September 2018 for a
period of six months.
- Establishment of a private sector
backstop facility to invest in NPLs sold
or securitised by banks (i.e. Atlante
Fund II, renamed the Italian Recovery
Fund in 2017)
None
CY - In July 2018, as part of a three-pillar NPL
reduction strategy, the Cypriot authorities
adopted a package of legal amendments
(comprising amendments to the Personal
Insolvency Law, the Companies Law, the
Insolvency Practitioners' Regulations, the
Bankruptcy Law, the Law for the Sale of
Loans and the Immovable Property Law).
- The Securitisation Law was approved by
parliament in July 2018.
- Work to improve the effectiveness and
efficiency of the Insolvency Service and
- Supervisory pressure in late 2016 and
early 2017 through the SSM Supervisory
Review and Evaluation Process (SREP)
led to an increase in levels of
provisioning
- NPLs have declined further in 2018,
continuing the downward trend seen
since end-2015. Indeed, stronger
declines are expected in the second
half of the year, owing (i) to the transfer
of the Cooperative Bank’s sizeable
NPL portfolio (about €3.1 billion) from
the banking system to a legacy entity
and (ii) to the large volume of NPLs
that are expected to be sold by one of
the most important Cypriot banks
(about €2.7 billion)
- In 2017, the Central Bank of Cyprus designated
six credit institutions and four investment firms as
O-SIIs, imposing capital buffers (to be phased in
over the period 2019-22) ranging from 0.5% to
2%.
- The Central Bank of Cyprus also introduced
borrower-based measures in 2013, which were
streamlined in March 2016. Those measures
capped the total debt servicing amount at 80% of
the borrower's net disposable income (65% for
foreign currency loans) and capped the LTV ratio
(first introduced in 2003) at 80% of financing for

RESTRICTED
31
Overview of risk reducing measures adopted at national level
(i) legal/judicial, tax or other reforms (ii) prudential supervisory actions (iii) NPL management initiatives (iv) macro-prudential measures
strengthen the regulatory framework for
insolvency practitioners is ongoing,
although progress is slow.
- A government-supported subsidy
scheme (ESTIA) has been established
with the aim of providing a 33% debt
reduction for eligible borrowers with NPLs
that are backed by primary residences.
- The sale by another bank of an NPL
portfolio with a value of €140 million to
a distressed investment fund was also
a positive development.
primary residences and 70% for all property
financing.
- Following the acquisition of the Cooperative
Bank by another Cypriot bank, the authorities
have launched a review of its O-SII buffer with a
view to potentially increasing its size. The
countercyclical capital buffer requirement has
been kept at 0%.
- The temporary macroprudential rules on liquidity
requirements (the most important impact of which
is the higher outflow rates applicable to covered
deposits), which were introduced in January 2018,
are easily being met by all local banks owing to
excess liquidity.
LV - The government has strengthened the
supervision of insolvency administrators.
The Insolvency Policy Development
Guidelines for 2016 to 2020 contain
specific measures to improve the
insolvency framework and the regulation of
insolvency administrators. They aim to
increase the number of restructurings and
the insolvency recovery rate, and to
strengthen trust in the profession. With
regard to the latter, the profession's
regulatory framework has been
overhauled, with closer oversight, stricter
conflict of interest provisions and harsher
None - NPLs, which peaked after 2009, have
been partially resolved and partially
written-off, with substantial support
from Scandinavian parent banks.
None

RESTRICTED
32
Overview of risk reducing measures adopted at national level
(i) legal/judicial, tax or other reforms (ii) prudential supervisory actions (iii) NPL management initiatives (iv) macro-prudential measures
penalties for misconduct. The court system
has also been reformed by reducing the
number of courts; this should improve the
overall quality of decisions and improve
the functioning of random case allocation
to judges.
LT None - A reform of credit unions – small
financial cooperatives serving local
people in rural areas – is under way.
Many smaller credit unions were facing
financial difficulties, which prompted the
Lithuanian central bank to launch a
programme restructuring and
consolidating the sector. In January
2018, two central credit unions took over
the management of 20 and 14 small
institutions respectively, thus improving
the sector’s viability. The remaining
seven credit unions will become banks
by 2023.
- NPLs, which peaked after 2009, have
been partially resolved and partially
written-off, with substantial support
from Scandinavian parent banks.
None
LU None None None - Parliament is currently debating thresholds for
LTV, LTI, DTI and DSTI ratios, as well as
mortgage maturity limits.
RESTRICTED
33
Overview of risk reducing measures adopted at national level
(i) legal/judicial, tax or other reforms (ii) prudential supervisory actions (iii) NPL management initiatives (iv) macro-prudential measures
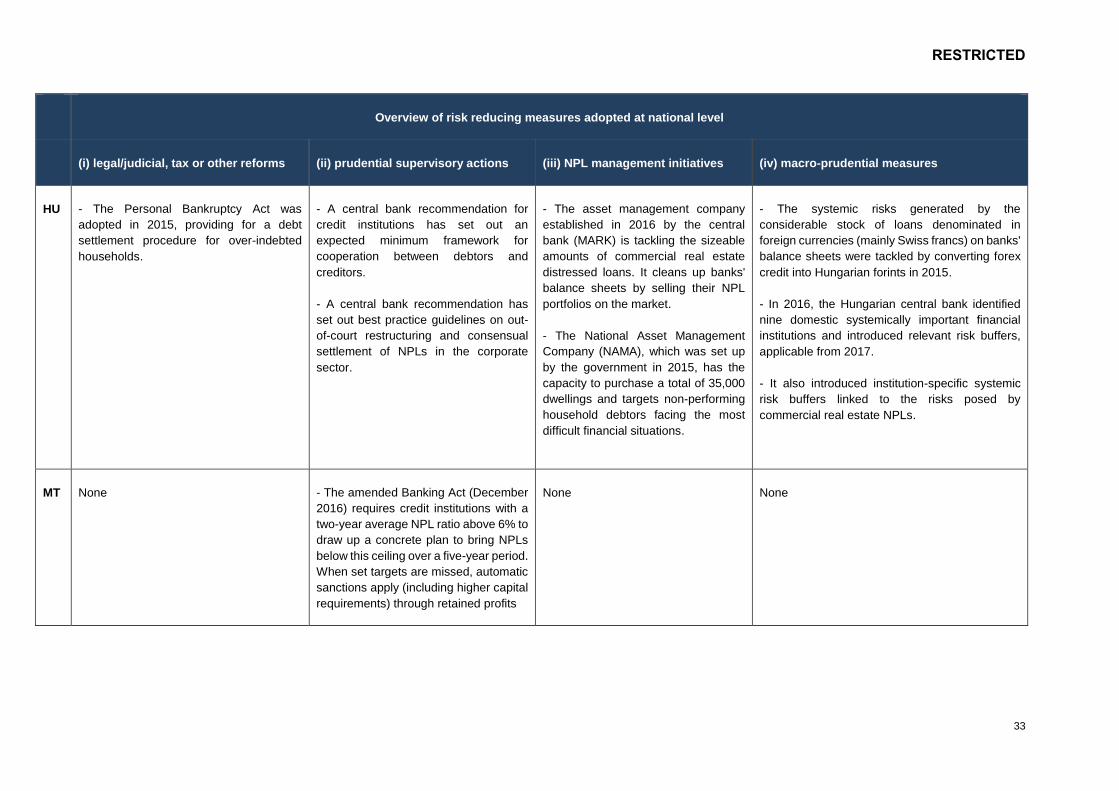
HU
- The Personal Bankruptcy Act was
adopted in 2015, providing for a debt
settlement procedure for over-indebted
households.
- A central bank recommendation for
credit institutions has set out an
expected minimum framework for
cooperation between debtors and
creditors.
- A central bank recommendation has
set out best practice guidelines on out-
of-court restructuring and consensual
settlement of NPLs in the corporate
sector.
- The asset management company
established in 2016 by the central
bank (MARK) is tackling the sizeable
amounts of commercial real estate
distressed loans. It cleans up banks'
balance sheets by selling their NPL
portfolios on the market.
- The National Asset Management
Company (NAMA), which was set up
by the government in 2015, has the
capacity to purchase a total of 35,000
dwellings and targets non-performing
household debtors facing the most
difficult financial situations.
- The systemic risks generated by the
considerable stock of loans denominated in
foreign currencies (mainly Swiss francs) on banks'
balance sheets were tackled by converting forex
credit into Hungarian forints in 2015.
- In 2016, the Hungarian central bank identified
nine domestic systemically important financial
institutions and introduced relevant risk buffers,
applicable from 2017.
- It also introduced institution-specific systemic
risk buffers linked to the risks posed by
commercial real estate NPLs.
MT None - The amended Banking Act (December
2016) requires credit institutions with a
two-year average NPL ratio above 6% to
draw up a concrete plan to bring NPLs
below this ceiling over a five-year period.
When set targets are missed, automatic
sanctions apply (including higher capital
requirements) through retained profits
None None

RESTRICTED
34
Overview of risk reducing measures adopted at national level
(i) legal/judicial, tax or other reforms (ii) prudential supervisory actions (iii) NPL management initiatives (iv) macro-prudential measures
NL - The tax deductibility of mortgage interest
(MID) is gradually being reduced. It now
stands at 50% and will be cut by 0.5 pp per
year until 2020. From 2020, it will be
reduced by 3 pp per year to reach a floor
of 37% in 2023. MID is not available for
interest-only mortgages
None None - The LTV ratio for new mortgages has been
gradually lowered and reached 100% in 2018. It
will not be reduced further after 2018.
- A cap on LTI ratios for mortgage loans was also
introduced in 2013.
- LTI rules are based on the residual purchasing
capacity of a household, making the maximum
loan value equal to about 400% of yearly gross
income, excluding MID.
AT None
None
- Prudential standards for risk
management and granting of foreign
currency adopted since 2008 by
banking supervisors (Austrian central
bank and Financial Market Authority)
to curb foreign exchange lending to
unhedged borrowers
- In September 2018, the Austrian Financial
Market Stability Board (FMSG) issued a
communication and quantitative guidance on
sustainable real estate lending. The Board made
the following recommendations: (i) the down
payment by borrowers for real estate loans should
not fall below a benchmark of 20%; (ii) newly
originated mortgage loans should exceed 35
years only in exceptional cases; (iii) debt service
should not exceed 30% to 40% of the net income
of borrowers; and (iv) assessments of the
creditworthiness of borrowers should be
comprehensive and take account of all available
information.
PL None None None - A risk weight of 150% is applied to exposures
secured by residential property where the
RESTRICTED
35
Overview of risk reducing measures adopted at national level
(i) legal/judicial, tax or other reforms (ii) prudential supervisory actions (iii) NPL management initiatives (iv) macro-prudential measures
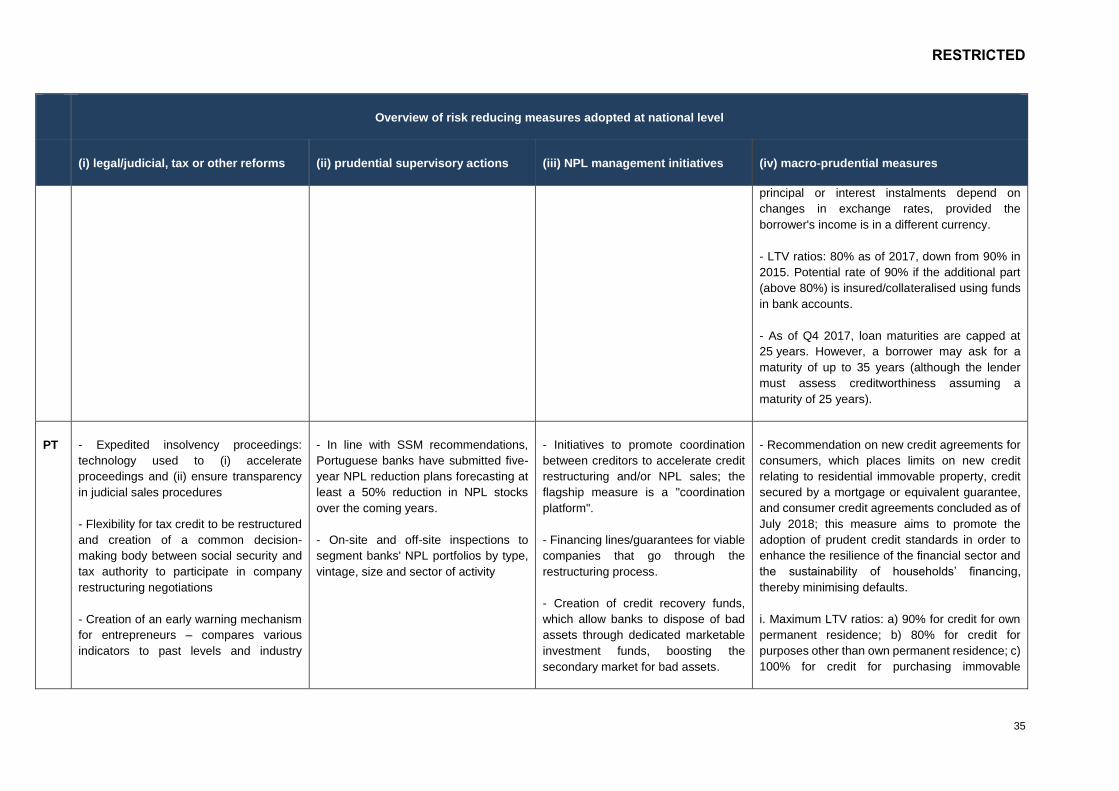
principal or interest instalments depend on
changes in exchange rates, provided the
borrower's income is in a different currency.
- LTV ratios: 80% as of 2017, down from 90% in
2015. Potential rate of 90% if the additional part
(above 80%) is insured/collateralised using funds
in bank accounts.
- As of Q4 2017, loan maturities are capped at
25 years. However, a borrower may ask for a
maturity of up to 35 years (although the lender
must assess creditworthiness assuming a
maturity of 25 years).
PT - Expedited insolvency proceedings:
technology used to (i) accelerate
proceedings and (ii) ensure transparency
in judicial sales procedures
- Flexibility for tax credit to be restructured
and creation of a common decision-
making body between social security and
tax authority to participate in company
restructuring negotiations
- Creation of an early warning mechanism
for entrepreneurs – compares various
indicators to past levels and industry
- In line with SSM recommendations,
Portuguese banks have submitted five-
year NPL reduction plans forecasting at
least a 50% reduction in NPL stocks
over the coming years.
- On-site and off-site inspections to
segment banks' NPL portfolios by type,
vintage, size and sector of activity
- Initiatives to promote coordination
between creditors to accelerate credit
restructuring and/or NPL sales; the
flagship measure is a "coordination
platform".
- Financing lines/guarantees for viable
companies that go through the
restructuring process.
- Creation of credit recovery funds,
which allow banks to dispose of bad
assets through dedicated marketable
investment funds, boosting the
secondary market for bad assets.
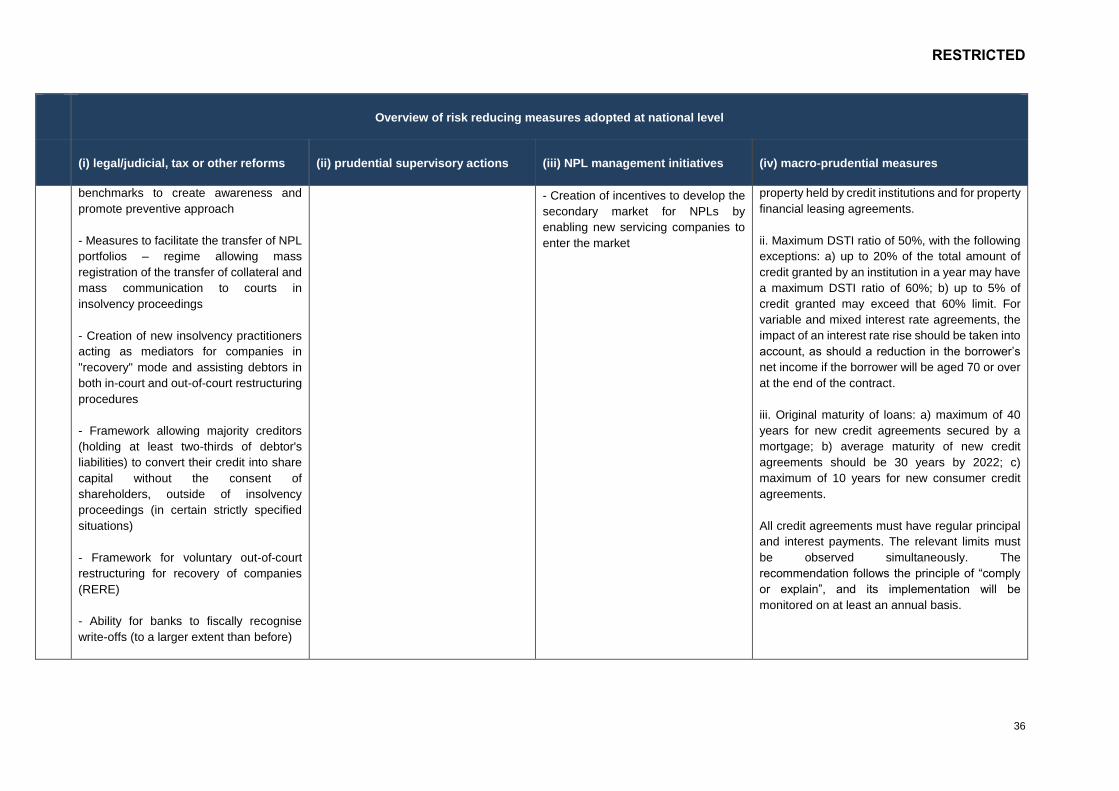
- Recommendation on new credit agreements for
consumers, which places limits on new credit
relating to residential immovable property, credit
secured by a mortgage or equivalent guarantee,
and consumer credit agreements concluded as of
July 2018; this measure aims to promote the
adoption of prudent credit standards in order to
enhance the resilience of the financial sector and
the sustainability of households’ financing,
thereby minimising defaults.
i. Maximum LTV ratios: a) 90% for credit for own
permanent residence; b) 80% for credit for
purposes other than own permanent residence; c)
100% for credit for purchasing immovable
RESTRICTED
36
Overview of risk reducing measures adopted at national level
(i) legal/judicial, tax or other reforms (ii) prudential supervisory actions (iii) NPL management initiatives (iv) macro-prudential measures
benchmarks to create awareness and
promote preventive approach
- Measures to facilitate the transfer of NPL
portfolios – regime allowing mass
registration of the transfer of collateral and
mass communication to courts in
insolvency proceedings
- Creation of new insolvency practitioners
acting as mediators for companies in
"recovery" mode and assisting debtors in
both in-court and out-of-court restructuring
procedures
- Framework allowing majority creditors
(holding at least two-thirds of debtor's
liabilities) to convert their credit into share
capital without the consent of
shareholders, outside of insolvency
proceedings (in certain strictly specified
situations)
- Framework for voluntary out-of-court
restructuring for recovery of companies
(RERE)
- Ability for banks to fiscally recognise
write-offs (to a larger extent than before)
- Creation of incentives to develop the
secondary market for NPLs by
enabling new servicing companies to
enter the market
property held by credit institutions and for property
financial leasing agreements.
ii. Maximum DSTI ratio of 50%, with the following
exceptions: a) up to 20% of the total amount of
credit granted by an institution in a year may have
a maximum DSTI ratio of 60%; b) up to 5% of
credit granted may exceed that 60% limit. For
variable and mixed interest rate agreements, the
impact of an interest rate rise should be taken into
account, as should a reduction in the borrower’s
net income if the borrower will be aged 70 or over
at the end of the contract.
iii. Original maturity of loans: a) maximum of 40
years for new credit agreements secured by a
mortgage; b) average maturity of new credit
agreements should be 30 years by 2022; c)
maximum of 10 years for new consumer credit
agreements.
All credit agreements must have regular principal
and interest payments. The relevant limits must
be observed simultaneously. The
recommendation follows the principle of “comply
or explain”, and its implementation will be
monitored on at least an annual basis.

RESTRICTED
37
Overview of risk reducing measures adopted at national level
(i) legal/judicial, tax or other reforms (ii) prudential supervisory actions (iii) NPL management initiatives (iv) macro-prudential measures
RO None
- Measures and recommendations
adopted by the banking supervisor (the
central bank) since 2013 to clean up
bank balance sheets:
- Removal of uncollectable NPLs fully covered by provisions
- Full coverage with provisions for all NPLs for which repayment of principal and/or interest is overdue by more than 360 days and no legal action has been taken against borrowers
- Up to 90% of NPLs covered with provisions for exposures to insolvent borrowers
- Enhanced collateral valuations – several valuations since 2013
- Recommendation (adopted in 2016)
calls for full coverage with provisions for
unsecured NPLs where repayment of
principal and/or interest is overdue by
more than 180 days, followed by
removal of exposure from balance sheet
- Measures adopted by banks to
improve their arrears management
capacity and recovery of collateral
- In October 2018, the Romanian central bank
adopted measures aimed at limiting household
indebtedness. Under those new provisions, the
maximum level of indebtedness is 40% of net
income for RON-denominated loans and 20% for
foreign currency loans. The maximum level of
indebtedness can be raised by 5ppfor first-time
homebuyer loans for borrower-occupied
dwellings. The total level of indebtedness is
measured as the ratio of monthly debt service to
monthly net income.
RESTRICTED
38
Overview of risk reducing measures adopted at national level
(i) legal/judicial, tax or other reforms (ii) prudential supervisory actions (iii) NPL management initiatives (iv) macro-prudential measures
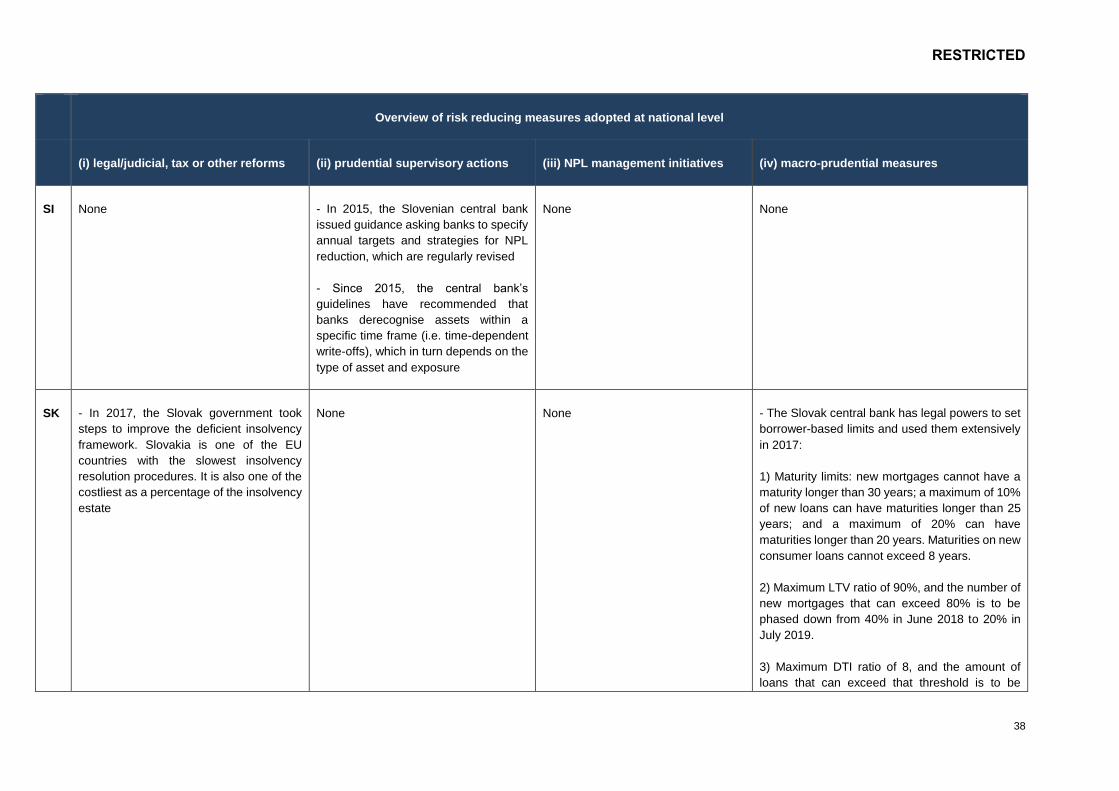
SI None - In 2015, the Slovenian central bank
issued guidance asking banks to specify
annual targets and strategies for NPL
reduction, which are regularly revised
- Since 2015, the central bank’s
guidelines have recommended that
banks derecognise assets within a
specific time frame (i.e. time-dependent
write-offs), which in turn depends on the
type of asset and exposure
None None
SK - In 2017, the Slovak government took
steps to improve the deficient insolvency
framework. Slovakia is one of the EU
countries with the slowest insolvency
resolution procedures. It is also one of the
costliest as a percentage of the insolvency
estate
None None - The Slovak central bank has legal powers to set
borrower-based limits and used them extensively
in 2017:
1) Maturity limits: new mortgages cannot have a
maturity longer than 30 years; a maximum of 10%
of new loans can have maturities longer than 25
years; and a maximum of 20% can have
maturities longer than 20 years. Maturities on new
consumer loans cannot exceed 8 years.
2) Maximum LTV ratio of 90%, and the number of
new mortgages that can exceed 80% is to be
phased down from 40% in June 2018 to 20% in
July 2019.
3) Maximum DTI ratio of 8, and the amount of
loans that can exceed that threshold is to be
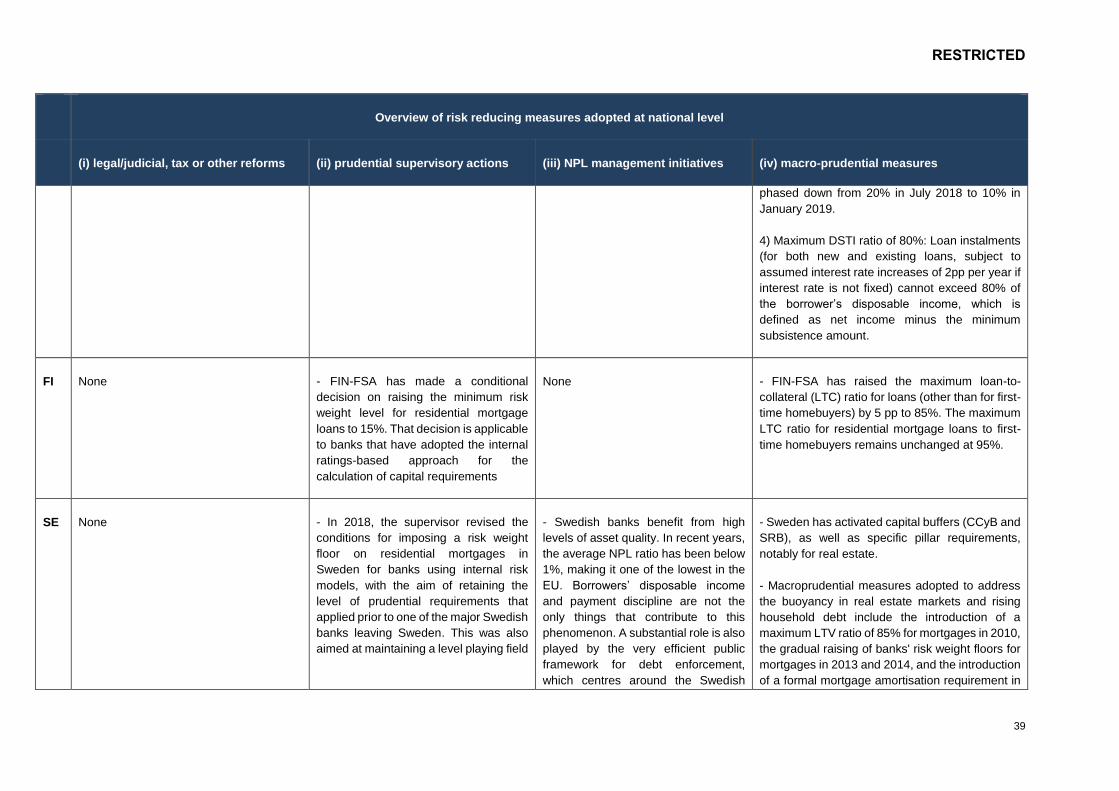
RESTRICTED
39
Overview of risk reducing measures adopted at national level
(i) legal/judicial, tax or other reforms (ii) prudential supervisory actions (iii) NPL management initiatives (iv) macro-prudential measures
phased down from 20% in July 2018 to 10% in
January 2019.
4) Maximum DSTI ratio of 80%: Loan instalments
(for both new and existing loans, subject to
assumed interest rate increases of 2pp per year if
interest rate is not fixed) cannot exceed 80% of
the borrower’s disposable income, which is
defined as net income minus the minimum
subsistence amount.
FI None - FIN-FSA has made a conditional
decision on raising the minimum risk
weight level for residential mortgage
loans to 15%. That decision is applicable
to banks that have adopted the internal
ratings-based approach for the
calculation of capital requirements
None - FIN-FSA has raised the maximum loan-to-
collateral (LTC) ratio for loans (other than for first-
time homebuyers) by 5 pp to 85%. The maximum
LTC ratio for residential mortgage loans to first-
time homebuyers remains unchanged at 95%.
SE None - In 2018, the supervisor revised the
conditions for imposing a risk weight
floor on residential mortgages in
Sweden for banks using internal risk
models, with the aim of retaining the
level of prudential requirements that
applied prior to one of the major Swedish
banks leaving Sweden. This was also
aimed at maintaining a level playing field
- Swedish banks benefit from high
levels of asset quality. In recent years,
the average NPL ratio has been below
1%, making it one of the lowest in the
EU. Borrowers’ disposable income
and payment discipline are not the
only things that contribute to this
phenomenon. A substantial role is also
played by the very efficient public
framework for debt enforcement,
which centres around the Swedish
- Sweden has activated capital buffers (CCyB and
SRB), as well as specific pillar requirements,
notably for real estate.
- Macroprudential measures adopted to address
the buoyancy in real estate markets and rising
household debt include the introduction of a
maximum LTV ratio of 85% for mortgages in 2010,
the gradual raising of banks' risk weight floors for
mortgages in 2013 and 2014, and the introduction
of a formal mortgage amortisation requirement in
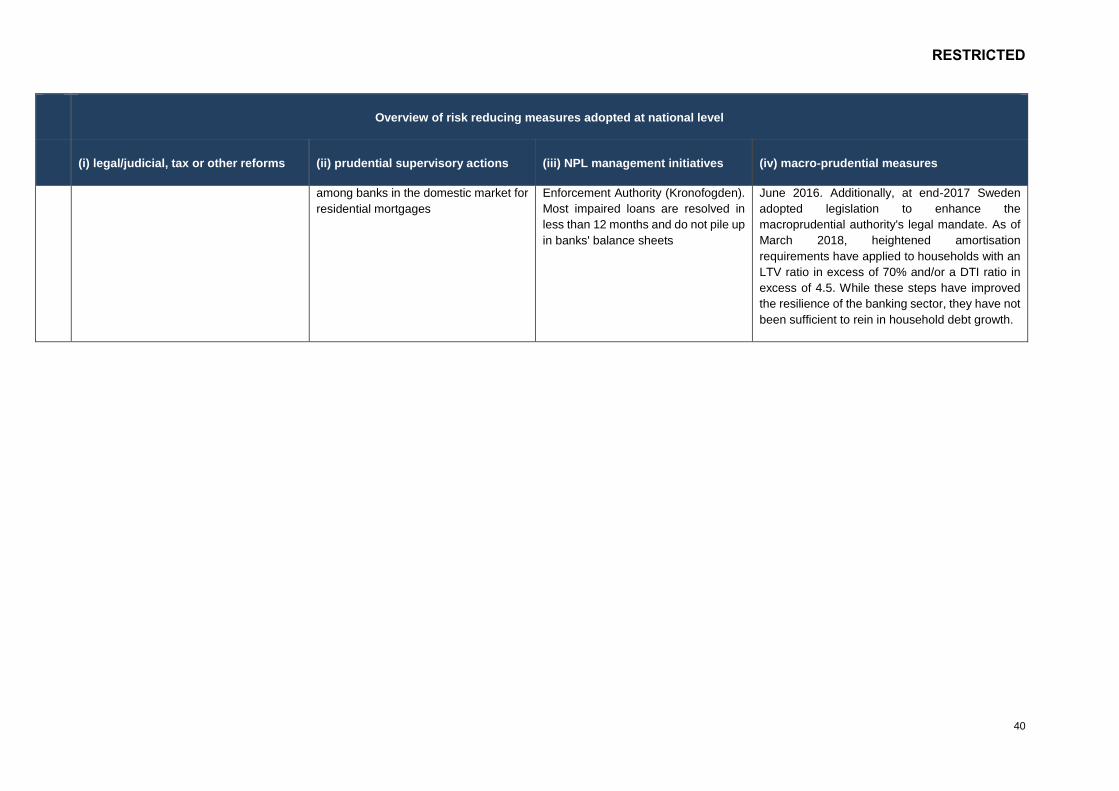
RESTRICTED
40
Overview of risk reducing measures adopted at national level
(i) legal/judicial, tax or other reforms (ii) prudential supervisory actions (iii) NPL management initiatives (iv) macro-prudential measures
among banks in the domestic market for
residential mortgages
Enforcement Authority (Kronofogden).
Most impaired loans are resolved in
less than 12 months and do not pile up
in banks' balance sheets
June 2016. Additionally, at end-2017 Sweden
adopted legislation to enhance the
macroprudential authority's legal mandate. As of
March 2018, heightened amortisation
requirements have applied to households with an
LTV ratio in excess of 70% and/or a DTI ratio in
excess of 4.5. While these steps have improved
the resilience of the banking sector, they have not
been sufficient to rein in household debt growth.
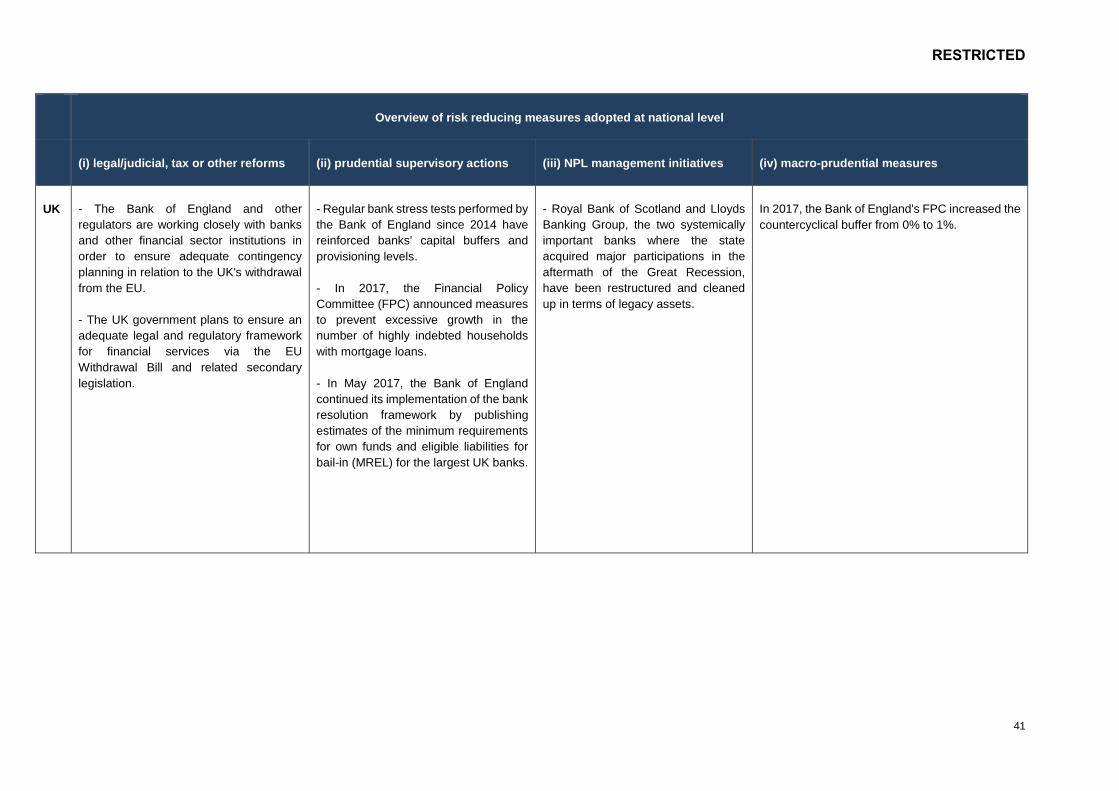
RESTRICTED
41
Overview of risk reducing measures adopted at national level
(i) legal/judicial, tax or other reforms (ii) prudential supervisory actions (iii) NPL management initiatives (iv) macro-prudential measures
UK - The Bank of England and other
regulators are working closely with banks
and other financial sector institutions in
order to ensure adequate contingency
planning in relation to the UK's withdrawal
from the EU.
- The UK government plans to ensure an
adequate legal and regulatory framework
for financial services via the EU
Withdrawal Bill and related secondary
legislation.
- Regular bank stress tests performed by
the Bank of England since 2014 have
reinforced banks' capital buffers and
provisioning levels.
- In 2017, the Financial Policy
Committee (FPC) announced measures
to prevent excessive growth in the
number of highly indebted households
with mortgage loans.
- In May 2017, the Bank of England
continued its implementation of the bank
resolution framework by publishing
estimates of the minimum requirements
for own funds and eligible liabilities for
bail-in (MREL) for the largest UK banks.
- Royal Bank of Scotland and Lloyds
Banking Group, the two systemically
important banks where the state
acquired major participations in the
aftermath of the Great Recession,
have been restructured and cleaned
up in terms of legacy assets.
In 2017, the Bank of England's FPC increased the
countercyclical buffer from 0% to 1%.
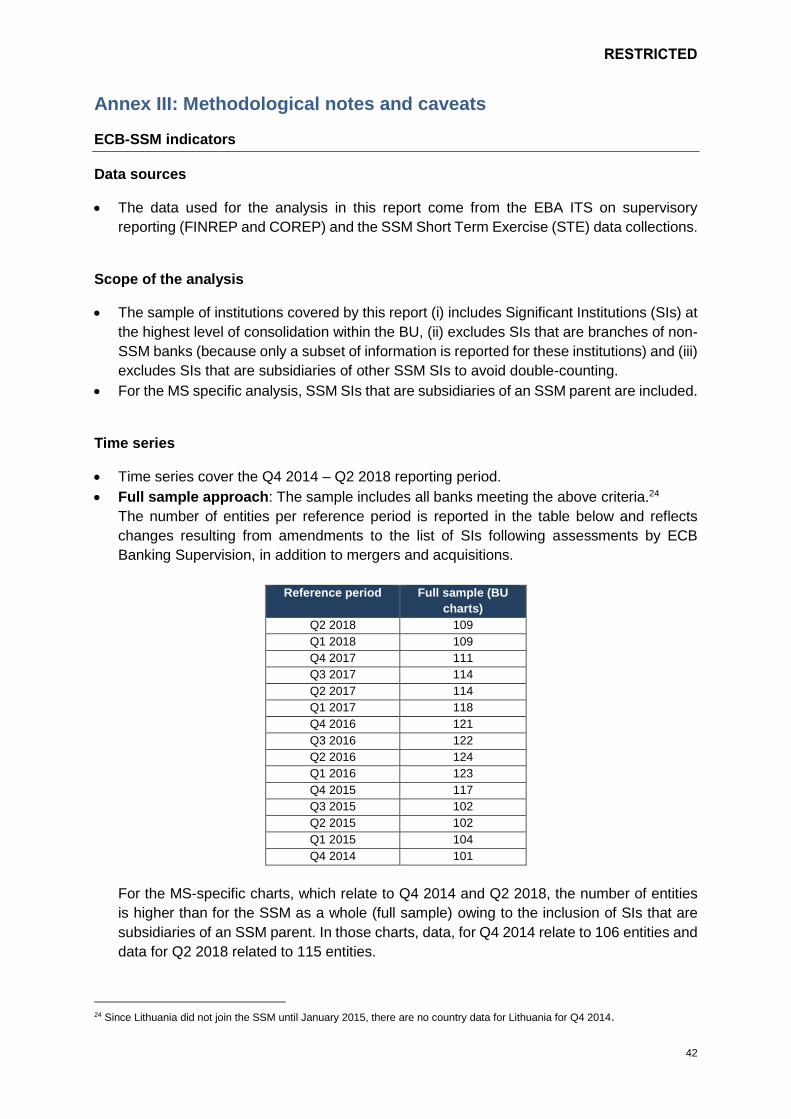
RESTRICTED
42
Annex III: Methodological notes and caveats
ECB-SSM indicators
Data sources
• The data used for the analysis in this report come from the EBA ITS on supervisory
reporting (FINREP and COREP) and the SSM Short Term Exercise (STE) data collections.
Scope of the analysis
• The sample of institutions covered by this report (i) includes Significant Institutions (SIs) at
the highest level of consolidation within the BU, (ii) excludes SIs that are branches of non-
SSM banks (because only a subset of information is reported for these institutions) and (iii)
excludes SIs that are subsidiaries of other SSM SIs to avoid double-counting.
• For the MS specific analysis, SSM SIs that are subsidiaries of an SSM parent are included.
Time series
• Time series cover the Q4 2014 – Q2 2018 reporting period.
• Full sample approach: The sample includes all banks meeting the above criteria.24
The number of entities per reference period is reported in the table below and reflects
changes resulting from amendments to the list of SIs following assessments by ECB
Banking Supervision, in addition to mergers and acquisitions.
Reference period Full sample (BU
charts)
Q2 2018 109
Q1 2018 109
Q4 2017 111
Q3 2017 114
Q2 2017 114
Q1 2017 118
Q4 2016 121
Q3 2016 122
Q2 2016 124
Q1 2016 123
Q4 2015 117
Q3 2015 102
Q2 2015 102
Q1 2015 104
Q4 2014 101
For the MS-specific charts, which relate to Q4 2014 and Q2 2018, the number of entities
is higher than for the SSM as a whole (full sample) owing to the inclusion of SIs that are
subsidiaries of an SSM parent. In those charts, data, for Q4 2014 relate to 106 entities and
data for Q2 2018 related to 115 entities.
24 Since Lithuania did not join the SSM until January 2015, there are no country data for Lithuania for Q4 2014.
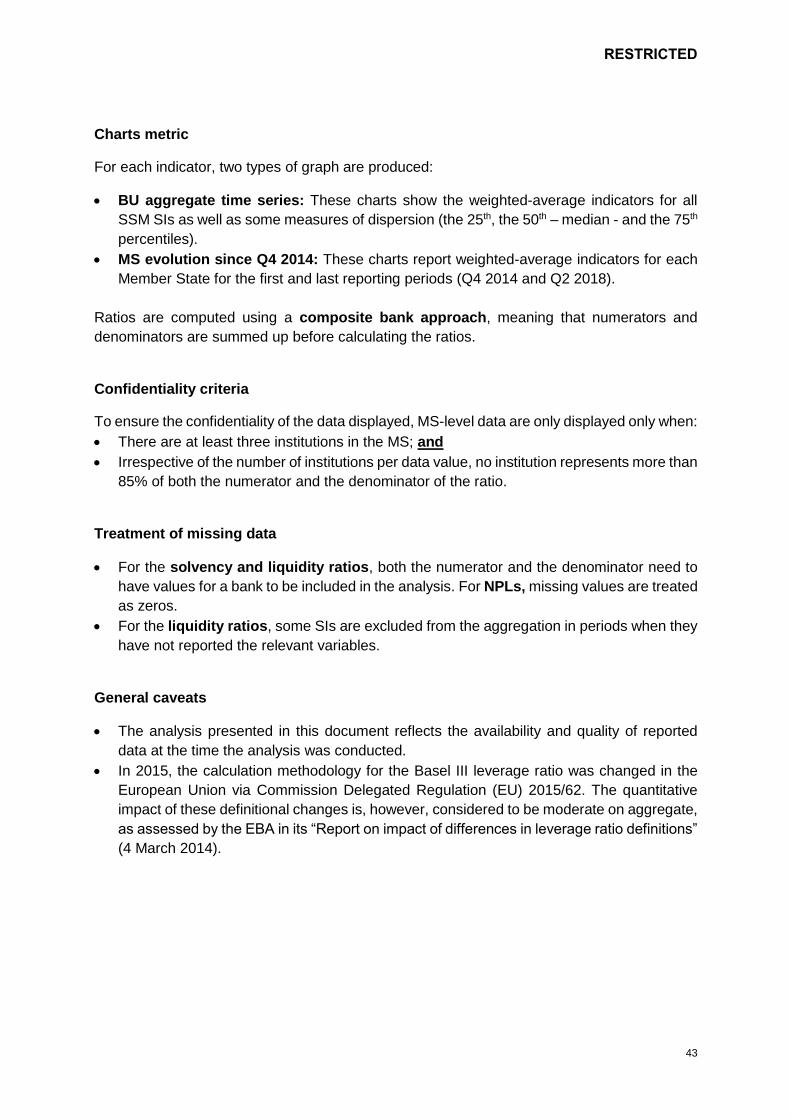
RESTRICTED
43
Charts metric
For each indicator, two types of graph are produced:
• BU aggregate time series: These charts show the weighted-average indicators for all
SSM SIs as well as some measures of dispersion (the 25th, the 50th – median - and the 75th
percentiles).
• MS evolution since Q4 2014: These charts report weighted-average indicators for each
Member State for the first and last reporting periods (Q4 2014 and Q2 2018).
Ratios are computed using a composite bank approach, meaning that numerators and
denominators are summed up before calculating the ratios.
Confidentiality criteria
To ensure the confidentiality of the data displayed, MS-level data are only displayed only when:
• There are at least three institutions in the MS; and
• Irrespective of the number of institutions per data value, no institution represents more than
85% of both the numerator and the denominator of the ratio.
Treatment of missing data
• For the solvency and liquidity ratios, both the numerator and the denominator need to
have values for a bank to be included in the analysis. For NPLs, missing values are treated
as zeros.
• For the liquidity ratios, some SIs are excluded from the aggregation in periods when they
have not reported the relevant variables.
General caveats
• The analysis presented in this document reflects the availability and quality of reported
data at the time the analysis was conducted.
• In 2015, the calculation methodology for the Basel III leverage ratio was changed in the
European Union via Commission Delegated Regulation (EU) 2015/62. The quantitative
impact of these definitional changes is, however, considered to be moderate on aggregate,
as assessed by the EBA in its “Report on impact of differences in leverage ratio definitions”
(4 March 2014).
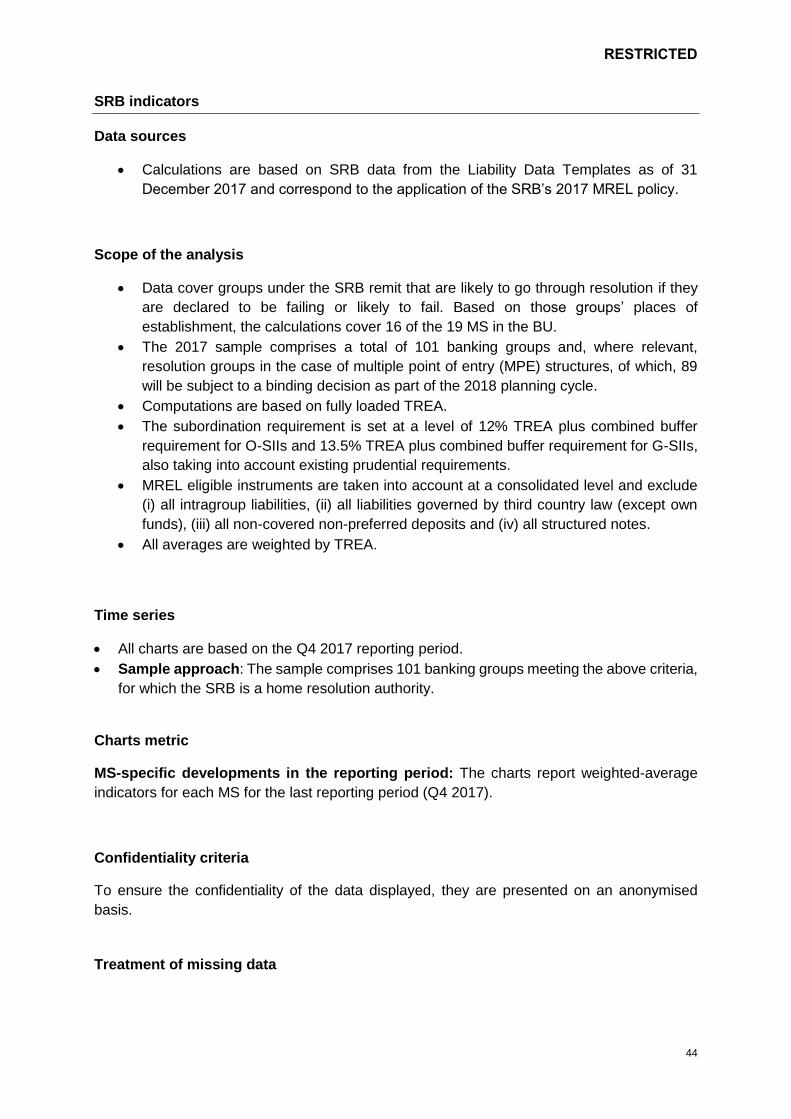
RESTRICTED
44
SRB indicators
Data sources
• Calculations are based on SRB data from the Liability Data Templates as of 31
December 2017 and correspond to the application of the SRB’s 2017 MREL policy.
Scope of the analysis
• Data cover groups under the SRB remit that are likely to go through resolution if they
are declared to be failing or likely to fail. Based on those groups’ places of
establishment, the calculations cover 16 of the 19 MS in the BU.
• The 2017 sample comprises a total of 101 banking groups and, where relevant,
resolution groups in the case of multiple point of entry (MPE) structures, of which, 89
will be subject to a binding decision as part of the 2018 planning cycle.
• Computations are based on fully loaded TREA.
• The subordination requirement is set at a level of 12% TREA plus combined buffer
requirement for O-SIIs and 13.5% TREA plus combined buffer requirement for G-SIIs,
also taking into account existing prudential requirements.
• MREL eligible instruments are taken into account at a consolidated level and exclude
(i) all intragroup liabilities, (ii) all liabilities governed by third country law (except own
funds), (iii) all non-covered non-preferred deposits and (iv) all structured notes.
• All averages are weighted by TREA.
Time series
• All charts are based on the Q4 2017 reporting period.
• Sample approach: The sample comprises 101 banking groups meeting the above criteria,
for which the SRB is a home resolution authority.
Charts metric
MS-specific developments in the reporting period: The charts report weighted-average
indicators for each MS for the last reporting period (Q4 2017).
Confidentiality criteria
To ensure the confidentiality of the data displayed, they are presented on an anonymised
basis.
Treatment of missing data

RESTRICTED
45
• Consolidated MREL related data have been provided by the SRB for 16 of 19 MS in the
BU. For banks in two of the three missing MS, the SRB is a host resolution authority, so it
does not hold group-level consolidated MREL data. For the third MS, data were not
reported by the reporting date since analysis relating to the resolution strategy was still
ongoing.
General caveats
• Not all figures necessarily correspond to a formal MREL decision.
• No bank-specific adjustments are included in the calculations.
• In contrast with other indicators in this report, MREL-related data are presented at
consolidated level only with no allocation of values to host MS where subsidiaries are
located, as this begins to stray into the territory of internal MREL, which is work in progress.
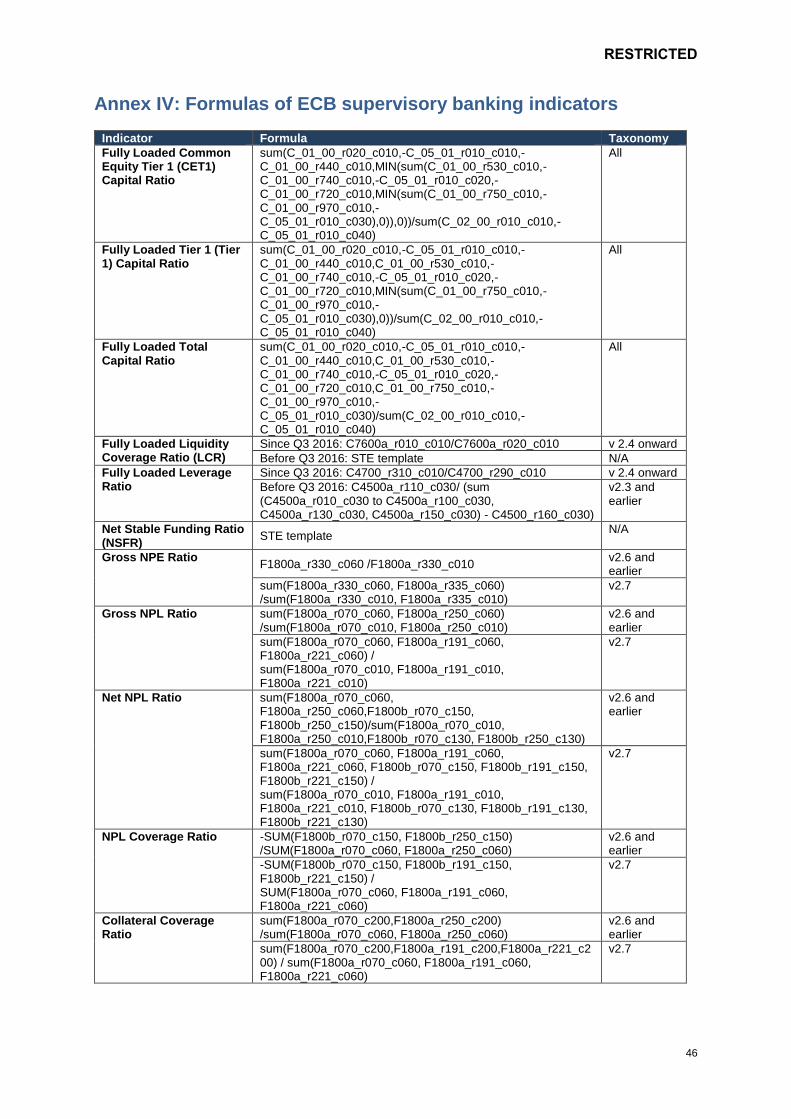
RESTRICTED
46
Annex IV: Formulas of ECB supervisory banking indicators
Indicator Formula Taxonomy
Fully Loaded Common Equity Tier 1 (CET1) Capital Ratio
sum(C_01_00_r020_c010,-C_05_01_r010_c010,-C_01_00_r440_c010,MIN(sum(C_01_00_r530_c010,-C_01_00_r740_c010,-C_05_01_r010_c020,-C_01_00_r720_c010,MIN(sum(C_01_00_r750_c010,-C_01_00_r970_c010,-C_05_01_r010_c030),0)),0))/sum(C_02_00_r010_c010,-C_05_01_r010_c040)
All
Fully Loaded Tier 1 (Tier 1) Capital Ratio
sum(C_01_00_r020_c010,-C_05_01_r010_c010,-C_01_00_r440_c010,C_01_00_r530_c010,-C_01_00_r740_c010,-C_05_01_r010_c020,-C_01_00_r720_c010,MIN(sum(C_01_00_r750_c010,-C_01_00_r970_c010,-C_05_01_r010_c030),0))/sum(C_02_00_r010_c010,-C_05_01_r010_c040)
All
Fully Loaded Total Capital Ratio
sum(C_01_00_r020_c010,-C_05_01_r010_c010,-C_01_00_r440_c010,C_01_00_r530_c010,-C_01_00_r740_c010,-C_05_01_r010_c020,-C_01_00_r720_c010,C_01_00_r750_c010,-C_01_00_r970_c010,-C_05_01_r010_c030)/sum(C_02_00_r010_c010,-C_05_01_r010_c040)
All
Fully Loaded Liquidity Coverage Ratio (LCR)
Since Q3 2016: C7600a_r010_c010/C7600a_r020_c010 v 2.4 onward
Before Q3 2016: STE template N/A
Fully Loaded Leverage Ratio
Since Q3 2016: C4700_r310_c010/C4700_r290_c010 v 2.4 onward
Before Q3 2016: C4500a_r110_c030/ (sum (C4500a_r010_c030 to C4500a_r100_c030, C4500a_r130_c030, C4500a_r150_c030) - C4500_r160_c030)
v2.3 and earlier
Net Stable Funding Ratio (NSFR)
STE template N/A
Gross NPE Ratio F1800a_r330_c060 /F1800a_r330_c010
v2.6 and earlier
sum(F1800a_r330_c060, F1800a_r335_c060) /sum(F1800a_r330_c010, F1800a_r335_c010)
v2.7
Gross NPL Ratio sum(F1800a_r070_c060, F1800a_r250_c060) /sum(F1800a_r070_c010, F1800a_r250_c010)
v2.6 and earlier
sum(F1800a_r070_c060, F1800a_r191_c060, F1800a_r221_c060) / sum(F1800a_r070_c010, F1800a_r191_c010, F1800a_r221_c010)
v2.7
Net NPL Ratio sum(F1800a_r070_c060, F1800a_r250_c060,F1800b_r070_c150, F1800b_r250_c150)/sum(F1800a_r070_c010, F1800a_r250_c010,F1800b_r070_c130, F1800b_r250_c130)
v2.6 and earlier
sum(F1800a_r070_c060, F1800a_r191_c060, F1800a_r221_c060, F1800b_r070_c150, F1800b_r191_c150, F1800b_r221_c150) / sum(F1800a_r070_c010, F1800a_r191_c010, F1800a_r221_c010, F1800b_r070_c130, F1800b_r191_c130, F1800b_r221_c130)
v2.7
NPL Coverage Ratio -SUM(F1800b_r070_c150, F1800b_r250_c150) /SUM(F1800a_r070_c060, F1800a_r250_c060)
v2.6 and earlier
-SUM(F1800b_r070_c150, F1800b_r191_c150, F1800b_r221_c150) / SUM(F1800a_r070_c060, F1800a_r191_c060, F1800a_r221_c060)
v2.7
Collateral Coverage Ratio
sum(F1800a_r070_c200,F1800a_r250_c200) /sum(F1800a_r070_c060, F1800a_r250_c060)
v2.6 and earlier
sum(F1800a_r070_c200,F1800a_r191_c200,F1800a_r221_c200) / sum(F1800a_r070_c060, F1800a_r191_c060, F1800a_r221_c060)
v2.7