Embed Size (px)
Citation preview
November 2017
November 2017
Macroprudential Surveillance Department
Monetary Authority of Singapore
ISSN 1793-3463 Published in November 2017 Macroprudential Surveillance Department Monetary Authority of Singapore http://www.mas.gov.sg All rights reserved. No part of this publication may be reproduced, stored in a retrieval system or transmitted in any form or by any means, electronic, mechanised, photocopying, recording or otherwise, without the prior written permission of the copyright owner except in accordance with the provisions of the Copyright Act (Cap. 63). Applications for the copyright owner’s written permission to reproduce any part of this publication should be addressed to: Macroprudential Surveillance Department Monetary Authority of Singapore 10 Shenton Way MAS Building Singapore 079117
Financial Stability Review, November 2017
Monetary Authority of Singapore Macroprudential Surveillance Department
PREFACE i
OVERVIEW ii
1 GLOBAL ENVIRONMENT
Risks in the External Environment 1
Box A: Drivers of Corporate Leverage in Asia 5
Box B: Trends in Global Household Indebtedness and Drivers of Household Leverage
9
Box C: Financial Stress Indices of Selected Asian Economies 15
Box D: Drivers of Gross Capital Inflows to Asia after the Global Financial Crisis
22
Box E: The Behaviour of Institutional Asset Owners in Asia-10 Financial Markets: Pro-cyclical or Counter-cyclical?
27
Box F: Financial Technology and Financial Stability — What’s the Deal? 32
Box G: As the Twain Meet: Analysing the Impact of Financial Technology on Asian Banks’ Payments, Deposit and Lending Businesses
36
2 SINGAPORE FINANCIAL SECTOR
Risks in the Banking Sector 44
Chart Panel 2A: Credit Growth Trends 48
Chart Panel 2B: Cross-border Lending Trends 49
Chart Panel 2C: Asset Quality and Liquidity Indicators 50
Chart Panel 2D: Local Banking Groups 51
Chart Panel 2E: Insurance Sector 52
Box H: Impact of US Dollar Funding Costs on Foreign Banks’ Cross-border Lending to Emerging Asia
53
Box I: Industry-Wide Stress Test 2017: Enhancing the Stress Test Toolkit 60
Box J: Do Trust Companies in Singapore Pose Shadow Banking Risks? 65
Box K: Over-the-Counter Derivatives Transaction Data: Paving the Road to Market Transparency
68
Box L: Singapore’s US Dollar Foreign Exchange Swap Market Structure and Resilience
69
Box M: Evaluating the Effects of Post-Crisis Regulatory Reforms 76
3 SINGAPORE CORPORATE SECTOR
Risks in the Corporate Sector 80
Chart Panel 3A: Small and Medium-Sized Enterprise Financing Conditions
86
Box N: Better Corporate Governance, Stronger Corporate Fundamentals: The Case for Firms Listed on the Singapore Exchange
87

Financial Stability Review, November 2017
Monetary Authority of Singapore Macroprudential Surveillance Department
4 SINGAPORE HOUSEHOLD SECTOR
Risks in the Household Sector 93
Box O: Credit Cards and Other Unsecured Credit Facilities: Building Household Resilience for the Future
96
Box P: Update on the Private Residential Property Market 100
Financial Stability Review, November 2017
Monetary Authority of Singapore Macroprudential Surveillance Department
Statistical appendix may be accessed from: http://www.mas.gov.sg/regulations-and-financial-stability/financial-stability.aspx Disclaimer: MAS is not liable for any damage or loss of any kind, howsoever caused as a result (direct or indirect) of the use of any information or data contained in this publication, including but not limited to any damage or loss suffered as a result of reliance on the information or data contained in or available in this publication. You are reminded to observe the terms of use of the MAS website, on which this publication is made available.
Financial Stability Review, November 2017
Monetary Authority of Singapore Macroprudential Surveillance Department
Definitions and Conventions As used in this report, the term “country” does not in all cases refer to a territorial entity that is a state as
understood by international law and practice. As used here, the term also covers some territorial entities
that are not states but for which statistical data are maintained on a separate and independent basis.
In this report, the following groupings are used:
“ASEAN” comprises Brunei, Cambodia, Indonesia, Laos, Malaysia, Myanmar, the Philippines,
Singapore, Thailand and Vietnam
“Asia-10” comprises China (CHN), Hong Kong (HK), India (IND), Indonesia (IDN), Korea (KOR),
Malaysia (MYS), the Philippines (PHL), Singapore (SGP), Taiwan (TWN) and Thailand (THA)
“Euro zone” comprises Austria, Belgium, Cyprus, Estonia, Finland, France, Germany, Greece,
Ireland, Italy, Latvia, Lithuania, Luxembourg, Malta, Netherlands, Portugal, Slovakia, Slovenia and
Spain
“European Union” (EU) comprises the euro zone, Bulgaria, Croatia, Czech Republic, Denmark,
Hungary, Poland, Romania, Sweden and the United Kingdom (UK)
“G3” refers to the euro zone and United Kingdom, Japan, and the United States (US)
“G7” refers to Canada, France, Germany, Italy, Japan, the United Kingdom and the United States
“G20” refers to the Group of Twenty comprising Argentina, Australia, Brazil, Canada, China, France,
Germany, India, Indonesia, Italy, Japan, Korea1, Mexico, Russia, Saudi Arabia, South Africa, Turkey,
the United Kingdom, the United States and the European Union
Abbreviations used for financial data are as follows:
Currencies: Chinese Renminbi (RMB), Euro (EUR), Hong Kong Dollar (HKD), Indian Rupee (INR),
Indonesian Rupiah (IDR), Japanese Yen (JPY), Korean Won (KRW), Malaysian Ringgit (MYR),
Philippine Peso (PHP), Singapore Dollar (SGD), Taiwan Dollar (TWD), Thai Baht (THB), Vietnamese
Dong (VND), US Dollar (USD)
Other Abbreviations:
ABS Association of Banks in Singapore
ACRA Accounting and Corporate Regulatory Authority of Singapore
ADB Asian Development Bank
AUM Assets Under Management
BCBS Basel Committee on Banking Supervision
BIS Bank for International Settlements
BoE Bank of England
BoJ Bank of Japan
BPS Basis Points
CAR Capital Adequacy Ratio
CBOE Chicago Board Options Exchange
CBS Credit Bureau Singapore
CCP Central Counterparty
CCR Core Central Region
CCS Credit Counselling Singapore
1 Republic of Korea
Financial Stability Review, November 2017
Monetary Authority of Singapore Macroprudential Surveillance Department
CCyB Countercyclical Capital Buffer
CGFS Committee on the Global Financial System
CGIO Centre for Governance, Institutions and Organisations
D-SIBs Domestic Systemically Important Banks
DBU Domestic Banking Unit
DCP Debt Consolidation Plan
DDRS DTCC Data Repository (Singapore) Pte Ltd
DOS Department of Statistics
DTCC Depository Trust & Clearing Corporation
EBIT Earnings Before Interest and Tax
EBITDA Earnings Before Interest and Tax, Depreciation and Amortisation
ECB European Central Bank
ECF Equity Crowdfunding EIOPA European Insurance and Occupational Pensions Authority
EMEAP Executives’ Meeting of East Asia Pacific Central Banks
EPFR Emerging Portfolio Fund Research
ESG Environmental, Social and Governance
FDI Foreign Direct Investment
FI Financial Institution
FinTech Financial Technology
FRTB Fundamental Review of the Trading Book
FSB Financial Stability Board
FSI Financial Stress Index
FSR Financial Stability Review
FX Foreign Exchange
GARCH Generalised Auto Regressive Conditional Heteroscedasticity
GDP Gross Domestic Product
GFC Global Financial Crisis
GFMA Global Financial Markets Association
GFSR Global Financial Stability Report
GLS Government Land Sales
HCE Household Consumption Expenditure
ICR Interest Coverage Ratio
IE International Enterprise
IIF Institute of International Finance
IMF International Monetary Fund
INFRA Infrastructure Recovery and Assets
IORP Institution for Occupational Retirement Provision
IOSCO International Organisation of Securities Commissions
IPTO Insolvency and Public Trustee’s Office
ISCA Institute of Singapore Chartered Accountants
ISDA International Swaps and Derivatives Association
IWST Industry-Wide Stress Test
JFMC Japan Financial Markets Council
LCR Liquidity Coverage Ratio
LR Leverage Ratio
LTD Loan-to-Deposit
LTV Loan-to-Value
M&OE Marine and Offshore Engineering
MAS Monetary Authority of Singapore
MDR Merchant Discount Rate
Financial Stability Review, November 2017
Monetary Authority of Singapore Macroprudential Surveillance Department
MMO Money Market Operations
MOVE Merrill Lynch Option Volatility Estimate index
NFC Non-Financial Corporate
NIM Net Interest Margin
NPA Non-Performing Asset
NPL Non-Performing Loan
NUS National University of Singapore
O&G Oil and Gas
OCR Outside Central Region
OECD Organisation of Economic Co-operation and Development
OIF Offshore Insurance Fund
OSV Offshore Support Vessel
OTC Over-the-Counter
P2P Peer-to-Peer
PCA Principal Component Analysis
RCR Rest of Central Region
ROA Return on Assets
SBF Singapore Business Federation
SEACEN South East Asian Central Banks
SEC Securities and Exchange Commission
SFA Securities and Futures Act
SGTI Singapore Governance and Transparency Index
SGX Singapore Exchange Limited
SIBOR Singapore Interbank Offered Rate
SME Small and Medium-Sized Enterprise
SPRING Standards, Productivity and Innovation Board
SWF Sovereign Wealth Fund
TCH The Clearing House
TDSR Total Debt-Servicing Ratio
TSC Transport, Storage and Communication
TVP-FAVAR Time-Varying Parameter Factor-Augmented Vector Auto Regressive
URA Urban Redevelopment Authority
USFCI US Financial Conditions Index
VAR Vector Auto Regressive
VIX CBOE Volatility Index
Financial Stability Review, November 2017 i
Monetary Authority of Singapore Macroprudential Surveillance Department
PREFACE
The Monetary Authority of Singapore (MAS) conducts regular assessments of Singapore’s
financial system. Potential risks and vulnerabilities are identified, and the ability of the financial
system to withstand potential shocks is reviewed. The analyses and results are published in the
annual Financial Stability Review (FSR). The FSR aims to contribute to a better understanding of
issues affecting Singapore’s financial system among market participants, analysts and the public.
Section 1 of the FSR provides a discussion of the risks in the external environment. This is
followed by an analysis of the Singapore financial sector in Section 2. Finally, a review of the
corporate and household sectors is provided in Sections 3 and 4 respectively.
The production of the FSR was coordinated by the Macroprudential Surveillance Department
(MSD) team which comprises Kenneth Gay, Ng Heng Tiong, Lily Chan, Alex Phua, Aloysius Lim,
Ang Shu Qin, Angeline Lam, Angeline Qiu, Cheryl Ho, Choo Chian, Denise Yeo, Evelyn Chen, Gael
Soon, Koh Zhi Xing, Phil Liang, Tan Aik Khim, Wendy Lee, Wong Jian Xiang, and Wong Siang Leng
under the general direction of Rosemary Lim, Executive Director (MSD) and Wong Nai Seng,
Assistant Managing Director (Policy, Risk & Surveillance). The FSR also incorporates
contributions from the following departments: Banking Departments I, II & III, Data Analytics
Group, Economic Analysis Department, Economic Surveillance & Forecasting Department,
Insurance Department, Markets Policy & Infrastructure Department, Monetary & Domestic
Markets Management Department and Prudential Policy Department. The FSR reflects the
views of the staff of the Macroprudential Surveillance Department and the contributing
departments.
The FSR may be accessed in PDF format on the MAS website:
http://www.mas.gov.sg/en/Regulations-and-Financial-Stability/Financial Stability.aspx
Financial Stability Review, November 2017 ii
Monetary Authority of Singapore Macroprudential Surveillance Department
OVERVIEW
While the global economy has strengthened,
medium-term vulnerabilities remain
Gradual monetary policy normalisation in
developed markets continues to support
global growth. But accommodative financial
conditions have also facilitated financial
excesses amid persistent search for yield. This
raises the risk of disruptive corrections when
the excesses unwind.
Within the region, China has shifted its focus to
addressing financial stability risks whilst still
achieving firm economic growth. Close
monitoring is warranted, given potential
spillover effects on the global economy and
financial markets.
Geopolitical risks and unexpected policy shifts
in advanced economies may trigger a market
correction and increased risk aversion, with
attendant pullbacks from emerging markets.
Singapore’s banking system remains resilient
with strong capital and liquidity buffers to
withstand shocks
Singapore’s banking system remains resilient
as the economic recovery gains traction. Both
domestic and regional lending rebounded, in
line with the regional economic revival.
While overall asset quality has improved,
banks continue to face heightened credit risks
from the marine and offshore engineering
(M&OE) subsector. Foreign currency funding
pressures have also risen alongside growing
cross-border exposures.
Banks should continue to maintain sound
credit underwriting standards and actively
monitor their borrowers’ financial health.
Banks should also stay vigilant in managing
their foreign currency funding risks as they
expand in the region.
MAS has not observed broad-based domestic
credit overheating at this juncture.
Accordingly, MAS will maintain the
Countercyclical Capital Buffer (CCyB) at 0%.
Corporate profitability remains broadly
stable, but firms should guard against
potential balance sheet vulnerabilities
Corporate profitability remains broadly stable,
supported by improvements in the global
economy. The M&OE subsector in Singapore
was, however, weighed down by low oil prices.
The aggregate corporate debt profile remains
sound. MAS’ stress test suggests that most
corporates are able to withstand interest rate
and earnings shocks. However, the pick-up in
corporate leverage after a period of moderate
credit growth bears close monitoring. Firms
should continue to guard against potential
balance sheet vulnerabilities, as higher interest
rates could weigh on their debt servicing
ability.
Singapore’s household balance sheets are
strengthening, but households should remain
financially prudent
Household balance sheets are strengthening
alongside the economic recovery. The main
drivers are growth in financial and property
assets.
While the overall employment outlook is
expected to improve in 2018, wages are not
expected to increase rapidly as the existing
Financial Stability Review, November 2017 iii
Monetary Authority of Singapore Macroprudential Surveillance Department
slack in the labour market will take time to be
absorbed. Against this backdrop and with
higher interest rates expected in the period
ahead, households should continue to stay
financially prudent.
Recent developments in the property
market pose potential risks to stability;
market players should proceed cautiously
The private residential property market has
picked up in recent quarters, underpinned by
an improvement in buyer sentiment and low
interest rates. Developers have also
participated actively in en-bloc sales and the
Government Land Sales (GLS) programme to
replenish their land banks.
The development of en-bloc and GLS sites
should more than double the number of units
available for sale in the near term. In the
medium term, the stock of private housing will
increase. With slower population growth,
there is considerable uncertainty as to whether
existing vacancies and the new supply coming
on stream can be fully absorbed by the market.
If not matched by occupation demand, a
supply imbalance could result and weigh on
rentals and property prices.
Developers should take into account the
significant rise in the number of private
housing units available for sale in the near term
when bidding for land.
Prospective buyers should remain prudent in
their buying decisions. There is ample supply to
meet occupation demand. Buyers should
carefully assess their ability to service their
mortgage debt in the long term, taking into
account potential interest rate increases and
uncertain rentals.
Banks should continue to maintain prudent
underwriting standards and review their
valuation practices to ensure that property
appraisals remain realistic and substantiated.
Macroprudential Surveillance Department
Monetary Authority of Singapore
30 November 2017
Financial Stability Review, November 2017 1
Monetary Authority of Singapore Macroprudential Surveillance Department
1 Global Environment
While the global economy has strengthened, medium-term vulnerabilities remain. Gradual monetary
policy normalisation in developed markets continues to support global growth. But accommodative
financial conditions have also facilitated financial excesses amid persistent search for yield. This raises
the risk of disruptive corrections when the excesses are unwound. A normalisation process that is not
carefully calibrated could remove necessary support for sustained economic recovery, leading to shifts
in market sentiment and highlighting vulnerabilities in emerging markets.
Within the region, China has so far managed to shift its focus to addressing financial stability risks
whilst still achieving firm economic growth. Close monitoring is warranted, given potential spillover
effects on the global economy and financial markets.
Geopolitical risks and unexpected policy shifts in advanced economies may trigger a market correction
and increased risk aversion, with attendant pullbacks from emerging markets. These could derail
global growth.
Monetary Policy Normalisation amid High Debt Levels
While the pick-up in global growth has
reduced near-term financial stability risks,
medium-term vulnerabilities remain
Global economic conditions have improved
this year, and this improvement is expected to
continue on the back of stronger global trade
and still accommodative monetary policy.
Improved economic conditions have reduced
near-term financial stability risks from weak
growth and profitability, but medium-term
vulnerabilities remain.
Prolonged accommodative stance will
continue to drive the search for yield and
fuel the growth of debt
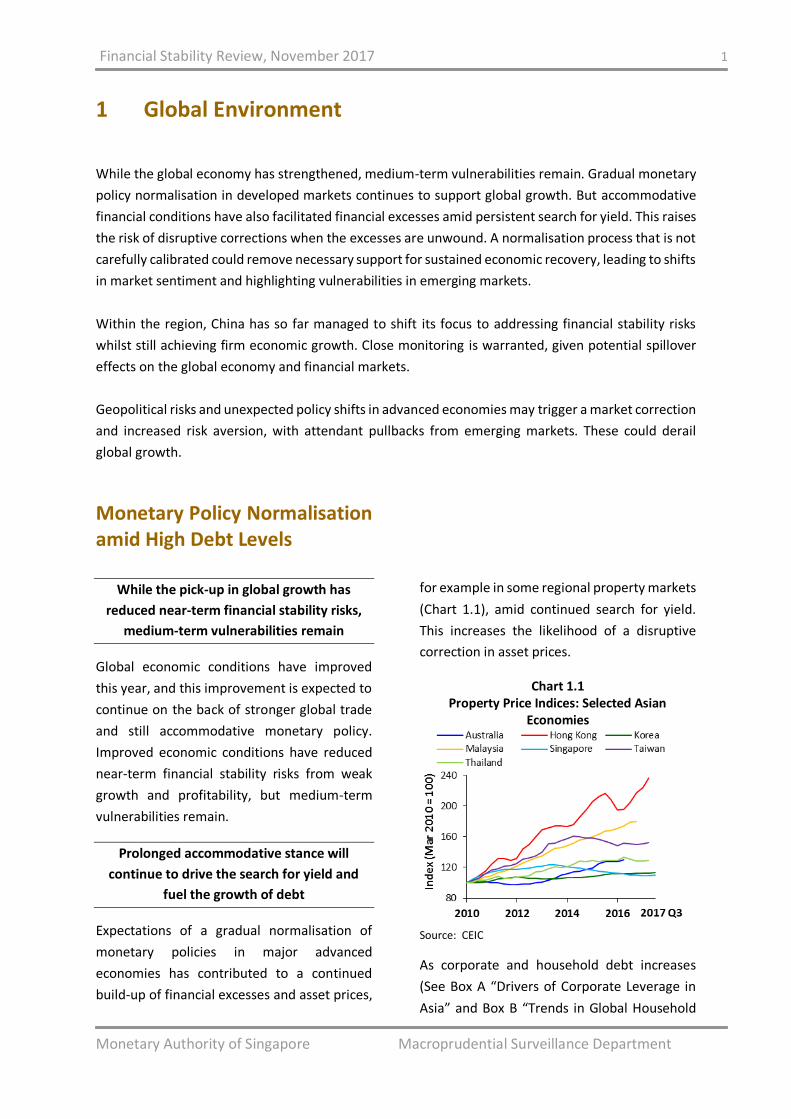
Expectations of a gradual normalisation of
monetary policies in major advanced
economies has contributed to a continued
build-up of financial excesses and asset prices,
for example in some regional property markets
(Chart 1.1), amid continued search for yield.
This increases the likelihood of a disruptive
correction in asset prices.
Chart 1.1 Property Price Indices: Selected Asian
Economies
Source: CEIC
As corporate and household debt increases
(See Box A “Drivers of Corporate Leverage in
Asia” and Box B “Trends in Global Household
Financial Stability Review, November 2017 2
Monetary Authority of Singapore Macroprudential Surveillance Department
Indebtedness and Drivers of Household
Leverage”), there are concerns on borrowers’
resilience to negative shocks and the potential
spillover effects to banks and the wider
financial system.
Monetary policy normalisation could have
implications on capital flows in emerging
markets, including Asia
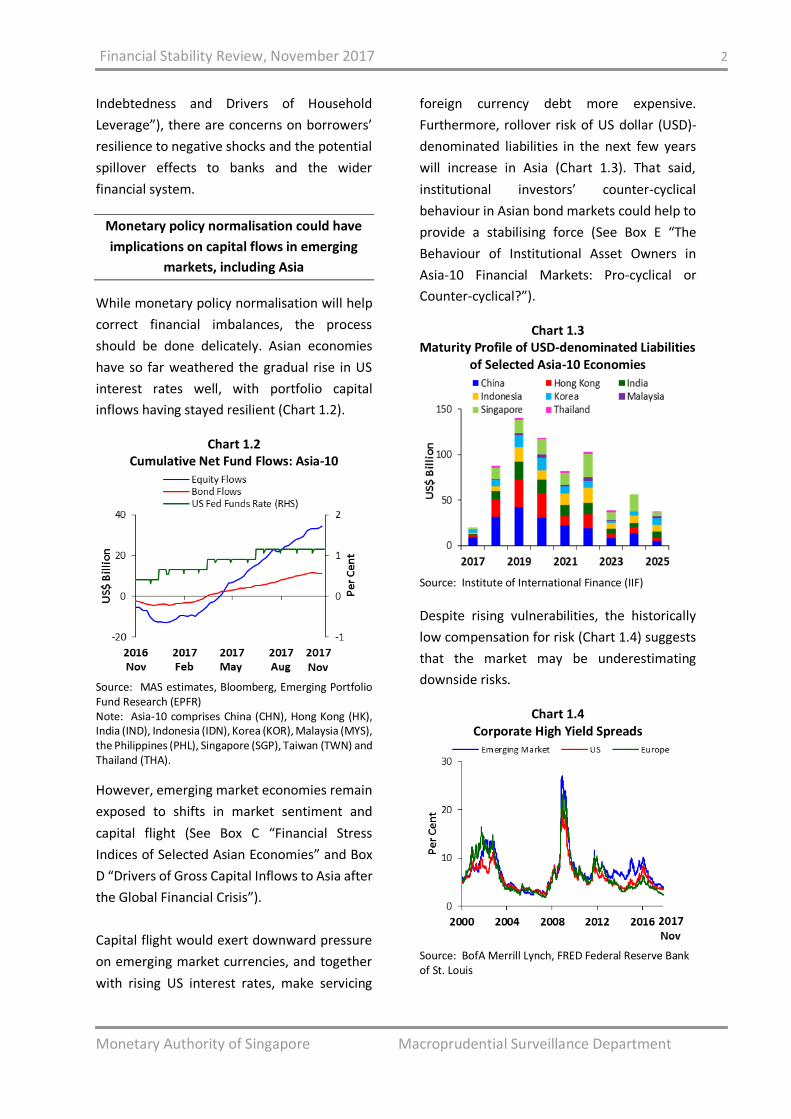
While monetary policy normalisation will help
correct financial imbalances, the process
should be done delicately. Asian economies
have so far weathered the gradual rise in US
interest rates well, with portfolio capital
inflows having stayed resilient (Chart 1.2).
Chart 1.2 Cumulative Net Fund Flows: Asia-10
Source: MAS estimates, Bloomberg, Emerging Portfolio Fund Research (EPFR) Note: Asia-10 comprises China (CHN), Hong Kong (HK), India (IND), Indonesia (IDN), Korea (KOR), Malaysia (MYS), the Philippines (PHL), Singapore (SGP), Taiwan (TWN) and Thailand (THA).
However, emerging market economies remain
exposed to shifts in market sentiment and
capital flight (See Box C “Financial Stress
Indices of Selected Asian Economies” and Box
D “Drivers of Gross Capital Inflows to Asia after
the Global Financial Crisis”).
Capital flight would exert downward pressure
on emerging market currencies, and together
with rising US interest rates, make servicing
foreign currency debt more expensive.
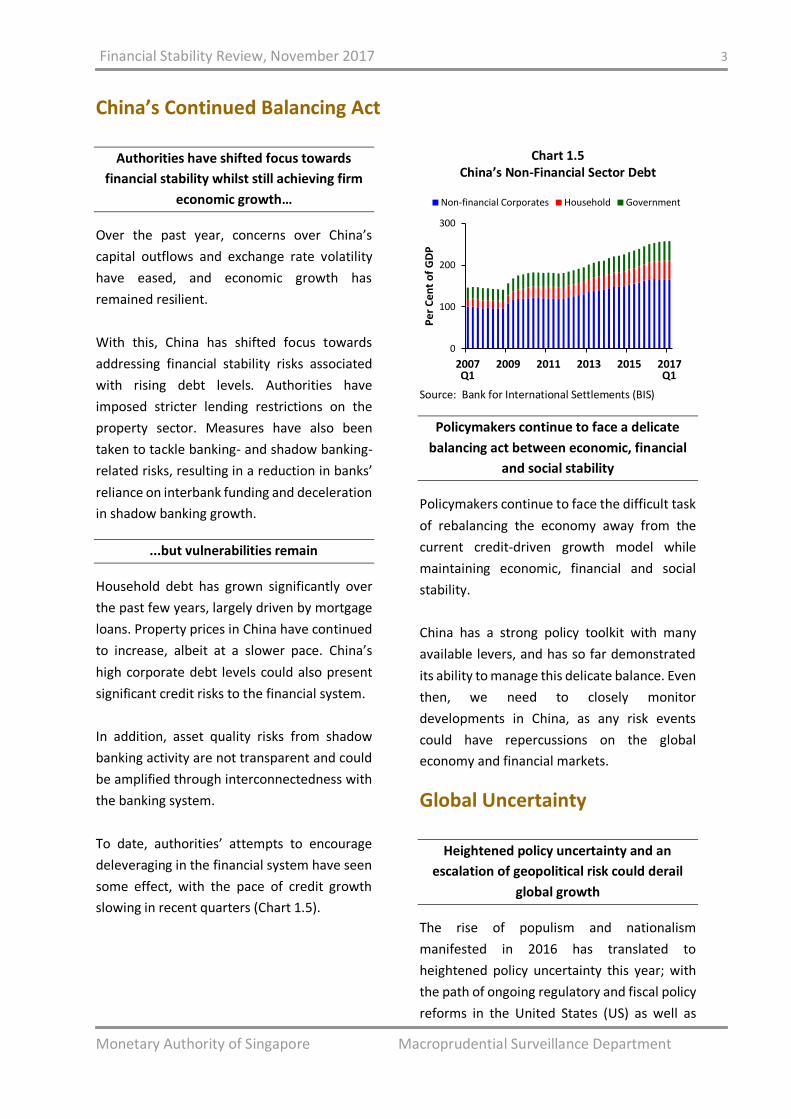
Furthermore, rollover risk of US dollar (USD)-
denominated liabilities in the next few years
will increase in Asia (Chart 1.3). That said,
institutional investors’ counter-cyclical
behaviour in Asian bond markets could help to
provide a stabilising force (See Box E “The
Behaviour of Institutional Asset Owners in
Asia-10 Financial Markets: Pro-cyclical or
Counter-cyclical?”).
Chart 1.3 Maturity Profile of USD-denominated Liabilities
of Selected Asia-10 Economies
Source: Institute of International Finance (IIF)
Despite rising vulnerabilities, the historically
low compensation for risk (Chart 1.4) suggests
that the market may be underestimating
downside risks.
Chart 1.4 Corporate High Yield Spreads
Source: BofA Merrill Lynch, FRED Federal Reserve Bank of St. Louis
Financial Stability Review, November 2017 3
Monetary Authority of Singapore Macroprudential Surveillance Department
China’s Continued Balancing Act
Authorities have shifted focus towards
financial stability whilst still achieving firm
economic growth…
Over the past year, concerns over China’s
capital outflows and exchange rate volatility
have eased, and economic growth has
remained resilient.
With this, China has shifted focus towards
addressing financial stability risks associated
with rising debt levels. Authorities have
imposed stricter lending restrictions on the
property sector. Measures have also been
taken to tackle banking- and shadow banking-
related risks, resulting in a reduction in banks’
reliance on interbank funding and deceleration
in shadow banking growth.
...but vulnerabilities remain
Household debt has grown significantly over
the past few years, largely driven by mortgage
loans. Property prices in China have continued
to increase, albeit at a slower pace. China’s
high corporate debt levels could also present
significant credit risks to the financial system.
In addition, asset quality risks from shadow
banking activity are not transparent and could
be amplified through interconnectedness with
the banking system.
To date, authorities’ attempts to encourage
deleveraging in the financial system have seen
some effect, with the pace of credit growth
slowing in recent quarters (Chart 1.5).
Chart 1.5 China’s Non-Financial Sector Debt
Source: Bank for International Settlements (BIS)
Policymakers continue to face a delicate
balancing act between economic, financial
and social stability
Policymakers continue to face the difficult task
of rebalancing the economy away from the
current credit-driven growth model while
maintaining economic, financial and social
stability.
China has a strong policy toolkit with many
available levers, and has so far demonstrated
its ability to manage this delicate balance. Even
then, we need to closely monitor
developments in China, as any risk events
could have repercussions on the global
economy and financial markets.
Global Uncertainty
Heightened policy uncertainty and an
escalation of geopolitical risk could derail
global growth
The rise of populism and nationalism
manifested in 2016 has translated to
heightened policy uncertainty this year; with
the path of ongoing regulatory and fiscal policy
reforms in the United States (US) as well as
0
100
200
300
2007 2009 2011 2013 2015 2017
Pe
r C
en
t o
f G
DP
Non-financial Corporates Household Government
Q1 Q1
Financial Stability Review, November 2017 4
Monetary Authority of Singapore Macroprudential Surveillance Department
arrangements for the United Kingdom (UK) to
withdraw from the European Union (EU)
unclear.
In Europe, populism and separatist sentiments
have increased in Germany and Spain. It
remains to be seen if incumbent governments
have sufficient support to push through with
necessary reforms to strengthen their
economies and financial systems, as well as to
support European integration.
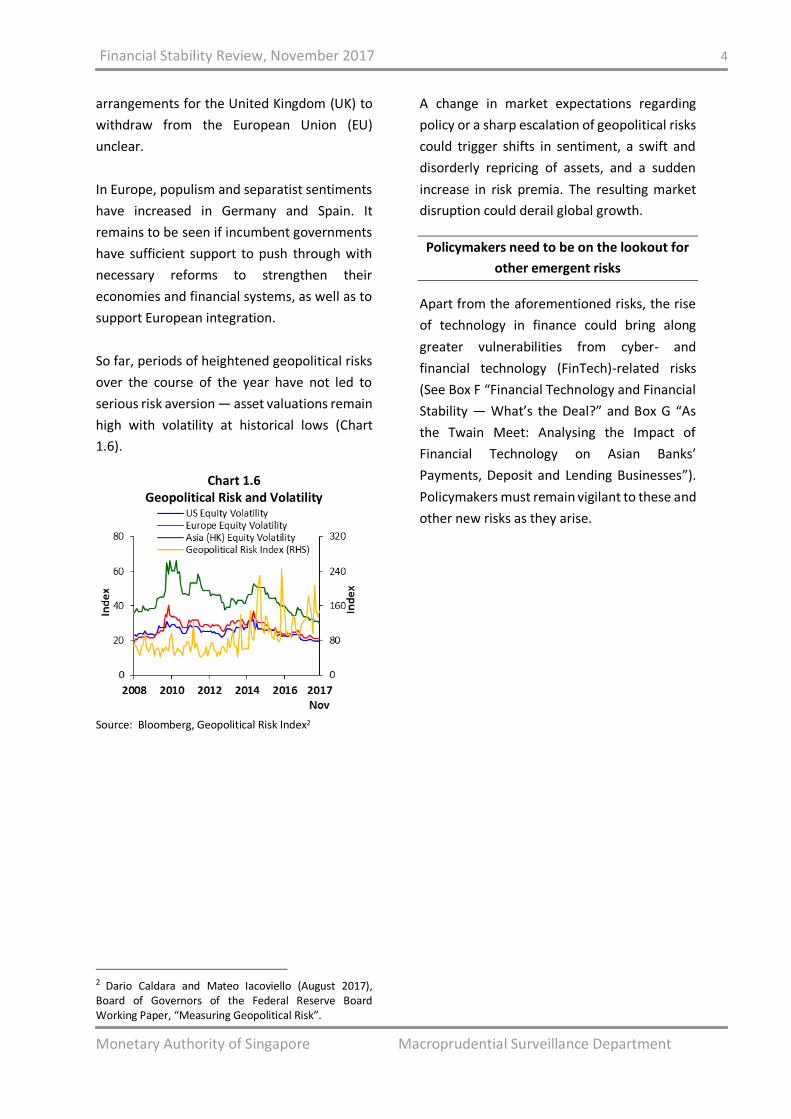
So far, periods of heightened geopolitical risks
over the course of the year have not led to
serious risk aversion — asset valuations remain
high with volatility at historical lows (Chart
1.6).
Chart 1.6 Geopolitical Risk and Volatility
Source: Bloomberg, Geopolitical Risk Index2
A change in market expectations regarding
policy or a sharp escalation of geopolitical risks
could trigger shifts in sentiment, a swift and
disorderly repricing of assets, and a sudden
increase in risk premia. The resulting market
disruption could derail global growth.
Policymakers need to be on the lookout for
other emergent risks
Apart from the aforementioned risks, the rise
of technology in finance could bring along
greater vulnerabilities from cyber- and
financial technology (FinTech)-related risks
(See Box F “Financial Technology and Financial
Stability — What’s the Deal?” and Box G “As
the Twain Meet: Analysing the Impact of
Financial Technology on Asian Banks’
Payments, Deposit and Lending Businesses”).
Policymakers must remain vigilant to these and
other new risks as they arise.
2 Dario Caldara and Mateo Iacoviello (August 2017), Board of Governors of the Federal Reserve Board Working Paper, “Measuring Geopolitical Risk”.
Financial Stability Review, November 2017 5
Monetary Authority of Singapore Macroprudential Surveillance Department
Box A Drivers of Corporate Leverage in Asia
Corporate leverage in Asia has risen post-global financial crisis (GFC). An increase in corporate leverage in
itself is not necessarily a cause for concern if leverage is used to expand a firm’s productive capabilities.
However, elevated debt levels could be a source of vulnerability. Corporates’ and their creditors’ balance
sheets can be adversely affected when interest rates increase or financial conditions tighten. Studies have
also shown that elevated corporate debt levels often precede financial crises.3
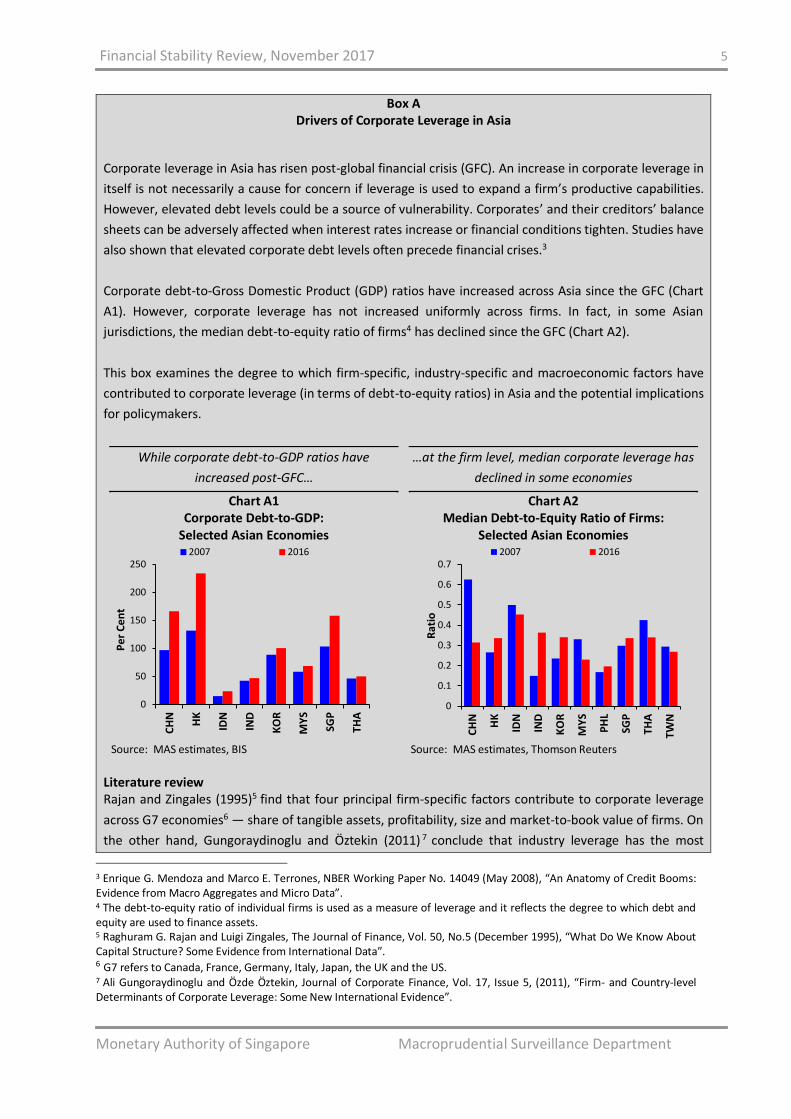
Corporate debt-to-Gross Domestic Product (GDP) ratios have increased across Asia since the GFC (Chart
A1). However, corporate leverage has not increased uniformly across firms. In fact, in some Asian
jurisdictions, the median debt-to-equity ratio of firms4 has declined since the GFC (Chart A2).
This box examines the degree to which firm-specific, industry-specific and macroeconomic factors have
contributed to corporate leverage (in terms of debt-to-equity ratios) in Asia and the potential implications
for policymakers.
While corporate debt-to-GDP ratios have
increased post-GFC…
Chart A1 Corporate Debt-to-GDP:
Selected Asian Economies
Source: MAS estimates, BIS
…at the firm level, median corporate leverage has
declined in some economies
Chart A2 Median Debt-to-Equity Ratio of Firms:
Selected Asian Economies
Source: MAS estimates, Thomson Reuters
Literature review Rajan and Zingales (1995)5 find that four principal firm-specific factors contribute to corporate leverage
across G7 economies6 — share of tangible assets, profitability, size and market-to-book value of firms. On
the other hand, Gungoraydinoglu and Öztekin (2011) 7 conclude that industry leverage has the most
3 Enrique G. Mendoza and Marco E. Terrones, NBER Working Paper No. 14049 (May 2008), “An Anatomy of Credit Booms: Evidence from Macro Aggregates and Micro Data”. 4 The debt-to-equity ratio of individual firms is used as a measure of leverage and it reflects the degree to which debt and equity are used to finance assets. 5 Raghuram G. Rajan and Luigi Zingales, The Journal of Finance, Vol. 50, No.5 (December 1995), “What Do We Know About Capital Structure? Some Evidence from International Data”. 6 G7 refers to Canada, France, Germany, Italy, Japan, the UK and the US. 7 Ali Gungoraydinoglu and Özde Öztekin, Journal of Corporate Finance, Vol. 17, Issue 5, (2011), “Firm- and Country-level Determinants of Corporate Leverage: Some New International Evidence”.
0
50
100
150
200
250
CH
N
HK
IDN
IND
KO
R
MY
S
SGP
THA
Pe
r C
en
t
2007 2016
0
0.1
0.2
0.3
0.4
0.5
0.6
0.7
CH
N
HK
IDN
IND
KO
R
MY
S
PH
L
SGP
THA
TWN
Rat
io
2007 2016
Financial Stability Review, November 2017 6
Monetary Authority of Singapore Macroprudential Surveillance Department
significant impact on corporate leverage, even more so than firm-specific attributes. In addition, the
International Monetary Fund (IMF) (2015)8 finds that global factors, in particular easier global financial
conditions9, have become more significant drivers of corporate leverage in emerging markets post-GFC.
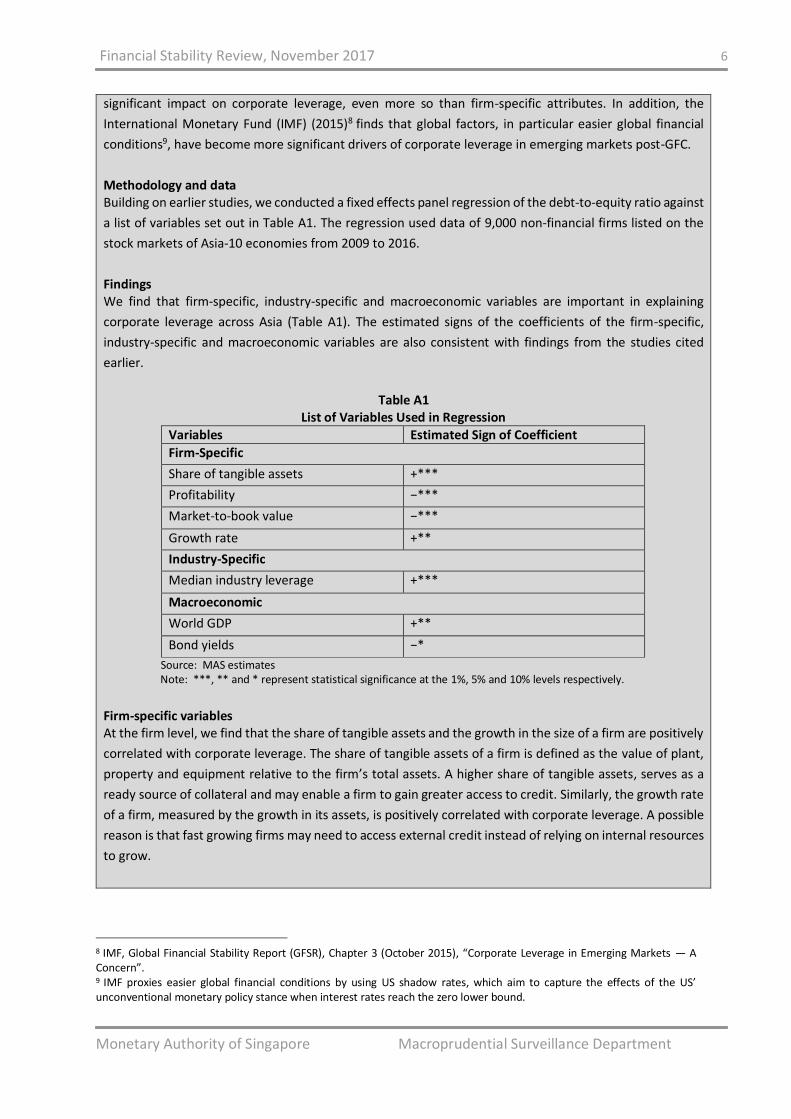
Methodology and data Building on earlier studies, we conducted a fixed effects panel regression of the debt-to-equity ratio against
a list of variables set out in Table A1. The regression used data of 9,000 non-financial firms listed on the
stock markets of Asia-10 economies from 2009 to 2016.
Findings We find that firm-specific, industry-specific and macroeconomic variables are important in explaining
corporate leverage across Asia (Table A1). The estimated signs of the coefficients of the firm-specific,
industry-specific and macroeconomic variables are also consistent with findings from the studies cited
earlier.
Table A1
List of Variables Used in Regression
Variables Estimated Sign of Coefficient
Firm-Specific
Share of tangible assets +***
Profitability −***
Market-to-book value −***
Growth rate +**
Industry-Specific
Median industry leverage +***
Macroeconomic
World GDP +**
Bond yields −*
Source: MAS estimates Note: ***, ** and * represent statistical significance at the 1%, 5% and 10% levels respectively.
Firm-specific variables At the firm level, we find that the share of tangible assets and the growth in the size of a firm are positively
correlated with corporate leverage. The share of tangible assets of a firm is defined as the value of plant,
property and equipment relative to the firm’s total assets. A higher share of tangible assets, serves as a
ready source of collateral and may enable a firm to gain greater access to credit. Similarly, the growth rate
of a firm, measured by the growth in its assets, is positively correlated with corporate leverage. A possible
reason is that fast growing firms may need to access external credit instead of relying on internal resources
to grow.
8 IMF, Global Financial Stability Report (GFSR), Chapter 3 (October 2015), “Corporate Leverage in Emerging Markets — A Concern”. 9 IMF proxies easier global financial conditions by using US shadow rates, which aim to capture the effects of the US’ unconventional monetary policy stance when interest rates reach the zero lower bound.
Financial Stability Review, November 2017 7
Monetary Authority of Singapore Macroprudential Surveillance Department
On the other hand, the profitability (defined as the return on assets of a firm) and the market-to-book value
ratio of a firm are negatively correlated with corporate leverage. Lower profitability could indicate that a
firm has insufficient retained earnings and hence, increases the likelihood of it taking on more debt to
support investment opportunities or meet its debt obligations.10 Conversely, high market-to-book values
may signal higher risk firms that lenders may be more cautious in extending credit to.11 Such firms may also
prefer to exploit their higher valuations to raise equity financing instead of borrowing.
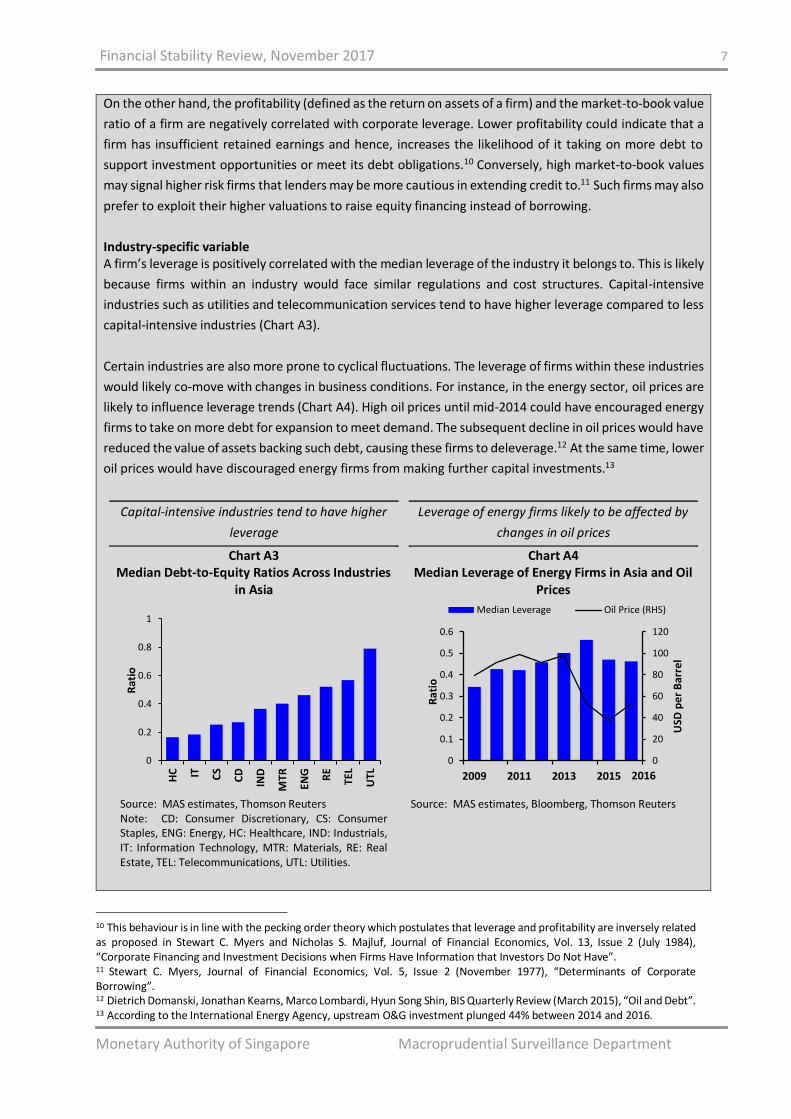
Industry-specific variable A firm’s leverage is positively correlated with the median leverage of the industry it belongs to. This is likely
because firms within an industry would face similar regulations and cost structures. Capital-intensive
industries such as utilities and telecommunication services tend to have higher leverage compared to less
capital-intensive industries (Chart A3).
Certain industries are also more prone to cyclical fluctuations. The leverage of firms within these industries
would likely co-move with changes in business conditions. For instance, in the energy sector, oil prices are
likely to influence leverage trends (Chart A4). High oil prices until mid-2014 could have encouraged energy
firms to take on more debt for expansion to meet demand. The subsequent decline in oil prices would have
reduced the value of assets backing such debt, causing these firms to deleverage.12 At the same time, lower
oil prices would have discouraged energy firms from making further capital investments.13
Capital-intensive industries tend to have higher
leverage
Chart A3 Median Debt-to-Equity Ratios Across Industries
in Asia
Source: MAS estimates, Thomson Reuters Note: CD: Consumer Discretionary, CS: Consumer Staples, ENG: Energy, HC: Healthcare, IND: Industrials, IT: Information Technology, MTR: Materials, RE: Real Estate, TEL: Telecommunications, UTL: Utilities.
Leverage of energy firms likely to be affected by
changes in oil prices
Chart A4 Median Leverage of Energy Firms in Asia and Oil
Prices
Source: MAS estimates, Bloomberg, Thomson Reuters
10 This behaviour is in line with the pecking order theory which postulates that leverage and profitability are inversely related as proposed in Stewart C. Myers and Nicholas S. Majluf, Journal of Financial Economics, Vol. 13, Issue 2 (July 1984), “Corporate Financing and Investment Decisions when Firms Have Information that Investors Do Not Have”. 11 Stewart C. Myers, Journal of Financial Economics, Vol. 5, Issue 2 (November 1977), “Determinants of Corporate Borrowing”. 12 Dietrich Domanski, Jonathan Kearns, Marco Lombardi, Hyun Song Shin, BIS Quarterly Review (March 2015), “Oil and Debt”. 13 According to the International Energy Agency, upstream O&G investment plunged 44% between 2014 and 2016.
0
0.2
0.4
0.6
0.8
1
HC IT CS
CD
IND
MTR
ENG RE
TEL
UTL
Rat
io
0
20
40
60
80
100
120
0
0.1
0.2
0.3
0.4
0.5
0.6
2009 2011 2013 2015
USD
pe
r B
arre
l
Rat
io
Median Leverage Oil Price (RHS)
2016
Financial Stability Review, November 2017 8
Monetary Authority of Singapore Macroprudential Surveillance Department
Macroeconomic variables While studies have traditionally focused on the influence of firm- and industry-specific characteristics on
corporate leverage, macroeconomic conditions could also have a bearing on corporate leverage and
influence firms’ capital structure decisions. We find that domestic five-year sovereign bond yields, a proxy
for the domestic borrowing cost for firms, are negatively correlated with leverage. Cheaper borrowing costs
allow firms to take on more leverage. On the other hand, world GDP growth, a proxy for global economic
conditions, is found to be positively correlated with leverage. A pick-up in global growth would have
positive spillovers to global trade and business sentiments. This could in turn encourage firms to take on
more leverage to expand their operations.
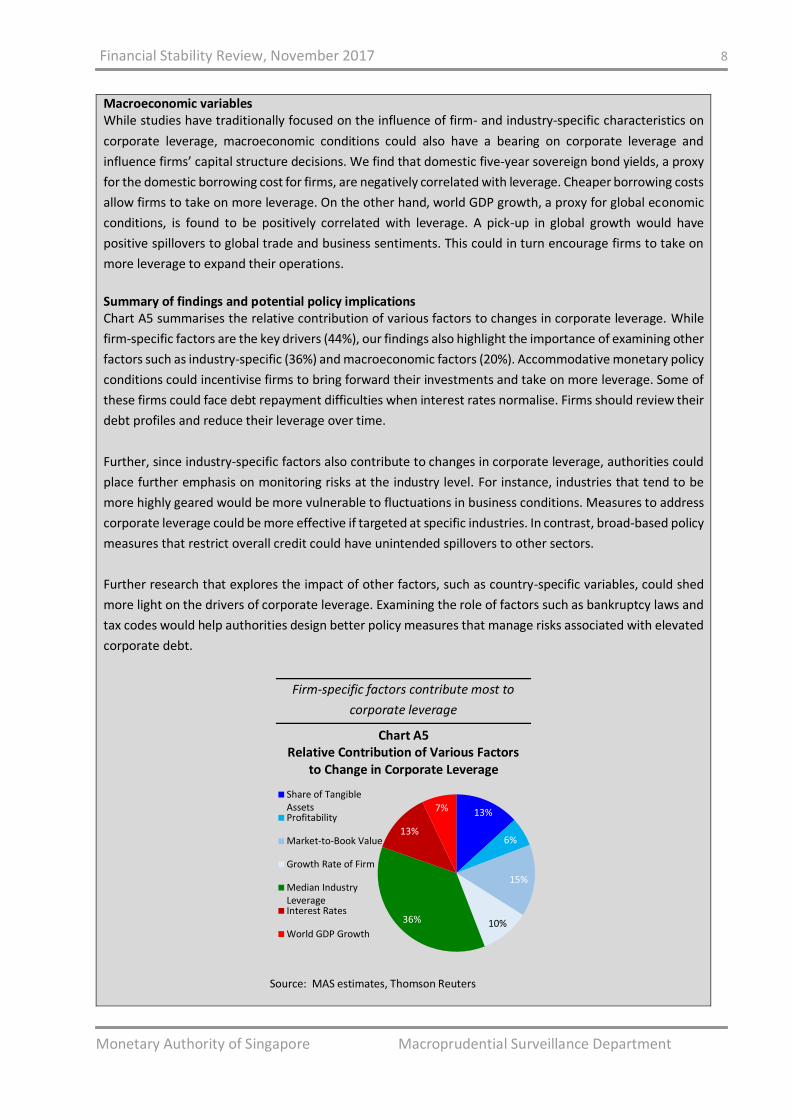
Summary of findings and potential policy implications Chart A5 summarises the relative contribution of various factors to changes in corporate leverage. While
firm-specific factors are the key drivers (44%), our findings also highlight the importance of examining other
factors such as industry-specific (36%) and macroeconomic factors (20%). Accommodative monetary policy
conditions could incentivise firms to bring forward their investments and take on more leverage. Some of
these firms could face debt repayment difficulties when interest rates normalise. Firms should review their
debt profiles and reduce their leverage over time.
Further, since industry-specific factors also contribute to changes in corporate leverage, authorities could
place further emphasis on monitoring risks at the industry level. For instance, industries that tend to be
more highly geared would be more vulnerable to fluctuations in business conditions. Measures to address
corporate leverage could be more effective if targeted at specific industries. In contrast, broad-based policy
measures that restrict overall credit could have unintended spillovers to other sectors.
Further research that explores the impact of other factors, such as country-specific variables, could shed
more light on the drivers of corporate leverage. Examining the role of factors such as bankruptcy laws and
tax codes would help authorities design better policy measures that manage risks associated with elevated
corporate debt.
Firm-specific factors contribute most to
corporate leverage
Chart A5 Relative Contribution of Various Factors
to Change in Corporate Leverage
Source: MAS estimates, Thomson Reuters
13%
6%
15%
10%36%
13%
7%
Share of TangibleAssetsProfitability
Market-to-Book Value
Growth Rate of Firm
Median IndustryLeverageInterest Rates
World GDP Growth
Financial Stability Review, November 2017 9
Monetary Authority of Singapore Macroprudential Surveillance Department
Box B
Trends in Global Household Indebtedness and Drivers of Household Leverage
High household leverage renders an economy vulnerable to financial and macroeconomic instability. IMF
(2017)14 notes that a higher household debt-to-GDP ratio contributes to a greater probability of a banking
crisis. Lombardi et al (2017)15 find that a one percentage point increase in the household debt-to-GDP ratio
is associated with a 0.1 percentage point decrease in GDP growth in the long run.
This box analyses trends in household indebtedness and drivers of household leverage in both Asian and
advanced economies. We find that developments in the property market are an important determinant of
household debt. Further, macroprudential policies have become more important in mitigating increases in
household debt post-GFC.
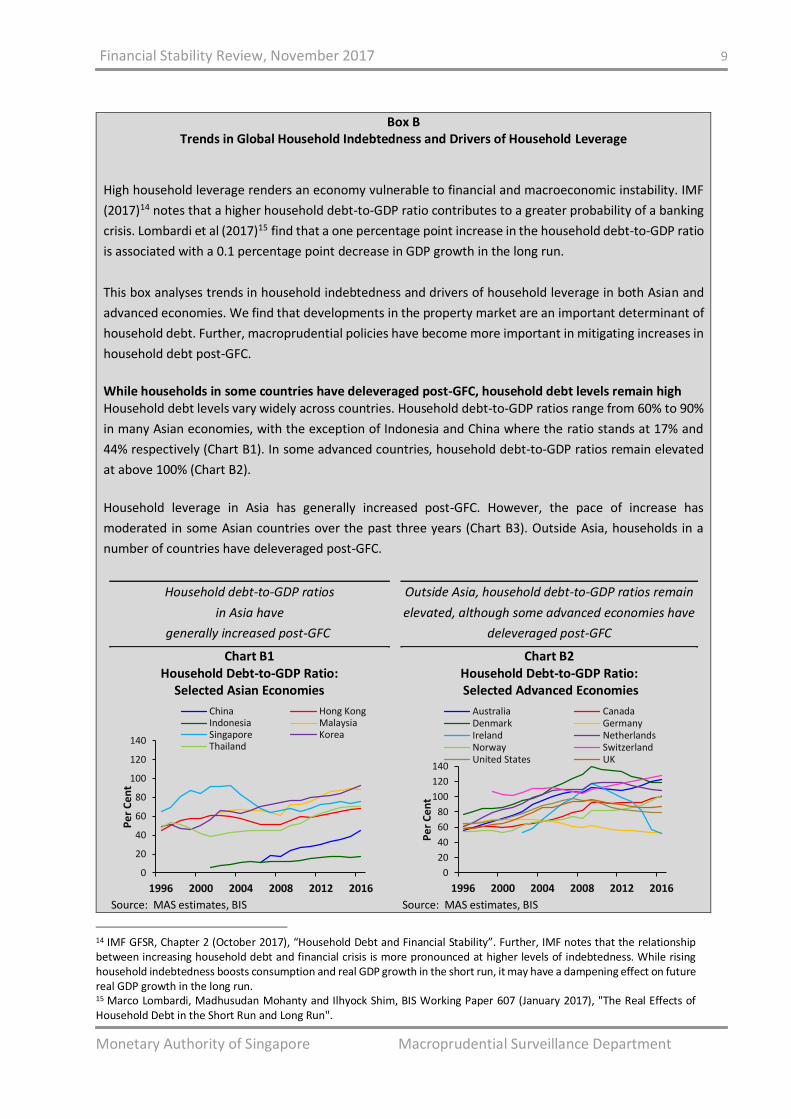
While households in some countries have deleveraged post-GFC, household debt levels remain high Household debt levels vary widely across countries. Household debt-to-GDP ratios range from 60% to 90%
in many Asian economies, with the exception of Indonesia and China where the ratio stands at 17% and
44% respectively (Chart B1). In some advanced countries, household debt-to-GDP ratios remain elevated
at above 100% (Chart B2).
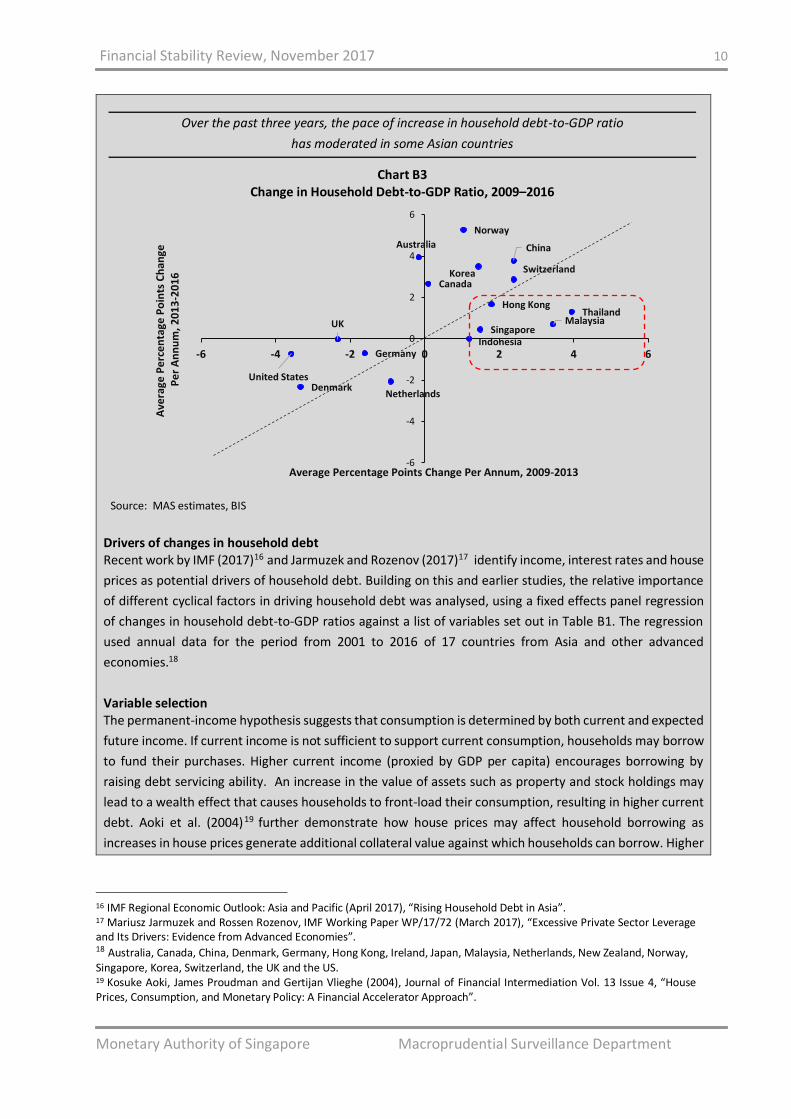
Household leverage in Asia has generally increased post-GFC. However, the pace of increase has
moderated in some Asian countries over the past three years (Chart B3). Outside Asia, households in a
number of countries have deleveraged post-GFC.
Household debt-to-GDP ratios
in Asia have
generally increased post-GFC.
Chart B1 Household Debt-to-GDP Ratio:
Selected Asian Economies
Source: MAS estimates, BIS
Outside Asia, household debt-to-GDP ratios remain
elevated, although some advanced economies have
deleveraged post-GFC
Chart B2 Household Debt-to-GDP Ratio: Selected Advanced Economies
Source: MAS estimates, BIS
14 IMF GFSR, Chapter 2 (October 2017), “Household Debt and Financial Stability”. Further, IMF notes that the relationship between increasing household debt and financial crisis is more pronounced at higher levels of indebtedness. While rising household indebtedness boosts consumption and real GDP growth in the short run, it may have a dampening effect on future real GDP growth in the long run. 15 Marco Lombardi, Madhusudan Mohanty and Ilhyock Shim, BIS Working Paper 607 (January 2017), "The Real Effects of Household Debt in the Short Run and Long Run".
0
20
40
60
80
100
120
140
1996 2000 2004 2008 2012 2016
Pe
r C
en
t
China Hong KongIndonesia MalaysiaSingapore KoreaThailand
0
20
40
60
80
100
120
140
1996 2000 2004 2008 2012 2016
Pe
r C
en
t
Australia CanadaDenmark GermanyIreland NetherlandsNorway SwitzerlandUnited States UK
Financial Stability Review, November 2017 10
Monetary Authority of Singapore Macroprudential Surveillance Department
Over the past three years, the pace of increase in household debt-to-GDP ratio
has moderated in some Asian countries
Chart B3 Change in Household Debt-to-GDP Ratio, 2009–2016
Source: MAS estimates, BIS
Drivers of changes in household debt Recent work by IMF (2017)16 and Jarmuzek and Rozenov (2017)17 identify income, interest rates and house
prices as potential drivers of household debt. Building on this and earlier studies, the relative importance
of different cyclical factors in driving household debt was analysed, using a fixed effects panel regression
of changes in household debt-to-GDP ratios against a list of variables set out in Table B1. The regression
used annual data for the period from 2001 to 2016 of 17 countries from Asia and other advanced
economies.18
Variable selection The permanent-income hypothesis suggests that consumption is determined by both current and expected
future income. If current income is not sufficient to support current consumption, households may borrow
to fund their purchases. Higher current income (proxied by GDP per capita) encourages borrowing by
raising debt servicing ability. An increase in the value of assets such as property and stock holdings may
lead to a wealth effect that causes households to front-load their consumption, resulting in higher current
debt. Aoki et al. (2004)19 further demonstrate how house prices may affect household borrowing as
increases in house prices generate additional collateral value against which households can borrow. Higher
16 IMF Regional Economic Outlook: Asia and Pacific (April 2017), “Rising Household Debt in Asia”. 17 Mariusz Jarmuzek and Rossen Rozenov, IMF Working Paper WP/17/72 (March 2017), “Excessive Private Sector Leverage and Its Drivers: Evidence from Advanced Economies”. 18 Australia, Canada, China, Denmark, Germany, Hong Kong, Ireland, Japan, Malaysia, Netherlands, New Zealand, Norway, Singapore, Korea, Switzerland, the UK and the US. 19 Kosuke Aoki, James Proudman and Gertijan Vlieghe (2004), Journal of Financial Intermediation Vol. 13 Issue 4, “House Prices, Consumption, and Monetary Policy: A Financial Accelerator Approach”.
Singapore
United States
UK
Germany
Switzerland
Norway
Canada
Hong Kong
Korea
China
Malaysia
DenmarkNetherlands
Australia
Thailand
Indonesia
-6
-4
-2
0
2
4
6
-6 -4 -2 0 2 4 6
Ave
rage
Pe
rce
nta
ge P
oin
ts C
han
geP
er
An
nu
m,
20
13
-20
16
Average Percentage Points Change Per Annum, 2009-2013
Financial Stability Review, November 2017 11
Monetary Authority of Singapore Macroprudential Surveillance Department
house prices may also induce investors to borrow more in anticipation of capital gains from property
investments, especially given the reduced borrowing costs in the current low interest rate environment.20
Post-GFC, countries have made wider use of macroprudential measures which moderate credit availability
in overheated markets. Wong et al. (2015) find that macroprudential policies have dampened mortgage
loan growth and improved the risk profile of borrowers in Singapore.21
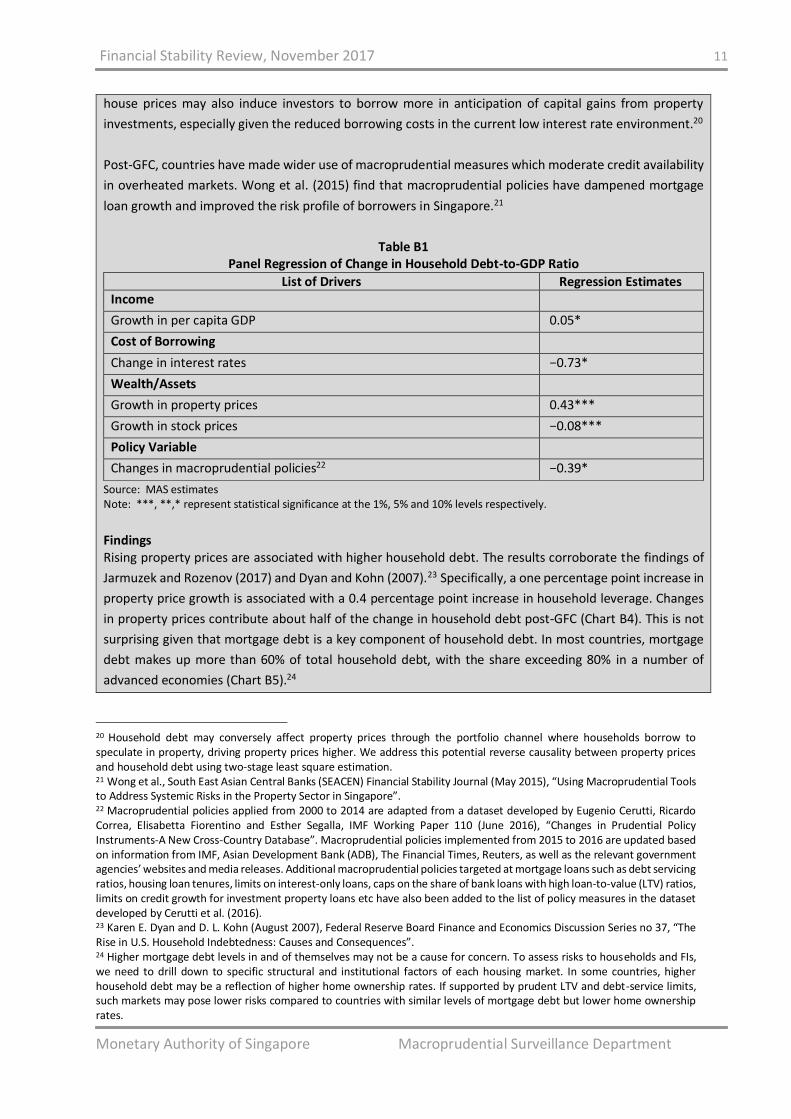
Table B1 Panel Regression of Change in Household Debt-to-GDP Ratio
List of Drivers Regression Estimates
Income
Growth in per capita GDP 0.05*
Cost of Borrowing
Change in interest rates −0.73*
Wealth/Assets
Growth in property prices 0.43***
Growth in stock prices −0.08***
Policy Variable
Changes in macroprudential policies22 −0.39*
Source: MAS estimates Note: ***, **,* represent statistical significance at the 1%, 5% and 10% levels respectively.
Findings Rising property prices are associated with higher household debt. The results corroborate the findings of
Jarmuzek and Rozenov (2017) and Dyan and Kohn (2007).23 Specifically, a one percentage point increase in
property price growth is associated with a 0.4 percentage point increase in household leverage. Changes
in property prices contribute about half of the change in household debt post-GFC (Chart B4). This is not
surprising given that mortgage debt is a key component of household debt. In most countries, mortgage
debt makes up more than 60% of total household debt, with the share exceeding 80% in a number of
advanced economies (Chart B5).24
20 Household debt may conversely affect property prices through the portfolio channel where households borrow to speculate in property, driving property prices higher. We address this potential reverse causality between property prices and household debt using two-stage least square estimation. 21 Wong et al., South East Asian Central Banks (SEACEN) Financial Stability Journal (May 2015), “Using Macroprudential Tools to Address Systemic Risks in the Property Sector in Singapore”. 22 Macroprudential policies applied from 2000 to 2014 are adapted from a dataset developed by Eugenio Cerutti, Ricardo Correa, Elisabetta Fiorentino and Esther Segalla, IMF Working Paper 110 (June 2016), “Changes in Prudential Policy Instruments-A New Cross-Country Database”. Macroprudential policies implemented from 2015 to 2016 are updated based on information from IMF, Asian Development Bank (ADB), The Financial Times, Reuters, as well as the relevant government agencies’ websites and media releases. Additional macroprudential policies targeted at mortgage loans such as debt servicing ratios, housing loan tenures, limits on interest-only loans, caps on the share of bank loans with high loan-to-value (LTV) ratios, limits on credit growth for investment property loans etc have also been added to the list of policy measures in the dataset developed by Cerutti et al. (2016). 23 Karen E. Dyan and D. L. Kohn (August 2007), Federal Reserve Board Finance and Economics Discussion Series no 37, “The Rise in U.S. Household Indebtedness: Causes and Consequences”. 24 Higher mortgage debt levels in and of themselves may not be a cause for concern. To assess risks to households and FIs, we need to drill down to specific structural and institutional factors of each housing market. In some countries, higher household debt may be a reflection of higher home ownership rates. If supported by prudent LTV and debt-service limits, such markets may pose lower risks compared to countries with similar levels of mortgage debt but lower home ownership rates.
Financial Stability Review, November 2017 12
Monetary Authority of Singapore Macroprudential Surveillance Department
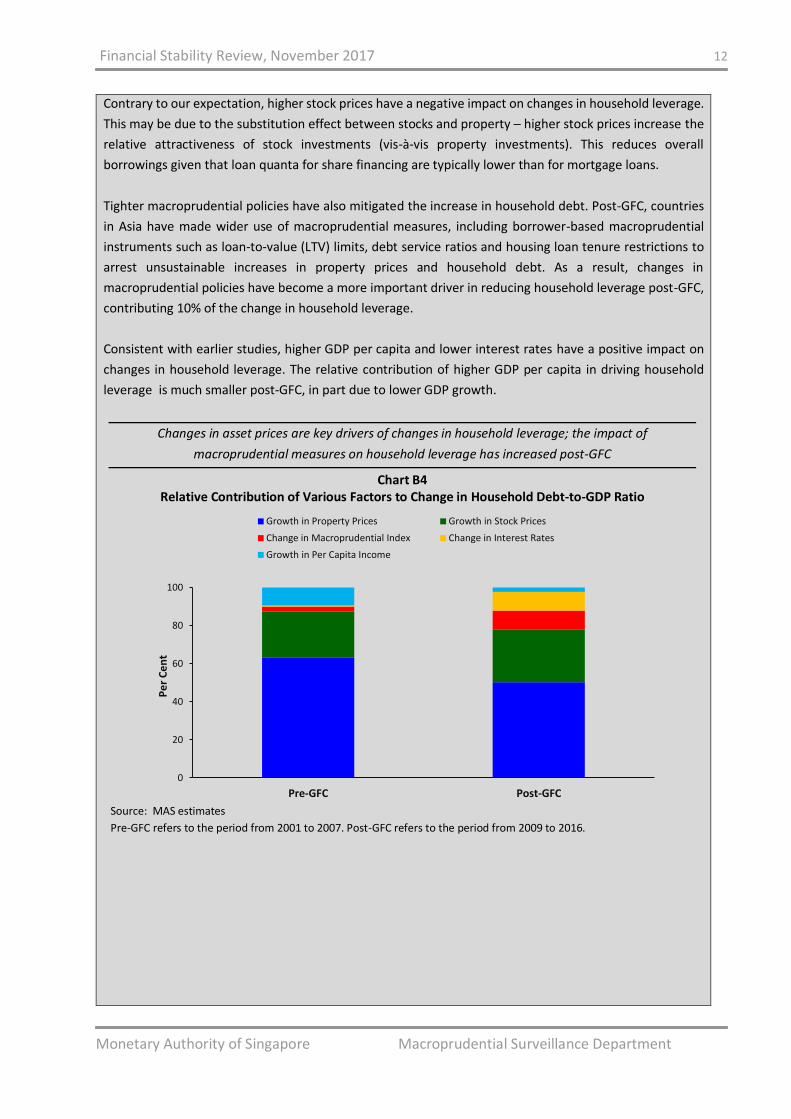
Contrary to our expectation, higher stock prices have a negative impact on changes in household leverage.
This may be due to the substitution effect between stocks and property ─ higher stock prices increase the
relative attractiveness of stock investments (vis-à-vis property investments). This reduces overall
borrowings given that loan quanta for share financing are typically lower than for mortgage loans.
Tighter macroprudential policies have also mitigated the increase in household debt. Post-GFC, countries
in Asia have made wider use of macroprudential measures, including borrower-based macroprudential
instruments such as loan-to-value (LTV) limits, debt service ratios and housing loan tenure restrictions to
arrest unsustainable increases in property prices and household debt. As a result, changes in
macroprudential policies have become a more important driver in reducing household leverage post-GFC,
contributing 10% of the change in household leverage.
Consistent with earlier studies, higher GDP per capita and lower interest rates have a positive impact on
changes in household leverage. The relative contribution of higher GDP per capita in driving household
leverage is much smaller post-GFC, in part due to lower GDP growth.
Changes in asset prices are key drivers of changes in household leverage; the impact of
macroprudential measures on household leverage has increased post-GFC
Chart B4 Relative Contribution of Various Factors to Change in Household Debt-to-GDP Ratio
Source: MAS estimates
Pre-GFC refers to the period from 2001 to 2007. Post-GFC refers to the period from 2009 to 2016.
0
20
40
60
80
100
Pre-GFC Post-GFC
Pe
r C
en
t
Growth in Property Prices Growth in Stock Prices
Change in Macroprudential Index Change in Interest Rates
Growth in Per Capita Income
Financial Stability Review, November 2017 13
Monetary Authority of Singapore Macroprudential Surveillance Department
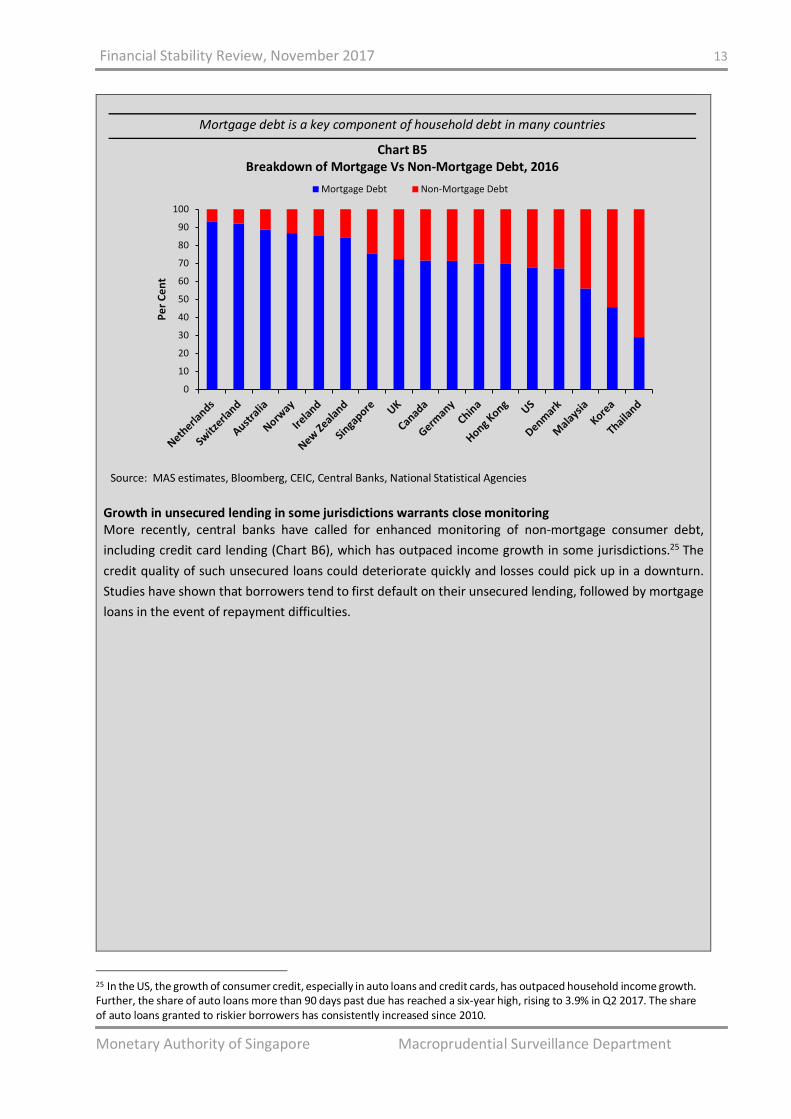
Mortgage debt is a key component of household debt in many countries
Chart B5 Breakdown of Mortgage Vs Non-Mortgage Debt, 2016
Source: MAS estimates, Bloomberg, CEIC, Central Banks, National Statistical Agencies
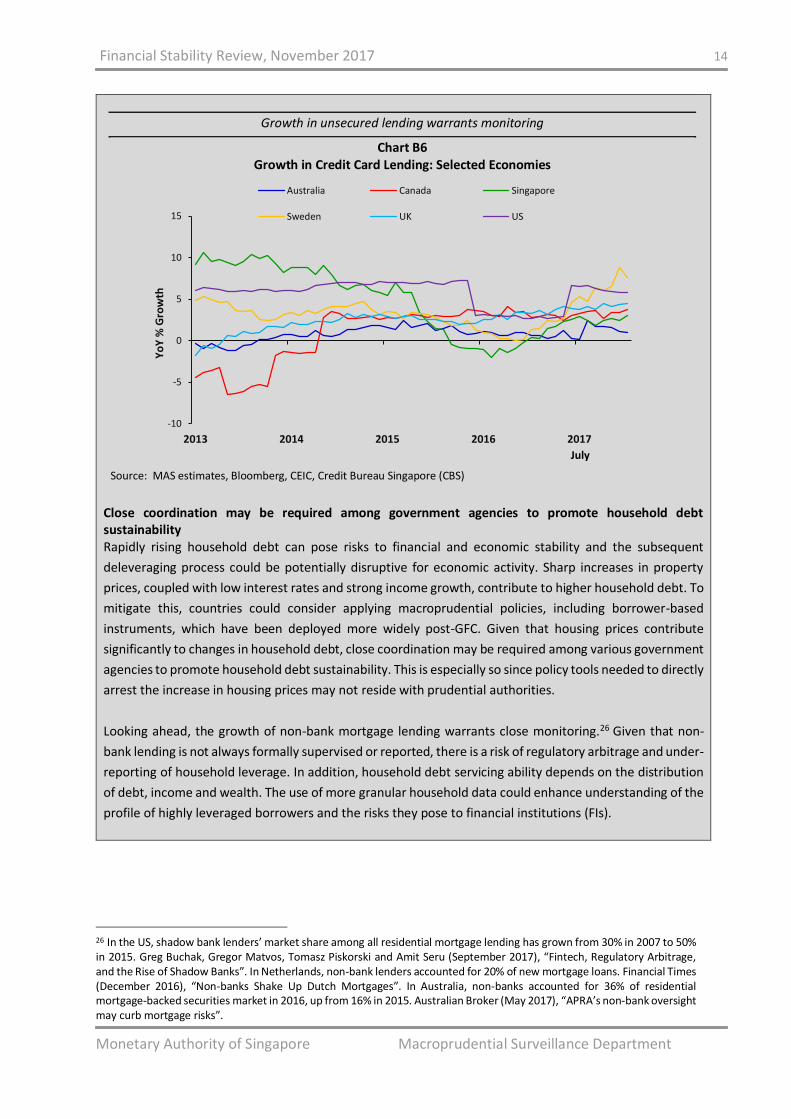
Growth in unsecured lending in some jurisdictions warrants close monitoring More recently, central banks have called for enhanced monitoring of non-mortgage consumer debt,
including credit card lending (Chart B6), which has outpaced income growth in some jurisdictions.25 The
credit quality of such unsecured loans could deteriorate quickly and losses could pick up in a downturn.
Studies have shown that borrowers tend to first default on their unsecured lending, followed by mortgage
loans in the event of repayment difficulties.
25 In the US, the growth of consumer credit, especially in auto loans and credit cards, has outpaced household income growth. Further, the share of auto loans more than 90 days past due has reached a six-year high, rising to 3.9% in Q2 2017. The share of auto loans granted to riskier borrowers has consistently increased since 2010.
0
10
20
30
40
50
60
70
80
90
100
Pe
r C
en
t
Mortgage Debt Non-Mortgage Debt
Financial Stability Review, November 2017 14
Monetary Authority of Singapore Macroprudential Surveillance Department
Growth in unsecured lending warrants monitoring
Chart B6 Growth in Credit Card Lending: Selected Economies
Source: MAS estimates, Bloomberg, CEIC, Credit Bureau Singapore (CBS)
Close coordination may be required among government agencies to promote household debt sustainability Rapidly rising household debt can pose risks to financial and economic stability and the subsequent
deleveraging process could be potentially disruptive for economic activity. Sharp increases in property
prices, coupled with low interest rates and strong income growth, contribute to higher household debt. To
mitigate this, countries could consider applying macroprudential policies, including borrower-based
instruments, which have been deployed more widely post-GFC. Given that housing prices contribute
significantly to changes in household debt, close coordination may be required among various government
agencies to promote household debt sustainability. This is especially so since policy tools needed to directly
arrest the increase in housing prices may not reside with prudential authorities.
Looking ahead, the growth of non-bank mortgage lending warrants close monitoring.26 Given that non-
bank lending is not always formally supervised or reported, there is a risk of regulatory arbitrage and under-
reporting of household leverage. In addition, household debt servicing ability depends on the distribution
of debt, income and wealth. The use of more granular household data could enhance understanding of the
profile of highly leveraged borrowers and the risks they pose to financial institutions (FIs).
26 In the US, shadow bank lenders’ market share among all residential mortgage lending has grown from 30% in 2007 to 50% in 2015. Greg Buchak, Gregor Matvos, Tomasz Piskorski and Amit Seru (September 2017), “Fintech, Regulatory Arbitrage, and the Rise of Shadow Banks”. In Netherlands, non-bank lenders accounted for 20% of new mortgage loans. Financial Times (December 2016), “Non-banks Shake Up Dutch Mortgages”. In Australia, non-banks accounted for 36% of residential mortgage-backed securities market in 2016, up from 16% in 2015. Australian Broker (May 2017), “APRA’s non-bank oversight may curb mortgage risks”.
-10
-5
0
5
10
15
2013 2014 2015 2016 2017
Yo
Y %
Gro
wth
Australia Canada Singapore
Sweden UK US
July
Financial Stability Review, November 2017 15
Monetary Authority of Singapore Macroprudential Surveillance Department
Box C Financial Stress Indices of Selected Asian Economies
Historical stress periods such as the GFC and their negative effects attest to the importance of identifying
and monitoring the build-up of financial system risks. Regular monitoring of financial stress is a multi-
dimensional task that involves studying shocks to various parts of the financial system. Financial stress
indices (FSIs) provide evidence of such shocks and can add to policymakers’ surveillance toolkit for
assessing the build-up of risks.
While an array of FSIs have been developed, including Asia-specific FSIs27, there have been fewer FSIs for
individual Asian economies. MAS (2009) published in the FSR an Asian FSI for monitoring financial stress in
Asian economies and its underlying causes.28 This study improves upon the earlier work by using more
recent econometric techniques and allows us to address any structural changes in the Asian financial
system since then. The improved construction can also help deepen our understanding of how different
segments of the financial system contribute to systemic risk.
We constructed FSIs for China, India, Indonesia and Malaysia.29 Interestingly, the variables that drive risk
in the new FSIs are the same as those in the MAS (2009) FSI. We also analysed the various channels through
which financial stress is propagated within the four economies, and find that stress episodes over the past
decade were largely due to external shocks that affected the equity capital flows, exchange rates and
foreign reserves of these economies.
Constructing individual Asian economy FSIs
There are numerous approaches in constructing FSIs. Balakrishnan et al. (2009) considers the fundamental
characteristics of financial stress in terms of (i) large shifts in asset prices, (ii) an abrupt increase in risk and/
or uncertainty, (iii) liquidity droughts, and (iv) concerns about the health of the banking system.30 Other
FSIs include variables that represent major components of the financial sector, i.e. the banking, securities
and foreign exchange (FX) market (e.g. Cardarelli et al. (2011)31). There are also FSIs that capture sovereign
risk (e.g. Park et al. (2013)), which is an important indicator for developing economies given the substantial
impact on access to foreign credit.32
27 An example of an Asia-specific FSI is Margarita Debuque-Gonzales and Maria Socorro Gochoco-Bautista (January 2013), “ADB Economics Working Paper Series: Financial Conditions Indexes for Asian Economies”. In terms of individual-economy FCIs, Goldman Sachs has constructed them for several emerging market economies. 28 MAS FSR Box D (November 2009), “Asian Financial Stress Indicators”. 29 These countries have been selected based on their significant banking and trade linkages to Singapore. 30 Ravi Balakrishnan, Stephan Danninger, Selim Elekdag and Irina Tytell, IMF Working Paper No. 09/133 (June 2009), “The Transmission of Financial Stress from Advanced to Emerging Economies”. 31 Roberto Cardarelli, Selim Elekdag, Subir Lall, Journal of Financial Stability (2011), “Financial Stress and Economic Contractions”. 32 Cyn-Young Park and Rogelio V. Mercado, Jr. (July 2013), “ADB Economics Working Paper Series: Determinants of Financial Stress in Emerging Market Economies”.
Financial Stability Review, November 2017 16
Monetary Authority of Singapore Macroprudential Surveillance Department
We chose a set of financial variables representing the banking sector, debt, equity and FX markets, as well
as variables that measure risk and liquidity premia. We then employed two methodologies to construct the
FSIs:
Principal Component Analysis (PCA)33, which allows us to identify the drivers of systemic risk,
based on fixed weights of the financial variables over time; and
Time-Varying Parameter Factor-Augmented Vector Auto Regressive (TVP-FAVAR) model34, which
allows us to analyse the sensitivity of the financial variables to systemic risk, based on varying
weights of the variables over time.
The PCA and TVP-FAVAR methodologies enable the choice and weights of the financial variables employed
in the construction of the FSIs to be empirically driven, as opposed to being subjectively assigned (e.g.
subjective application of equal weights to all financial variables chosen at the outset). Specifically, for each
economy studied, we ran several hundred simulations of the models based on monthly data35 and chose
the FSI series for which the underlying combination of financial variables had the expected coefficient signs
(i.e. that each financial variable in the series had the expected directional relationship with financial system
stress) (Table C1) and that accurately captured historical stress episodes. Through this process, financial
variables that do not carry the correct coefficient signs will be excluded; the remaining financial variables
(with the correct coefficient signs) will carry weights that are determined by the data.
We find that the FSIs constructed using the two methodologies above, where the components and weights
are freely determined, select components of the financial sector that are largely similar to those used in
the MAS (2009) Asian FSI, where the components and weights were pre-selected. Specifically, the FSIs
constructed largely consisted of variables covering the banking sector, the equity market, exchange rates,
foreign reserves and sovereign risk.
33 PCA is a popular approach in the construction of FSIs. Examples include the Financial Conditions Indices for 13 Asian economies in Carolina Osorio, Runchana Pongsaparn, D. Filiz Unsal, IMF Working Paper No. 11/170 (July 2011), “A Quantitative Assessment of Financial Conditions in Asia”, and the Kansas City Financial Stress Index in Craig S. Hakkio, William R. Keeton, Federal Reserve Bank of Kansas City (2009), “Financial Stress: What is it, How Can it be Measured, and Why Does it Matter?”. 34 The TVP-FAVAR follows the methodology in Gary Koop and Dimitris Korobilis (December 2013), “A New Index of Financial Conditions”. It models financial and macroeconomic variables jointly, to incorporate interdependence between them. At the same time, the effect of macroeconomic conditions are filtered out so that the FSI reflects purely financial conditions. We estimate the model using the Bayesian approach, involving dual linear Kalman filters and smoothers for the coefficients, and variance discounting methods for the covariances. The estimation uses the MatLab codes provided by Koop and Korobilis (2013), appropriately adapted for our purpose. 35 The data is seasonally-adjusted and transformed to stationarity, as appropriate.
Financial Stability Review, November 2017 17
Monetary Authority of Singapore Macroprudential Surveillance Department
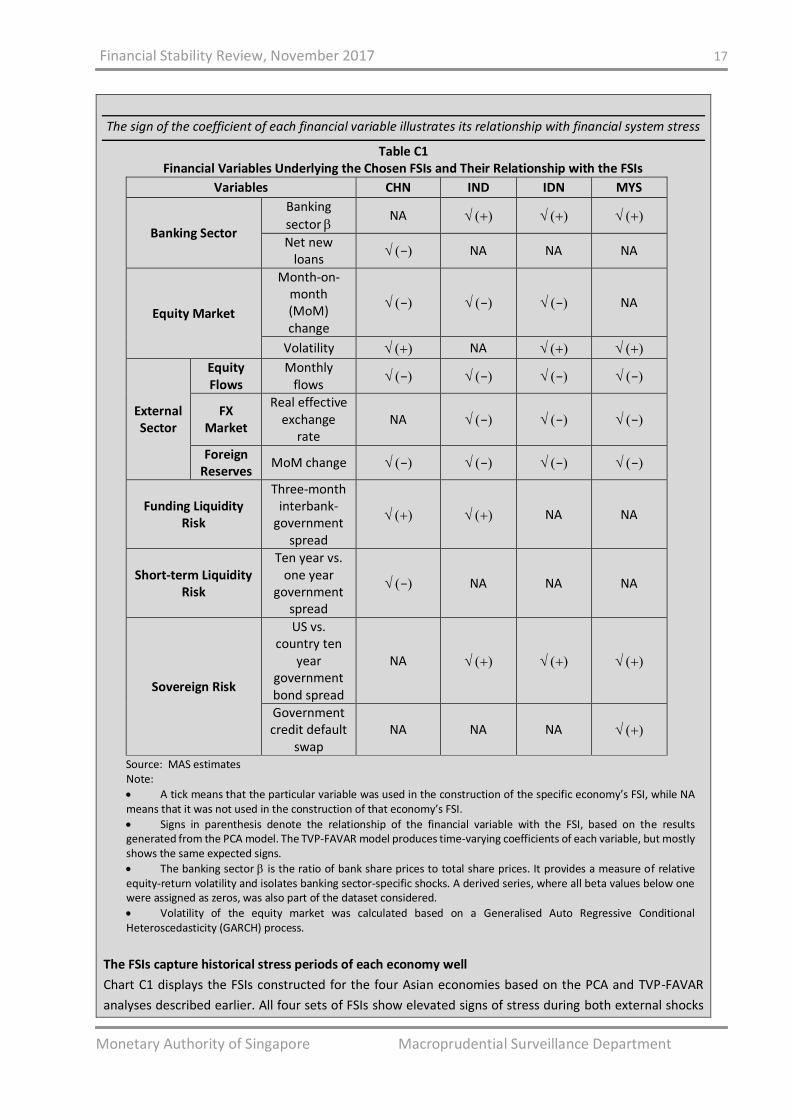
The sign of the coefficient of each financial variable illustrates its relationship with financial system stress
Table C1 Financial Variables Underlying the Chosen FSIs and Their Relationship with the FSIs
Variables CHN IND IDN MYS
Banking Sector
Banking
sector NA
Net new loans
− NA NA NA
Equity Market
Month-on-month (MoM) change
− − − NA
Volatility NA
External Sector
Equity Flows
Monthly flows
− − − −
FX Market
Real effective exchange
rate NA − − −
Foreign Reserves
MoM change − − − −
Funding Liquidity Risk
Three-month interbank-
government spread
NA NA
Short-term Liquidity Risk
Ten year vs. one year
government spread
− NA NA NA
Sovereign Risk
US vs. country ten
year government bond spread
NA
Government credit default
swap NA NA NA
Source: MAS estimates Note:
A tick means that the particular variable was used in the construction of the specific economy’s FSI, while NA means that it was not used in the construction of that economy’s FSI.
Signs in parenthesis denote the relationship of the financial variable with the FSI, based on the results generated from the PCA model. The TVP-FAVAR model produces time-varying coefficients of each variable, but mostly shows the same expected signs.
The banking sector is the ratio of bank share prices to total share prices. It provides a measure of relative equity-return volatility and isolates banking sector-specific shocks. A derived series, where all beta values below one were assigned as zeros, was also part of the dataset considered.
Volatility of the equity market was calculated based on a Generalised Auto Regressive Conditional Heteroscedasticity (GARCH) process.
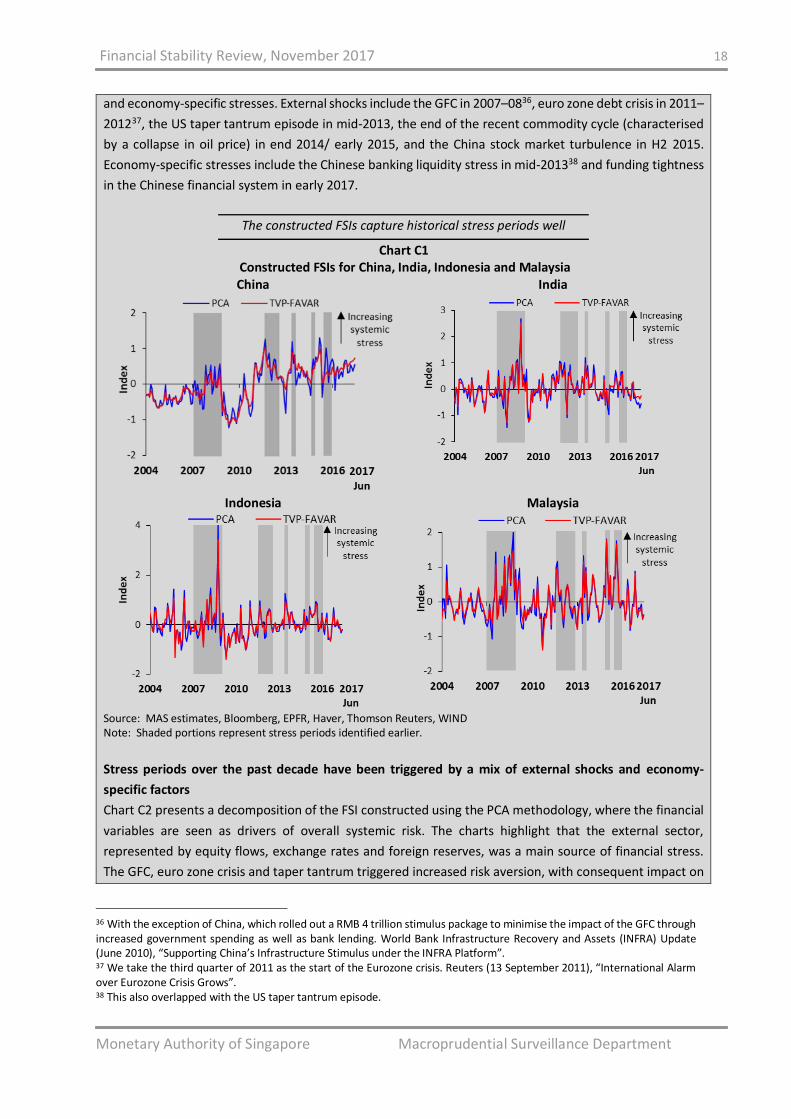
The FSIs capture historical stress periods of each economy well
Chart C1 displays the FSIs constructed for the four Asian economies based on the PCA and TVP-FAVAR
analyses described earlier. All four sets of FSIs show elevated signs of stress during both external shocks
Financial Stability Review, November 2017 18
Monetary Authority of Singapore Macroprudential Surveillance Department
and economy-specific stresses. External shocks include the GFC in 2007–0836, euro zone debt crisis in 2011–
201237, the US taper tantrum episode in mid-2013, the end of the recent commodity cycle (characterised
by a collapse in oil price) in end 2014/ early 2015, and the China stock market turbulence in H2 2015.
Economy-specific stresses include the Chinese banking liquidity stress in mid-201338 and funding tightness
in the Chinese financial system in early 2017.
The constructed FSIs capture historical stress periods well
Chart C1 Constructed FSIs for China, India, Indonesia and Malaysia China
India
Indonesia
Malaysia
Source: MAS estimates, Bloomberg, EPFR, Haver, Thomson Reuters, WIND Note: Shaded portions represent stress periods identified earlier.
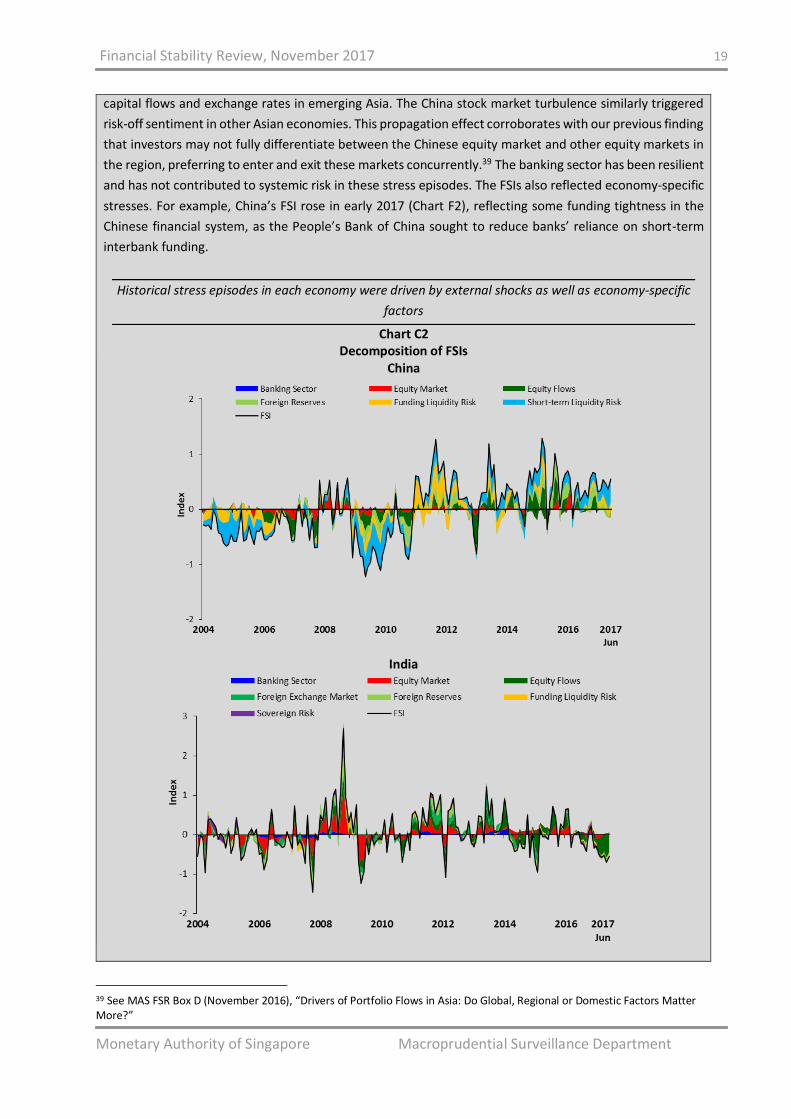
Stress periods over the past decade have been triggered by a mix of external shocks and economy-
specific factors
Chart C2 presents a decomposition of the FSI constructed using the PCA methodology, where the financial
variables are seen as drivers of overall systemic risk. The charts highlight that the external sector,
represented by equity flows, exchange rates and foreign reserves, was a main source of financial stress.
The GFC, euro zone crisis and taper tantrum triggered increased risk aversion, with consequent impact on
36 With the exception of China, which rolled out a RMB 4 trillion stimulus package to minimise the impact of the GFC through increased government spending as well as bank lending. World Bank Infrastructure Recovery and Assets (INFRA) Update (June 2010), “Supporting China’s Infrastructure Stimulus under the INFRA Platform”. 37 We take the third quarter of 2011 as the start of the Eurozone crisis. Reuters (13 September 2011), “International Alarm over Eurozone Crisis Grows”. 38 This also overlapped with the US taper tantrum episode.
Financial Stability Review, November 2017 19
Monetary Authority of Singapore Macroprudential Surveillance Department
capital flows and exchange rates in emerging Asia. The China stock market turbulence similarly triggered
risk-off sentiment in other Asian economies. This propagation effect corroborates with our previous finding
that investors may not fully differentiate between the Chinese equity market and other equity markets in
the region, preferring to enter and exit these markets concurrently.39 The banking sector has been resilient
and has not contributed to systemic risk in these stress episodes. The FSIs also reflected economy-specific
stresses. For example, China’s FSI rose in early 2017 (Chart F2), reflecting some funding tightness in the
Chinese financial system, as the People’s Bank of China sought to reduce banks’ reliance on short-term
interbank funding.
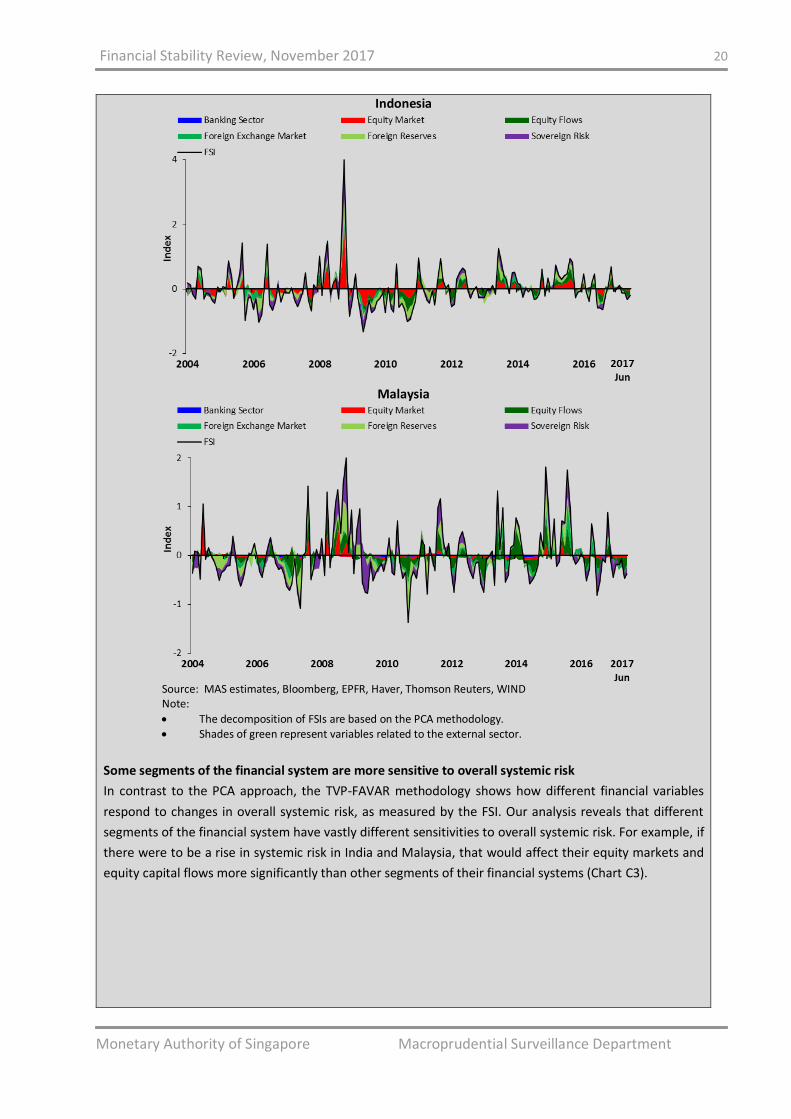
Historical stress episodes in each economy were driven by external shocks as well as economy-specific
factors
Chart C2 Decomposition of FSIs
China
India
39 See MAS FSR Box D (November 2016), “Drivers of Portfolio Flows in Asia: Do Global, Regional or Domestic Factors Matter More?”
Financial Stability Review, November 2017 20
Monetary Authority of Singapore Macroprudential Surveillance Department
Indonesia
Malaysia
Source: MAS estimates, Bloomberg, EPFR, Haver, Thomson Reuters, WIND Note:
The decomposition of FSIs are based on the PCA methodology. Shades of green represent variables related to the external sector.
Some segments of the financial system are more sensitive to overall systemic risk
In contrast to the PCA approach, the TVP-FAVAR methodology shows how different financial variables
respond to changes in overall systemic risk, as measured by the FSI. Our analysis reveals that different
segments of the financial system have vastly different sensitivities to overall systemic risk. For example, if
there were to be a rise in systemic risk in India and Malaysia, that would affect their equity markets and
equity capital flows more significantly than other segments of their financial systems (Chart C3).
Financial Stability Review, November 2017 21
Monetary Authority of Singapore Macroprudential Surveillance Department
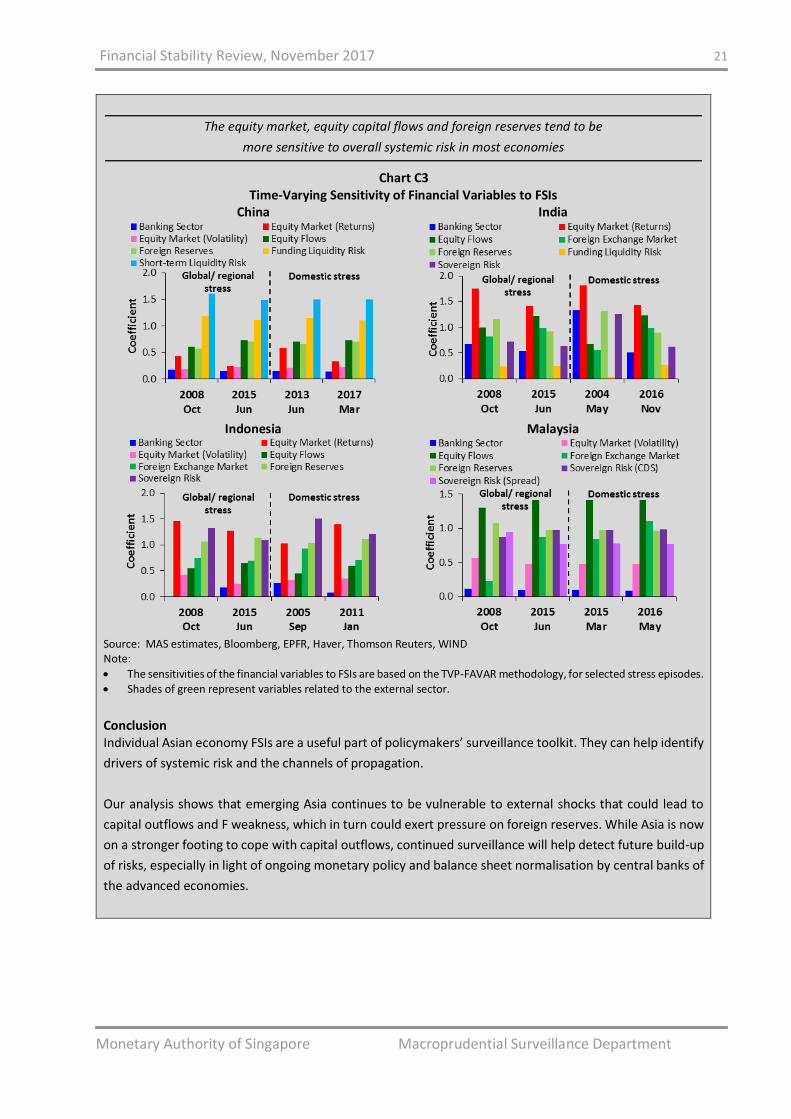
The equity market, equity capital flows and foreign reserves tend to be
more sensitive to overall systemic risk in most economies
Chart C3 Time-Varying Sensitivity of Financial Variables to FSIs
China
India
Indonesia
Malaysia
Source: MAS estimates, Bloomberg, EPFR, Haver, Thomson Reuters, WIND Note:
The sensitivities of the financial variables to FSIs are based on the TVP-FAVAR methodology, for selected stress episodes. Shades of green represent variables related to the external sector.
Conclusion Individual Asian economy FSIs are a useful part of policymakers’ surveillance toolkit. They can help identify
drivers of systemic risk and the channels of propagation.
Our analysis shows that emerging Asia continues to be vulnerable to external shocks that could lead to
capital outflows and F weakness, which in turn could exert pressure on foreign reserves. While Asia is now
on a stronger footing to cope with capital outflows, continued surveillance will help detect future build-up
of risks, especially in light of ongoing monetary policy and balance sheet normalisation by central banks of
the advanced economies.
Financial Stability Review, November 2017 22
Monetary Authority of Singapore Macroprudential Surveillance Department
Box D Drivers of Gross Capital Inflows to Asia after the Global Financial Crisis
Asia has experienced episodes of surges and reversals in capital flows after the GFC. Such volatility may
pose macroeconomic and financial stability risks for the region as a whole. Large swings in short-term
capital flows can cause disorderly fluctuations in financial markets, and in turn destabilise trade and
economic growth.
In the MAS FSR 2016, we explored the drivers of equity fund flows (a component of shorter-term capital
flows) to Asia using financial indicators. 40 In this box, we extended the analysis to (i) examine the
determinants of short- and long-term gross capital inflows to Asia post-GFC; and (ii) establish the impact
of a country’s macroeconomic variables and macroprudential policies on capital flows. We find that
macroprudential policies applied to contain the build-up of vulnerabilities could also have potential
beneficial spillovers to capital flows in the region.
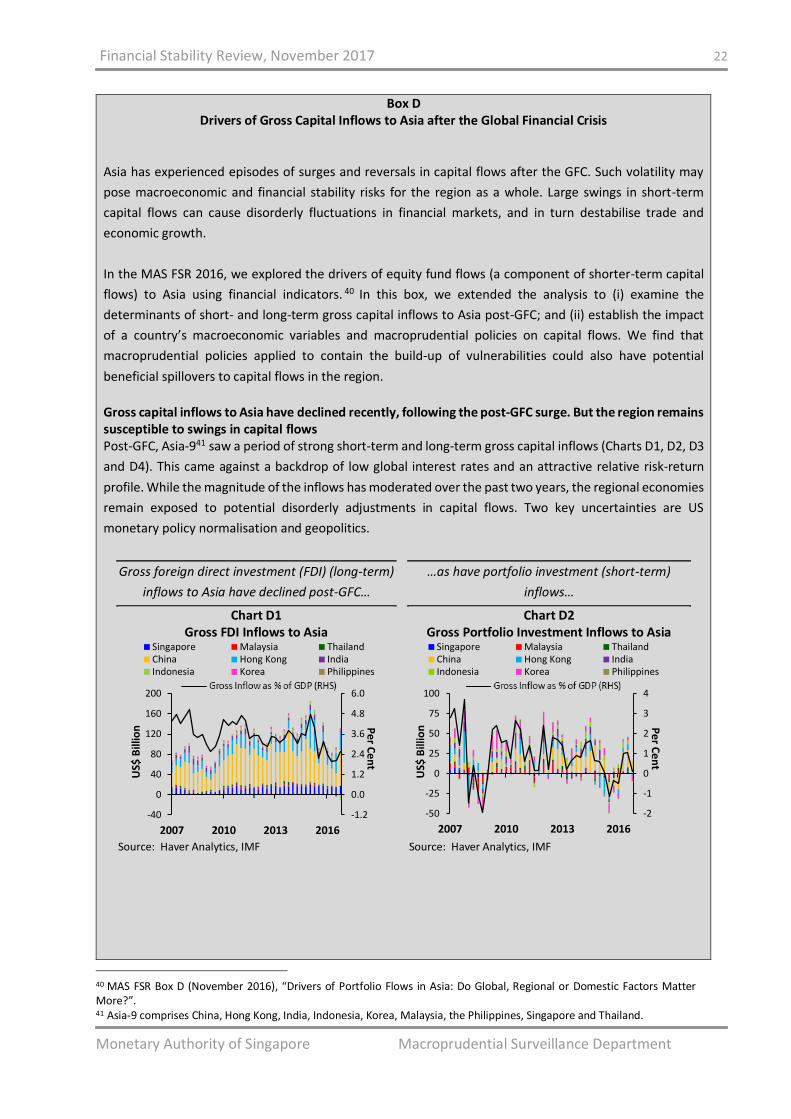
Gross capital inflows to Asia have declined recently, following the post-GFC surge. But the region remains susceptible to swings in capital flows Post-GFC, Asia-941 saw a period of strong short-term and long-term gross capital inflows (Charts D1, D2, D3
and D4). This came against a backdrop of low global interest rates and an attractive relative risk-return
profile. While the magnitude of the inflows has moderated over the past two years, the regional economies
remain exposed to potential disorderly adjustments in capital flows. Two key uncertainties are US
monetary policy normalisation and geopolitics.
Gross foreign direct investment (FDI) (long-term)
inflows to Asia have declined post-GFC…
Chart D1 Gross FDI Inflows to Asia
Source: Haver Analytics, IMF
…as have portfolio investment (short-term)
inflows…
Chart D2 Gross Portfolio Investment Inflows to Asia
Source: Haver Analytics, IMF
40 MAS FSR Box D (November 2016), “Drivers of Portfolio Flows in Asia: Do Global, Regional or Domestic Factors Matter More?”. 41 Asia-9 comprises China, Hong Kong, India, Indonesia, Korea, Malaysia, the Philippines, Singapore and Thailand.
-1.2
0.0
1.2
2.4
3.6
4.8
6.0
-40
0
40
80
120
160
200
2007 2010 2013 2016
US$
Bill
ion
Singapore Malaysia ThailandChina Hong Kong IndiaIndonesia Korea Philippines
Pe
r Ce
nt
-2
-1
0
1
2
3
4
-50
-25
0
25
50
75
100
2007 2010 2013 2016
US$
Bill
ion
Singapore Malaysia ThailandChina Hong Kong IndiaIndonesia Korea Philippines
Pe
r Ce
nt
Financial Stability Review, November 2017 23
Monetary Authority of Singapore Macroprudential Surveillance Department
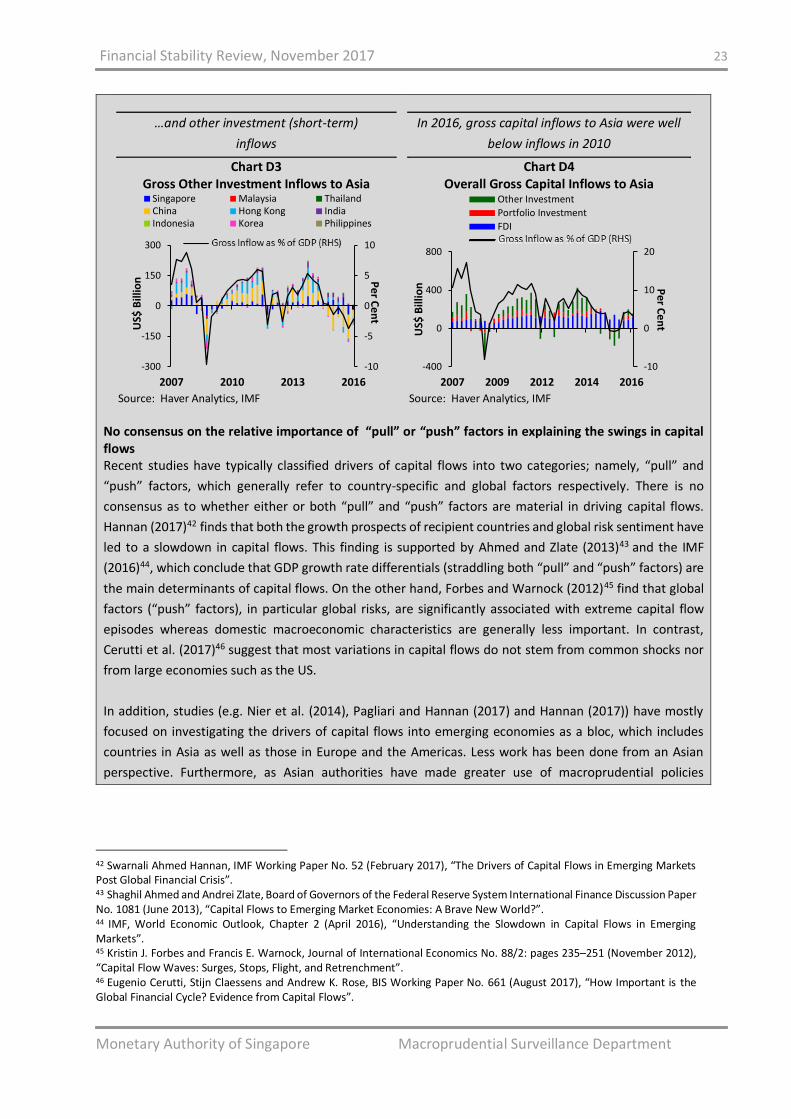
…and other investment (short-term)
inflows
Chart D3 Gross Other Investment Inflows to Asia
Source: Haver Analytics, IMF
In 2016, gross capital inflows to Asia were well
below inflows in 2010
Chart D4 Overall Gross Capital Inflows to Asia
Source: Haver Analytics, IMF
No consensus on the relative importance of “pull” or “push” factors in explaining the swings in capital flows Recent studies have typically classified drivers of capital flows into two categories; namely, “pull” and
“push” factors, which generally refer to country-specific and global factors respectively. There is no
consensus as to whether either or both “pull” and “push” factors are material in driving capital flows.
Hannan (2017)42 finds that both the growth prospects of recipient countries and global risk sentiment have
led to a slowdown in capital flows. This finding is supported by Ahmed and Zlate (2013)43 and the IMF
(2016)44, which conclude that GDP growth rate differentials (straddling both “pull” and “push” factors) are
the main determinants of capital flows. On the other hand, Forbes and Warnock (2012)45 find that global
factors (“push” factors), in particular global risks, are significantly associated with extreme capital flow
episodes whereas domestic macroeconomic characteristics are generally less important. In contrast,
Cerutti et al. (2017)46 suggest that most variations in capital flows do not stem from common shocks nor
from large economies such as the US.
In addition, studies (e.g. Nier et al. (2014), Pagliari and Hannan (2017) and Hannan (2017)) have mostly
focused on investigating the drivers of capital flows into emerging economies as a bloc, which includes
countries in Asia as well as those in Europe and the Americas. Less work has been done from an Asian
perspective. Furthermore, as Asian authorities have made greater use of macroprudential policies
42 Swarnali Ahmed Hannan, IMF Working Paper No. 52 (February 2017), “The Drivers of Capital Flows in Emerging Markets Post Global Financial Crisis”. 43 Shaghil Ahmed and Andrei Zlate, Board of Governors of the Federal Reserve System International Finance Discussion Paper No. 1081 (June 2013), “Capital Flows to Emerging Market Economies: A Brave New World?”. 44 IMF, World Economic Outlook, Chapter 2 (April 2016), “Understanding the Slowdown in Capital Flows in Emerging Markets”. 45 Kristin J. Forbes and Francis E. Warnock, Journal of International Economics No. 88/2: pages 235–251 (November 2012), “Capital Flow Waves: Surges, Stops, Flight, and Retrenchment”. 46 Eugenio Cerutti, Stijn Claessens and Andrew K. Rose, BIS Working Paper No. 661 (August 2017), “How Important is the Global Financial Cycle? Evidence from Capital Flows”.
-10
-5
0
5
10
-300
-150
0
150
300
2007 2010 2013 2016
US$
Bill
ion
Singapore Malaysia ThailandChina Hong Kong IndiaIndonesia Korea Philippines
Pe
r Ce
nt
-10
0
10
20
-400
0
400
800
2007 2009 2012 2014 2016
US$
Bill
ion
Other Investment
Portfolio Investment
FDI
Gross Inflow as % of GDP (RHS)
Pe
r Ce
nt
Financial Stability Review, November 2017 24
Monetary Authority of Singapore Macroprudential Surveillance Department
compared to their counterparts from other regions47, it would also be interesting to investigate potential
spillovers from such policies to capital flows.
Data and methodology We assessed both “pull” and “push” drivers of gross capital inflows to Asia-9 economies during the post-
GFC period, using quarterly capital flow data between Q3 2009 and Q4 2016.
The assessment was conducted using panel regressions that involved macroeconomic, financial and policy
variables (Table D1). Separate regression specifications were used for FDI, portfolio investment and other
investment inflows in order to capture potential heterogeneity in their underlying drivers.48
Table D1 List of Variables Used in Regressions
“Pull” and “Push” factors
Macroeconomic variable GDP growth differentials (Asia-9 vis-à-vis the US)
Financial variable Interest rate differentials (Asia-9 vis-à-vis the US)49
Financial / Policy variable Exchange rate movements (Asia-9 currencies vis-à-vis USD)50
“Push” factor
Financial variable Global risk aversion (proxied using VIX)
“Pull” factor Policy variable Macroprudential policies51
While GDP growth differentials are found to be the main drivers of capital flows, gross short-term inflows are more influenced by financial drivers The results from the panel regressions show that different factors are behind short- and long-term gross
capital inflows to Asia post-GFC (Table D2). GDP growth differentials appear to be significant drivers for
both short- and long-term inflows to Asia. But financial and policy-related variables, which may change
significantly within a short period of time, have had a greater influence on short-term inflows than long-
term inflows.
47 IMF, Regional Economic Outlook: Asia and Pacific, Chapter 4: pages 61 to 74 (April 2014), “Macroprudential Policy and Capital Flow Measures in Asia: Use and Effectiveness”. 48 FDI inflows/GDP, portfolio investment inflows/GDP, and other investment inflows/GDP are found to be not highly correlated. Correlation coefficients for the following pairs: i) FDI inflows/GDP and portfolio investment inflows/GDP; ii) FDI inflows/GDP and other investment inflows/GDP; and iii) portfolio investment inflows/GDP and other investment inflows/GDP, are 0.00, 0.44 and 0.30, respectively. 49 Interest rate differentials between Asia and US are estimated based on the differences between the respective Asian countries’ interbank rates and the Wu-Xia shadow federal funds rate. The shadow federal funds rate is used as it takes into account monetary conditions arising from quantitative easing in the US. 50 Measured in terms of depreciation of Asian currencies against the USD. 51 Macroprudential policies refer to policies directed at domestic macroeconomic vulnerabilities, which are unrelated to capital flows. Macroprudential policies applied from Q3 2009 to Q4 2014 are adapted from a dataset developed by Eugenio Cerutti, Ricardo Correa, Elisabetta Fiorentino and Esther Segalla, IMF Working Paper 110 (June 2016), “Changes in Prudential Policy Instruments-A New Cross-Country Database”. Macroprudential policies implemented from Q1 2015 to Q4 2016 are updated based on information from Reuters, IMF, ADB, The Financial Times, as well as the relevant government agencies’ websites and media releases. Additional macroprudential policies such as debt servicing ratios, property taxes, liquidity requirements, liquidity limits and currency-based measures have also been added to the list of policy measures in the dataset developed by Cerutti et al. (2016).
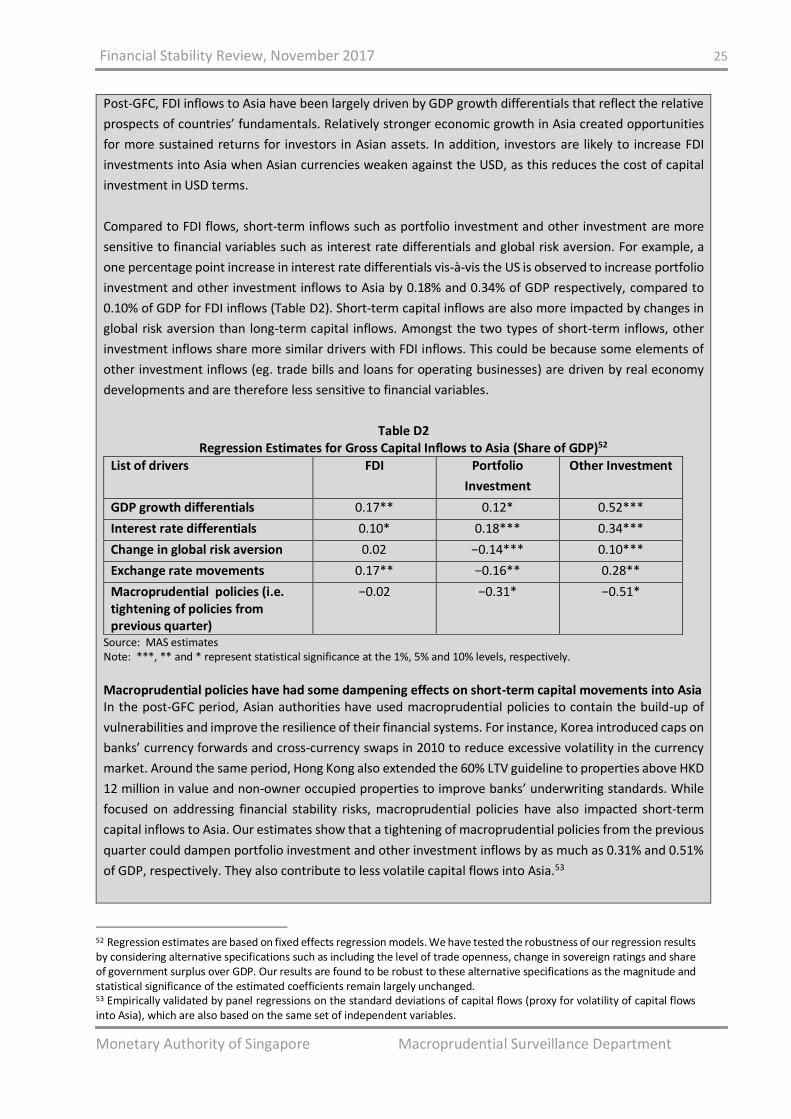
Financial Stability Review, November 2017 25
Monetary Authority of Singapore Macroprudential Surveillance Department
Post-GFC, FDI inflows to Asia have been largely driven by GDP growth differentials that reflect the relative
prospects of countries’ fundamentals. Relatively stronger economic growth in Asia created opportunities
for more sustained returns for investors in Asian assets. In addition, investors are likely to increase FDI
investments into Asia when Asian currencies weaken against the USD, as this reduces the cost of capital
investment in USD terms.
Compared to FDI flows, short-term inflows such as portfolio investment and other investment are more
sensitive to financial variables such as interest rate differentials and global risk aversion. For example, a
one percentage point increase in interest rate differentials vis-à-vis the US is observed to increase portfolio
investment and other investment inflows to Asia by 0.18% and 0.34% of GDP respectively, compared to
0.10% of GDP for FDI inflows (Table D2). Short-term capital inflows are also more impacted by changes in
global risk aversion than long-term capital inflows. Amongst the two types of short-term inflows, other
investment inflows share more similar drivers with FDI inflows. This could be because some elements of
other investment inflows (eg. trade bills and loans for operating businesses) are driven by real economy
developments and are therefore less sensitive to financial variables.
Table D2 Regression Estimates for Gross Capital Inflows to Asia (Share of GDP)52
List of drivers FDI Portfolio
Investment
Other Investment
GDP growth differentials 0.17** 0.12* 0.52***
Interest rate differentials 0.10* 0.18*** 0.34***
Change in global risk aversion 0.02 −0.14*** 0.10***
Exchange rate movements 0.17** −0.16** 0.28**
Macroprudential policies (i.e. tightening of policies from previous quarter)
−0.02 −0.31* −0.51*
Source: MAS estimates Note: ***, ** and * represent statistical significance at the 1%, 5% and 10% levels, respectively.
Macroprudential policies have had some dampening effects on short-term capital movements into Asia In the post-GFC period, Asian authorities have used macroprudential policies to contain the build-up of
vulnerabilities and improve the resilience of their financial systems. For instance, Korea introduced caps on
banks’ currency forwards and cross-currency swaps in 2010 to reduce excessive volatility in the currency
market. Around the same period, Hong Kong also extended the 60% LTV guideline to properties above HKD
12 million in value and non-owner occupied properties to improve banks’ underwriting standards. While
focused on addressing financial stability risks, macroprudential policies have also impacted short-term
capital inflows to Asia. Our estimates show that a tightening of macroprudential policies from the previous
quarter could dampen portfolio investment and other investment inflows by as much as 0.31% and 0.51%
of GDP, respectively. They also contribute to less volatile capital flows into Asia.53
52 Regression estimates are based on fixed effects regression models. We have tested the robustness of our regression results by considering alternative specifications such as including the level of trade openness, change in sovereign ratings and share of government surplus over GDP. Our results are found to be robust to these alternative specifications as the magnitude and statistical significance of the estimated coefficients remain largely unchanged. 53 Empirically validated by panel regressions on the standard deviations of capital flows (proxy for volatility of capital flows into Asia), which are also based on the same set of independent variables.
Financial Stability Review, November 2017 26
Monetary Authority of Singapore Macroprudential Surveillance Department
Implications for Asian policymakers Our findings suggest that both short- and long-term inflows are dependent on macroeconomic variables.
However, compared to long-term inflows, short-term inflows are more sensitive to financial and policy-
related variables. Looking ahead, Asian policymakers should continue to build up good fundamentals
(“pull” factors) to promote stable short- and long-term capital inflows. They could also broaden and
diversify the investor base, deepen domestic capital markets, and reduce reliance on foreign debt to
dampen volatility in short-term capital inflows caused by any changes in global risk aversion or other
external developments (“push” factors). Macroprudential policies, while principally applied to contain the
build-up of vulnerabilities, may also have a role to play in reducing the volatility of short-term inflows.
Financial Stability Review, November 2017 27
Monetary Authority of Singapore Macroprudential Surveillance Department
Box E The Behaviour of Institutional Asset Owners in Asia-10 Financial Markets:
Pro-cyclical or Counter-cyclical?
The Financial Stability Board (FSB) published in January 2017 policy recommendations to address structural
vulnerabilities from asset management activities that may pose potential financial stability risks.54 The
recommendations are timely, in light of the significant increase in asset management activities over the
past decade. Within the asset management sphere, an area pending further analysis is the investment
behaviour of institutional asset owners and its implications for financial stability.55
Efforts are underway globally to study the behaviour of institutional asset owners and their impact on
financial stability
Institutional asset owners are generally considered to be long-term investors in global capital markets, i.e.
they “buy and hold” assets through financial or economic cycles, thus contributing to financial stability.
With the growth of asset management activities globally, academics, international think-tanks and
policymakers have increasingly debated whether institutional asset owners’ behaviours are indeed
counter-cyclical, or whether they are pro-cyclical instead.56
A prolonged period of low interest rates following the GFC raises concerns for institutional asset owners.
The G30 notes that “potential long-term investors are increasingly constrained in their ability to provide
financing”.57 The IMF notes that the life insurance and pension sectors face “a formidable transitional
challenge” in the current low interest rate environment. 58 Such a headwind could potentially impair
institutional asset owners’ abilities to “buy and hold” onto risky assets during stressful market conditions.59
Evidence from studies on the behaviour of institutional asset owners have been mixed thus far, suggesting
that investor behaviour varies across regions and investor types.60 For instance, the IMF finds that portfolio
54 The four structural vulnerabilities from asset management activities are: (i) liquidity mismatch between fund investment assets and redemption terms and conditions for open-ended fund units; (ii) leverage within investment funds; (iii) operational risk and challenges in transferring investment mandates or client accounts in stressed conditions; and (iv) securities lending activities of asset managers and funds. FSB (January 2017), “Policy Recommendations to Address Structural Vulnerabilities from Asset Management Activities”. 55 We define pension funds, insurers and sovereign wealth funds (SWFs) collectively as institutional asset owners. 56 The Bank of England (BoE) Procyclicality Working Group defined “pro-cyclicality” as the tendency to invest in a way that exacerbates market movements and contributes to asset price volatility, resulting in a deepening of the troughs and an exaggeration of the peaks of asset prices or economic cycles in a way that is potentially detrimental to financial stability and long-term economic growth. 57 The G30 is a private, nonprofit, international body composed of very senior representatives of the private and public sectors and academia, that aims to deepen understanding of international economic and financial issues. G30 Working Group on Long-Term Finance (2013), “Long-term Finance and Economic Growth”. 58 In particular, profitability and solvency ratios of segments of pension funds and insurers offering guaranteed returns – largely life insurers and pension funds offering defined benefit plans – could come under pressure, as their assets are typically of shorter duration as compared to their liabilities. 59 BoE researchers have opined that the structure of regulations could impact insurers’ investment behaviour. They find that new Solvency II regulations could reduce UK life insurers’ willingness to act counter-cyclically, particularly in a falling interest rate environment. Bank Underground (September 2017), “Insurance Companies: Amplifiers or the White Knights of Financial Markets?”. 60 To date, empirical research in this area tends to have a home bias – they have focused mostly on domestic institutional asset owners’ behaviour in relation to their home asset markets, but have not concurrently considered the investment behaviour of institutional asset owners in other developed market or emerging market economies.
Financial Stability Review, November 2017 28
Monetary Authority of Singapore Macroprudential Surveillance Department
changes for US institutional asset owners typically appear pro-cyclical.61 The Bank of England (BoE) finds
some evidence of pro-cyclicality in the portfolio asset allocation behaviour of US and French insurers, and
less evidence of pro-cyclical behaviour in UK insurers.62 On the other hand, results from the European
Insurance and Occupational Pensions Authority (EIOPA) 2015 stress test exercise show that European
pension funds behaved in a counter-cyclical fashion during the GFC.63
Studies on institutional asset owners in emerging market and Asia-10 economies appear more sanguine.
The IMF finds that global institutional investors’ flows to emerging market economies are likely not pro-
cyclical.64 MAS also finds that Asia-10 asset markets with a higher proportion of institutional ownership
tended to exhibit lower price volatility.65
Against this backdrop, we assess potential drivers of institutional portfolio flows into Asia’s financial markets Studies that examine the aggregate behaviour of global institutional portfolio flows into Asia-10 economies
are fairly limited.66 We assessed potential drivers of institutional portfolio flows into Asia-10 financial
markets using data from eVestment, which tracks quarterly data on institutional mandates from global
asset managers approximating US$24 trillion in assets under management (AUM) in public markets. This
covers approximately 20% of institutional AUM held globally.67
Our panel regression to study the potential drivers of institutional portfolio flows into Asia-10 bond and
equity markets during the 2007 to 2017 period takes the following form:
𝒍𝒏(𝑭𝒍𝒐𝒘)𝒕 = 𝜶𝒕 + 𝜷𝟏𝑹𝒆𝒕𝒖𝒓𝒏𝒕−𝟏 + 𝜷𝒌𝑮𝒍𝒐𝒃𝒂𝒍 𝑽𝒐𝒍𝒂𝒕𝒊𝒍𝒊𝒕𝒚 𝒌,𝒕
where the measure for institutional portfolio flows is the natural logarithm of inflows (i.e. this measure
examines the buying behaviour of pension funds, insurers and sovereign wealth funds (SWFs)). The variable
𝐹𝑙𝑜𝑤𝑡 denotes quarterly net bond or equity inflows into Asia-10 bond or equity markets respectively. The
variable 𝑅𝑒𝑡𝑢𝑟𝑛𝑡−1 is the quarterly returns of benchmark indices (J.P. Morgan Asia Credit Index for bonds;
MSCI Emerging Markets Asia Index for equities). 𝑅𝑒𝑡𝑢𝑟𝑛𝑡−1 is used to examine momentum behaviour (i.e.
61 Bradley A. Jones (February 2016), “Institutionalizing Countercyclical Investment: A Framework for Long-term Asset Owners”. Papaioannou, M. J.Park, J. Pihlman, and H. Hoorn, (2014), “Procyclical Behaviour of Institutional Investors During the Recent Financial Crisis”. 62 Procyclicality Working Group (July 2014), “Procyclicality and Structural Trends in Investment Allocation by Insurance Companies and Pension Funds”. 63 EIOPA (2015), “IORPs Stress Test Report 2015”. 64 The IMF finds that institutional portfolio flows to emerging market economies did not engage in returns-chasing behaviour (i.e. not pro-cyclical). In IMF’s study, the dependent variable is net bond or equity inflows into a particular emerging market economy, and their study covers a subset of Asia-10 markets. IMF’s data on institutional portfolio flows was sourced from custodian bank data. IMF GFSR Chapter 2 (April 2014), “How Do Changes in the Investor Base and Financial Deepening Affect Emerging Market Economies?”. 65 MAS finds that institutional investors tend to have a market-stabilising effect on Asia-10 asset markets. In MAS’ study, the dependent variable is the price volatility of Asia-10 asset markets. MAS’ data on annual institutional portfolio holdings was compiled from publicly available sources and estimated using widely-used asset class benchmarks. MAS FSR Box B (November 2016), “The Impact of Open-ended Funds and Other Institutional Asset Owners on Asia’s Asset Markets”. 66 IMF GFSR Chapter 2 (April 2014), “How Do Changes in the Investor Base and Financial Deepening Affect Emerging Market Economies?” MAS FSR Box B (November 2016), “The Impact of Open-ended Funds and Other Institutional Asset Owners on Asia’s Asset Markets”. 67 In estimating institutional AUM held globally, we used data from Willis Towers Watson, OECD and the Sovereign Wealth Fund Institute.
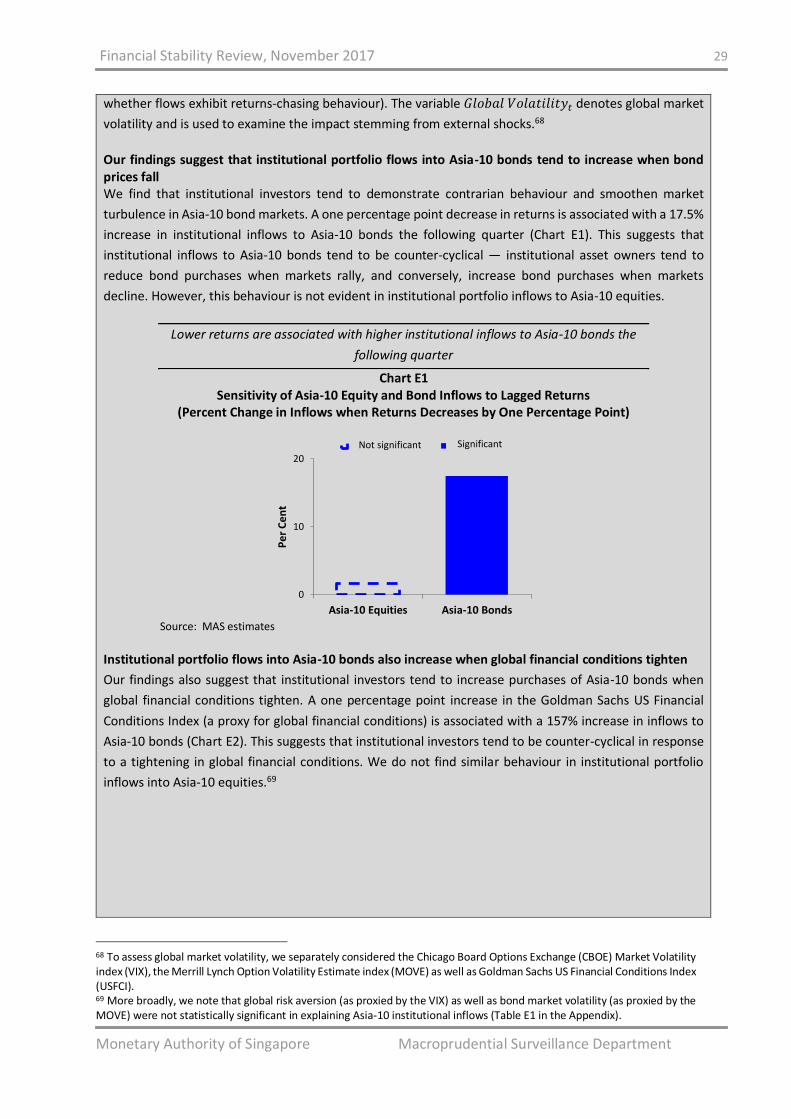
Financial Stability Review, November 2017 29
Monetary Authority of Singapore Macroprudential Surveillance Department
whether flows exhibit returns-chasing behaviour). The variable 𝐺𝑙𝑜𝑏𝑎𝑙 𝑉𝑜𝑙𝑎𝑡𝑖𝑙𝑖𝑡𝑦𝑡 denotes global market
volatility and is used to examine the impact stemming from external shocks.68
Our findings suggest that institutional portfolio flows into Asia-10 bonds tend to increase when bond prices fall We find that institutional investors tend to demonstrate contrarian behaviour and smoothen market
turbulence in Asia-10 bond markets. A one percentage point decrease in returns is associated with a 17.5%
increase in institutional inflows to Asia-10 bonds the following quarter (Chart E1). This suggests that
institutional inflows to Asia-10 bonds tend to be counter-cyclical — institutional asset owners tend to
reduce bond purchases when markets rally, and conversely, increase bond purchases when markets
decline. However, this behaviour is not evident in institutional portfolio inflows to Asia-10 equities.
Lower returns are associated with higher institutional inflows to Asia-10 bonds the
following quarter
Chart E1 Sensitivity of Asia-10 Equity and Bond Inflows to Lagged Returns
(Percent Change in Inflows when Returns Decreases by One Percentage Point)
Source: MAS estimates
Institutional portfolio flows into Asia-10 bonds also increase when global financial conditions tighten
Our findings also suggest that institutional investors tend to increase purchases of Asia-10 bonds when
global financial conditions tighten. A one percentage point increase in the Goldman Sachs US Financial
Conditions Index (a proxy for global financial conditions) is associated with a 157% increase in inflows to
Asia-10 bonds (Chart E2). This suggests that institutional investors tend to be counter-cyclical in response
to a tightening in global financial conditions. We do not find similar behaviour in institutional portfolio
inflows into Asia-10 equities.69
68 To assess global market volatility, we separately considered the Chicago Board Options Exchange (CBOE) Market Volatility index (VIX), the Merrill Lynch Option Volatility Estimate index (MOVE) as well as Goldman Sachs US Financial Conditions Index (USFCI). 69 More broadly, we note that global risk aversion (as proxied by the VIX) as well as bond market volatility (as proxied by the MOVE) were not statistically significant in explaining Asia-10 institutional inflows (Table E1 in the Appendix).
0
10
20
Asia-10 Equities Asia-10 Bonds
Pe
r C
en
t
Asia-10 Equities Asia-10 BondsNot significant Significant
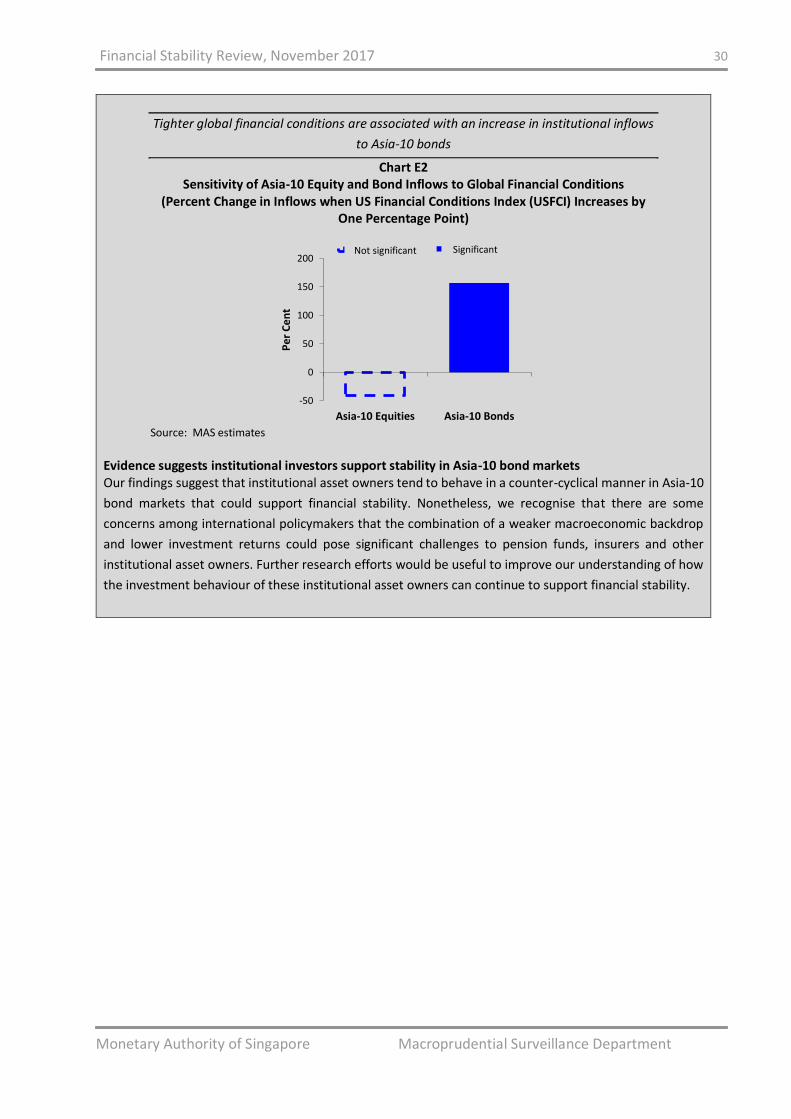
Financial Stability Review, November 2017 30
Monetary Authority of Singapore Macroprudential Surveillance Department
Tighter global financial conditions are associated with an increase in institutional inflows
to Asia-10 bonds
Chart E2 Sensitivity of Asia-10 Equity and Bond Inflows to Global Financial Conditions
(Percent Change in Inflows when US Financial Conditions Index (USFCI) Increases by One Percentage Point)
Source: MAS estimates
Evidence suggests institutional investors support stability in Asia-10 bond markets Our findings suggest that institutional asset owners tend to behave in a counter-cyclical manner in Asia-10
bond markets that could support financial stability. Nonetheless, we recognise that there are some
concerns among international policymakers that the combination of a weaker macroeconomic backdrop
and lower investment returns could pose significant challenges to pension funds, insurers and other
institutional asset owners. Further research efforts would be useful to improve our understanding of how
the investment behaviour of these institutional asset owners can continue to support financial stability.
-50
0
50
100
150
200
Asia-10 Equities Asia-10 Bonds
Pe
r C
en
t
Asia-10 Equities Asia-10 BondsNot significant Significant
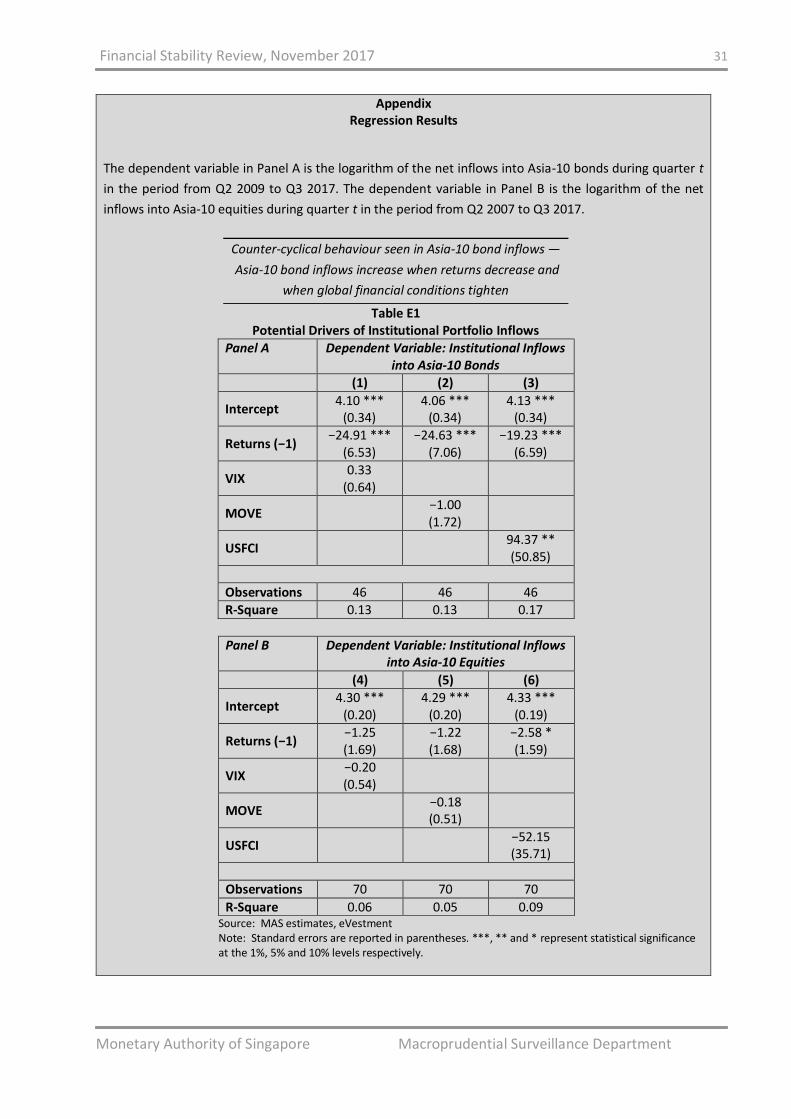
Financial Stability Review, November 2017 31
Monetary Authority of Singapore Macroprudential Surveillance Department
Appendix Regression Results
The dependent variable in Panel A is the logarithm of the net inflows into Asia-10 bonds during quarter t
in the period from Q2 2009 to Q3 2017. The dependent variable in Panel B is the logarithm of the net
inflows into Asia-10 equities during quarter t in the period from Q2 2007 to Q3 2017.
Counter-cyclical behaviour seen in Asia-10 bond inflows —
Asia-10 bond inflows increase when returns decrease and
when global financial conditions tighten
Table E1 Potential Drivers of Institutional Portfolio Inflows
Panel A Dependent Variable: Institutional Inflows into Asia-10 Bonds
(1) (2) (3)
Intercept 4.10 ***
(0.34) 4.06 ***
(0.34) 4.13 ***
(0.34)
Returns (−1) −24.91 ***
(6.53) −24.63 ***
(7.06) −19.23 ***
(6.59)
VIX 0.33
(0.64)
MOVE −1.00 (1.72)
USFCI 94.37 ** (50.85)
Observations 46 46 46 R-Square 0.13 0.13 0.17
Panel B Dependent Variable: Institutional Inflows into Asia-10 Equities
(4) (5) (6)
Intercept 4.30 ***
(0.20) 4.29 ***
(0.20) 4.33 ***
(0.19)
Returns (−1) −1.25 (1.69)
−1.22 (1.68)
−2.58 * (1.59)
VIX −0.20 (0.54)
MOVE −0.18 (0.51)
USFCI −52.15 (35.71)
Observations 70 70 70
R-Square 0.06 0.05 0.09 Source: MAS estimates, eVestment Note: Standard errors are reported in parentheses. ***, ** and * represent statistical significance at the 1%, 5% and 10% levels respectively.
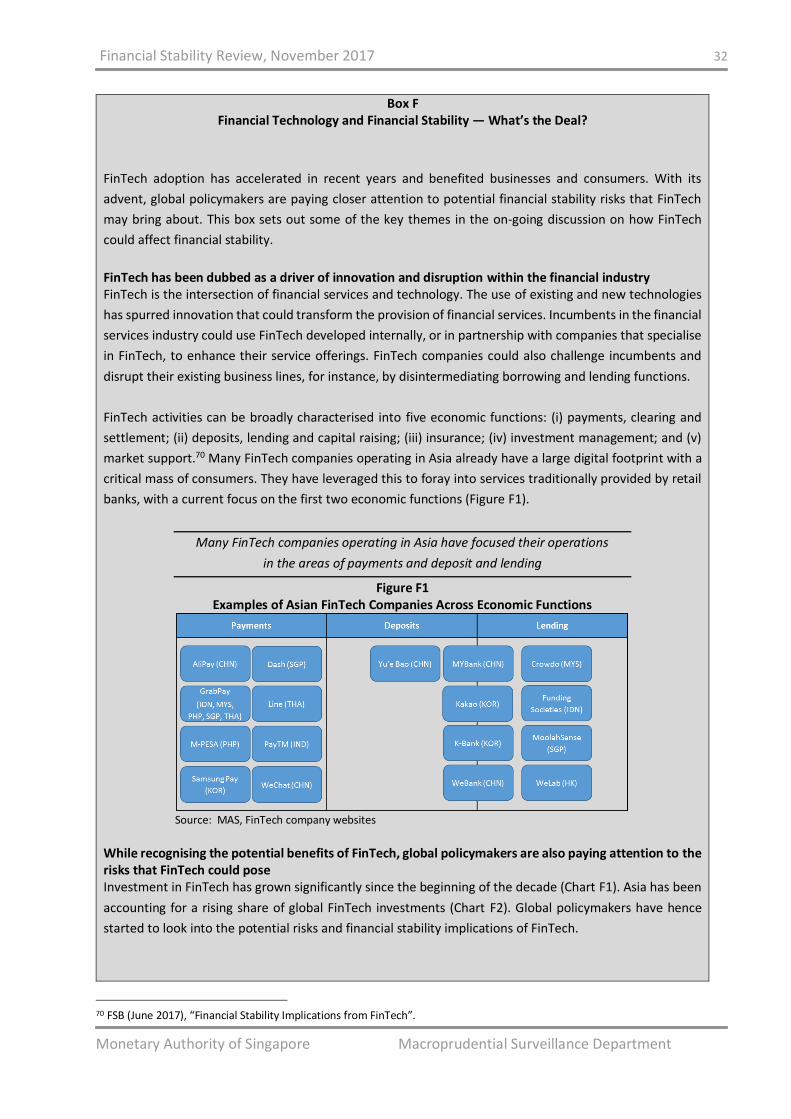
Financial Stability Review, November 2017 32
Monetary Authority of Singapore Macroprudential Surveillance Department
Box F Financial Technology and Financial Stability — What’s the Deal?
FinTech adoption has accelerated in recent years and benefited businesses and consumers. With its
advent, global policymakers are paying closer attention to potential financial stability risks that FinTech
may bring about. This box sets out some of the key themes in the on-going discussion on how FinTech
could affect financial stability.
FinTech has been dubbed as a driver of innovation and disruption within the financial industry FinTech is the intersection of financial services and technology. The use of existing and new technologies
has spurred innovation that could transform the provision of financial services. Incumbents in the financial
services industry could use FinTech developed internally, or in partnership with companies that specialise
in FinTech, to enhance their service offerings. FinTech companies could also challenge incumbents and
disrupt their existing business lines, for instance, by disintermediating borrowing and lending functions.
FinTech activities can be broadly characterised into five economic functions: (i) payments, clearing and
settlement; (ii) deposits, lending and capital raising; (iii) insurance; (iv) investment management; and (v)
market support.70 Many FinTech companies operating in Asia already have a large digital footprint with a
critical mass of consumers. They have leveraged this to foray into services traditionally provided by retail
banks, with a current focus on the first two economic functions (Figure F1).
Many FinTech companies operating in Asia have focused their operations
in the areas of payments and deposit and lending
Figure F1 Examples of Asian FinTech Companies Across Economic Functions
Source: MAS, FinTech company websites
While recognising the potential benefits of FinTech, global policymakers are also paying attention to the risks that FinTech could pose Investment in FinTech has grown significantly since the beginning of the decade (Chart F1). Asia has been
accounting for a rising share of global FinTech investments (Chart F2). Global policymakers have hence
started to look into the potential risks and financial stability implications of FinTech.
70 FSB (June 2017), “Financial Stability Implications from FinTech”.
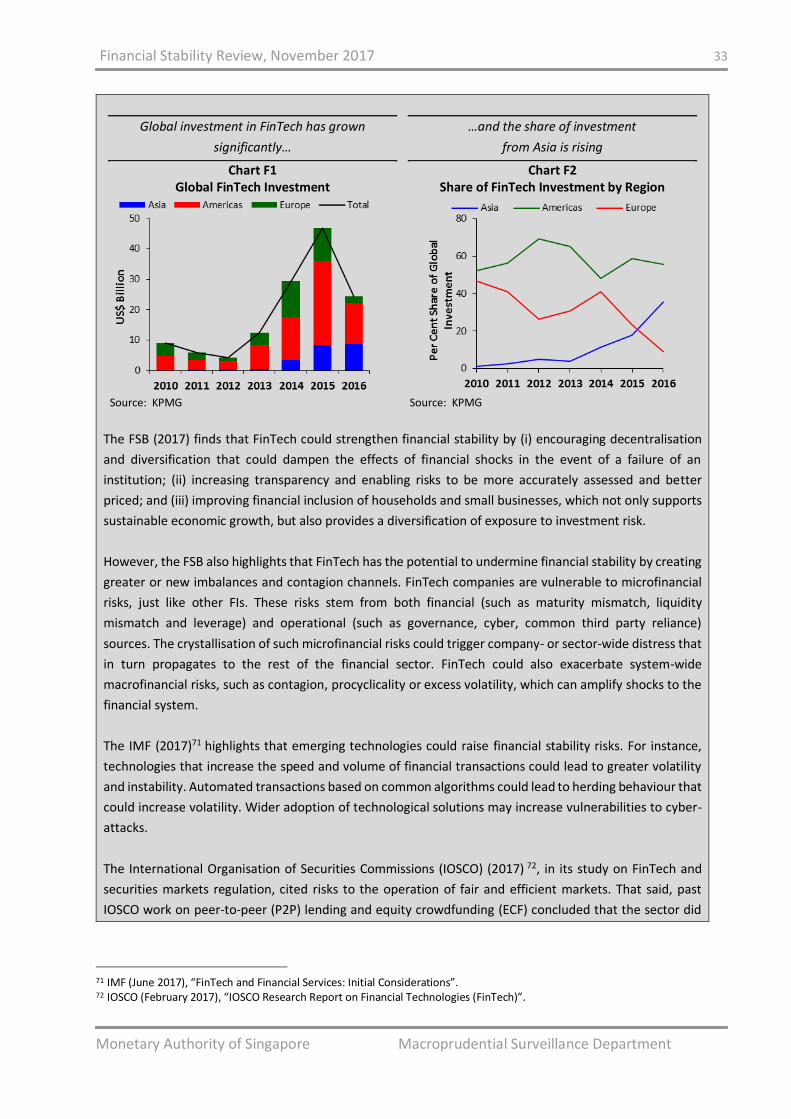
Financial Stability Review, November 2017 33
Monetary Authority of Singapore Macroprudential Surveillance Department
Global investment in FinTech has grown
significantly…
Chart F1 Global FinTech Investment
Source: KPMG
…and the share of investment
from Asia is rising
Chart F2 Share of FinTech Investment by Region
Source: KPMG
The FSB (2017) finds that FinTech could strengthen financial stability by (i) encouraging decentralisation
and diversification that could dampen the effects of financial shocks in the event of a failure of an
institution; (ii) increasing transparency and enabling risks to be more accurately assessed and better
priced; and (iii) improving financial inclusion of households and small businesses, which not only supports
sustainable economic growth, but also provides a diversification of exposure to investment risk.
However, the FSB also highlights that FinTech has the potential to undermine financial stability by creating
greater or new imbalances and contagion channels. FinTech companies are vulnerable to microfinancial
risks, just like other FIs. These risks stem from both financial (such as maturity mismatch, liquidity
mismatch and leverage) and operational (such as governance, cyber, common third party reliance)
sources. The crystallisation of such microfinancial risks could trigger company- or sector-wide distress that
in turn propagates to the rest of the financial sector. FinTech could also exacerbate system-wide
macrofinancial risks, such as contagion, procyclicality or excess volatility, which can amplify shocks to the
financial system.
The IMF (2017)71 highlights that emerging technologies could raise financial stability risks. For instance,
technologies that increase the speed and volume of financial transactions could lead to greater volatility
and instability. Automated transactions based on common algorithms could lead to herding behaviour that
could increase volatility. Wider adoption of technological solutions may increase vulnerabilities to cyber-
attacks.
The International Organisation of Securities Commissions (IOSCO) (2017) 72, in its study on FinTech and
securities markets regulation, cited risks to the operation of fair and efficient markets. That said, past
IOSCO work on peer-to-peer (P2P) lending and equity crowdfunding (ECF) concluded that the sector did
71 IMF (June 2017), “FinTech and Financial Services: Initial Considerations”. 72 IOSCO (February 2017), “IOSCO Research Report on Financial Technologies (FinTech)”.
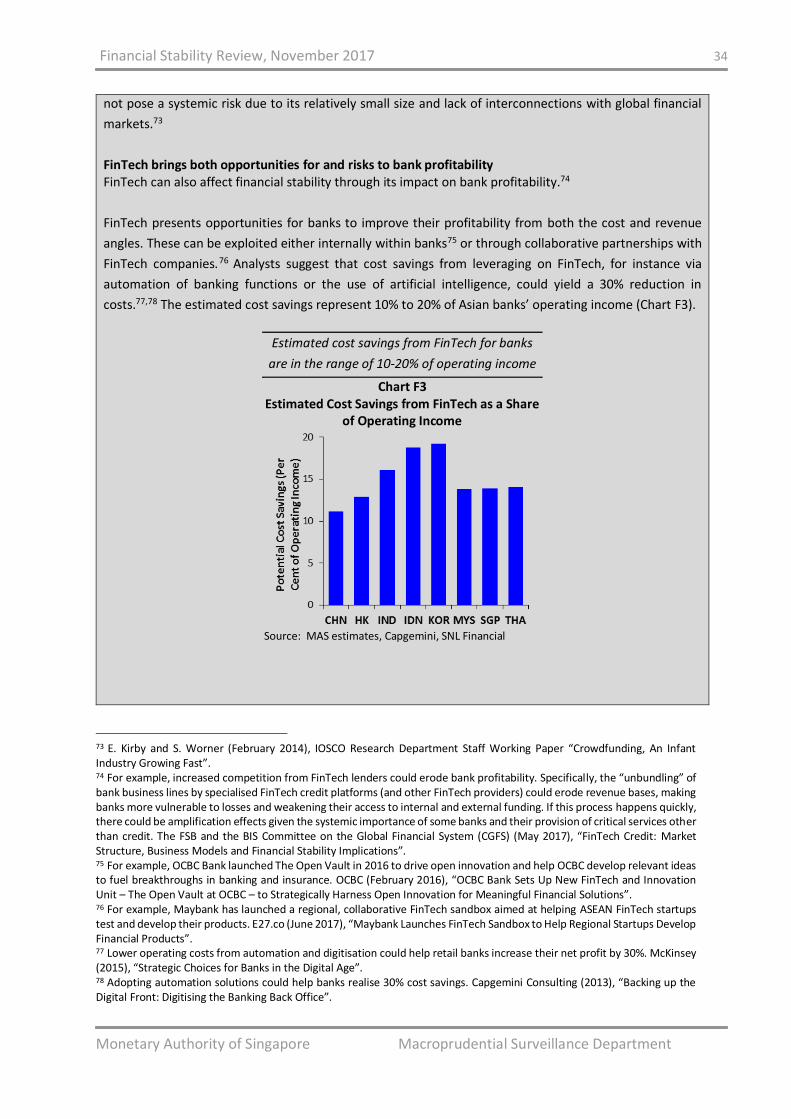
Financial Stability Review, November 2017 34
Monetary Authority of Singapore Macroprudential Surveillance Department
not pose a systemic risk due to its relatively small size and lack of interconnections with global financial
markets.73
FinTech brings both opportunities for and risks to bank profitability FinTech can also affect financial stability through its impact on bank profitability.74
FinTech presents opportunities for banks to improve their profitability from both the cost and revenue
angles. These can be exploited either internally within banks75 or through collaborative partnerships with
FinTech companies.76 Analysts suggest that cost savings from leveraging on FinTech, for instance via
automation of banking functions or the use of artificial intelligence, could yield a 30% reduction in
costs.77,78 The estimated cost savings represent 10% to 20% of Asian banks’ operating income (Chart F3).
Estimated cost savings from FinTech for banks
are in the range of 10-20% of operating income
Chart F3 Estimated Cost Savings from FinTech as a Share
of Operating Income
Source: MAS estimates, Capgemini, SNL Financial
73 E. Kirby and S. Worner (February 2014), IOSCO Research Department Staff Working Paper “Crowdfunding, An Infant Industry Growing Fast”. 74 For example, increased competition from FinTech lenders could erode bank profitability. Specifically, the “unbundling” of bank business lines by specialised FinTech credit platforms (and other FinTech providers) could erode revenue bases, making banks more vulnerable to losses and weakening their access to internal and external funding. If this process happens quickly, there could be amplification effects given the systemic importance of some banks and their provision of critical services other than credit. The FSB and the BIS Committee on the Global Financial System (CGFS) (May 2017), “FinTech Credit: Market Structure, Business Models and Financial Stability Implications”. 75 For example, OCBC Bank launched The Open Vault in 2016 to drive open innovation and help OCBC develop relevant ideas to fuel breakthroughs in banking and insurance. OCBC (February 2016), “OCBC Bank Sets Up New FinTech and Innovation Unit – The Open Vault at OCBC – to Strategically Harness Open Innovation for Meaningful Financial Solutions”. 76 For example, Maybank has launched a regional, collaborative FinTech sandbox aimed at helping ASEAN FinTech startups test and develop their products. E27.co (June 2017), “Maybank Launches FinTech Sandbox to Help Regional Startups Develop Financial Products”. 77 Lower operating costs from automation and digitisation could help retail banks increase their net profit by 30%. McKinsey (2015), “Strategic Choices for Banks in the Digital Age”. 78 Adopting automation solutions could help banks realise 30% cost savings. Capgemini Consulting (2013), “Backing up the Digital Front: Digitising the Banking Back Office”.
Financial Stability Review, November 2017 35
Monetary Authority of Singapore Macroprudential Surveillance Department
FinTech also facilitates potential revenue growth for banks, for instance through reaching out to new
customers via mobile services, especially in countries with relatively lower financial inclusion. 79 As an
example, DBS Digibank has leveraged on FinTech to create a mobile-led bank for more effective and
cheaper market access in India and Indonesia.80 The move towards cashless payments could also benefit
banks, if such digital payment platforms are linked to bank-issued cards.81 McKinsey (2015) estimates that
increased revenues from innovative new offers and business models could increase banks’ net profits by
5%. Furthermore, increased revenues from new products, distinctive digital sales and using data to cross-
sell products could increase banks’ net profits by a further 10%.82
However, FinTech can also disrupt banks’ businesses if banks do not adequately position themselves for
the onslaught of new technologies. The potential erosion of bank income from FinTech competition could
result in weaker banks. This could in turn pose financial stability concerns.
In addition, financial stability risks may increase if banks were to engage in riskier activities in the face of
FinTech competition. Technology- and cyber-related risks could also increase, if for instance, banks use
new technologies but do not manage the attendant risks adequately.
More work needs to be done to assess the financial stability implications of FinTech on banks. The following
box provides an assessment of the potential impact of FinTech on bank profitability in Asia (See Box G “As
the Twain Meet: Analysing the Impact of Financial Technology on Asian Banks’ Payments, Deposit and
Lending Businesses”).
Conclusion Just as FinTech companies work to resolve pain points for consumers of financial services, it is equally
important for policymakers and the industry to work together to identify potential systemic pain points
that may inadvertently arise from FinTech adoption. Only then can FinTech serve as a sustainable driver of
improvements to the financial services industry.
79 PWC (August 2016), “The Un(der)banked is FinTech’s Largest Opportunity”. 80 DBS (August 2017), “DBS Launches Digibank, an Entire Bank in the Phone, in Indonesia”. 81 Business Times (September 2017), “Cashless Payment Trend ‘May Profit Banks’”. 82 McKinsey (2015), “Strategic Choices for Banks in the Digital Age”.
Financial Stability Review, November 2017 36
Monetary Authority of Singapore Macroprudential Surveillance Department
Box G As the Twain Meet: Analysing the Impact of Financial Technology on Asian Banks’ Payments, Deposit
and Lending Businesses
With burgeoning FinTech development and adoption, questions have been raised as to whether FinTech
poses a competitive threat to banks and their existing business models. This is especially pertinent in light
of ongoing concerns about bank profitability and the implications for financial stability.
Research on the potential risks of FinTech to banks is still nascent (See Box F “Financial Technology and
Financial Stability — What’s the Deal?”). Most studies have been conducted at the broad financial sector
level, qualitative in nature and with little focus on Asian banks.
This box assesses the extent to which FinTech companies could disintermediate Asian banks and erode
their operating income over the next five years. We find that the FinTech challenge is generally more
significant in the payments than in the deposit and lending business. This is especially so for banks in Hong
Kong, Korea and Singapore, given their greater reliance on payment fee income.83 Banks can, however,
overcome FinTech disintermediation by building digital capabilities and integrating them into their business
models.
FinTech is beginning to disrupt banks’ dominance in financial intermediation, but its impact would likely vary across business lines Banks play a dominant role in financial intermediation in Asia. However, FinTech companies are beginning
to offer services that disintermediate banking services. The competitive threat and its corresponding
impact is expected to vary across business lines. Analysts have highlighted that there is relatively more
FinTech investment and hence, competition in retail and consumer banking, especially in the areas of
deposit-taking, lending and payments.84 This view is corroborated by our discussions with banks that
operate in Asia. Our study therefore focuses on the impact of FinTech on banks’ operating income in these
areas.
Data and methodology Our study estimated the potential reduction in banks’ payment fee income and net interest income owing
to disintermediation by FinTech companies. The analysis is based on a downside scenario where banks fail
to take mitigating actions to address the competition.
83 This could be due to higher credit card penetration rates in these economies. 84 McKinsey (September 2015), “The Fight for the Customer: McKinsey Global Banking Annual Review 2015”. In addition, these areas attract larger investment amounts compared to other banking business lines, measured by dollar invested in private FinTech companies. Citi Global Perspectives and Solutions (March 2016), “Digital Disruption: How FinTech is Forcing Banking to a Tipping Point”. McKinsey has also observed that “payments represent the beachhead for the entire banking relationship, and this beachhead is under attack”. McKinsey (May 2014), “Winning the Beachhead”.
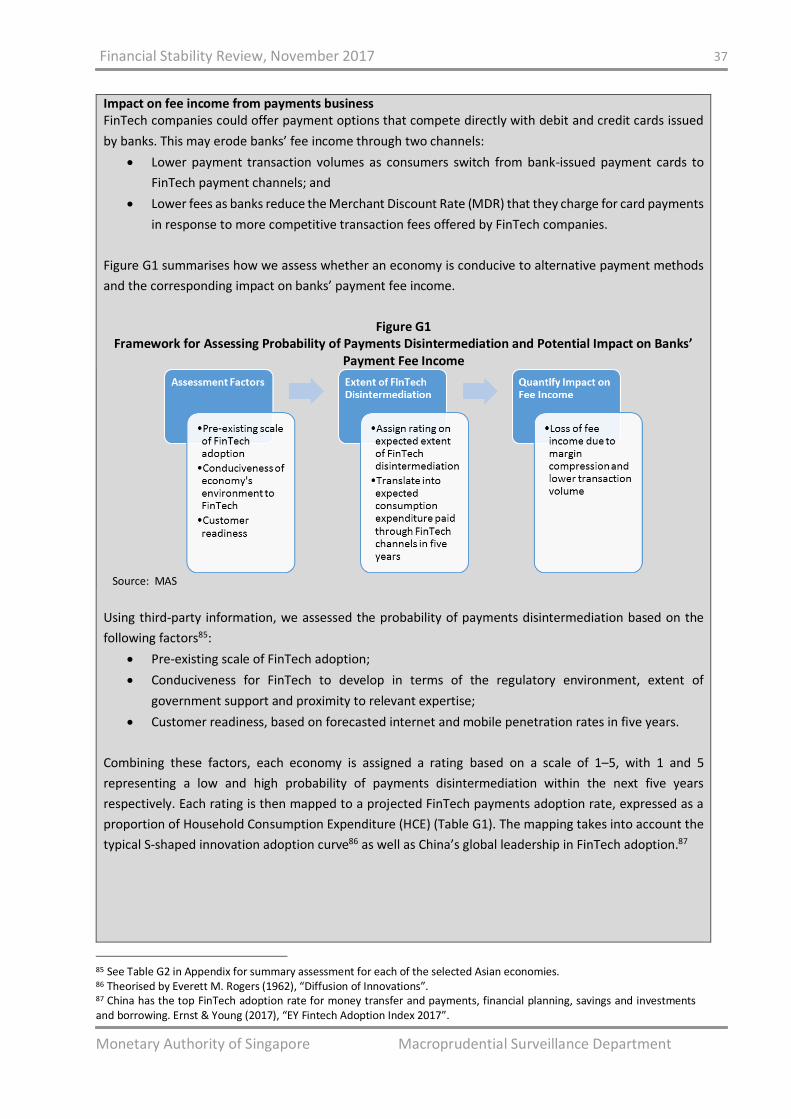
Financial Stability Review, November 2017 37
Monetary Authority of Singapore Macroprudential Surveillance Department
Impact on fee income from payments business FinTech companies could offer payment options that compete directly with debit and credit cards issued
by banks. This may erode banks’ fee income through two channels:
Lower payment transaction volumes as consumers switch from bank-issued payment cards to
FinTech payment channels; and
Lower fees as banks reduce the Merchant Discount Rate (MDR) that they charge for card payments
in response to more competitive transaction fees offered by FinTech companies.
Figure G1 summarises how we assess whether an economy is conducive to alternative payment methods
and the corresponding impact on banks’ payment fee income.
Figure G1 Framework for Assessing Probability of Payments Disintermediation and Potential Impact on Banks’
Payment Fee Income
Source: MAS
Using third-party information, we assessed the probability of payments disintermediation based on the
following factors85:
Pre-existing scale of FinTech adoption;
Conduciveness for FinTech to develop in terms of the regulatory environment, extent of
government support and proximity to relevant expertise;
Customer readiness, based on forecasted internet and mobile penetration rates in five years.
Combining these factors, each economy is assigned a rating based on a scale of 1–5, with 1 and 5
representing a low and high probability of payments disintermediation within the next five years
respectively. Each rating is then mapped to a projected FinTech payments adoption rate, expressed as a
proportion of Household Consumption Expenditure (HCE) (Table G1). The mapping takes into account the
typical S-shaped innovation adoption curve86 as well as China’s global leadership in FinTech adoption.87
85 See Table G2 in Appendix for summary assessment for each of the selected Asian economies. 86 Theorised by Everett M. Rogers (1962), “Diffusion of Innovations”. 87 China has the top FinTech adoption rate for money transfer and payments, financial planning, savings and investments and borrowing. Ernst & Young (2017), “EY Fintech Adoption Index 2017”.
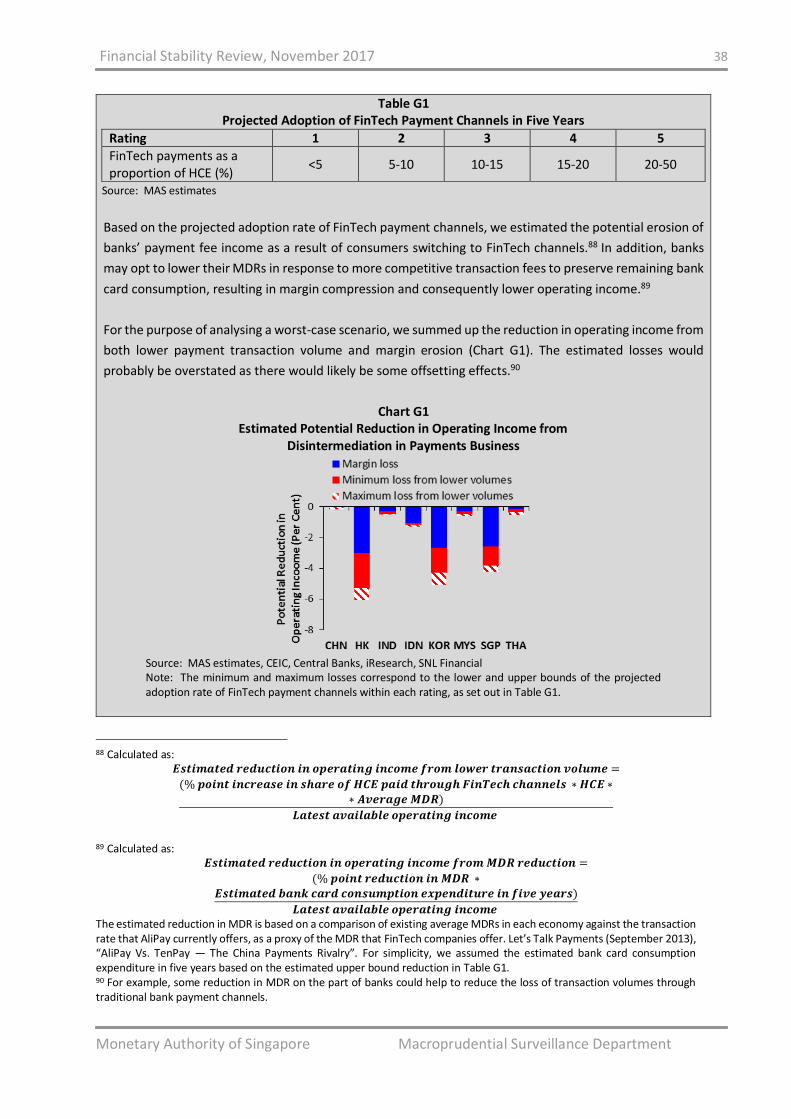
Financial Stability Review, November 2017 38
Monetary Authority of Singapore Macroprudential Surveillance Department
Table G1 Projected Adoption of FinTech Payment Channels in Five Years
Rating 1 2 3 4 5
FinTech payments as a proportion of HCE (%)
<5 5-10 10-15 15-20 20-50
Source: MAS estimates
Based on the projected adoption rate of FinTech payment channels, we estimated the potential erosion of
banks’ payment fee income as a result of consumers switching to FinTech channels.88 In addition, banks
may opt to lower their MDRs in response to more competitive transaction fees to preserve remaining bank
card consumption, resulting in margin compression and consequently lower operating income.89
For the purpose of analysing a worst-case scenario, we summed up the reduction in operating income from
both lower payment transaction volume and margin erosion (Chart G1). The estimated losses would
probably be overstated as there would likely be some offsetting effects.90
Chart G1 Estimated Potential Reduction in Operating Income from
Disintermediation in Payments Business
Source: MAS estimates, CEIC, Central Banks, iResearch, SNL Financial Note: The minimum and maximum losses correspond to the lower and upper bounds of the projected adoption rate of FinTech payment channels within each rating, as set out in Table G1.
88 Calculated as:
𝑬𝒔𝒕𝒊𝒎𝒂𝒕𝒆𝒅 𝒓𝒆𝒅𝒖𝒄𝒕𝒊𝒐𝒏 𝒊𝒏 𝒐𝒑𝒆𝒓𝒂𝒕𝒊𝒏𝒈 𝒊𝒏𝒄𝒐𝒎𝒆 𝒇𝒓𝒐𝒎 𝒍𝒐𝒘𝒆𝒓 𝒕𝒓𝒂𝒏𝒔𝒂𝒄𝒕𝒊𝒐𝒏 𝒗𝒐𝒍𝒖𝒎𝒆 =
(% 𝒑𝒐𝒊𝒏𝒕 𝒊𝒏𝒄𝒓𝒆𝒂𝒔𝒆 𝒊𝒏 𝒔𝒉𝒂𝒓𝒆 𝒐𝒇 𝑯𝑪𝑬 𝒑𝒂𝒊𝒅 𝒕𝒉𝒓𝒐𝒖𝒈𝒉 𝑭𝒊𝒏𝑻𝒆𝒄𝒉 𝒄𝒉𝒂𝒏𝒏𝒆𝒍𝒔 ∗ 𝑯𝑪𝑬 ∗∗ 𝑨𝒗𝒆𝒓𝒂𝒈𝒆 𝑴𝑫𝑹)
𝑳𝒂𝒕𝒆𝒔𝒕 𝒂𝒗𝒂𝒊𝒍𝒂𝒃𝒍𝒆 𝒐𝒑𝒆𝒓𝒂𝒕𝒊𝒏𝒈 𝒊𝒏𝒄𝒐𝒎𝒆
89 Calculated as:
𝑬𝒔𝒕𝒊𝒎𝒂𝒕𝒆𝒅 𝒓𝒆𝒅𝒖𝒄𝒕𝒊𝒐𝒏 𝒊𝒏 𝒐𝒑𝒆𝒓𝒂𝒕𝒊𝒏𝒈 𝒊𝒏𝒄𝒐𝒎𝒆 𝒇𝒓𝒐𝒎 𝑴𝑫𝑹 𝒓𝒆𝒅𝒖𝒄𝒕𝒊𝒐𝒏 =
(% 𝒑𝒐𝒊𝒏𝒕 𝒓𝒆𝒅𝒖𝒄𝒕𝒊𝒐𝒏 𝒊𝒏 𝑴𝑫𝑹 ∗𝑬𝒔𝒕𝒊𝒎𝒂𝒕𝒆𝒅 𝒃𝒂𝒏𝒌 𝒄𝒂𝒓𝒅 𝒄𝒐𝒏𝒔𝒖𝒎𝒑𝒕𝒊𝒐𝒏 𝒆𝒙𝒑𝒆𝒏𝒅𝒊𝒕𝒖𝒓𝒆 𝒊𝒏 𝒇𝒊𝒗𝒆 𝒚𝒆𝒂𝒓𝒔)
𝑳𝒂𝒕𝒆𝒔𝒕 𝒂𝒗𝒂𝒊𝒍𝒂𝒃𝒍𝒆 𝒐𝒑𝒆𝒓𝒂𝒕𝒊𝒏𝒈 𝒊𝒏𝒄𝒐𝒎𝒆
The estimated reduction in MDR is based on a comparison of existing average MDRs in each economy against the transaction rate that AliPay currently offers, as a proxy of the MDR that FinTech companies offer. Let’s Talk Payments (September 2013), “AliPay Vs. TenPay — The China Payments Rivalry”. For simplicity, we assumed the estimated bank card consumption expenditure in five years based on the estimated upper bound reduction in Table G1. 90 For example, some reduction in MDR on the part of banks could help to reduce the loss of transaction volumes through traditional bank payment channels.
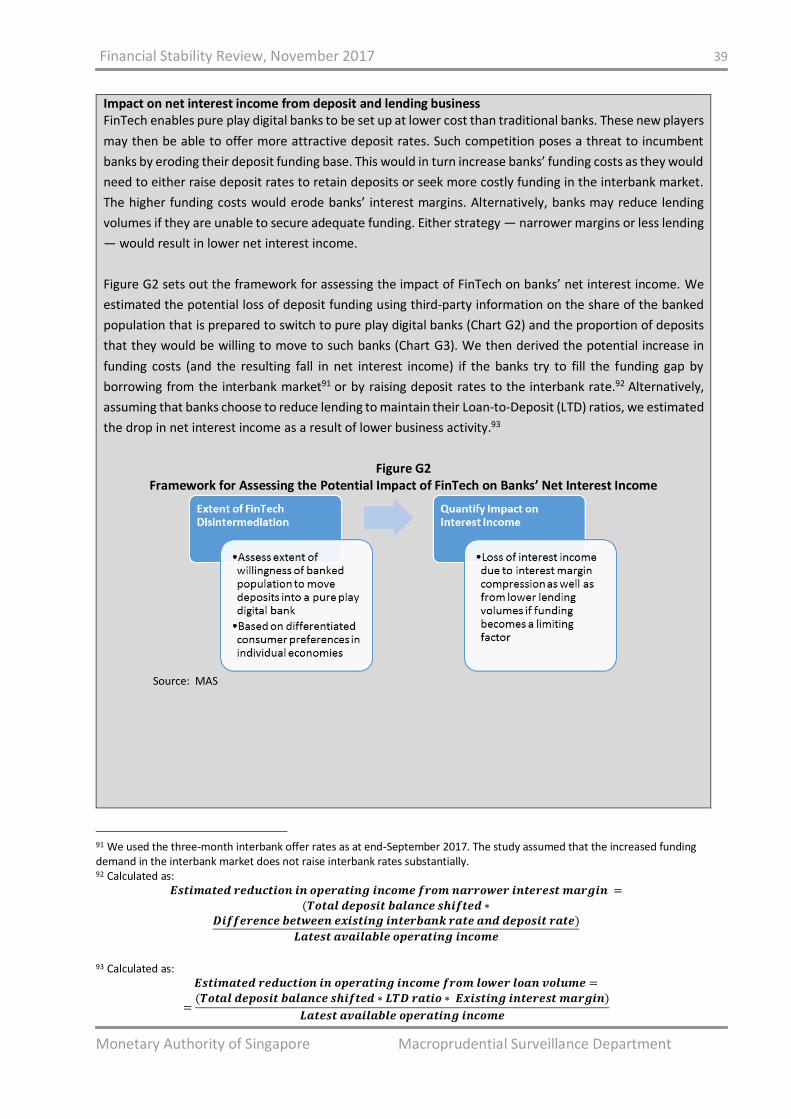
Financial Stability Review, November 2017 39
Monetary Authority of Singapore Macroprudential Surveillance Department
Impact on net interest income from deposit and lending business FinTech enables pure play digital banks to be set up at lower cost than traditional banks. These new players
may then be able to offer more attractive deposit rates. Such competition poses a threat to incumbent
banks by eroding their deposit funding base. This would in turn increase banks’ funding costs as they would
need to either raise deposit rates to retain deposits or seek more costly funding in the interbank market.
The higher funding costs would erode banks’ interest margins. Alternatively, banks may reduce lending
volumes if they are unable to secure adequate funding. Either strategy — narrower margins or less lending
— would result in lower net interest income.
Figure G2 sets out the framework for assessing the impact of FinTech on banks’ net interest income. We
estimated the potential loss of deposit funding using third-party information on the share of the banked
population that is prepared to switch to pure play digital banks (Chart G2) and the proportion of deposits
that they would be willing to move to such banks (Chart G3). We then derived the potential increase in
funding costs (and the resulting fall in net interest income) if the banks try to fill the funding gap by
borrowing from the interbank market91 or by raising deposit rates to the interbank rate.92 Alternatively,
assuming that banks choose to reduce lending to maintain their Loan-to-Deposit (LTD) ratios, we estimated
the drop in net interest income as a result of lower business activity.93
Figure G2 Framework for Assessing the Potential Impact of FinTech on Banks’ Net Interest Income
Source: MAS
91 We used the three-month interbank offer rates as at end-September 2017. The study assumed that the increased funding demand in the interbank market does not raise interbank rates substantially. 92 Calculated as:
𝑬𝒔𝒕𝒊𝒎𝒂𝒕𝒆𝒅 𝒓𝒆𝒅𝒖𝒄𝒕𝒊𝒐𝒏 𝒊𝒏 𝒐𝒑𝒆𝒓𝒂𝒕𝒊𝒏𝒈 𝒊𝒏𝒄𝒐𝒎𝒆 𝒇𝒓𝒐𝒎 𝒏𝒂𝒓𝒓𝒐𝒘𝒆𝒓 𝒊𝒏𝒕𝒆𝒓𝒆𝒔𝒕 𝒎𝒂𝒓𝒈𝒊𝒏 =
(𝑻𝒐𝒕𝒂𝒍 𝒅𝒆𝒑𝒐𝒔𝒊𝒕 𝒃𝒂𝒍𝒂𝒏𝒄𝒆 𝒔𝒉𝒊𝒇𝒕𝒆𝒅 ∗𝑫𝒊𝒇𝒇𝒆𝒓𝒆𝒏𝒄𝒆 𝒃𝒆𝒕𝒘𝒆𝒆𝒏 𝒆𝒙𝒊𝒔𝒕𝒊𝒏𝒈 𝒊𝒏𝒕𝒆𝒓𝒃𝒂𝒏𝒌 𝒓𝒂𝒕𝒆 𝒂𝒏𝒅 𝒅𝒆𝒑𝒐𝒔𝒊𝒕 𝒓𝒂𝒕𝒆)
𝑳𝒂𝒕𝒆𝒔𝒕 𝒂𝒗𝒂𝒊𝒍𝒂𝒃𝒍𝒆 𝒐𝒑𝒆𝒓𝒂𝒕𝒊𝒏𝒈 𝒊𝒏𝒄𝒐𝒎𝒆
93 Calculated as:
𝑬𝒔𝒕𝒊𝒎𝒂𝒕𝒆𝒅 𝒓𝒆𝒅𝒖𝒄𝒕𝒊𝒐𝒏 𝒊𝒏 𝒐𝒑𝒆𝒓𝒂𝒕𝒊𝒏𝒈 𝒊𝒏𝒄𝒐𝒎𝒆 𝒇𝒓𝒐𝒎 𝒍𝒐𝒘𝒆𝒓 𝒍𝒐𝒂𝒏 𝒗𝒐𝒍𝒖𝒎𝒆 =
=(𝑻𝒐𝒕𝒂𝒍 𝒅𝒆𝒑𝒐𝒔𝒊𝒕 𝒃𝒂𝒍𝒂𝒏𝒄𝒆 𝒔𝒉𝒊𝒇𝒕𝒆𝒅 ∗ 𝑳𝑻𝑫 𝒓𝒂𝒕𝒊𝒐 ∗ 𝑬𝒙𝒊𝒔𝒕𝒊𝒏𝒈 𝒊𝒏𝒕𝒆𝒓𝒆𝒔𝒕 𝒎𝒂𝒓𝒈𝒊𝒏)
𝑳𝒂𝒕𝒆𝒔𝒕 𝒂𝒗𝒂𝒊𝒍𝒂𝒃𝒍𝒆 𝒐𝒑𝒆𝒓𝒂𝒕𝒊𝒏𝒈 𝒊𝒏𝒄𝒐𝒎𝒆
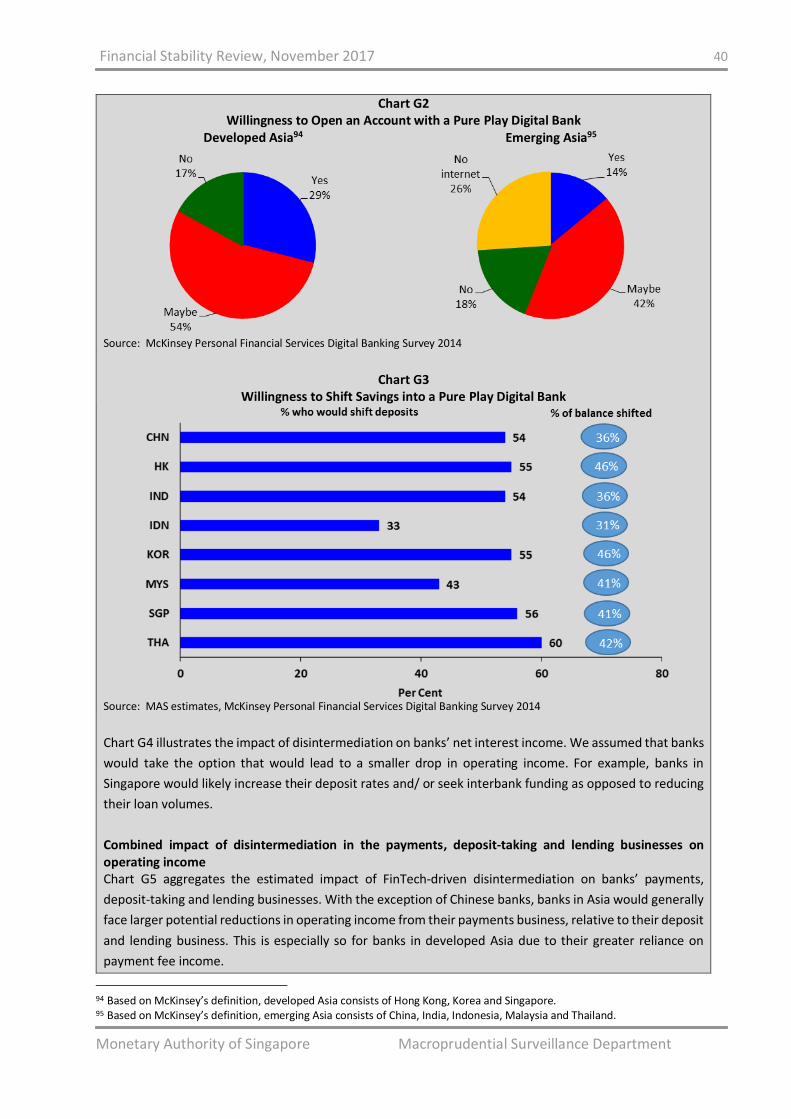
Financial Stability Review, November 2017 40
Monetary Authority of Singapore Macroprudential Surveillance Department
Chart G2 Willingness to Open an Account with a Pure Play Digital Bank
Developed Asia94
Emerging Asia95
Source: McKinsey Personal Financial Services Digital Banking Survey 2014
Chart G3 Willingness to Shift Savings into a Pure Play Digital Bank
Source: MAS estimates, McKinsey Personal Financial Services Digital Banking Survey 2014
Chart G4 illustrates the impact of disintermediation on banks’ net interest income. We assumed that banks
would take the option that would lead to a smaller drop in operating income. For example, banks in
Singapore would likely increase their deposit rates and/ or seek interbank funding as opposed to reducing
their loan volumes.
Combined impact of disintermediation in the payments, deposit-taking and lending businesses on operating income Chart G5 aggregates the estimated impact of FinTech-driven disintermediation on banks’ payments,
deposit-taking and lending businesses. With the exception of Chinese banks, banks in Asia would generally
face larger potential reductions in operating income from their payments business, relative to their deposit
and lending business. This is especially so for banks in developed Asia due to their greater reliance on
payment fee income.
94 Based on McKinsey’s definition, developed Asia consists of Hong Kong, Korea and Singapore. 95 Based on McKinsey’s definition, emerging Asia consists of China, India, Indonesia, Malaysia and Thailand.
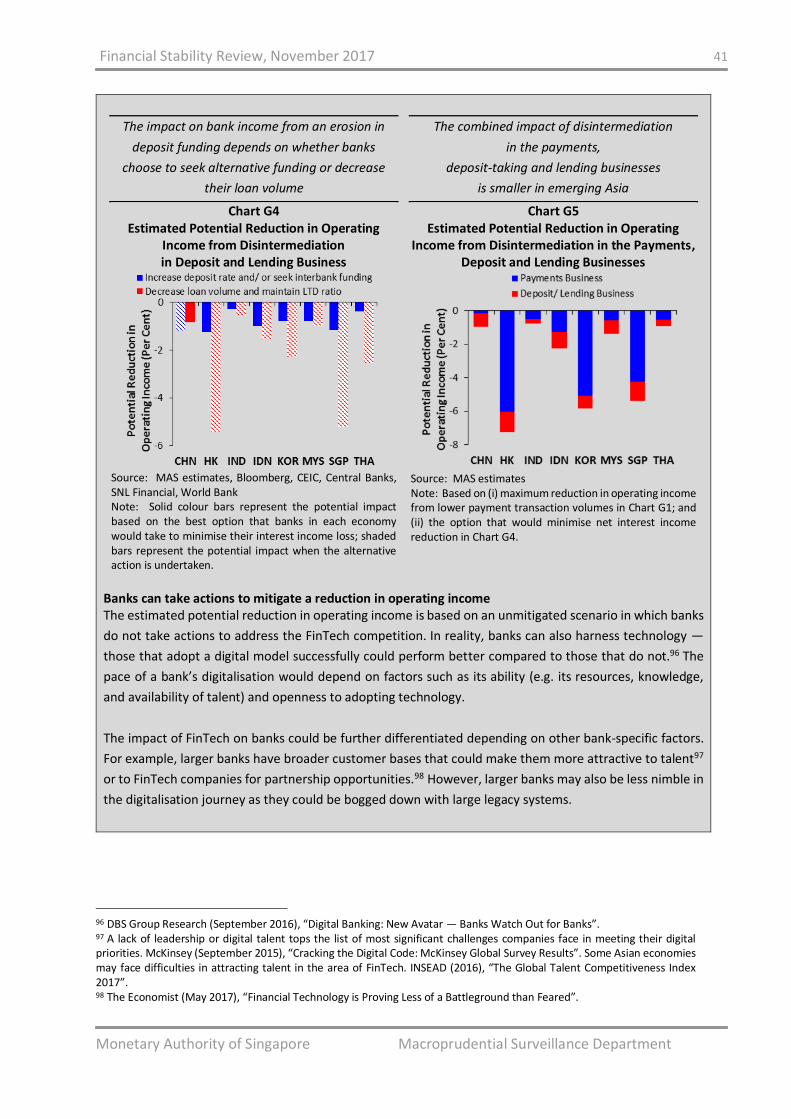
Financial Stability Review, November 2017 41
Monetary Authority of Singapore Macroprudential Surveillance Department
The impact on bank income from an erosion in
deposit funding depends on whether banks
choose to seek alternative funding or decrease
their loan volume
Chart G4 Estimated Potential Reduction in Operating
Income from Disintermediation in Deposit and Lending Business
Source: MAS estimates, Bloomberg, CEIC, Central Banks, SNL Financial, World Bank Note: Solid colour bars represent the potential impact based on the best option that banks in each economy would take to minimise their interest income loss; shaded bars represent the potential impact when the alternative action is undertaken.
The combined impact of disintermediation
in the payments,
deposit-taking and lending businesses
is smaller in emerging Asia
Chart G5 Estimated Potential Reduction in Operating
Income from Disintermediation in the Payments, Deposit and Lending Businesses
Source: MAS estimates Note: Based on (i) maximum reduction in operating income from lower payment transaction volumes in Chart G1; and (ii) the option that would minimise net interest income reduction in Chart G4.
Banks can take actions to mitigate a reduction in operating income The estimated potential reduction in operating income is based on an unmitigated scenario in which banks
do not take actions to address the FinTech competition. In reality, banks can also harness technology —
those that adopt a digital model successfully could perform better compared to those that do not.96 The
pace of a bank’s digitalisation would depend on factors such as its ability (e.g. its resources, knowledge,
and availability of talent) and openness to adopting technology.
The impact of FinTech on banks could be further differentiated depending on other bank-specific factors.
For example, larger banks have broader customer bases that could make them more attractive to talent97
or to FinTech companies for partnership opportunities.98 However, larger banks may also be less nimble in
the digitalisation journey as they could be bogged down with large legacy systems.
96 DBS Group Research (September 2016), “Digital Banking: New Avatar — Banks Watch Out for Banks”. 97 A lack of leadership or digital talent tops the list of most significant challenges companies face in meeting their digital priorities. McKinsey (September 2015), “Cracking the Digital Code: McKinsey Global Survey Results”. Some Asian economies may face difficulties in attracting talent in the area of FinTech. INSEAD (2016), “The Global Talent Competitiveness Index 2017”. 98 The Economist (May 2017), “Financial Technology is Proving Less of a Battleground than Feared”.
Financial Stability Review, November 2017 42
Monetary Authority of Singapore Macroprudential Surveillance Department
In sum, as FinTech continues to develop, a bank that can build distinct digital capabilities99, leverage on
them and integrate them into its business model would be better placed for success.
Potential avenues for further work FinTech is a growing space. As FinTech continues to develop over time, more data would become available
that would allow for more comprehensive impact studies. For example, the study could be expanded to
include other business lines, such as wealth management, insurance and remittance. The analysis can also
be extended to assess potential second-round effects from FinTech disruption. For instance,
disintermediation would reduce transaction flows and the amount of customer data that banks could
collect about their clients. With fewer insights on their customers, banks would have fewer cross-selling
opportunities and their risk assessments may become less robust.100
99 This includes data-driven digital insights, integrated customer experience, digital marketing, digitally-enabled operations, technology with the use of digital enablers of talent, governance and a culture of innovation. McKinsey (December 2015), “Cutting Through the FinTech Noise: Markers of Success, Imperatives for Banks”. 100 A retail bank can enjoy a 10% increase in net profit through digital innovation from new products, distinctive digital sales and using data to cross-sell. McKinsey (2015), “Strategic Choices for Banks in the Digital Age”.
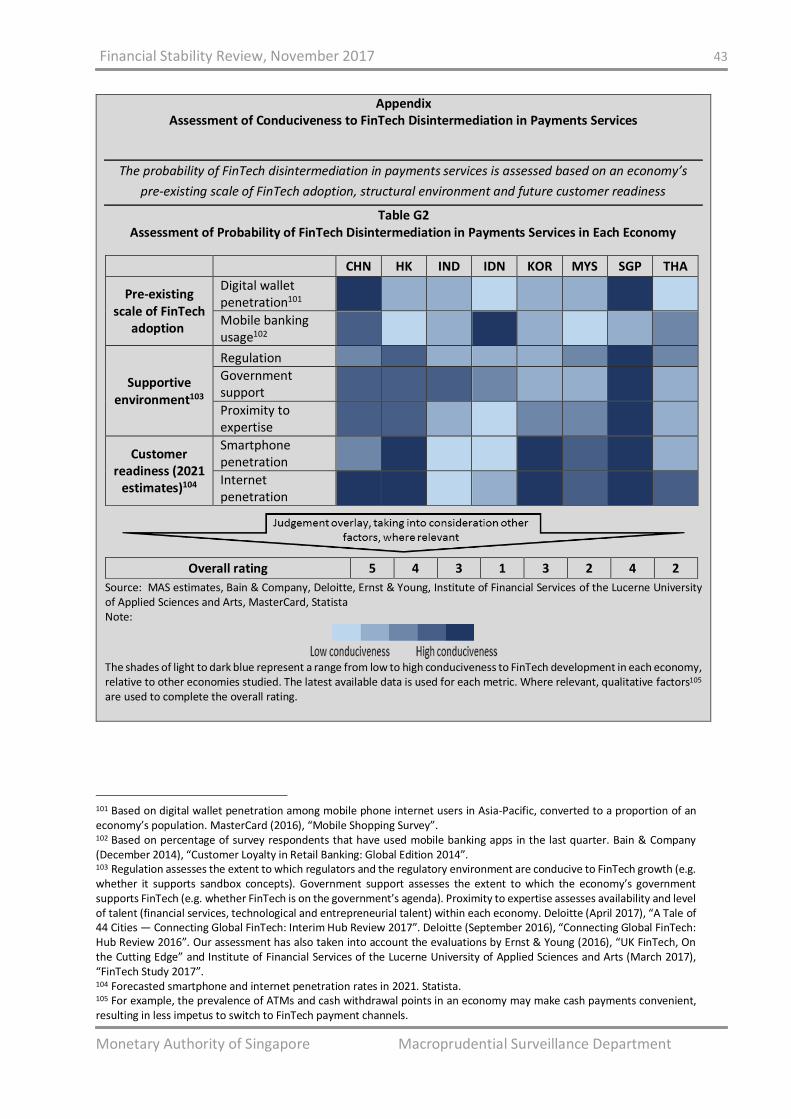
Financial Stability Review, November 2017 43
Monetary Authority of Singapore Macroprudential Surveillance Department
Appendix Assessment of Conduciveness to FinTech Disintermediation in Payments Services
The probability of FinTech disintermediation in payments services is assessed based on an economy’s
pre-existing scale of FinTech adoption, structural environment and future customer readiness
Table G2 Assessment of Probability of FinTech Disintermediation in Payments Services in Each Economy
CHN HK IND IDN KOR MYS SGP THA
Pre-existing scale of FinTech
adoption
Digital wallet penetration101
Mobile banking usage102
Supportive environment103
Regulation
Government support
Proximity to expertise
Customer readiness (2021
estimates)104
Smartphone penetration
Internet penetration
Overall rating 5 4 3 1 3 2 4 2
Source: MAS estimates, Bain & Company, Deloitte, Ernst & Young, Institute of Financial Services of the Lucerne University of Applied Sciences and Arts, MasterCard, Statista Note:
The shades of light to dark blue represent a range from low to high conduciveness to FinTech development in each economy, relative to other economies studied. The latest available data is used for each metric. Where relevant, qualitative factors105 are used to complete the overall rating.
101 Based on digital wallet penetration among mobile phone internet users in Asia-Pacific, converted to a proportion of an economy’s population. MasterCard (2016), “Mobile Shopping Survey”. 102 Based on percentage of survey respondents that have used mobile banking apps in the last quarter. Bain & Company (December 2014), “Customer Loyalty in Retail Banking: Global Edition 2014”. 103 Regulation assesses the extent to which regulators and the regulatory environment are conducive to FinTech growth (e.g. whether it supports sandbox concepts). Government support assesses the extent to which the economy’s government supports FinTech (e.g. whether FinTech is on the government’s agenda). Proximity to expertise assesses availability and level of talent (financial services, technological and entrepreneurial talent) within each economy. Deloitte (April 2017), “A Tale of 44 Cities — Connecting Global FinTech: Interim Hub Review 2017”. Deloitte (September 2016), “Connecting Global FinTech: Hub Review 2016”. Our assessment has also taken into account the evaluations by Ernst & Young (2016), “UK FinTech, On the Cutting Edge” and Institute of Financial Services of the Lucerne University of Applied Sciences and Arts (March 2017), “FinTech Study 2017”. 104 Forecasted smartphone and internet penetration rates in 2021. Statista. 105 For example, the prevalence of ATMs and cash withdrawal points in an economy may make cash payments convenient, resulting in less impetus to switch to FinTech payment channels.
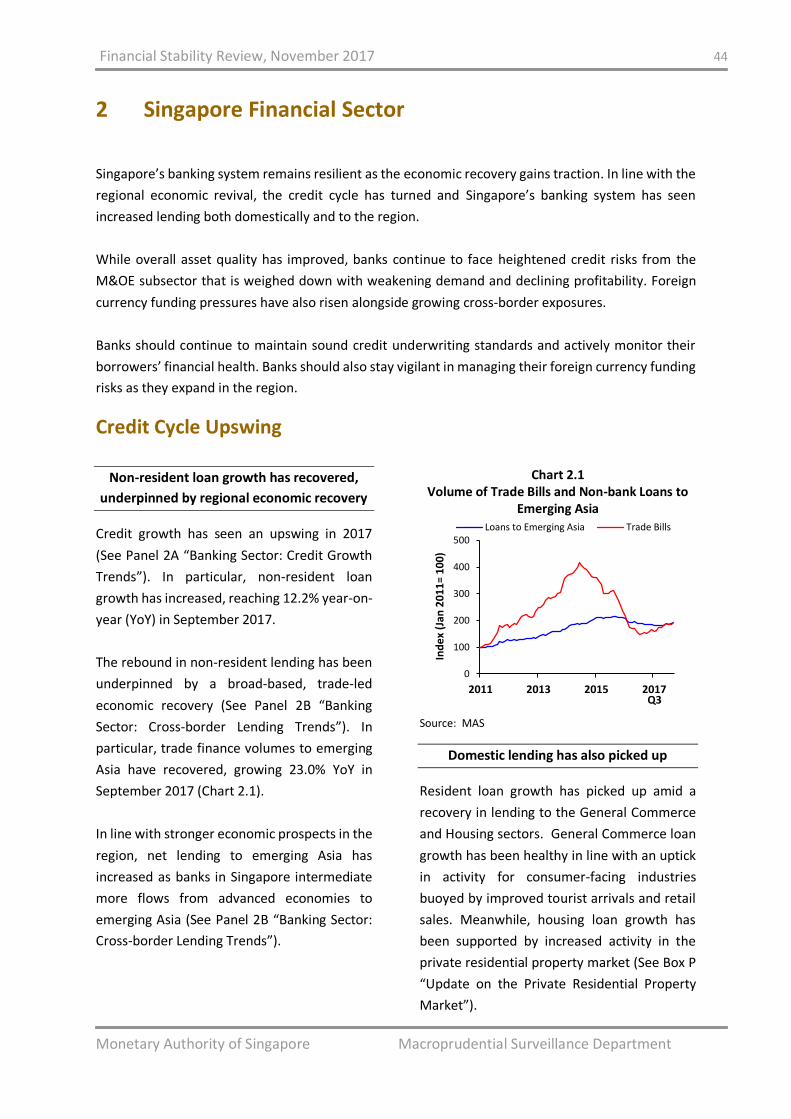
Financial Stability Review, November 2017 44
Monetary Authority of Singapore Macroprudential Surveillance Department
2 Singapore Financial Sector
Singapore’s banking system remains resilient as the economic recovery gains traction. In line with the
regional economic revival, the credit cycle has turned and Singapore’s banking system has seen
increased lending both domestically and to the region.
While overall asset quality has improved, banks continue to face heightened credit risks from the
M&OE subsector that is weighed down with weakening demand and declining profitability. Foreign
currency funding pressures have also risen alongside growing cross-border exposures.
Banks should continue to maintain sound credit underwriting standards and actively monitor their
borrowers’ financial health. Banks should also stay vigilant in managing their foreign currency funding
risks as they expand in the region.
Credit Cycle Upswing
Non-resident loan growth has recovered,
underpinned by regional economic recovery
Credit growth has seen an upswing in 2017
(See Panel 2A “Banking Sector: Credit Growth
Trends”). In particular, non-resident loan
growth has increased, reaching 12.2% year-on-
year (YoY) in September 2017.
The rebound in non-resident lending has been
underpinned by a broad-based, trade-led
economic recovery (See Panel 2B “Banking
Sector: Cross-border Lending Trends”). In
particular, trade finance volumes to emerging
Asia have recovered, growing 23.0% YoY in
September 2017 (Chart 2.1).
In line with stronger economic prospects in the
region, net lending to emerging Asia has
increased as banks in Singapore intermediate
more flows from advanced economies to
emerging Asia (See Panel 2B “Banking Sector:
Cross-border Lending Trends”).
Chart 2.1 Volume of Trade Bills and Non-bank Loans to
Emerging Asia
Source: MAS
Domestic lending has also picked up
Resident loan growth has picked up amid a
recovery in lending to the General Commerce
and Housing sectors. General Commerce loan
growth has been healthy in line with an uptick
in activity for consumer-facing industries
buoyed by improved tourist arrivals and retail
sales. Meanwhile, housing loan growth has
been supported by increased activity in the
private residential property market (See Box P
“Update on the Private Residential Property
Market”).
0
100
200
300
400
500
2011 2013 2015 2017
Ind
ex
(Jan
20
11
= 1
00
)
Loans to Emerging Asia Trade Bills
Q3
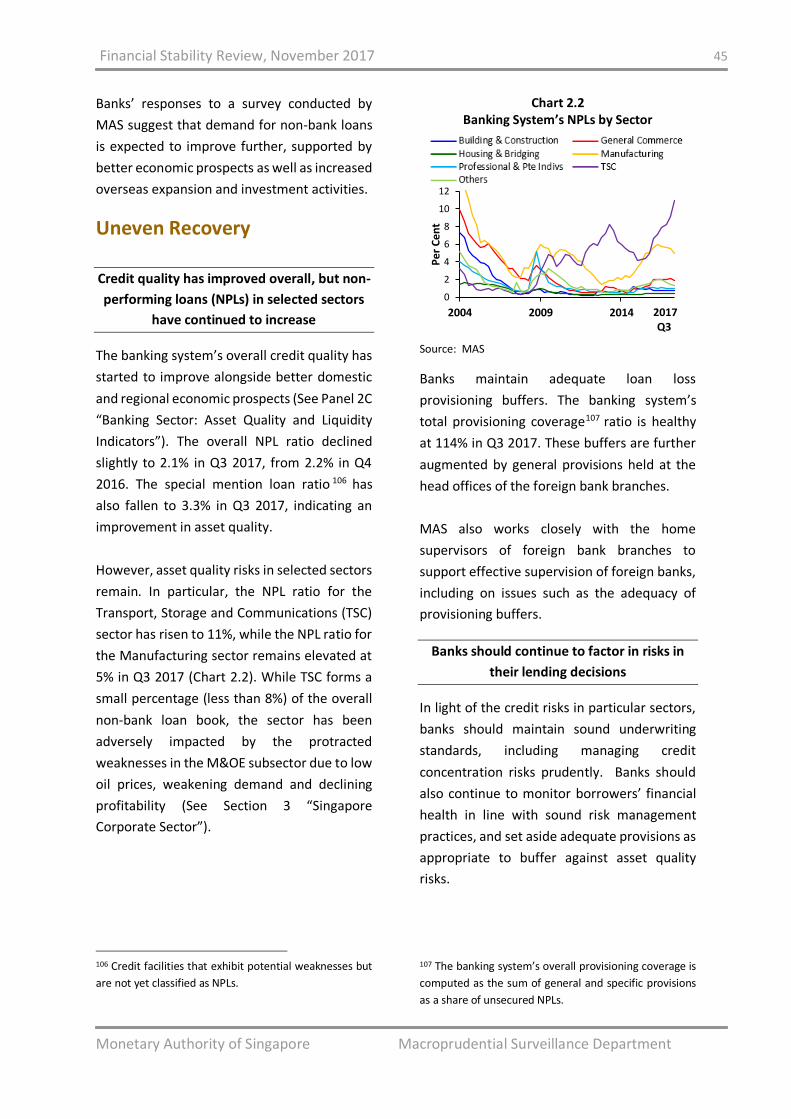
Financial Stability Review, November 2017 45
Monetary Authority of Singapore Macroprudential Surveillance Department
Banks’ responses to a survey conducted by
MAS suggest that demand for non-bank loans
is expected to improve further, supported by
better economic prospects as well as increased
overseas expansion and investment activities.
Uneven Recovery
Credit quality has improved overall, but non-
performing loans (NPLs) in selected sectors
have continued to increase
The banking system’s overall credit quality has
started to improve alongside better domestic
and regional economic prospects (See Panel 2C
“Banking Sector: Asset Quality and Liquidity
Indicators”). The overall NPL ratio declined
slightly to 2.1% in Q3 2017, from 2.2% in Q4
2016. The special mention loan ratio 106 has
also fallen to 3.3% in Q3 2017, indicating an
improvement in asset quality.
However, asset quality risks in selected sectors
remain. In particular, the NPL ratio for the
Transport, Storage and Communications (TSC)
sector has risen to 11%, while the NPL ratio for
the Manufacturing sector remains elevated at
5% in Q3 2017 (Chart 2.2). While TSC forms a
small percentage (less than 8%) of the overall
non-bank loan book, the sector has been
adversely impacted by the protracted
weaknesses in the M&OE subsector due to low
oil prices, weakening demand and declining
profitability (See Section 3 “Singapore
Corporate Sector”).
106 Credit facilities that exhibit potential weaknesses but
are not yet classified as NPLs.
Chart 2.2 Banking System’s NPLs by Sector
Source: MAS
Banks maintain adequate loan loss
provisioning buffers. The banking system’s
total provisioning coverage107 ratio is healthy
at 114% in Q3 2017. These buffers are further
augmented by general provisions held at the
head offices of the foreign bank branches.
MAS also works closely with the home
supervisors of foreign bank branches to
support effective supervision of foreign banks,
including on issues such as the adequacy of
provisioning buffers.
Banks should continue to factor in risks in
their lending decisions
In light of the credit risks in particular sectors,
banks should maintain sound underwriting
standards, including managing credit
concentration risks prudently. Banks should
also continue to monitor borrowers’ financial
health in line with sound risk management
practices, and set aside adequate provisions as
appropriate to buffer against asset quality
risks.
107 The banking system’s overall provisioning coverage is
computed as the sum of general and specific provisions
as a share of unsecured NPLs.
0
2
4
6
8
10
12
2004 2009 2014
Pe
r C
en
t
Q32017
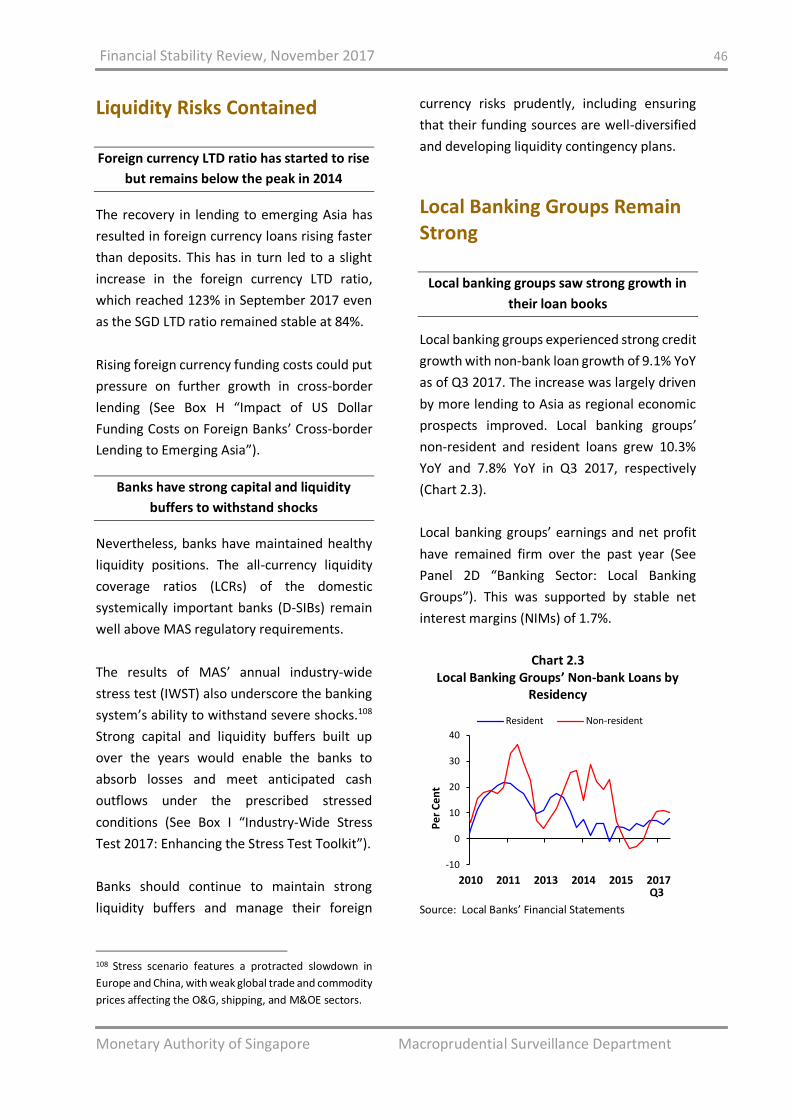
Financial Stability Review, November 2017 46
Monetary Authority of Singapore Macroprudential Surveillance Department
Liquidity Risks Contained
Foreign currency LTD ratio has started to rise
but remains below the peak in 2014
The recovery in lending to emerging Asia has
resulted in foreign currency loans rising faster
than deposits. This has in turn led to a slight
increase in the foreign currency LTD ratio,
which reached 123% in September 2017 even
as the SGD LTD ratio remained stable at 84%.
Rising foreign currency funding costs could put
pressure on further growth in cross-border
lending (See Box H “Impact of US Dollar
Funding Costs on Foreign Banks’ Cross-border
Lending to Emerging Asia”).
Banks have strong capital and liquidity
buffers to withstand shocks
Nevertheless, banks have maintained healthy
liquidity positions. The all-currency liquidity
coverage ratios (LCRs) of the domestic
systemically important banks (D-SIBs) remain
well above MAS regulatory requirements.
The results of MAS’ annual industry-wide
stress test (IWST) also underscore the banking
system’s ability to withstand severe shocks.108
Strong capital and liquidity buffers built up
over the years would enable the banks to
absorb losses and meet anticipated cash
outflows under the prescribed stressed
conditions (See Box I “Industry-Wide Stress
Test 2017: Enhancing the Stress Test Toolkit”).
Banks should continue to maintain strong
liquidity buffers and manage their foreign
108 Stress scenario features a protracted slowdown in
Europe and China, with weak global trade and commodity
prices affecting the O&G, shipping, and M&OE sectors.
currency risks prudently, including ensuring
that their funding sources are well-diversified
and developing liquidity contingency plans.
Local Banking Groups Remain Strong
Local banking groups saw strong growth in
their loan books
Local banking groups experienced strong credit
growth with non-bank loan growth of 9.1% YoY
as of Q3 2017. The increase was largely driven
by more lending to Asia as regional economic
prospects improved. Local banking groups’
non-resident and resident loans grew 10.3%
YoY and 7.8% YoY in Q3 2017, respectively
(Chart 2.3).
Local banking groups’ earnings and net profit
have remained firm over the past year (See
Panel 2D “Banking Sector: Local Banking
Groups”). This was supported by stable net
interest margins (NIMs) of 1.7%.
Chart 2.3 Local Banking Groups’ Non-bank Loans by
Residency
Source: Local Banks’ Financial Statements
-10
0
10
20
30
40
2010 2011 2013 2014 2015 2017
Pe
r C
en
t
Resident Non-resident
Q3
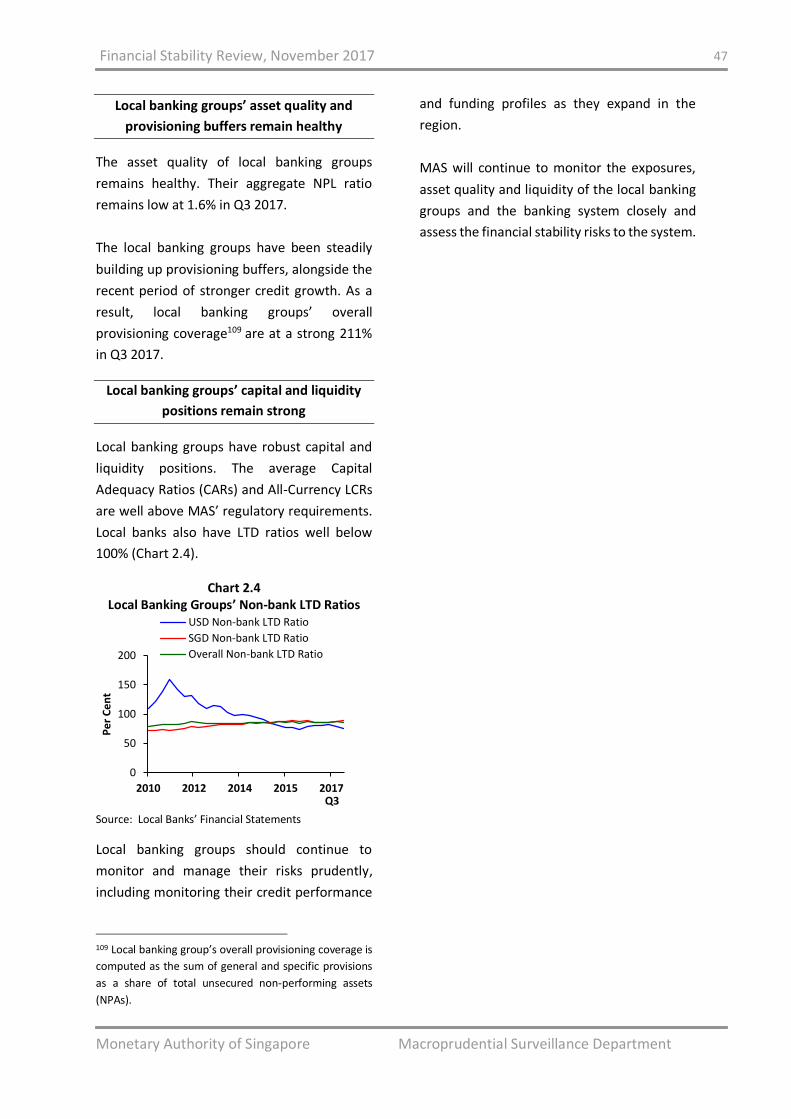
Financial Stability Review, November 2017 47
Monetary Authority of Singapore Macroprudential Surveillance Department
Local banking groups’ asset quality and
provisioning buffers remain healthy
The asset quality of local banking groups
remains healthy. Their aggregate NPL ratio
remains low at 1.6% in Q3 2017.
The local banking groups have been steadily
building up provisioning buffers, alongside the
recent period of stronger credit growth. As a
result, local banking groups’ overall
provisioning coverage109 are at a strong 211%
in Q3 2017.
Local banking groups’ capital and liquidity
positions remain strong
Local banking groups have robust capital and
liquidity positions. The average Capital
Adequacy Ratios (CARs) and All-Currency LCRs
are well above MAS’ regulatory requirements.
Local banks also have LTD ratios well below
100% (Chart 2.4).
Chart 2.4 Local Banking Groups’ Non-bank LTD Ratios
Source: Local Banks’ Financial Statements
Local banking groups should continue to
monitor and manage their risks prudently,
including monitoring their credit performance
109 Local banking group’s overall provisioning coverage is
computed as the sum of general and specific provisions
as a share of total unsecured non-performing assets
(NPAs).
and funding profiles as they expand in the
region.
MAS will continue to monitor the exposures,
asset quality and liquidity of the local banking
groups and the banking system closely and
assess the financial stability risks to the system.
0
50
100
150
200
2010 2012 2014 2015 2017
Pe
r C
en
t
USD Non-bank LTD Ratio
SGD Non-bank LTD Ratio
Overall Non-bank LTD Ratio
Q3
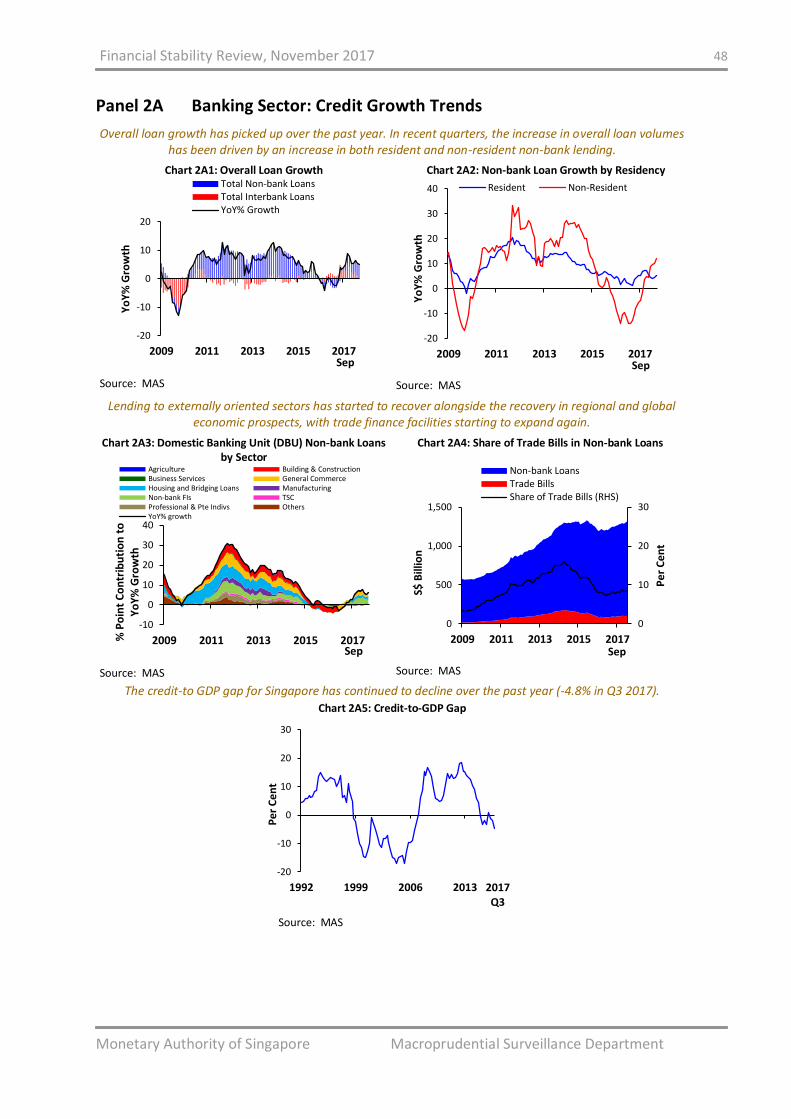
Financial Stability Review, November 2017 48
Monetary Authority of Singapore Macroprudential Surveillance Department
Panel 2A Banking Sector: Credit Growth Trends
Overall loan growth has picked up over the past year. In recent quarters, the increase in overall loan volumes has been driven by an increase in both resident and non-resident non-bank lending.
Chart 2A1: Overall Loan Growth
Source: MAS
Chart 2A2: Non-bank Loan Growth by Residency
Source: MAS
Lending to externally oriented sectors has started to recover alongside the recovery in regional and global economic prospects, with trade finance facilities starting to expand again.
Chart 2A3: Domestic Banking Unit (DBU) Non-bank Loans by Sector
Source: MAS
Chart 2A4: Share of Trade Bills in Non-bank Loans
Source: MAS
The credit-to GDP gap for Singapore has continued to decline over the past year (-4.8% in Q3 2017).
Chart 2A5: Credit-to-GDP Gap
Source: MAS
-20
-10
0
10
20
2009 2011 2013 2015 2017
Yo
Y%
Gro
wth
Total Non-bank LoansTotal Interbank LoansYoY% Growth
Sep
-20
-10
0
10
20
30
40
2009 2011 2013 2015 2017
Yo
Y%
Gro
wth
Resident Non-Resident
Sep
-10
0
10
20
30
40
2009 2011 2013 2015 2017% P
oin
t C
on
trib
uti
on
to
Y
oY
% G
row
th
Agriculture Building & ConstructionBusiness Services General CommerceHousing and Bridging Loans ManufacturingNon-bank FIs TSCProfessional & Pte Indivs OthersYoY% growth
Sep
0
10
20
30
0
500
1,000
1,500
2009 2011 2013 2015 2017
Pe
r C
en
t
S$ B
illio
n
Non-bank LoansTrade BillsShare of Trade Bills (RHS)
Sep
-20
-10
0
10
20
30
1992 1999 2006 2013
Pe
r C
en
t
2017 Q3
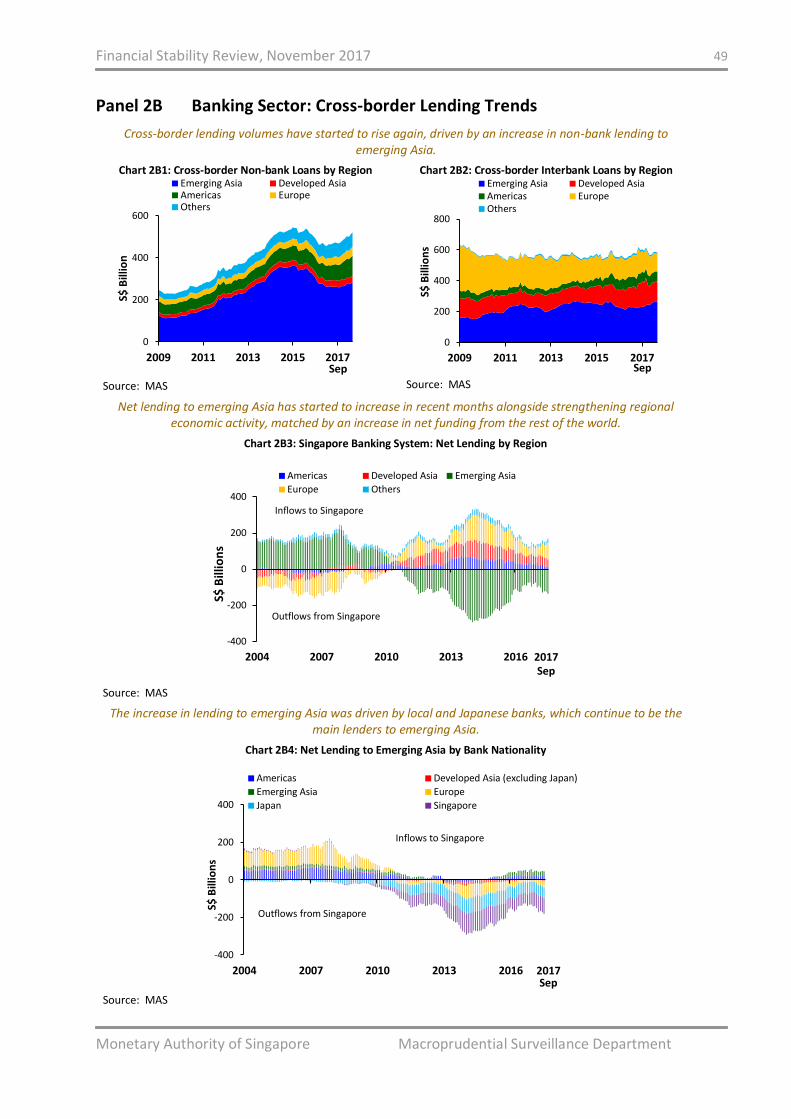
Financial Stability Review, November 2017 49
Monetary Authority of Singapore Macroprudential Surveillance Department
Panel 2B Banking Sector: Cross-border Lending Trends
Cross-border lending volumes have started to rise again, driven by an increase in non-bank lending to emerging Asia.
Chart 2B1: Cross-border Non-bank Loans by Region
Source: MAS
Chart 2B2: Cross-border Interbank Loans by Region
Source: MAS
Net lending to emerging Asia has started to increase in recent months alongside strengthening regional economic activity, matched by an increase in net funding from the rest of the world.
Chart 2B3: Singapore Banking System: Net Lending by Region
Source: MAS
The increase in lending to emerging Asia was driven by local and Japanese banks, which continue to be the main lenders to emerging Asia.
Chart 2B4: Net Lending to Emerging Asia by Bank Nationality
Source: MAS
0
200
400
600
2009 2011 2013 2015 2017
S$ B
illio
n
Emerging Asia Developed AsiaAmericas EuropeOthers
Sep
0
200
400
600
800
2009 2011 2013 2015 2017
S$ B
illio
ns
Emerging Asia Developed AsiaAmericas EuropeOthers
Sep
-400
-200
0
200
400
2004 2007 2010 2013 2016
S$ B
illio
ns
Americas Developed Asia Emerging Asia
Europe Others
2017Sep
Inflows to Singapore
Outflows from Singapore
-400
-200
0
200
400
2004 2007 2010 2013 2016
S$ B
illio
ns
Americas Developed Asia (excluding Japan)
Emerging Asia Europe
Japan Singapore
Outflows from Singapore
Inflows to Singapore
Sep2017
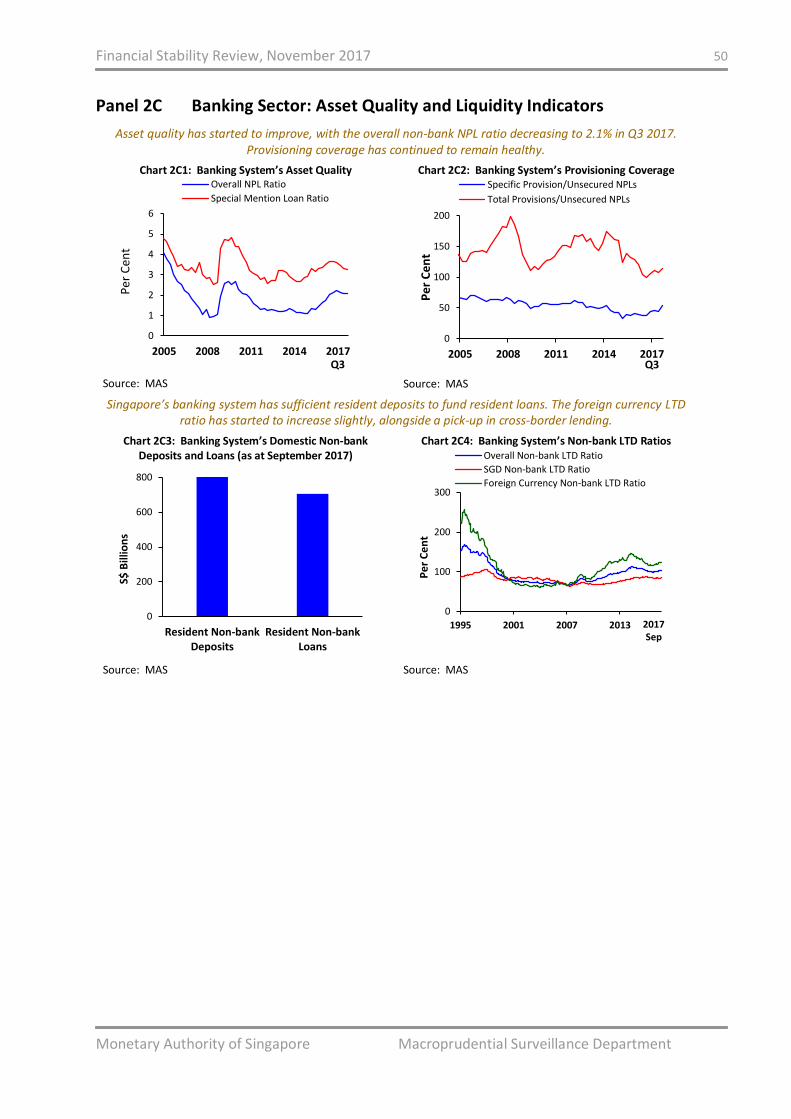
Financial Stability Review, November 2017 50
Monetary Authority of Singapore Macroprudential Surveillance Department
Panel 2C Banking Sector: Asset Quality and Liquidity Indicators
Asset quality has started to improve, with the overall non-bank NPL ratio decreasing to 2.1% in Q3 2017. Provisioning coverage has continued to remain healthy.
Chart 2C1: Banking System’s Asset Quality
Source: MAS
Chart 2C2: Banking System’s Provisioning Coverage
Source: MAS
Singapore’s banking system has sufficient resident deposits to fund resident loans. The foreign currency LTD ratio has started to increase slightly, alongside a pick-up in cross-border lending.
Chart 2C3: Banking System’s Domestic Non-bank Deposits and Loans (as at September 2017)
Source: MAS
Chart 2C4: Banking System’s Non-bank LTD Ratios
Source: MAS
0
1
2
3
4
5
6
2005 2008 2011 2014 2017
Per
Cen
t
Overall NPL Ratio
Special Mention Loan Ratio
Q3
0
50
100
150
200
2005 2008 2011 2014 2017
Pe
r C
en
t
Specific Provision/Unsecured NPLs
Total Provisions/Unsecured NPLs
Q3
0
200
400
600
800
Resident Non-bankDeposits
Resident Non-bankLoans
S$ B
illio
ns
0
100
200
300
1995 2001 2007 2013
Pe
r C
en
t
Overall Non-bank LTD Ratio
SGD Non-bank LTD Ratio
Foreign Currency Non-bank LTD Ratio
Sep 2017
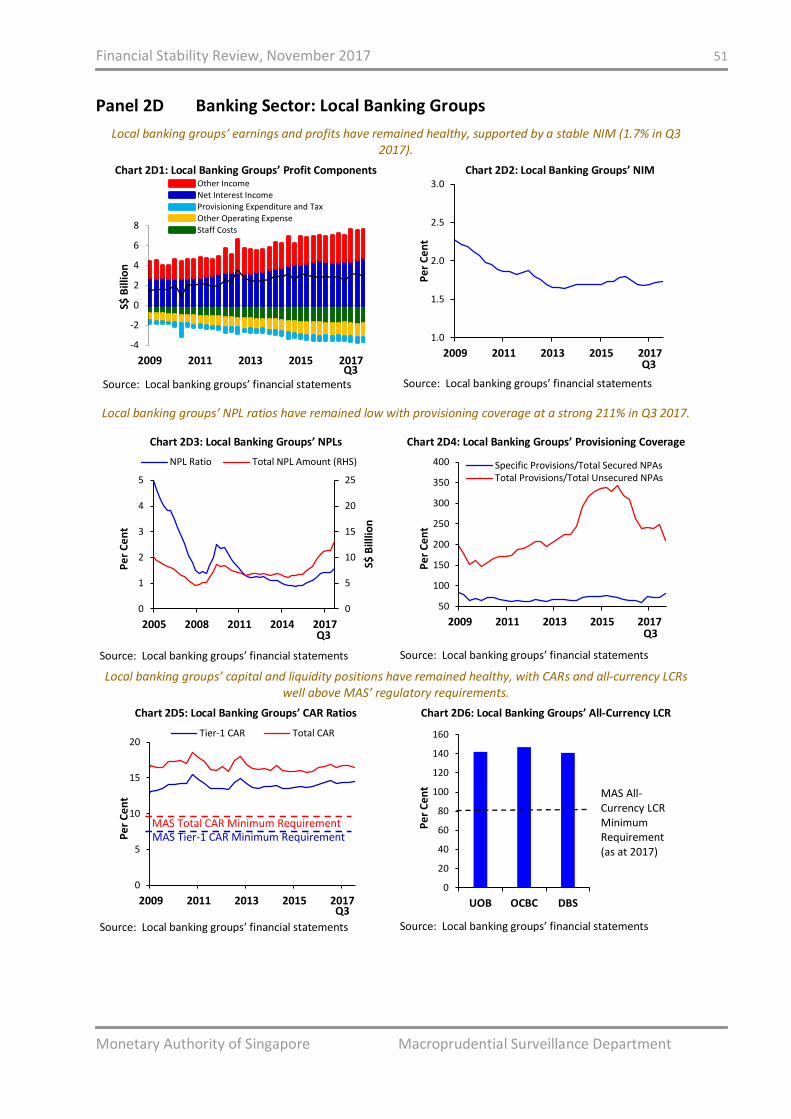
Financial Stability Review, November 2017 51
Monetary Authority of Singapore Macroprudential Surveillance Department
Panel 2D Banking Sector: Local Banking Groups
Local banking groups’ earnings and profits have remained healthy, supported by a stable NIM (1.7% in Q3 2017).
Chart 2D1: Local Banking Groups’ Profit Components
Source: Local banking groups’ financial statements
Chart 2D2: Local Banking Groups’ NIM
Source: Local banking groups’ financial statements
Local banking groups’ NPL ratios have remained low with provisioning coverage at a strong 211% in Q3 2017.
Chart 2D3: Local Banking Groups’ NPLs
Source: Local banking groups’ financial statements
Chart 2D4: Local Banking Groups’ Provisioning Coverage
Source: Local banking groups’ financial statements
Local banking groups’ capital and liquidity positions have remained healthy, with CARs and all-currency LCRs well above MAS’ regulatory requirements.
Chart 2D5: Local Banking Groups’ CAR Ratios
Source: Local banking groups’ financial statements
Chart 2D6: Local Banking Groups’ All-Currency LCR
Source: Local banking groups’ financial statements
-4
-2
0
2
4
6
8
2009 2011 2013 2015 2017
S$ B
illio
n
Other Income
Net Interest Income
Provisioning Expenditure and Tax
Other Operating Expense
Staff Costs
Q3
1.0
1.5
2.0
2.5
3.0
2009 2011 2013 2015 2017
Pe
r C
en
t
Q3
0
5
10
15
20
25
0
1
2
3
4
5
2005 2008 2011 2014 2017
S$ B
illlio
n
Pe
r C
en
t
NPL Ratio Total NPL Amount (RHS)
Q3
50
100
150
200
250
300
350
400
2009 2011 2013 2015 2017
Pe
r C
en
t
Specific Provisions/Total Secured NPAsTotal Provisions/Total Unsecured NPAs
Q3
0
5
10
15
20
2009 2011 2013 2015 2017
Pe
r C
en
t
Tier-1 CAR Total CAR
MAS Total CAR Minimum Requirement MAS Tier-1 CAR Minimum Requirement
Q3
0
20
40
60
80
100
120
140
160
UOB OCBC DBS
Pe
r C
en
t
MAS All-Currency LCR Minimum Requirement(as at 2017)
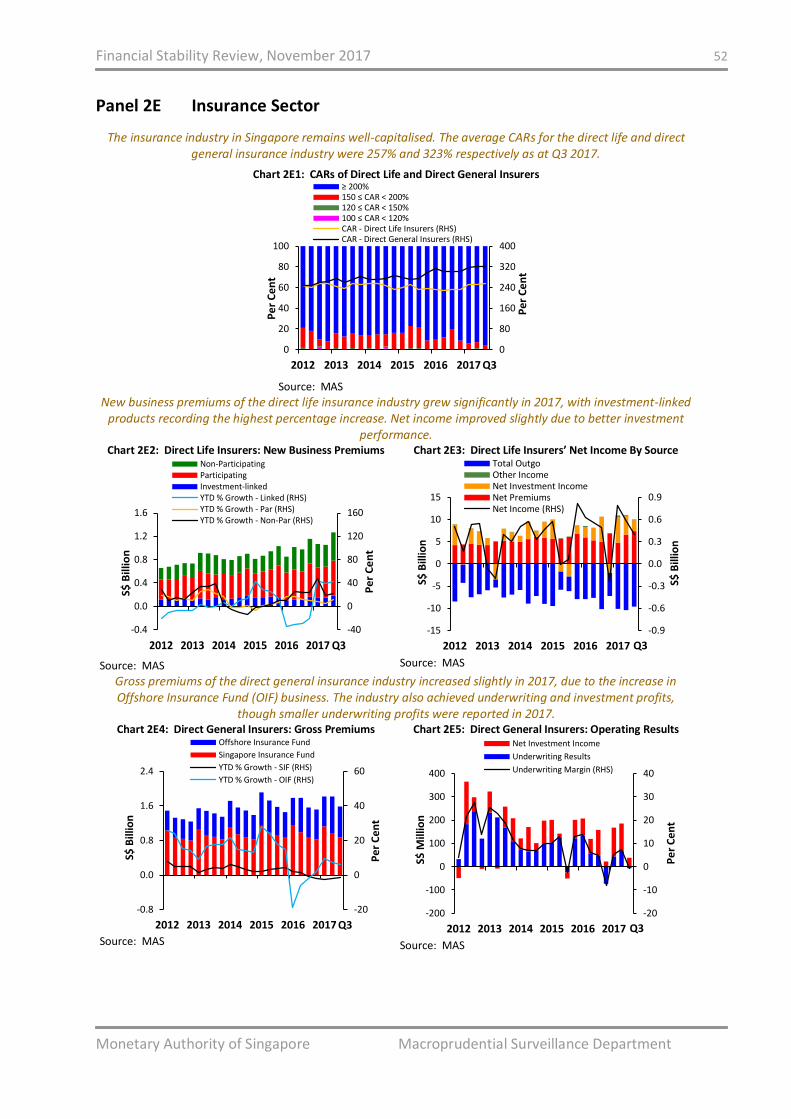
Financial Stability Review, November 2017 52
Monetary Authority of Singapore Macroprudential Surveillance Department
Panel 2E Insurance Sector
The insurance industry in Singapore remains well-capitalised. The average CARs for the direct life and direct general insurance industry were 257% and 323% respectively as at Q3 2017.
Chart 2E1: CARs of Direct Life and Direct General Insurers
Source: MAS
New business premiums of the direct life insurance industry grew significantly in 2017, with investment-linked products recording the highest percentage increase. Net income improved slightly due to better investment
performance. Chart 2E2: Direct Life Insurers: New Business Premiums
Source: MAS
Chart 2E3: Direct Life Insurers’ Net Income By Source
Source: MAS
Gross premiums of the direct general insurance industry increased slightly in 2017, due to the increase in Offshore Insurance Fund (OIF) business. The industry also achieved underwriting and investment profits,
though smaller underwriting profits were reported in 2017. Chart 2E4: Direct General Insurers: Gross Premiums
Source: MAS
Chart 2E5: Direct General Insurers: Operating Results
Source: MAS
0
80
160
240
320
400
0
20
40
60
80
100
2012 2013 2014 2015 2016 2017
≥ 200%150 ≤ CAR < 200%120 ≤ CAR < 150%100 ≤ CAR < 120%CAR - Direct Life Insurers (RHS)CAR - Direct General Insurers (RHS)
Pe
r C
en
t
Pe
rC
en
t
Q3
-40
0
40
80
120
160
-0.4
0.0
0.4
0.8
1.2
1.6
2012 2013 2014 2015 2016 2017
Non-ParticipatingParticipatingInvestment-linkedYTD % Growth - Linked (RHS)YTD % Growth - Par (RHS)YTD % Growth - Non-Par (RHS)
S$ B
illio
n
Pe
r C
en
t
Q3
-0.9
-0.6
-0.3
0.0
0.3
0.6
0.9
-15
-10
-5
0
5
10
15
2012 2013 2014 2015 2016 2017
Total OutgoOther IncomeNet Investment IncomeNet PremiumsNet Income (RHS)
S$ B
illio
n
S$ B
illio
n
Q3
-20
0
20
40
60
-0.8
0.0
0.8
1.6
2.4
2012 2013 2014 2015 2016 2017
Offshore Insurance Fund
Singapore Insurance Fund
YTD % Growth - SIF (RHS)
YTD % Growth - OIF (RHS)
Pe
r C
en
t
Q3
S$ B
illio
n
-20
-10
0
10
20
30
40
-200
-100
0
100
200
300
400
2012 2013 2014 2015 2016 2017
Net Investment Income
Underwriting Results
Underwriting Margin (RHS)
S$ M
illio
n
Pe
r C
en
t
Q3
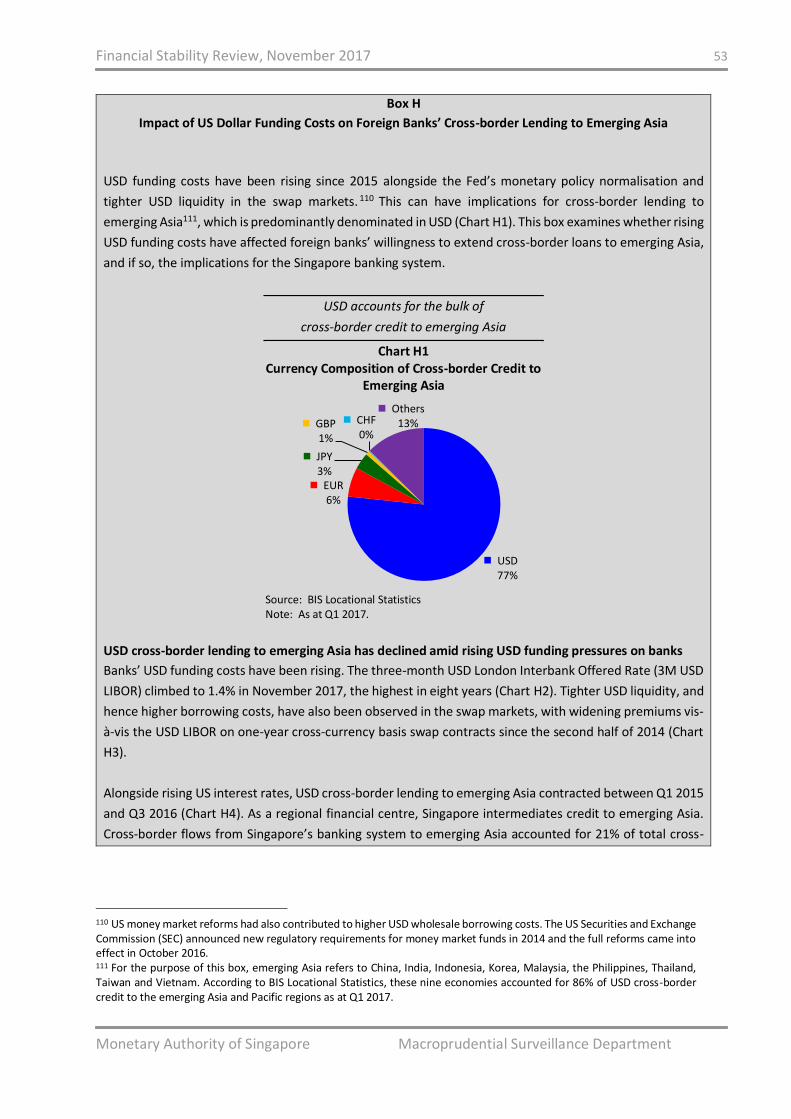
Financial Stability Review, November 2017 53
Monetary Authority of Singapore Macroprudential Surveillance Department
Box H
Impact of US Dollar Funding Costs on Foreign Banks’ Cross-border Lending to Emerging Asia
USD funding costs have been rising since 2015 alongside the Fed’s monetary policy normalisation and
tighter USD liquidity in the swap markets. 110 This can have implications for cross-border lending to
emerging Asia111, which is predominantly denominated in USD (Chart H1). This box examines whether rising
USD funding costs have affected foreign banks’ willingness to extend cross-border loans to emerging Asia,
and if so, the implications for the Singapore banking system.
USD accounts for the bulk of
cross-border credit to emerging Asia
Chart H1 Currency Composition of Cross-border Credit to
Emerging Asia
Source: BIS Locational Statistics Note: As at Q1 2017.
USD cross-border lending to emerging Asia has declined amid rising USD funding pressures on banks
Banks’ USD funding costs have been rising. The three-month USD London Interbank Offered Rate (3M USD
LIBOR) climbed to 1.4% in November 2017, the highest in eight years (Chart H2). Tighter USD liquidity, and
hence higher borrowing costs, have also been observed in the swap markets, with widening premiums vis-
à-vis the USD LIBOR on one-year cross-currency basis swap contracts since the second half of 2014 (Chart
H3).
Alongside rising US interest rates, USD cross-border lending to emerging Asia contracted between Q1 2015
and Q3 2016 (Chart H4). As a regional financial centre, Singapore intermediates credit to emerging Asia.
Cross-border flows from Singapore’s banking system to emerging Asia accounted for 21% of total cross-
110 US money market reforms had also contributed to higher USD wholesale borrowing costs. The US Securities and Exchange Commission (SEC) announced new regulatory requirements for money market funds in 2014 and the full reforms came into effect in October 2016. 111 For the purpose of this box, emerging Asia refers to China, India, Indonesia, Korea, Malaysia, the Philippines, Thailand, Taiwan and Vietnam. According to BIS Locational Statistics, these nine economies accounted for 86% of USD cross-border credit to the emerging Asia and Pacific regions as at Q1 2017.
USD77%
EUR6%
JPY3%
GBP1%
CHF0%
Others13%
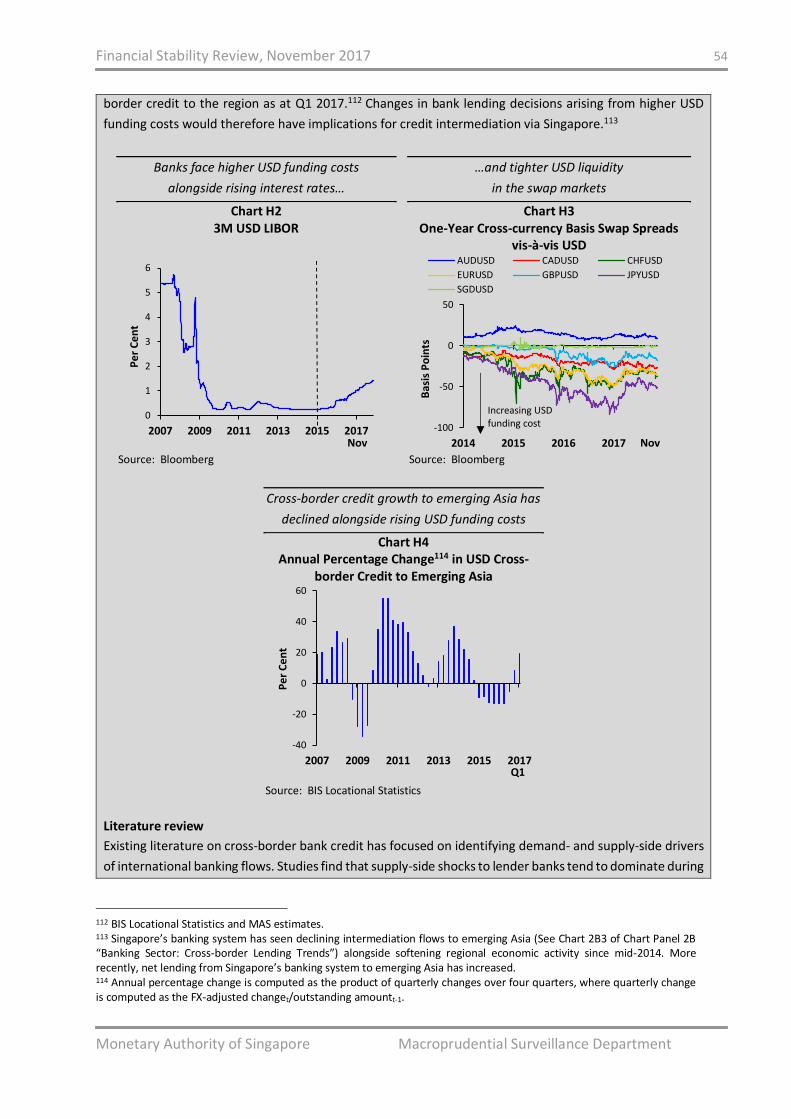
Financial Stability Review, November 2017 54
Monetary Authority of Singapore Macroprudential Surveillance Department
border credit to the region as at Q1 2017.112 Changes in bank lending decisions arising from higher USD
funding costs would therefore have implications for credit intermediation via Singapore.113
Banks face higher USD funding costs
alongside rising interest rates…
Chart H2 3M USD LIBOR
Source: Bloomberg
…and tighter USD liquidity
in the swap markets
Chart H3 One-Year Cross-currency Basis Swap Spreads
vis-à-vis USD
Source: Bloomberg
Cross-border credit growth to emerging Asia has
declined alongside rising USD funding costs
Chart H4 Annual Percentage Change114 in USD Cross-
border Credit to Emerging Asia
Source: BIS Locational Statistics
Literature review
Existing literature on cross-border bank credit has focused on identifying demand- and supply-side drivers
of international banking flows. Studies find that supply-side shocks to lender banks tend to dominate during
112 BIS Locational Statistics and MAS estimates. 113 Singapore’s banking system has seen declining intermediation flows to emerging Asia (See Chart 2B3 of Chart Panel 2B “Banking Sector: Cross-border Lending Trends”) alongside softening regional economic activity since mid-2014. More recently, net lending from Singapore’s banking system to emerging Asia has increased. 114 Annual percentage change is computed as the product of quarterly changes over four quarters, where quarterly change is computed as the FX-adjusted changet/outstanding amountt-1.
0
1
2
3
4
5
6
2007 2009 2011 2013 2015 2017
Pe
r C
en
t
Nov
-100
-50
0
50
2014 2015 2016 2017
Bas
is P
oin
ts
AUDUSD CADUSD CHFUSD
EURUSD GBPUSD JPYUSD
SGDUSD
Nov
Increasing USD funding cost
-40
-20
0
20
40
60
2007 2009 2011 2013 2015 2017
Pe
r C
en
t
Q1
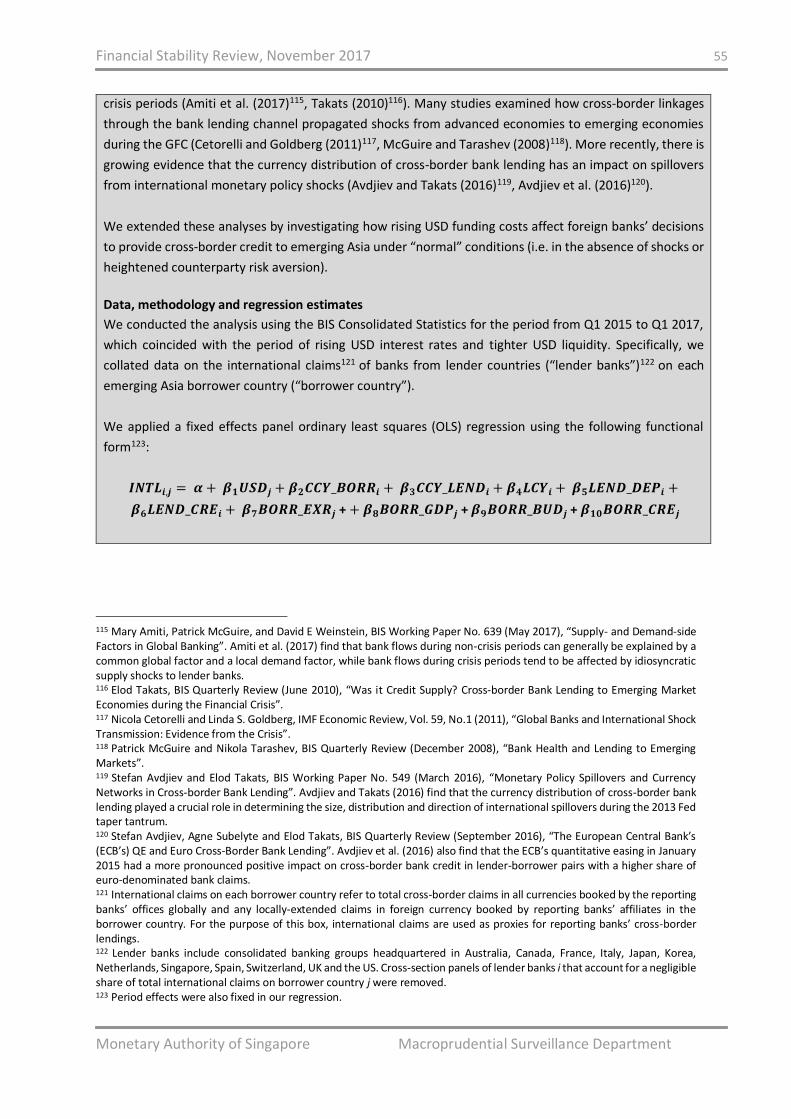
Financial Stability Review, November 2017 55
Monetary Authority of Singapore Macroprudential Surveillance Department
crisis periods (Amiti et al. (2017)115, Takats (2010)116). Many studies examined how cross-border linkages
through the bank lending channel propagated shocks from advanced economies to emerging economies
during the GFC (Cetorelli and Goldberg (2011)117, McGuire and Tarashev (2008)118). More recently, there is
growing evidence that the currency distribution of cross-border bank lending has an impact on spillovers
from international monetary policy shocks (Avdjiev and Takats (2016)119, Avdjiev et al. (2016)120).
We extended these analyses by investigating how rising USD funding costs affect foreign banks’ decisions
to provide cross-border credit to emerging Asia under “normal” conditions (i.e. in the absence of shocks or
heightened counterparty risk aversion).
Data, methodology and regression estimates
We conducted the analysis using the BIS Consolidated Statistics for the period from Q1 2015 to Q1 2017,
which coincided with the period of rising USD interest rates and tighter USD liquidity. Specifically, we
collated data on the international claims121 of banks from lender countries (“lender banks”)122 on each
emerging Asia borrower country (“borrower country”).
We applied a fixed effects panel ordinary least squares (OLS) regression using the following functional
form123:
𝑰𝑵𝑻𝑳𝒊,𝒋 = 𝜶 + 𝜷𝟏𝑼𝑺𝑫𝒋 + 𝜷𝟐𝑪𝑪𝒀_𝑩𝑶𝑹𝑹𝒊 + 𝜷𝟑𝑪𝑪𝒀_𝑳𝑬𝑵𝑫𝒊 + 𝜷𝟒𝑳𝑪𝒀𝒊 + 𝜷𝟓𝑳𝑬𝑵𝑫_𝑫𝑬𝑷𝒊 +
𝜷𝟔𝑳𝑬𝑵𝑫_𝑪𝑹𝑬𝒊 + 𝜷𝟕𝑩𝑶𝑹𝑹_𝑬𝑿𝑹𝒋 + + 𝜷𝟖𝑩𝑶𝑹𝑹_𝑮𝑫𝑷𝒋 + 𝜷𝟗𝑩𝑶𝑹𝑹_𝑩𝑼𝑫𝒋 + 𝜷𝟏𝟎𝑩𝑶𝑹𝑹_𝑪𝑹𝑬𝒋
115 Mary Amiti, Patrick McGuire, and David E Weinstein, BIS Working Paper No. 639 (May 2017), “Supply- and Demand-side Factors in Global Banking”. Amiti et al. (2017) find that bank flows during non-crisis periods can generally be explained by a common global factor and a local demand factor, while bank flows during crisis periods tend to be affected by idiosyncratic supply shocks to lender banks. 116 Elod Takats, BIS Quarterly Review (June 2010), “Was it Credit Supply? Cross-border Bank Lending to Emerging Market Economies during the Financial Crisis”. 117 Nicola Cetorelli and Linda S. Goldberg, IMF Economic Review, Vol. 59, No.1 (2011), “Global Banks and International Shock Transmission: Evidence from the Crisis”. 118 Patrick McGuire and Nikola Tarashev, BIS Quarterly Review (December 2008), “Bank Health and Lending to Emerging Markets”. 119 Stefan Avdjiev and Elod Takats, BIS Working Paper No. 549 (March 2016), “Monetary Policy Spillovers and Currency Networks in Cross-border Bank Lending”. Avdjiev and Takats (2016) find that the currency distribution of cross-border bank lending played a crucial role in determining the size, distribution and direction of international spillovers during the 2013 Fed taper tantrum. 120 Stefan Avdjiev, Agne Subelyte and Elod Takats, BIS Quarterly Review (September 2016), “The European Central Bank’s (ECB’s) QE and Euro Cross-Border Bank Lending”. Avdjiev et al. (2016) also find that the ECB’s quantitative easing in January 2015 had a more pronounced positive impact on cross-border bank credit in lender-borrower pairs with a higher share of euro-denominated bank claims. 121 International claims on each borrower country refer to total cross-border claims in all currencies booked by the reporting banks’ offices globally and any locally-extended claims in foreign currency booked by reporting banks’ affiliates in the borrower country. For the purpose of this box, international claims are used as proxies for reporting banks’ cross-border lendings. 122 Lender banks include consolidated banking groups headquartered in Australia, Canada, France, Italy, Japan, Korea, Netherlands, Singapore, Spain, Switzerland, UK and the US. Cross-section panels of lender banks i that account for a negligible share of total international claims on borrower country j were removed. 123 Period effects were also fixed in our regression.
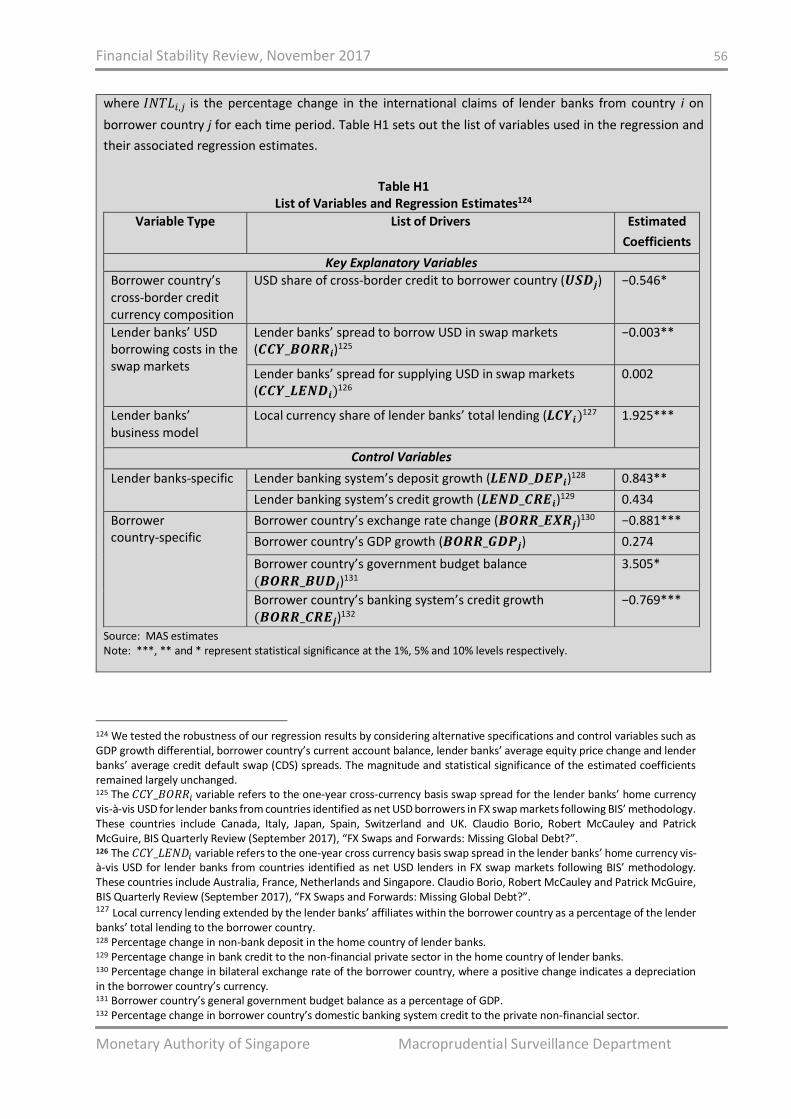
Financial Stability Review, November 2017 56
Monetary Authority of Singapore Macroprudential Surveillance Department
where 𝐼𝑁𝑇𝐿𝑖,𝑗 is the percentage change in the international claims of lender banks from country i on
borrower country j for each time period. Table H1 sets out the list of variables used in the regression and
their associated regression estimates.
Table H1 List of Variables and Regression Estimates124
Variable Type List of Drivers Estimated
Coefficients
Key Explanatory Variables
Borrower country’s cross-border credit currency composition
USD share of cross-border credit to borrower country (𝑼𝑺𝑫𝒋) −0.546*
Lender banks’ USD borrowing costs in the swap markets
Lender banks’ spread to borrow USD in swap markets (𝑪𝑪𝒀_𝑩𝑶𝑹𝑹𝒊)
125 −0.003**
Lender banks’ spread for supplying USD in swap markets (𝑪𝑪𝒀_𝑳𝑬𝑵𝑫𝒊)
126 0.002
Lender banks’ business model
Local currency share of lender banks’ total lending (𝑳𝑪𝒀𝒊)127 1.925***
Control Variables
Lender banks-specific
Lender banking system’s deposit growth (𝑳𝑬𝑵𝑫_𝑫𝑬𝑷𝒊)128 0.843**
Lender banking system’s credit growth (𝑳𝑬𝑵𝑫_𝑪𝑹𝑬𝒊)129 0.434
Borrower country-specific
Borrower country’s exchange rate change (𝑩𝑶𝑹𝑹_𝑬𝑿𝑹𝒋)130 −0.881***
Borrower country’s GDP growth (𝑩𝑶𝑹𝑹_𝑮𝑫𝑷𝒋) 0.274
Borrower country’s government budget balance (𝑩𝑶𝑹𝑹_𝑩𝑼𝑫𝒋)
131 3.505*
Borrower country’s banking system’s credit growth (𝑩𝑶𝑹𝑹_𝑪𝑹𝑬𝒋)
132 −0.769***
Source: MAS estimates Note: ***, ** and * represent statistical significance at the 1%, 5% and 10% levels respectively.
124 We tested the robustness of our regression results by considering alternative specifications and control variables such as GDP growth differential, borrower country’s current account balance, lender banks’ average equity price change and lender banks’ average credit default swap (CDS) spreads. The magnitude and statistical significance of the estimated coefficients remained largely unchanged. 125 The 𝐶𝐶𝑌_𝐵𝑂𝑅𝑅𝑖 variable refers to the one-year cross-currency basis swap spread for the lender banks’ home currency vis-à-vis USD for lender banks from countries identified as net USD borrowers in FX swap markets following BIS’ methodology. These countries include Canada, Italy, Japan, Spain, Switzerland and UK. Claudio Borio, Robert McCauley and Patrick McGuire, BIS Quarterly Review (September 2017), “FX Swaps and Forwards: Missing Global Debt?”. 126 The 𝐶𝐶𝑌_𝐿𝐸𝑁𝐷𝑖 variable refers to the one-year cross currency basis swap spread in the lender banks’ home currency vis-à-vis USD for lender banks from countries identified as net USD lenders in FX swap markets following BIS’ methodology. These countries include Australia, France, Netherlands and Singapore. Claudio Borio, Robert McCauley and Patrick McGuire, BIS Quarterly Review (September 2017), “FX Swaps and Forwards: Missing Global Debt?”. 127 Local currency lending extended by the lender banks’ affiliates within the borrower country as a percentage of the lender banks’ total lending to the borrower country. 128 Percentage change in non-bank deposit in the home country of lender banks. 129 Percentage change in bank credit to the non-financial private sector in the home country of lender banks. 130 Percentage change in bilateral exchange rate of the borrower country, where a positive change indicates a depreciation in the borrower country’s currency. 131 Borrower country’s general government budget balance as a percentage of GDP. 132 Percentage change in borrower country’s domestic banking system credit to the private non-financial sector.
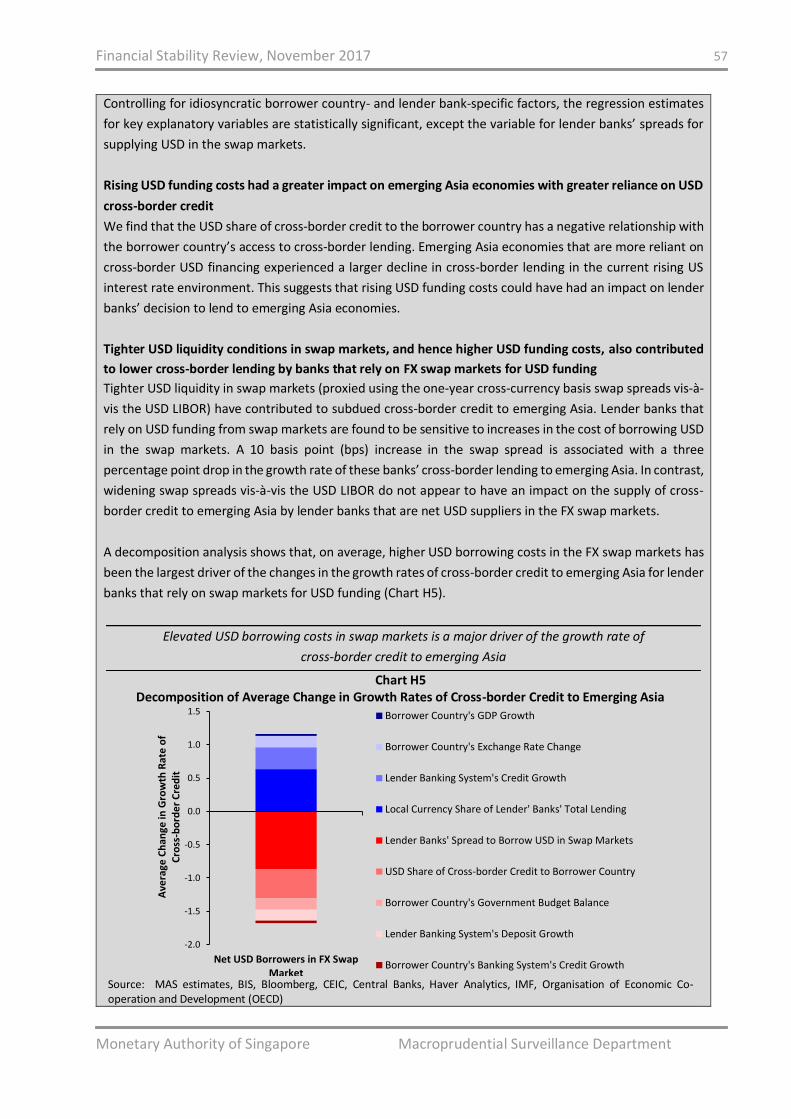
Financial Stability Review, November 2017 57
Monetary Authority of Singapore Macroprudential Surveillance Department
Controlling for idiosyncratic borrower country- and lender bank-specific factors, the regression estimates
for key explanatory variables are statistically significant, except the variable for lender banks’ spreads for
supplying USD in the swap markets.
Rising USD funding costs had a greater impact on emerging Asia economies with greater reliance on USD
cross-border credit
We find that the USD share of cross-border credit to the borrower country has a negative relationship with
the borrower country’s access to cross-border lending. Emerging Asia economies that are more reliant on
cross-border USD financing experienced a larger decline in cross-border lending in the current rising US
interest rate environment. This suggests that rising USD funding costs could have had an impact on lender
banks’ decision to lend to emerging Asia economies.
Tighter USD liquidity conditions in swap markets, and hence higher USD funding costs, also contributed
to lower cross-border lending by banks that rely on FX swap markets for USD funding
Tighter USD liquidity in swap markets (proxied using the one-year cross-currency basis swap spreads vis-à-
vis the USD LIBOR) have contributed to subdued cross-border credit to emerging Asia. Lender banks that
rely on USD funding from swap markets are found to be sensitive to increases in the cost of borrowing USD
in the swap markets. A 10 basis point (bps) increase in the swap spread is associated with a three
percentage point drop in the growth rate of these banks’ cross-border lending to emerging Asia. In contrast,
widening swap spreads vis-à-vis the USD LIBOR do not appear to have an impact on the supply of cross-
border credit to emerging Asia by lender banks that are net USD suppliers in the FX swap markets.
A decomposition analysis shows that, on average, higher USD borrowing costs in the FX swap markets has
been the largest driver of the changes in the growth rates of cross-border credit to emerging Asia for lender
banks that rely on swap markets for USD funding (Chart H5).
Elevated USD borrowing costs in swap markets is a major driver of the growth rate of
cross-border credit to emerging Asia
Chart H5 Decomposition of Average Change in Growth Rates of Cross-border Credit to Emerging Asia
Source: MAS estimates, BIS, Bloomberg, CEIC, Central Banks, Haver Analytics, IMF, Organisation of Economic Co-operation and Development (OECD)
-2.0
-1.5
-1.0
-0.5
0.0
0.5
1.0
1.5
Net USD Borrowers in FX SwapMarket
Ave
rage
Ch
ange
in G
row
th R
ate
of
Cro
ss-b
ord
er
Cre
dit
-2.0
-1.5
-1.0
-0.5
0.0
0.5
1.0
1.5
Net USD Borrowers inFX Swap Market
Ave
rage
Ch
ange
in G
row
th R
ate
of
Cro
ss-b
ord
er
Cre
dit
Borrower Country's GDP Growth
Borrower Country's Exchange Rate Change
Lender Banking System's Credit Growth
Local Currency Share of Lender' Banks' Total Lending
Lender Banks' Spread to Borrow USD in Swap Markets
USD Share of Cross-border Credit to Borrower Country
Borrower Country's Government Budget Balance
Lender Banking System's Deposit Growth
Borrower Country's Banking System's Credit Growth
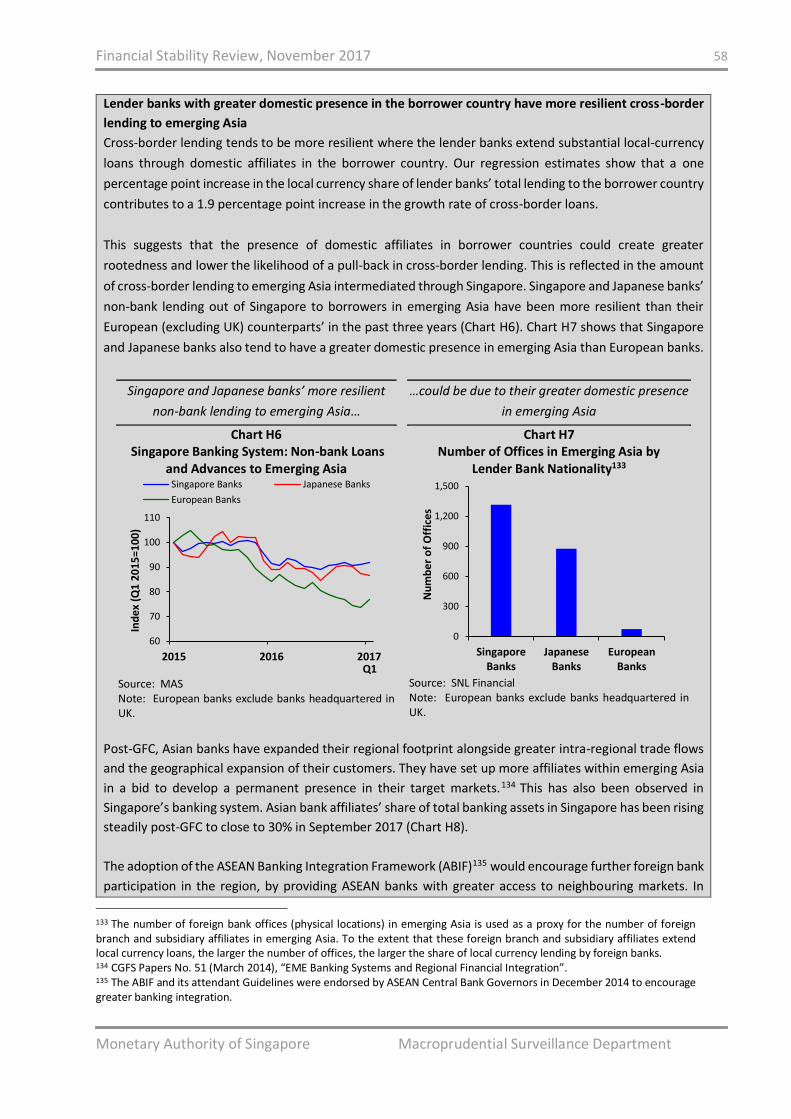
Financial Stability Review, November 2017 58
Monetary Authority of Singapore Macroprudential Surveillance Department
Lender banks with greater domestic presence in the borrower country have more resilient cross-border
lending to emerging Asia
Cross-border lending tends to be more resilient where the lender banks extend substantial local-currency
loans through domestic affiliates in the borrower country. Our regression estimates show that a one
percentage point increase in the local currency share of lender banks’ total lending to the borrower country
contributes to a 1.9 percentage point increase in the growth rate of cross-border loans.
This suggests that the presence of domestic affiliates in borrower countries could create greater
rootedness and lower the likelihood of a pull-back in cross-border lending. This is reflected in the amount
of cross-border lending to emerging Asia intermediated through Singapore. Singapore and Japanese banks’
non-bank lending out of Singapore to borrowers in emerging Asia have been more resilient than their
European (excluding UK) counterparts’ in the past three years (Chart H6). Chart H7 shows that Singapore
and Japanese banks also tend to have a greater domestic presence in emerging Asia than European banks.
Singapore and Japanese banks’ more resilient
non-bank lending to emerging Asia…
Chart H6 Singapore Banking System: Non-bank Loans
and Advances to Emerging Asia
Source: MAS Note: European banks exclude banks headquartered in UK.
…could be due to their greater domestic presence
in emerging Asia
Chart H7 Number of Offices in Emerging Asia by
Lender Bank Nationality133
Source: SNL Financial Note: European banks exclude banks headquartered in UK.
Post-GFC, Asian banks have expanded their regional footprint alongside greater intra-regional trade flows
and the geographical expansion of their customers. They have set up more affiliates within emerging Asia
in a bid to develop a permanent presence in their target markets.134 This has also been observed in
Singapore’s banking system. Asian bank affiliates’ share of total banking assets in Singapore has been rising
steadily post-GFC to close to 30% in September 2017 (Chart H8).
The adoption of the ASEAN Banking Integration Framework (ABIF)135 would encourage further foreign bank
participation in the region, by providing ASEAN banks with greater access to neighbouring markets. In
133 The number of foreign bank offices (physical locations) in emerging Asia is used as a proxy for the number of foreign branch and subsidiary affiliates in emerging Asia. To the extent that these foreign branch and subsidiary affiliates extend local currency loans, the larger the number of offices, the larger the share of local currency lending by foreign banks. 134 CGFS Papers No. 51 (March 2014), “EME Banking Systems and Regional Financial Integration”. 135 The ABIF and its attendant Guidelines were endorsed by ASEAN Central Bank Governors in December 2014 to encourage greater banking integration.
60
70
80
90
100
110
2015 2016 2017
Ind
ex
(Q1
20
15
=10
0)
Singapore Banks Japanese Banks
European Banks
Q1
0
300
600
900
1,200
1,500
SingaporeBanks
JapaneseBanks
EuropeanBanks
Nu
mb
er
of
Off
ice
s
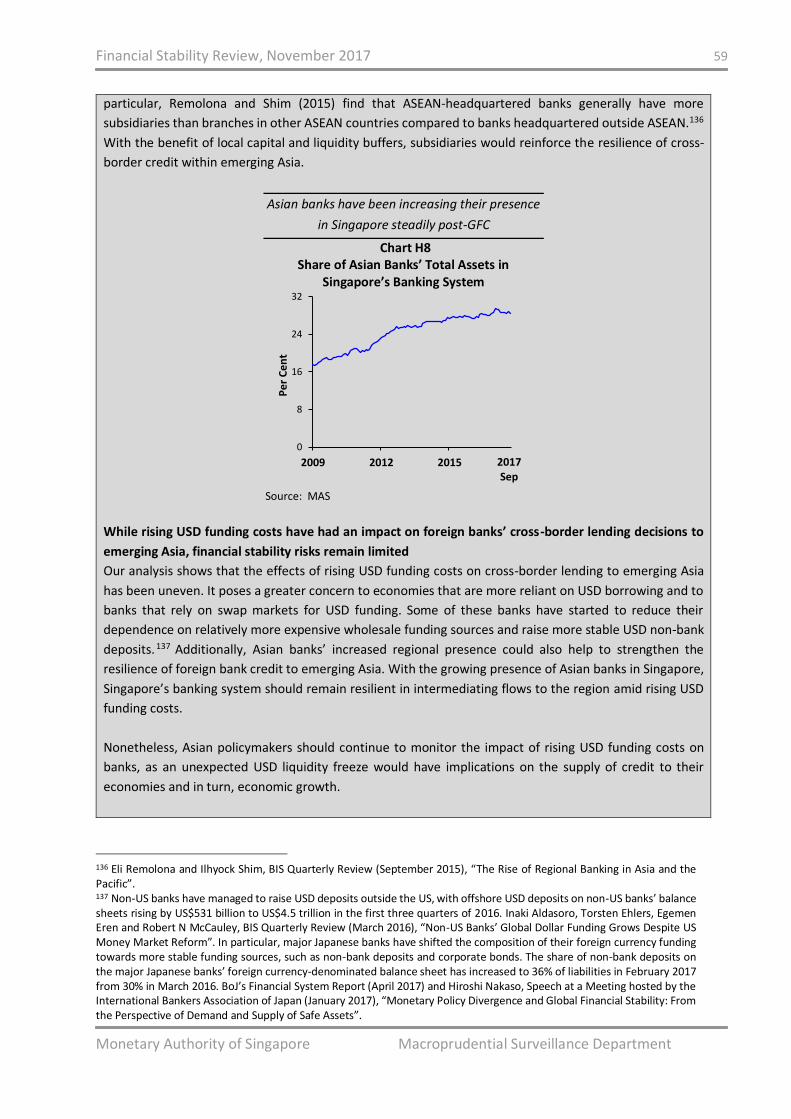
Financial Stability Review, November 2017 59
Monetary Authority of Singapore Macroprudential Surveillance Department
particular, Remolona and Shim (2015) find that ASEAN-headquartered banks generally have more
subsidiaries than branches in other ASEAN countries compared to banks headquartered outside ASEAN.136
With the benefit of local capital and liquidity buffers, subsidiaries would reinforce the resilience of cross-
border credit within emerging Asia.
Asian banks have been increasing their presence
in Singapore steadily post-GFC
Chart H8 Share of Asian Banks’ Total Assets in
Singapore’s Banking System
Source: MAS
While rising USD funding costs have had an impact on foreign banks’ cross-border lending decisions to
emerging Asia, financial stability risks remain limited
Our analysis shows that the effects of rising USD funding costs on cross-border lending to emerging Asia
has been uneven. It poses a greater concern to economies that are more reliant on USD borrowing and to
banks that rely on swap markets for USD funding. Some of these banks have started to reduce their
dependence on relatively more expensive wholesale funding sources and raise more stable USD non-bank
deposits.137 Additionally, Asian banks’ increased regional presence could also help to strengthen the
resilience of foreign bank credit to emerging Asia. With the growing presence of Asian banks in Singapore,
Singapore’s banking system should remain resilient in intermediating flows to the region amid rising USD
funding costs.
Nonetheless, Asian policymakers should continue to monitor the impact of rising USD funding costs on
banks, as an unexpected USD liquidity freeze would have implications on the supply of credit to their
economies and in turn, economic growth.
136 Eli Remolona and Ilhyock Shim, BIS Quarterly Review (September 2015), “The Rise of Regional Banking in Asia and the Pacific”. 137 Non-US banks have managed to raise USD deposits outside the US, with offshore USD deposits on non-US banks’ balance sheets rising by US$531 billion to US$4.5 trillion in the first three quarters of 2016. Inaki Aldasoro, Torsten Ehlers, Egemen Eren and Robert N McCauley, BIS Quarterly Review (March 2016), “Non-US Banks’ Global Dollar Funding Grows Despite US Money Market Reform”. In particular, major Japanese banks have shifted the composition of their foreign currency funding towards more stable funding sources, such as non-bank deposits and corporate bonds. The share of non-bank deposits on the major Japanese banks’ foreign currency-denominated balance sheet has increased to 36% of liabilities in February 2017 from 30% in March 2016. BoJ’s Financial System Report (April 2017) and Hiroshi Nakaso, Speech at a Meeting hosted by the International Bankers Association of Japan (January 2017), “Monetary Policy Divergence and Global Financial Stability: From the Perspective of Demand and Supply of Safe Assets”.
0
8
16
24
32
2009 2012 2015
Pe
r C
en
t
2017Sep
Financial Stability Review, November 2017 60
Monetary Authority of Singapore Macroprudential Surveillance Department
Box I
Industry-Wide Stress Test 2017: Enhancing the Stress Test Toolkit
MAS conducts an annual stress test of all major FIs in Singapore. The stress scenario in the exercise
provides a common baseline for FIs and MAS to assess the resilience of individual institutions and the
financial system as a whole to adverse macroeconomic and financial shocks. This box highlights the key
results from IWST 2017.
Scenario for IWST 2017 extends on macroeconomic and financial stresses
This year’s stress scenario centers on a protracted slowdown in Europe and China, with weak global
trade and commodity prices affecting the oil and gas (O&G), shipping and M&OE sectors.138 In addition
to the severe macroeconomic and financial stresses prescribed, banks also had to assume:
Exit of a core member country from the European Union (EU);
Rating downgrades in sovereign exposures to a major Asian economy and top two EU member
countries;
Defaults by top bank counterparties from a major Asian economy and the EU;
A significant share of exposures to large non-bank government-related entities in a major Asian
economy becomes non-performing; and
Defaults by top O&G, shipping and M&OE counterparties as well as rating downgrades on
exposures to these sectors.
The banking system remains resilient under severe shocks
All banks remained solvent, with their CARs well above Basel regulatory requirements under the stress
scenario. Strong capital buffers built up over the years enabled the banks to absorb losses from higher
stressed NPLs and write-offs. This is despite additional sectoral stresses, sovereign downgrades,
interbank and non-bank stresses as well as second-order effects from macro-financial feedback and
interbank contagion. In addition, banks have sufficient liquidity buffers to meet anticipated cash
outflows under the prescribed stress conditions.
138 At the same time, economic recovery in the US and Japan stalls due to negative spillovers and the US Federal Reserve halts further rate rises. The rest of Asia slips into recession and their currencies depreciate sharply, triggering a plunge in their property and stock markets. Financial conditions are assumed to tighten significantly, with sharp increases in interest rates and credit spreads. In this scenario, Singapore experiences a recession with unemployment reaching historical highs and a sharp fall in property prices. Selected financial market stress parameters are provided in the table below.
Financial Market Parameters Stress Scenario (2017 – 2019)
Property prices Cumulative drop of 50-55% over 3 years
Oil prices Cumulative drop of 50% over 3 years
Equity prices Cumulative drop of 40-60% over 3 years
Regional currencies (vs USD) Cumulative depreciation of 20-25% over 3 years
Domestic interest rates Cumulative increase of 200bps over 3 years
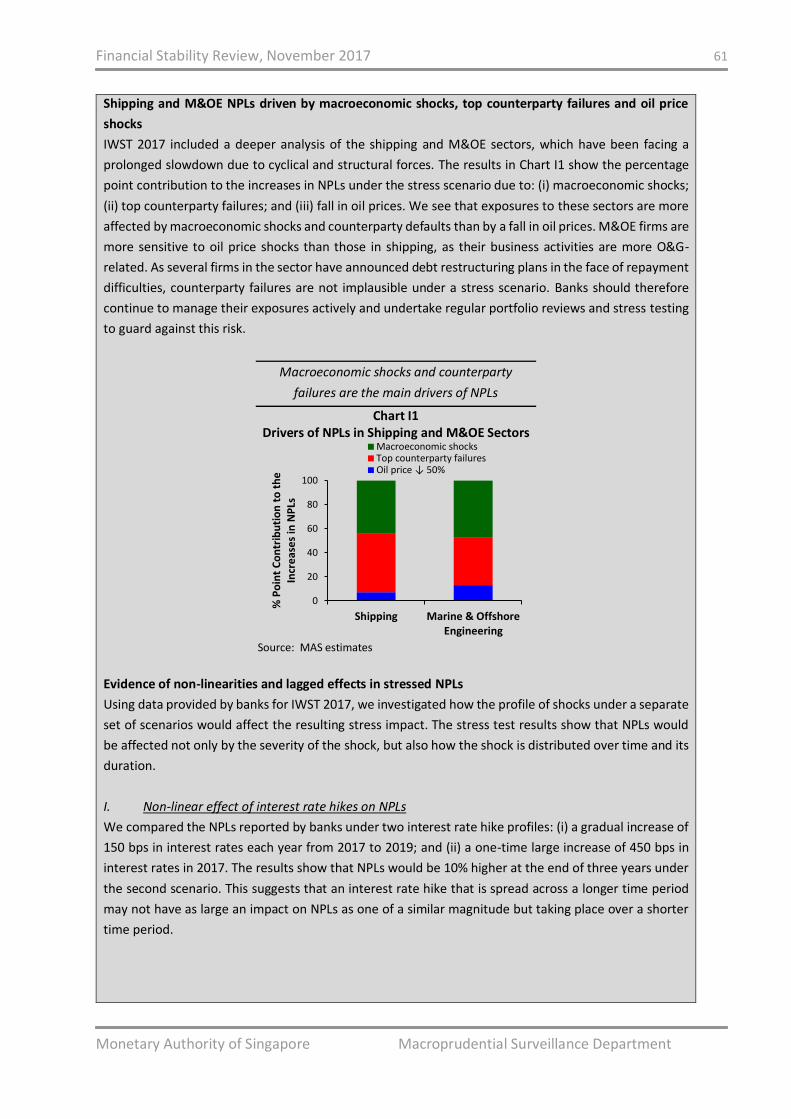
Financial Stability Review, November 2017 61
Monetary Authority of Singapore Macroprudential Surveillance Department
Shipping and M&OE NPLs driven by macroeconomic shocks, top counterparty failures and oil price
shocks
IWST 2017 included a deeper analysis of the shipping and M&OE sectors, which have been facing a
prolonged slowdown due to cyclical and structural forces. The results in Chart I1 show the percentage
point contribution to the increases in NPLs under the stress scenario due to: (i) macroeconomic shocks;
(ii) top counterparty failures; and (iii) fall in oil prices. We see that exposures to these sectors are more
affected by macroeconomic shocks and counterparty defaults than by a fall in oil prices. M&OE firms are
more sensitive to oil price shocks than those in shipping, as their business activities are more O&G-
related. As several firms in the sector have announced debt restructuring plans in the face of repayment
difficulties, counterparty failures are not implausible under a stress scenario. Banks should therefore
continue to manage their exposures actively and undertake regular portfolio reviews and stress testing
to guard against this risk.
Macroeconomic shocks and counterparty
failures are the main drivers of NPLs
Chart I1 Drivers of NPLs in Shipping and M&OE Sectors
Source: MAS estimates
Evidence of non-linearities and lagged effects in stressed NPLs
Using data provided by banks for IWST 2017, we investigated how the profile of shocks under a separate
set of scenarios would affect the resulting stress impact. The stress test results show that NPLs would
be affected not only by the severity of the shock, but also how the shock is distributed over time and its
duration.
I. Non-linear effect of interest rate hikes on NPLs
We compared the NPLs reported by banks under two interest rate hike profiles: (i) a gradual increase of
150 bps in interest rates each year from 2017 to 2019; and (ii) a one-time large increase of 450 bps in
interest rates in 2017. The results show that NPLs would be 10% higher at the end of three years under
the second scenario. This suggests that an interest rate hike that is spread across a longer time period
may not have as large an impact on NPLs as one of a similar magnitude but taking place over a shorter
time period.
0
20
40
60
80
100
Shipping Marine & OffshoreEngineering
Macroeconomic shocksTop counterparty failuresOil price ↓ 50%
% P
oin
tC
on
trib
uti
on
to
th
e
Incr
eas
es
in N
PLs
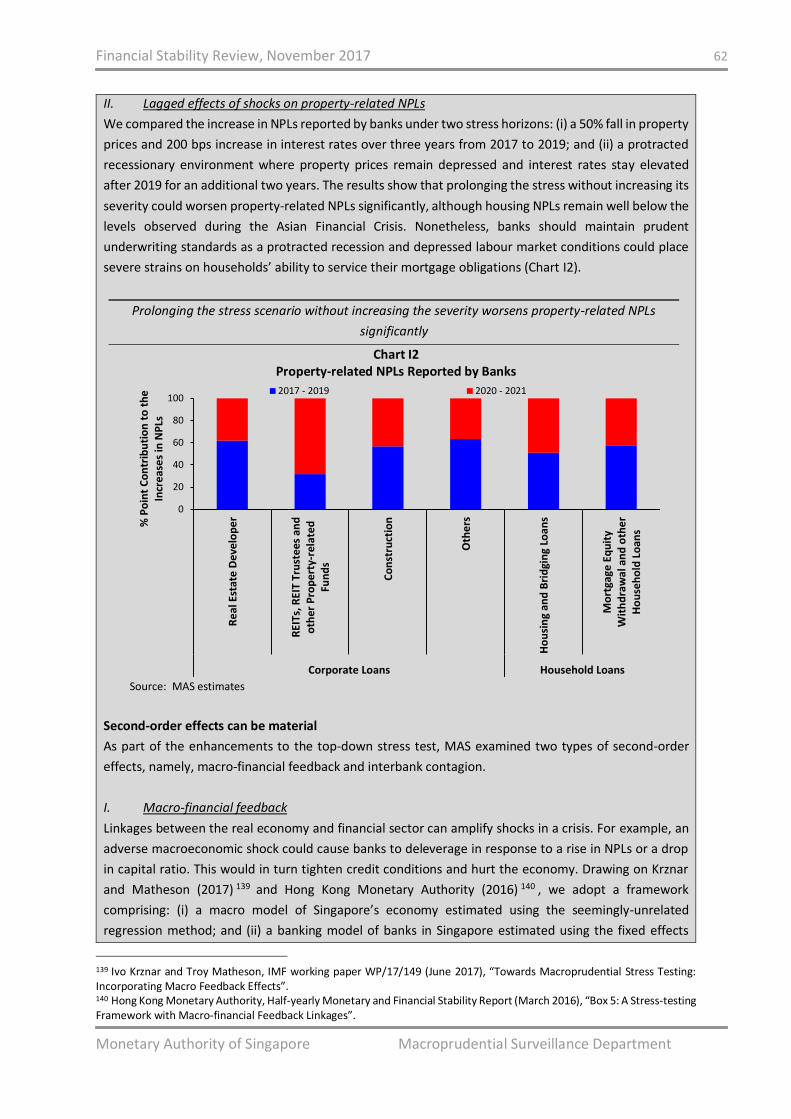
Financial Stability Review, November 2017 62
Monetary Authority of Singapore Macroprudential Surveillance Department
II. Lagged effects of shocks on property-related NPLs
We compared the increase in NPLs reported by banks under two stress horizons: (i) a 50% fall in property
prices and 200 bps increase in interest rates over three years from 2017 to 2019; and (ii) a protracted
recessionary environment where property prices remain depressed and interest rates stay elevated
after 2019 for an additional two years. The results show that prolonging the stress without increasing its
severity could worsen property-related NPLs significantly, although housing NPLs remain well below the
levels observed during the Asian Financial Crisis. Nonetheless, banks should maintain prudent
underwriting standards as a protracted recession and depressed labour market conditions could place
severe strains on households’ ability to service their mortgage obligations (Chart I2).
Prolonging the stress scenario without increasing the severity worsens property-related NPLs
significantly
Chart I2 Property-related NPLs Reported by Banks
Source: MAS estimates
Second-order effects can be material
As part of the enhancements to the top-down stress test, MAS examined two types of second-order
effects, namely, macro-financial feedback and interbank contagion.
I. Macro-financial feedback
Linkages between the real economy and financial sector can amplify shocks in a crisis. For example, an
adverse macroeconomic shock could cause banks to deleverage in response to a rise in NPLs or a drop
in capital ratio. This would in turn tighten credit conditions and hurt the economy. Drawing on Krznar
and Matheson (2017) 139 and Hong Kong Monetary Authority (2016) 140 , we adopt a framework
comprising: (i) a macro model of Singapore’s economy estimated using the seemingly-unrelated
regression method; and (ii) a banking model of banks in Singapore estimated using the fixed effects
139 Ivo Krznar and Troy Matheson, IMF working paper WP/17/149 (June 2017), “Towards Macroprudential Stress Testing: Incorporating Macro Feedback Effects”. 140 Hong Kong Monetary Authority, Half-yearly Monetary and Financial Stability Report (March 2016), “Box 5: A Stress-testing Framework with Macro-financial Feedback Linkages”.
0
20
40
60
80
100
Re
al E
stat
e D
eve
lop
er
REI
Ts, R
EIT
Tru
ste
es a
nd
oth
er P
rop
ert
y-re
late
dFu
nd
s
Co
nst
ruct
ion
Oth
ers
Ho
usi
ng
and
Bri
dgi
ng
Loan
s
Mo
rtga
ge E
qu
ity
Wit
hd
raw
al a
nd
oth
er
Ho
use
ho
ld L
oan
s
Corporate Loans Household Loans
2017 - 2019 2020 - 2021
% P
oin
tC
on
trib
uti
on
to
th
e
Incr
eas
es
in N
PLs
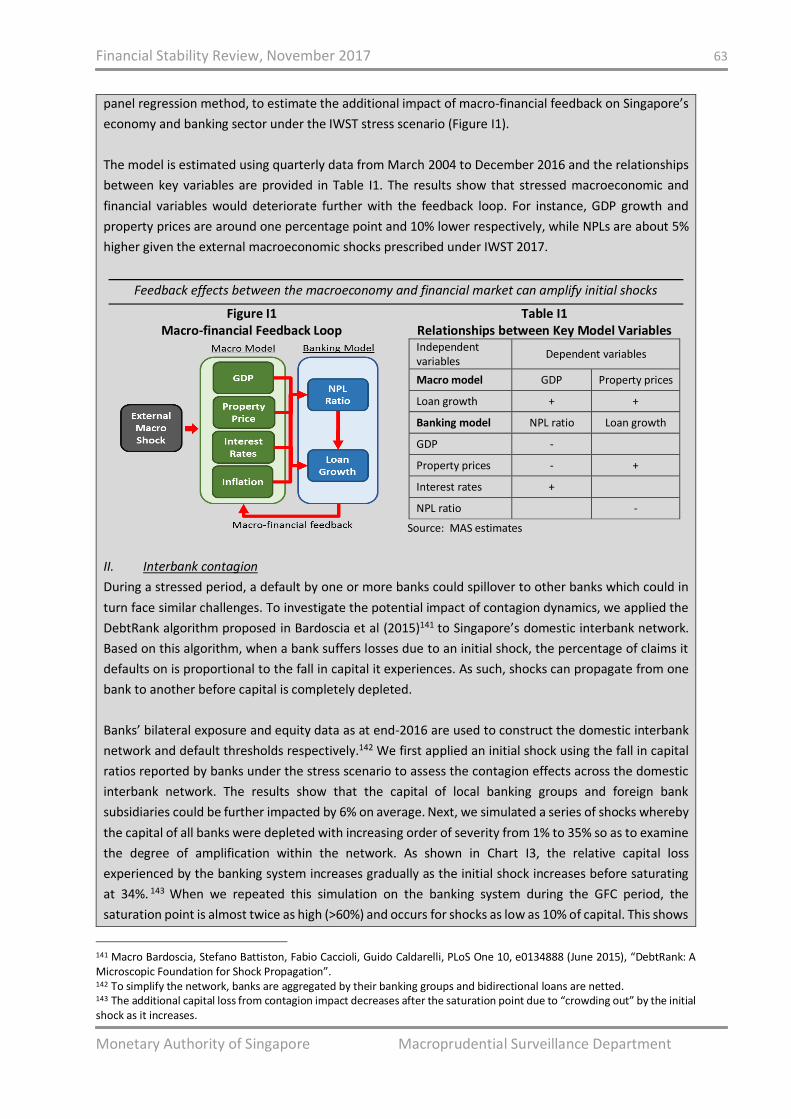
Financial Stability Review, November 2017 63
Monetary Authority of Singapore Macroprudential Surveillance Department
panel regression method, to estimate the additional impact of macro-financial feedback on Singapore’s
economy and banking sector under the IWST stress scenario (Figure I1).
The model is estimated using quarterly data from March 2004 to December 2016 and the relationships
between key variables are provided in Table I1. The results show that stressed macroeconomic and
financial variables would deteriorate further with the feedback loop. For instance, GDP growth and
property prices are around one percentage point and 10% lower respectively, while NPLs are about 5%
higher given the external macroeconomic shocks prescribed under IWST 2017.
Feedback effects between the macroeconomy and financial market can amplify initial shocks
Figure I1 Macro-financial Feedback Loop
Table I1 Relationships between Key Model Variables Independent variables
Dependent variables
Macro model GDP Property prices
Loan growth + +
Banking model NPL ratio Loan growth
GDP -
Property prices - +
Interest rates +
NPL ratio -
Source: MAS estimates
II. Interbank contagion
During a stressed period, a default by one or more banks could spillover to other banks which could in
turn face similar challenges. To investigate the potential impact of contagion dynamics, we applied the
DebtRank algorithm proposed in Bardoscia et al (2015)141 to Singapore’s domestic interbank network.
Based on this algorithm, when a bank suffers losses due to an initial shock, the percentage of claims it
defaults on is proportional to the fall in capital it experiences. As such, shocks can propagate from one
bank to another before capital is completely depleted.
Banks’ bilateral exposure and equity data as at end-2016 are used to construct the domestic interbank
network and default thresholds respectively.142 We first applied an initial shock using the fall in capital
ratios reported by banks under the stress scenario to assess the contagion effects across the domestic
interbank network. The results show that the capital of local banking groups and foreign bank
subsidiaries could be further impacted by 6% on average. Next, we simulated a series of shocks whereby
the capital of all banks were depleted with increasing order of severity from 1% to 35% so as to examine
the degree of amplification within the network. As shown in Chart I3, the relative capital loss
experienced by the banking system increases gradually as the initial shock increases before saturating
at 34%. 143 When we repeated this simulation on the banking system during the GFC period, the
saturation point is almost twice as high (>60%) and occurs for shocks as low as 10% of capital. This shows
141 Macro Bardoscia, Stefano Battiston, Fabio Caccioli, Guido Caldarelli, PLoS One 10, e0134888 (June 2015), “DebtRank: A Microscopic Foundation for Shock Propagation”. 142 To simplify the network, banks are aggregated by their banking groups and bidirectional loans are netted. 143 The additional capital loss from contagion impact decreases after the saturation point due to “crowding out” by the initial shock as it increases.
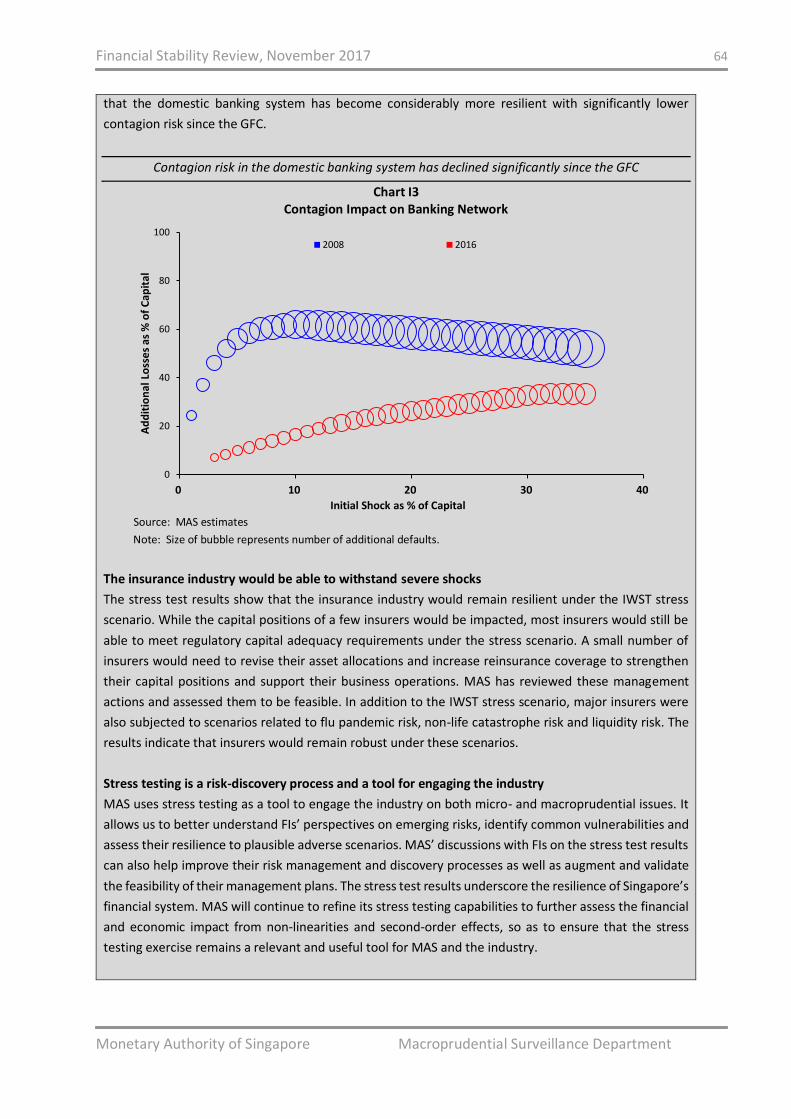
Financial Stability Review, November 2017 64
Monetary Authority of Singapore Macroprudential Surveillance Department
that the domestic banking system has become considerably more resilient with significantly lower
contagion risk since the GFC.
Contagion risk in the domestic banking system has declined significantly since the GFC
Chart I3 Contagion Impact on Banking Network
Source: MAS estimates
Note: Size of bubble represents number of additional defaults.
The insurance industry would be able to withstand severe shocks
The stress test results show that the insurance industry would remain resilient under the IWST stress
scenario. While the capital positions of a few insurers would be impacted, most insurers would still be
able to meet regulatory capital adequacy requirements under the stress scenario. A small number of
insurers would need to revise their asset allocations and increase reinsurance coverage to strengthen
their capital positions and support their business operations. MAS has reviewed these management
actions and assessed them to be feasible. In addition to the IWST stress scenario, major insurers were
also subjected to scenarios related to flu pandemic risk, non-life catastrophe risk and liquidity risk. The
results indicate that insurers would remain robust under these scenarios.
Stress testing is a risk-discovery process and a tool for engaging the industry
MAS uses stress testing as a tool to engage the industry on both micro- and macroprudential issues. It
allows us to better understand FIs’ perspectives on emerging risks, identify common vulnerabilities and
assess their resilience to plausible adverse scenarios. MAS’ discussions with FIs on the stress test results
can also help improve their risk management and discovery processes as well as augment and validate
the feasibility of their management plans. The stress test results underscore the resilience of Singapore’s
financial system. MAS will continue to refine its stress testing capabilities to further assess the financial
and economic impact from non-linearities and second-order effects, so as to ensure that the stress
testing exercise remains a relevant and useful tool for MAS and the industry.
0
20
40
60
80
100
0 10 20 30 40
Initial Shock as % of Capital
Ad
dit
ion
al L
oss
es
as %
of
Cap
ital
0
0.5
1
1.5
2
2.5
3
3.5
Label Graph
Chart Title
2008 2016
Financial Stability Review, November 2017 65
Monetary Authority of Singapore Macroprudential Surveillance Department
Box J Do Trust Companies in Singapore Pose Shadow Banking Risks?
This box provides an assessment of the shadow banking risks posed by trust companies in Singapore using
regulatory and survey data of licensed trust companies in Singapore.
International shadow banking discussions include an assessment of potential risks posed by trust companies Since the GFC, there has been increased international scrutiny of the shadow banking risks posed by non-
bank entities across various jurisdictions.144 A particular area of focus has been collective investment
schemes with features that make them susceptible to runs. A run on collective investment schemes can
lead to fire sales by asset managers to meet redemptions. This can in turn distort liquidity and pricing
conditions in markets, with potential adverse spillovers on other market participants and counterparties.
There has been concern that trust companies might exhibit similar features and risks as collective
investment schemes even though they are not explicitly recognised or structured as "funds" or "investment
vehicles". Against this backdrop, we assess trust companies in Singapore more closely to determine the
extent of maturity transformation, liquidity transformation, leverage and credit risk transfer that they may
undertake.
Trust companies are subject to regulation in Singapore In Singapore, entities that carry out trust business145 must be licensed under the Trust Companies Act.146
Licensed trust companies are subject to ongoing supervision by MAS and must submit regular returns to
MAS on information such as their revenues, expenditures and asset compositions.147
Trust company activities and the associated financial stability risks can vary significantly across jurisdictions In some jurisdictions, trust companies manage collective investment schemes on their clients’ behalf and
invest in credit assets, including in direct loans to non-financial corporate borrowers. These trusts may
undertake liquidity and maturity transformation through their investments. This can give rise to run risks
as they may face numerous redemption requests within a short time period under stressed financial
conditions.
144 The FSB defines shadow banking as “credit intermediation involving entities and activities (fully or partially) outside the banking system”. The four key aspects of non-bank credit intermediation are: 1. Maturity transformation: Obtaining short-term funds to invest in longer-term assets. 2. Liquidity transformation: Using liquid/cash-like liabilities to buy illiquid assets. 3. Leverage: Borrowing money to buy assets to magnify the potential gains on an investment. 4. Credit risk transfer: Taking on or transferring of the risk of borrower defaults across different entities. 145 Trust business include: (a) the provision of services with respect to the creation of an express trust; (b) acting as trustee in relation to an express trust; (c) arranging for any person to act as trustee in respect of an express trust; and (d) the provision of trust administration services in relation to an express trust. 146 Singapore-domiciled funds that are structured as trusts are regulated separately as authorised funds under the Securities and Futures Act (SFA). Fund managers, regardless of whether they manage Singapore-domiciled or foreign funds, are regulated under the SFA as well. 147 Beyond regular regulatory returns, MAS also collects additional information during its regular supervision to assess if trust companies have in place proper processes and controls to mitigate any risks underlying their business activities.
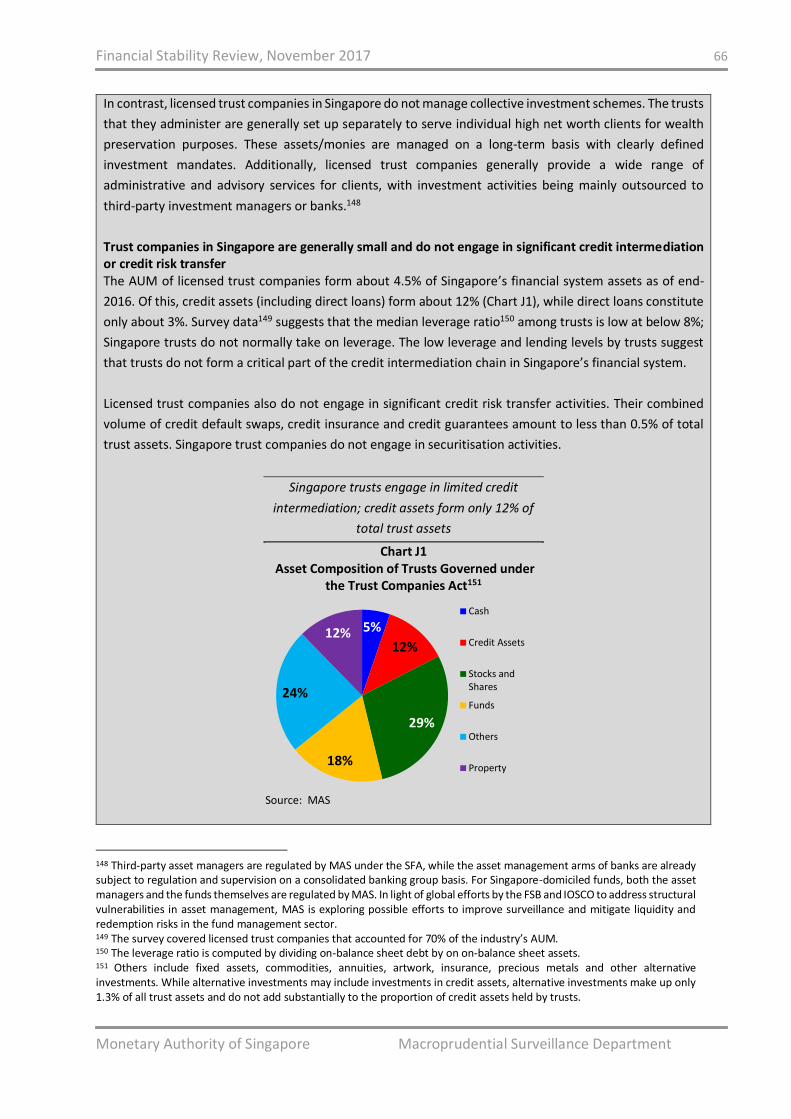
Financial Stability Review, November 2017 66
Monetary Authority of Singapore Macroprudential Surveillance Department
In contrast, licensed trust companies in Singapore do not manage collective investment schemes. The trusts
that they administer are generally set up separately to serve individual high net worth clients for wealth
preservation purposes. These assets/monies are managed on a long-term basis with clearly defined
investment mandates. Additionally, licensed trust companies generally provide a wide range of
administrative and advisory services for clients, with investment activities being mainly outsourced to
third-party investment managers or banks.148
Trust companies in Singapore are generally small and do not engage in significant credit intermediation or credit risk transfer The AUM of licensed trust companies form about 4.5% of Singapore’s financial system assets as of end-
2016. Of this, credit assets (including direct loans) form about 12% (Chart J1), while direct loans constitute
only about 3%. Survey data149 suggests that the median leverage ratio150 among trusts is low at below 8%;
Singapore trusts do not normally take on leverage. The low leverage and lending levels by trusts suggest
that trusts do not form a critical part of the credit intermediation chain in Singapore’s financial system.
Licensed trust companies also do not engage in significant credit risk transfer activities. Their combined
volume of credit default swaps, credit insurance and credit guarantees amount to less than 0.5% of total
trust assets. Singapore trust companies do not engage in securitisation activities.
Singapore trusts engage in limited credit
intermediation; credit assets form only 12% of
total trust assets
Chart J1 Asset Composition of Trusts Governed under
the Trust Companies Act151
Source: MAS
148 Third-party asset managers are regulated by MAS under the SFA, while the asset management arms of banks are already subject to regulation and supervision on a consolidated banking group basis. For Singapore-domiciled funds, both the asset managers and the funds themselves are regulated by MAS. In light of global efforts by the FSB and IOSCO to address structural vulnerabilities in asset management, MAS is exploring possible efforts to improve surveillance and mitigate liquidity and redemption risks in the fund management sector. 149 The survey covered licensed trust companies that accounted for 70% of the industry’s AUM. 150 The leverage ratio is computed by dividing on-balance sheet debt by on on-balance sheet assets. 151 Others include fixed assets, commodities, annuities, artwork, insurance, precious metals and other alternative investments. While alternative investments may include investments in credit assets, alternative investments make up only 1.3% of all trust assets and do not add substantially to the proportion of credit assets held by trusts.
5%
12%
29%
18%
24%
12%
Cash
Credit Assets
Stocks andShares
Funds
Others
Property
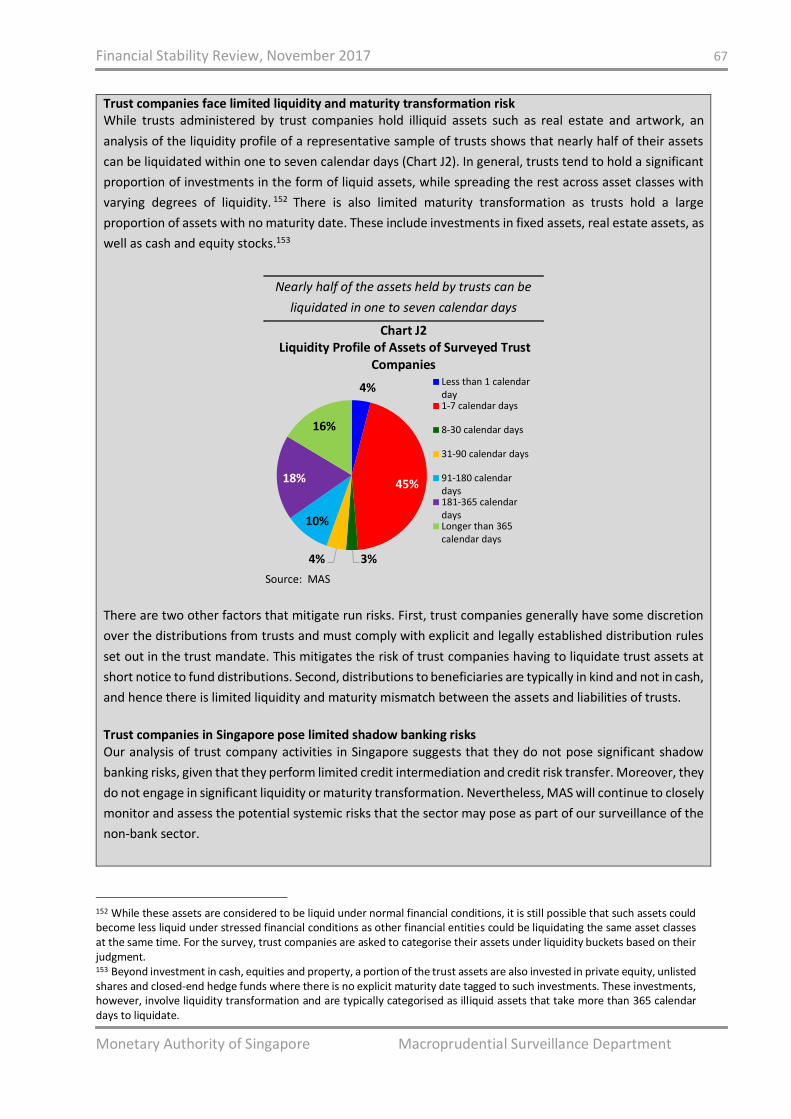
Financial Stability Review, November 2017 67
Monetary Authority of Singapore Macroprudential Surveillance Department
Trust companies face limited liquidity and maturity transformation risk While trusts administered by trust companies hold illiquid assets such as real estate and artwork, an
analysis of the liquidity profile of a representative sample of trusts shows that nearly half of their assets
can be liquidated within one to seven calendar days (Chart J2). In general, trusts tend to hold a significant
proportion of investments in the form of liquid assets, while spreading the rest across asset classes with
varying degrees of liquidity. 152 There is also limited maturity transformation as trusts hold a large
proportion of assets with no maturity date. These include investments in fixed assets, real estate assets, as
well as cash and equity stocks.153
Nearly half of the assets held by trusts can be
liquidated in one to seven calendar days
Chart J2 Liquidity Profile of Assets of Surveyed Trust
Companies
Source: MAS
There are two other factors that mitigate run risks. First, trust companies generally have some discretion
over the distributions from trusts and must comply with explicit and legally established distribution rules
set out in the trust mandate. This mitigates the risk of trust companies having to liquidate trust assets at
short notice to fund distributions. Second, distributions to beneficiaries are typically in kind and not in cash,
and hence there is limited liquidity and maturity mismatch between the assets and liabilities of trusts.
Trust companies in Singapore pose limited shadow banking risks Our analysis of trust company activities in Singapore suggests that they do not pose significant shadow
banking risks, given that they perform limited credit intermediation and credit risk transfer. Moreover, they
do not engage in significant liquidity or maturity transformation. Nevertheless, MAS will continue to closely
monitor and assess the potential systemic risks that the sector may pose as part of our surveillance of the
non-bank sector.
152 While these assets are considered to be liquid under normal financial conditions, it is still possible that such assets could become less liquid under stressed financial conditions as other financial entities could be liquidating the same asset classes at the same time. For the survey, trust companies are asked to categorise their assets under liquidity buckets based on their judgment. 153 Beyond investment in cash, equities and property, a portion of the trust assets are also invested in private equity, unlisted shares and closed-end hedge funds where there is no explicit maturity date tagged to such investments. These investments, however, involve liquidity transformation and are typically categorised as illiquid assets that take more than 365 calendar days to liquidate.
4%
45%
3%4%
10%
18%
16%
Less than 1 calendarday1-7 calendar days
8-30 calendar days
31-90 calendar days
91-180 calendardays181-365 calendardaysLonger than 365calendar days
Financial Stability Review, November 2017 68
Monetary Authority of Singapore Macroprudential Surveillance Department
Box K
Over-the-Counter Derivatives Transaction Data: Paving the Road to Market Transparency
As part of international efforts to promote greater transparency in the Over-the-Counter (OTC) derivatives
market, MAS commenced mandatory reporting of OTC derivatives transactions to trade repositories in
2014. Interest rate, credit and FX derivatives transactions are currently being reported. MAS intends to
require mandatory reporting by banks for the remaining asset classes — equity and commodity derivatives
— in October 2018, followed by other FIs and entities in a phased approach.
In parallel, MAS has made progress in analysing the reported transaction data to enhance our
understanding of the Singapore OTC derivatives market. In December 2016, MAS staff published a paper
that analysed liquidity in the FX derivatives market and the policy implications for platform trading of OTC
derivatives.154 The paper applied clustering techniques on OTC derivatives transaction data to assess the
liquidity of one-month FX forward contracts traded in Singapore across a wide range of liquidity metrics.
This year, MAS conducted a study on Singapore’s USD FX swap market to understand the market structure
and assess market resilience in times of stress (See Box L “Singapore’s US Dollar Foreign Exchange Swap
Market Structure and Resilience”).
Future plans for data publication MAS intends to begin publishing aggregated OTC derivatives transaction data in 2018. This will allow
market participants to freely access information regarding domestic market activities, such as open
positions and volumes across products. We are studying how best to conduct data cleaning and validation
to facilitate regular disclosure of timely and accurate aggregated data.
MAS continues to explore other means of bringing greater transparency to and improving understanding
of the OTC derivatives markets. Transaction-level data provides the greatest freedom of analysis for users.
However, this is predicated on accurate reporting to avoid misinforming public analysis of the transaction
data. Therefore, the arrangements for ensuring accurate transaction data must be robust and reliable. MAS
intends to work in partnership with trade repositories and market participants to develop practical and
effective solutions to improve the accuracy of transaction data.
154 Jerome Chow, Jonathan Tan and Justin Wong, MAS Staff Paper No. 54 (December 2016), “Liquidity and Policy Analyses for Platform Trading of OTC Derivatives: A Perspective of Smaller Markets”.
Financial Stability Review, November 2017 69
Monetary Authority of Singapore Macroprudential Surveillance Department
Box L Singapore’s US Dollar Foreign Exchange Swap Market Structure and Resilience
This box uses transaction-level OTC FX derivatives data155 to shed light on the structure of the USD FX swap
market in Singapore and to assess financial stability risks during recent periods of heightened volatility.
FX swaps can be a double-edged sword for financial stability
The global OTC FX derivatives markets, particularly FX swaps and outright forwards, have grown
significantly since the early 2000s (Chart L1). Non-US banks have become increasingly reliant on FX swaps
to fund their USD needs 156 , while corporates use FX swap markets to hedge currency risks from
international trade.
While FX swaps could support financial stability if used for hedging FX exposures, they could also contribute
to financial stability risks in the form of currency or maturity mismatches. In times of heightened volatility,
the costs of rolling over short-term hedges of long-term assets could spike and amplify funding and liquidity
stress.157 Banks that rely on funding from FX swap markets could also shrink their balance sheets and
reduce credit intermediation. During the GFC, FX swap markets experienced acute strains158 caused by USD
funding shortages among non-US FIs that could not obtain USD funding from the interbank market.159 This
prompted central banks to step in to provide USD liquidity to fund dollar assets.160,161 Furthermore, FX
derivatives can also be used to take directional positions and thereby contribute to market risk. Though FX
swaps are collateralised transactions, they are not entirely inured from counterparty risk. Replacement
costs could be incurred if a counterparty defaults during the contract period.162
155 MAS commenced mandatory reporting of OTC FX derivatives transactions on 1 May 2015. 156 Hiroshi Nakaso, Bank of Japan (BoJ) (January 2017), “Monetary Policy Divergence and Global Financial Stability: From the Perspective of Demand and Supply of Safe Assets”. Claudio Borio, Robert McCauley, Patrick McGuire, BIS Quarterly Review (September 2017), “FX Swaps and Forwards: Missing Global Debt?”. 157 Market participants supplying dollar funding could face liquidity constraints and hence become more reluctant to lend over longer periods, leading to a sharp shortening of FX swap maturities and increasingly costly rollover activity. Bergljot B. Barkby and Li Lian Ong, IMF Working Paper WP/10/55 (March 2010), “FX Swaps: Implications for Financial and Economic Stability”. 158 FX swap market became increasingly one-sided during the GFC as market participants competed for USD liquidity, resulting in large premia paid to access USD funding. Naohiko Baba, Frank Packer, Teppei Nagano, BIS Quarterly Review (March 2008), “The Spillover of Money Market Turbulence to FX Swap and Cross-currency Swap Markets”. 159 Participants in the interbank market who had previously supplied USD were hoarding liquidity to support their own funding needs, and withholding lending over concerns of rising counterparty risk. Bergljot B. Barkby and Li Lian Ong, IMF Working Paper WP/10/55 (March 2010), “FX Swaps: Implications for Financial and Economic Stability”. 160 Non-US central banks introduced USD central bank swap lines and USD liquidity operations in 2007 to alleviate USD shortages. Crystal Ossolinkski and Andrew Zurawski, (June 2010), “The Financial Crisis Through the Lens of Foreign Exchange Swap Markets”. 161 Patrick McGuire, Goetz von Peter, BIS Quarterly Review (March 2009), “The US Dollar Shortage in Global Banking”. 162 Naohiko Baba, Frank Packer, Teppei Nagano, BIS Quarterly Review, March 2008, “The Spillover of Money Market Turbulence to FX Swap and Cross-currency Swap Markets”.
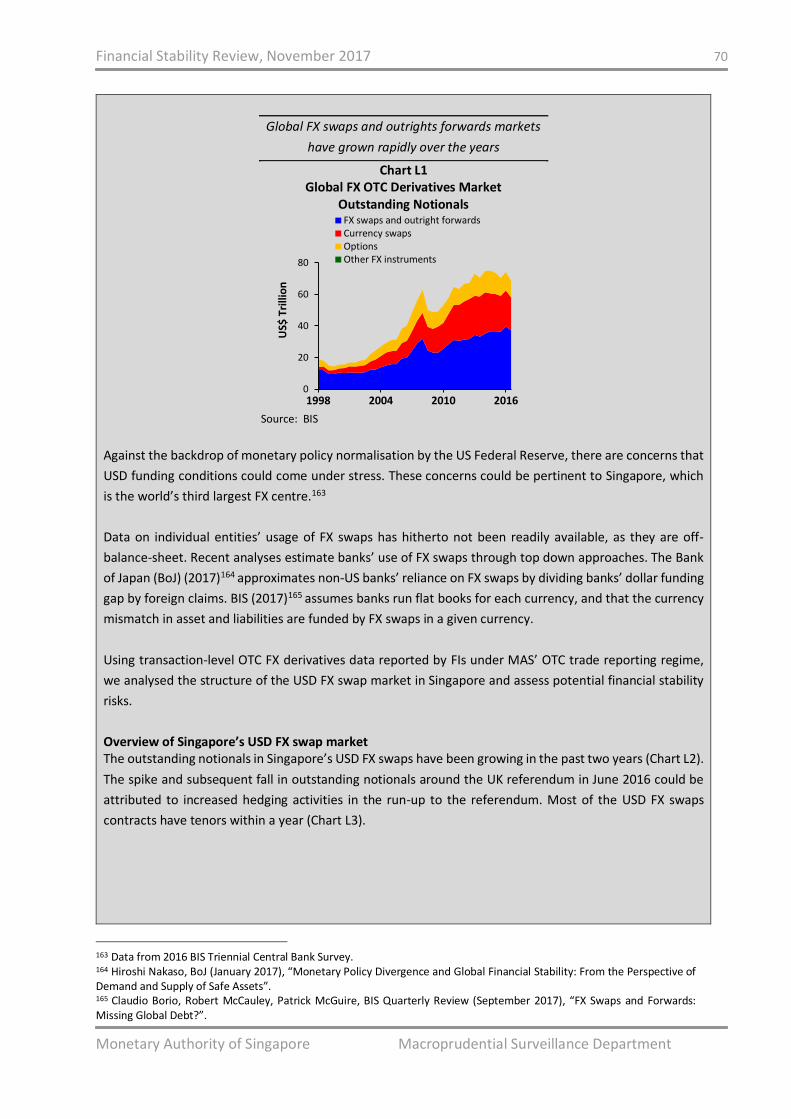
Financial Stability Review, November 2017 70
Monetary Authority of Singapore Macroprudential Surveillance Department
Global FX swaps and outrights forwards markets
have grown rapidly over the years
Chart L1 Global FX OTC Derivatives Market
Outstanding Notionals
Source: BIS
Against the backdrop of monetary policy normalisation by the US Federal Reserve, there are concerns that
USD funding conditions could come under stress. These concerns could be pertinent to Singapore, which
is the world’s third largest FX centre.163
Data on individual entities’ usage of FX swaps has hitherto not been readily available, as they are off-
balance-sheet. Recent analyses estimate banks’ use of FX swaps through top down approaches. The Bank
of Japan (BoJ) (2017)164 approximates non-US banks’ reliance on FX swaps by dividing banks’ dollar funding
gap by foreign claims. BIS (2017)165 assumes banks run flat books for each currency, and that the currency
mismatch in asset and liabilities are funded by FX swaps in a given currency.
Using transaction-level OTC FX derivatives data reported by FIs under MAS’ OTC trade reporting regime,
we analysed the structure of the USD FX swap market in Singapore and assess potential financial stability
risks.
Overview of Singapore’s USD FX swap market The outstanding notionals in Singapore’s USD FX swaps have been growing in the past two years (Chart L2).
The spike and subsequent fall in outstanding notionals around the UK referendum in June 2016 could be
attributed to increased hedging activities in the run-up to the referendum. Most of the USD FX swaps
contracts have tenors within a year (Chart L3).
163 Data from 2016 BIS Triennial Central Bank Survey. 164 Hiroshi Nakaso, BoJ (January 2017), “Monetary Policy Divergence and Global Financial Stability: From the Perspective of Demand and Supply of Safe Assets”. 165 Claudio Borio, Robert McCauley, Patrick McGuire, BIS Quarterly Review (September 2017), “FX Swaps and Forwards: Missing Global Debt?”.
0
20
40
60
80
1998 2004 2010 2016
US$
Tri
llio
n
FX swaps and outright forwardsCurrency swapsOptionsOther FX instruments
0
20
40
60
80
1998 2004 2010 2016
US$
Tri
llio
n
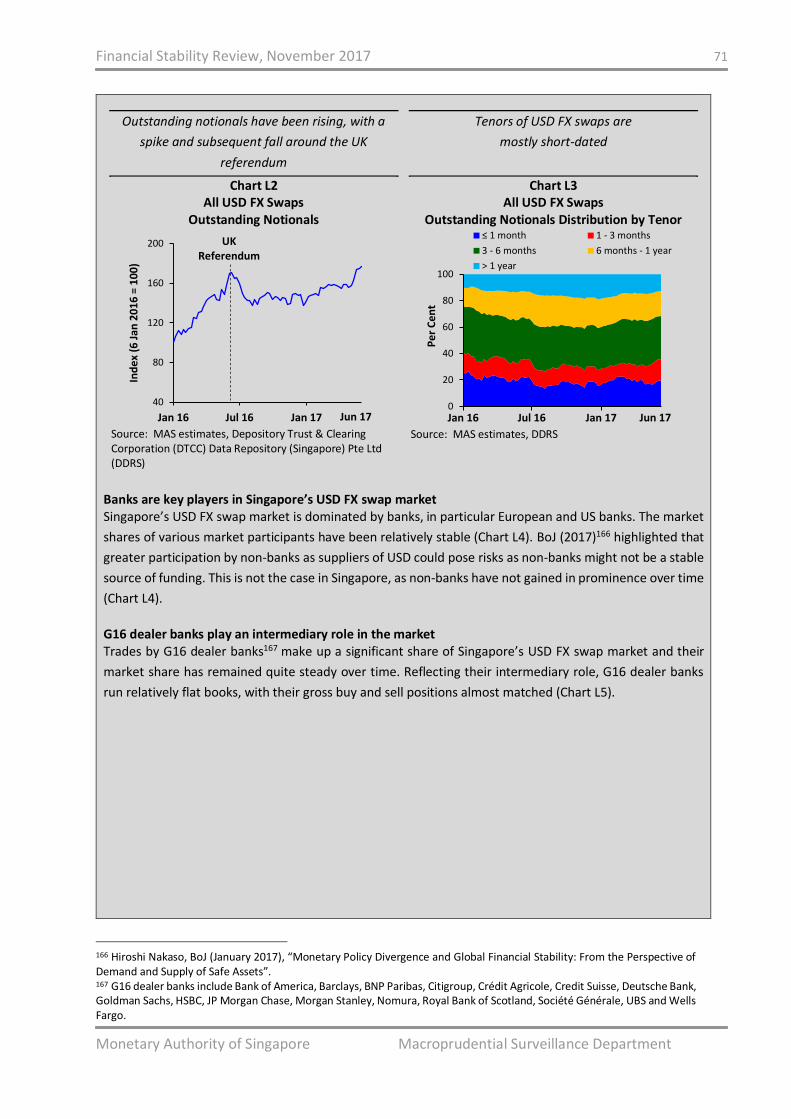
Financial Stability Review, November 2017 71
Monetary Authority of Singapore Macroprudential Surveillance Department
Outstanding notionals have been rising, with a
spike and subsequent fall around the UK
referendum
Chart L2 All USD FX Swaps
Outstanding Notionals
Source: MAS estimates, Depository Trust & Clearing Corporation (DTCC) Data Repository (Singapore) Pte Ltd (DDRS)
Tenors of USD FX swaps are
mostly short-dated
.
Chart L3 All USD FX Swaps
Outstanding Notionals Distribution by Tenor
Source: MAS estimates, DDRS
Banks are key players in Singapore’s USD FX swap market Singapore’s USD FX swap market is dominated by banks, in particular European and US banks. The market
shares of various market participants have been relatively stable (Chart L4). BoJ (2017)166 highlighted that
greater participation by non-banks as suppliers of USD could pose risks as non-banks might not be a stable
source of funding. This is not the case in Singapore, as non-banks have not gained in prominence over time
(Chart L4).
G16 dealer banks play an intermediary role in the market Trades by G16 dealer banks167 make up a significant share of Singapore’s USD FX swap market and their
market share has remained quite steady over time. Reflecting their intermediary role, G16 dealer banks
run relatively flat books, with their gross buy and sell positions almost matched (Chart L5).
166 Hiroshi Nakaso, BoJ (January 2017), “Monetary Policy Divergence and Global Financial Stability: From the Perspective of Demand and Supply of Safe Assets”. 167 G16 dealer banks include Bank of America, Barclays, BNP Paribas, Citigroup, Crédit Agricole, Credit Suisse, Deutsche Bank, Goldman Sachs, HSBC, JP Morgan Chase, Morgan Stanley, Nomura, Royal Bank of Scotland, Société Générale, UBS and Wells Fargo.
40
80
120
160
200
Jan 16 Jul 16 Jan 17
Ind
ex
(6 J
an 2
01
6 =
10
0)
Jun 17
UK Referendum
0
20
40
60
80
100
Jan 16 Jul 16 Jan 17P
er
Ce
nt
≤ 1 month 1 - 3 months
3 - 6 months 6 months - 1 year
> 1 year
Jun 17
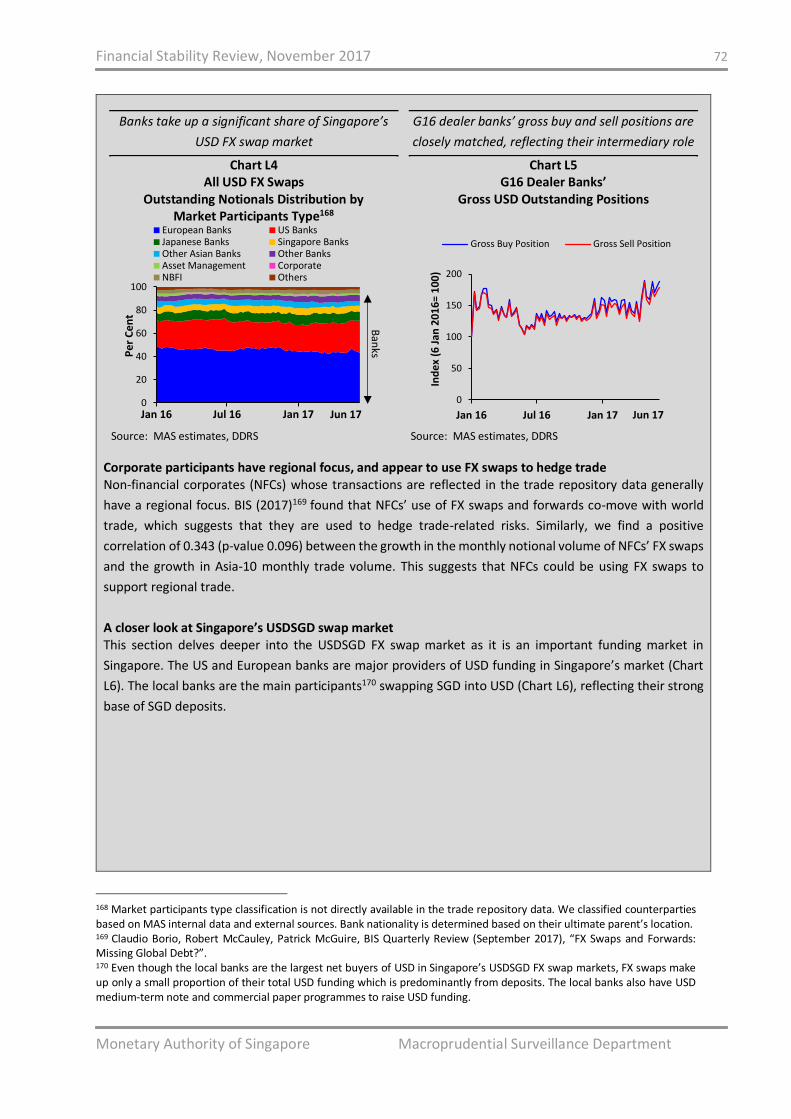
Financial Stability Review, November 2017 72
Monetary Authority of Singapore Macroprudential Surveillance Department
Banks take up a significant share of Singapore’s
USD FX swap market
Chart L4 All USD FX Swaps
Outstanding Notionals Distribution by Market Participants Type168
Source: MAS estimates, DDRS
G16 dealer banks’ gross buy and sell positions are
closely matched, reflecting their intermediary role
Chart L5 G16 Dealer Banks’
Gross USD Outstanding Positions
Source: MAS estimates, DDRS
Corporate participants have regional focus, and appear to use FX swaps to hedge trade Non-financial corporates (NFCs) whose transactions are reflected in the trade repository data generally
have a regional focus. BIS (2017)169 found that NFCs’ use of FX swaps and forwards co-move with world
trade, which suggests that they are used to hedge trade-related risks. Similarly, we find a positive
correlation of 0.343 (p-value 0.096) between the growth in the monthly notional volume of NFCs’ FX swaps
and the growth in Asia-10 monthly trade volume. This suggests that NFCs could be using FX swaps to
support regional trade.
A closer look at Singapore’s USDSGD swap market This section delves deeper into the USDSGD FX swap market as it is an important funding market in
Singapore. The US and European banks are major providers of USD funding in Singapore’s market (Chart
L6). The local banks are the main participants170 swapping SGD into USD (Chart L6), reflecting their strong
base of SGD deposits.
168 Market participants type classification is not directly available in the trade repository data. We classified counterparties based on MAS internal data and external sources. Bank nationality is determined based on their ultimate parent’s location. 169 Claudio Borio, Robert McCauley, Patrick McGuire, BIS Quarterly Review (September 2017), “FX Swaps and Forwards: Missing Global Debt?”. 170 Even though the local banks are the largest net buyers of USD in Singapore’s USDSGD FX swap markets, FX swaps make up only a small proportion of their total USD funding which is predominantly from deposits. The local banks also have USD medium-term note and commercial paper programmes to raise USD funding.
0
20
40
60
80
100
Jan 16 Jul 16 Jan 17
Pe
r C
en
t
European Banks US BanksJapanese Banks Singapore BanksOther Asian Banks Other BanksAsset Management CorporateNBFI Others
Jun 17B
anks
0
50
100
150
200
Jan 16 Jul 16 Jan 17
Ind
ex
(6 J
an 2
01
6=
10
0)
Gross Buy Position Gross Sell Position
Jun 17
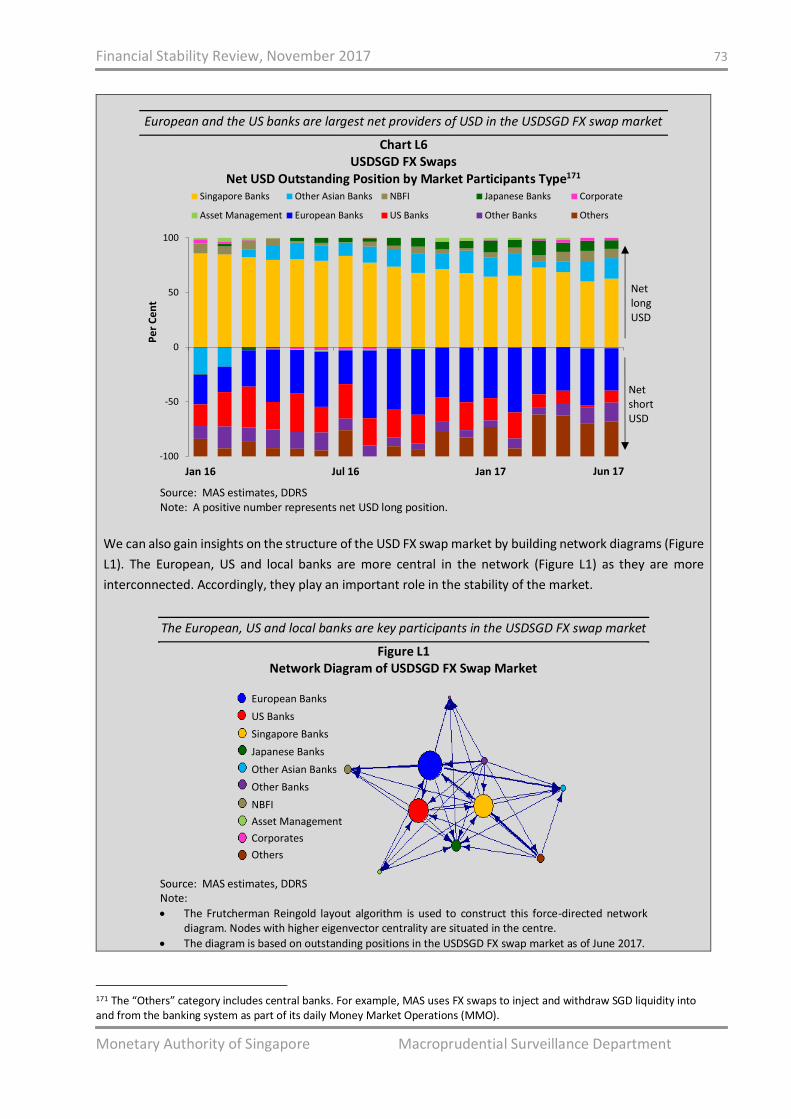
Financial Stability Review, November 2017 73
Monetary Authority of Singapore Macroprudential Surveillance Department
European and the US banks are largest net providers of USD in the USDSGD FX swap market
Chart L6 USDSGD FX Swaps
Net USD Outstanding Position by Market Participants Type171
Source: MAS estimates, DDRS Note: A positive number represents net USD long position.
We can also gain insights on the structure of the USD FX swap market by building network diagrams (Figure
L1). The European, US and local banks are more central in the network (Figure L1) as they are more
interconnected. Accordingly, they play an important role in the stability of the market.
The European, US and local banks are key participants in the USDSGD FX swap market
Figure L1 Network Diagram of USDSGD FX Swap Market
Source: MAS estimates, DDRS Note:
The Frutcherman Reingold layout algorithm is used to construct this force-directed network diagram. Nodes with higher eigenvector centrality are situated in the centre.
The diagram is based on outstanding positions in the USDSGD FX swap market as of June 2017.
171 The “Others” category includes central banks. For example, MAS uses FX swaps to inject and withdraw SGD liquidity into and from the banking system as part of its daily Money Market Operations (MMO).
-100
-50
0
50
100
Jan 16 Jul 16 Jan 17
Pe
r C
en
t
Singapore Banks Other Asian Banks NBFI Japanese Banks Corporate
Asset Management European Banks US Banks Other Banks Others
Net longUSD
Net shortUSD
Jun 17
European Banks
US Banks
Singapore Banks
Japanese Banks
Other Asian Banks
Other Banks
NBFI
Asset Management
Corporates
Others
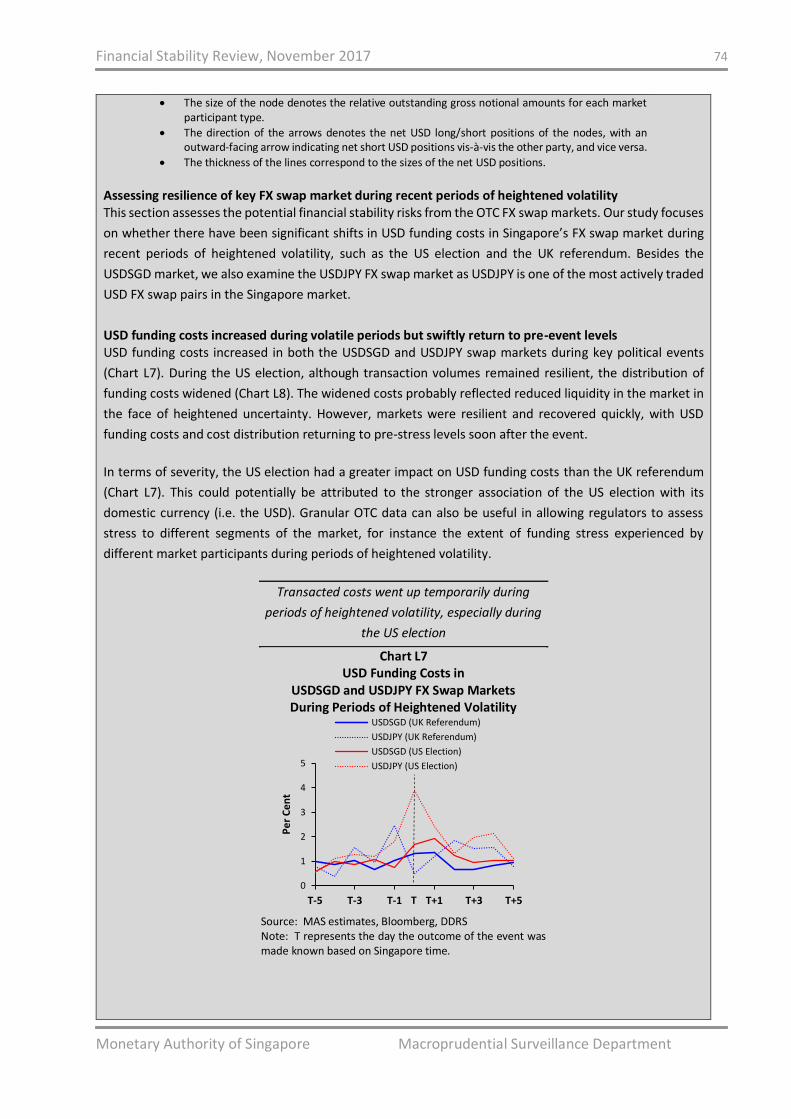
Financial Stability Review, November 2017 74
Monetary Authority of Singapore Macroprudential Surveillance Department
The size of the node denotes the relative outstanding gross notional amounts for each market participant type.
The direction of the arrows denotes the net USD long/short positions of the nodes, with an outward-facing arrow indicating net short USD positions vis-à-vis the other party, and vice versa.
The thickness of the lines correspond to the sizes of the net USD positions.
Assessing resilience of key FX swap market during recent periods of heightened volatility This section assesses the potential financial stability risks from the OTC FX swap markets. Our study focuses
on whether there have been significant shifts in USD funding costs in Singapore’s FX swap market during
recent periods of heightened volatility, such as the US election and the UK referendum. Besides the
USDSGD market, we also examine the USDJPY FX swap market as USDJPY is one of the most actively traded
USD FX swap pairs in the Singapore market.
USD funding costs increased during volatile periods but swiftly return to pre-event levels USD funding costs increased in both the USDSGD and USDJPY swap markets during key political events
(Chart L7). During the US election, although transaction volumes remained resilient, the distribution of
funding costs widened (Chart L8). The widened costs probably reflected reduced liquidity in the market in
the face of heightened uncertainty. However, markets were resilient and recovered quickly, with USD
funding costs and cost distribution returning to pre-stress levels soon after the event.
In terms of severity, the US election had a greater impact on USD funding costs than the UK referendum
(Chart L7). This could potentially be attributed to the stronger association of the US election with its
domestic currency (i.e. the USD). Granular OTC data can also be useful in allowing regulators to assess
stress to different segments of the market, for instance the extent of funding stress experienced by
different market participants during periods of heightened volatility.
Transacted costs went up temporarily during
periods of heightened volatility, especially during
the US election
Chart L7 USD Funding Costs in
USDSGD and USDJPY FX Swap Markets During Periods of Heightened Volatility
Source: MAS estimates, Bloomberg, DDRS Note: T represents the day the outcome of the event was made known based on Singapore time.
0
1
2
3
4
5
T-5 T-3 T-1 T+1 T+3 T+5
Pe
r C
en
t
USDSGD (UK Referendum)
USDJPY (UK Referendum)
USDSGD (US Election)
USDJPY (US Election)
T
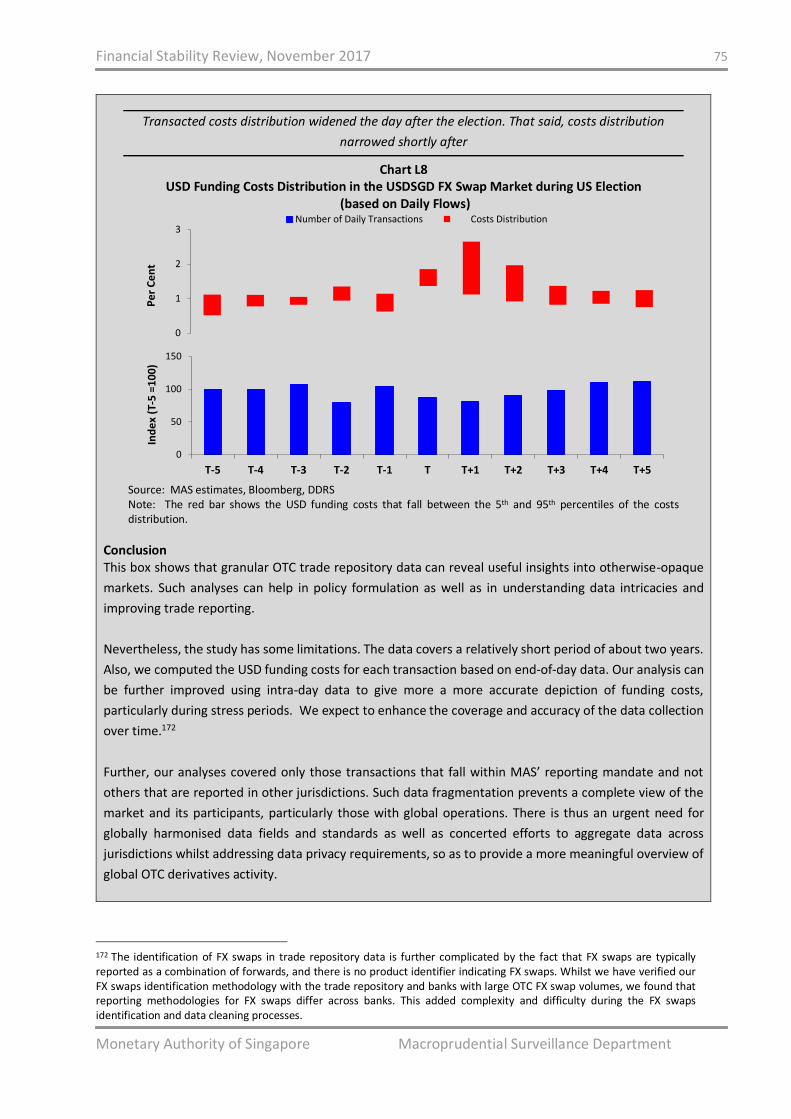
Financial Stability Review, November 2017 75
Monetary Authority of Singapore Macroprudential Surveillance Department
Transacted costs distribution widened the day after the election. That said, costs distribution
narrowed shortly after
Chart L8 USD Funding Costs Distribution in the USDSGD FX Swap Market during US Election
(based on Daily Flows)
Source: MAS estimates, Bloomberg, DDRS Note: The red bar shows the USD funding costs that fall between the 5th and 95th percentiles of the costs distribution.
Conclusion This box shows that granular OTC trade repository data can reveal useful insights into otherwise-opaque
markets. Such analyses can help in policy formulation as well as in understanding data intricacies and
improving trade reporting.
Nevertheless, the study has some limitations. The data covers a relatively short period of about two years.
Also, we computed the USD funding costs for each transaction based on end-of-day data. Our analysis can
be further improved using intra-day data to give more a more accurate depiction of funding costs,
particularly during stress periods. We expect to enhance the coverage and accuracy of the data collection
over time.172
Further, our analyses covered only those transactions that fall within MAS’ reporting mandate and not
others that are reported in other jurisdictions. Such data fragmentation prevents a complete view of the
market and its participants, particularly those with global operations. There is thus an urgent need for
globally harmonised data fields and standards as well as concerted efforts to aggregate data across
jurisdictions whilst addressing data privacy requirements, so as to provide a more meaningful overview of
global OTC derivatives activity.
172 The identification of FX swaps in trade repository data is further complicated by the fact that FX swaps are typically reported as a combination of forwards, and there is no product identifier indicating FX swaps. Whilst we have verified our FX swaps identification methodology with the trade repository and banks with large OTC FX swap volumes, we found that reporting methodologies for FX swaps differ across banks. This added complexity and difficulty during the FX swaps identification and data cleaning processes.
0
50
100
150
T-5 T-4 T-3 T-2 T-1 T T+1 T+2 T+3 T+4 T+5
Ind
ex
(T-5
=1
00
)
0
1
2
3
Pe
r C
en
t
-3
-2
-1
0
1
2
3
0
100
200
300
T-5 T-4 T-3 T-2 T-1 T T+1 T+2 T+3 T+4 T+5
Pe
r C
en
t
Ind
ex
(T-5
=1
00
)
Number of Daily Transactions Costs Distribution
Financial Stability Review, November 2017 76
Monetary Authority of Singapore Macroprudential Surveillance Department
Box M Evaluating the Effects of Post-Crisis Regulatory Reforms
In response to the GFC, the G20173 launched a programme of financial reforms to make the global financial
system more resilient. With many of the reforms either implemented or at the implementation stage, the
focus has now turned to evaluating their effects. The FSB has developed a framework to assess whether
the reforms are achieving their intended outcomes and identify any material unintended consequences
that should be addressed.174
The FSB’s framework proposes three types of evaluation i.e. effectiveness of individual reforms vis-à-vis
their intended objectives, interaction and coherence among reforms, and the overall effects of the reforms
on the G20 objectives of strong, sustainable and balanced growth. From the perspective of the global
financial system, the latter relates to financial system resilience, the orderly functioning of markets, and
the cost and availability of financing to households and non-financial businesses. The framework highlights
the importance of assessing social as well as private costs and benefits, both unintended and intended
effects, and distributional effects such as across users, sectors and jurisdictions. Several categories of
evaluation tools were identified175 based on their abilities to attribute observed economic or financial
outcomes to specific reforms, reflect heterogeneity either cross-sectionally (e.g. across jurisdictions) or
over time (e.g. on different parts of the financial cycle), and measure aggregate or general equilibrium
effects.
In tandem with the FSB’s work, MAS has embarked on assessing the effects of the global regulatory reforms
in Singapore. In this box, we flesh out our evaluation framework by identifying the areas of focus as well as
the corresponding issues and considerations.
MAS’ evaluation framework focuses on cumulative effects and any deviation from intended outcomes
MAS’ evaluation framework focuses on whether the reforms are addressing market anomalies or
vulnerabilities as intended and whether there are any unintended effects. The latter includes potential
spillovers from interactions among policies and from implementation by other jurisdictions. Before
implementing any reform measure, MAS conducts ex-ante studies along with industry consultation to
assess its potential impact. Therefore, MAS’ ex-post evaluation focuses on any deviation from intended
outcomes, with a view to assessing whether policy adjustments are needed.
The approach covers four impact areas: financial institutions, financial markets, financial end-users and
the broader financial landscape (Figure M1). For a start, we analysed the cumulative effects across a range
of reforms by conducting ‘event studies’ on indicators for the four impact areas, supplemented with
qualitative information as necessary.
173 G20 refers to the Group of Twenty comprising Argentina, Australia, Brazil, Canada, China, France, Germany, India, Indonesia, Italy, Japan, Korea, Mexico, Russia, Saudi Arabia, South Africa, Turkey, the UK, the US and the EU. 174 FSB Reports to the G20 (July 2017), “Framework for Post-Implementation Evaluation of the Effects of the G20 Financial Regulatory Reforms”. 175 These tools were: i) Qualitative analyses, which include peer reviews, questionnaires, assessment methodologies or benchmarks to evaluate a reform; ii) Indicators and descriptive statistics including those typically used in financial stability reports; iii) Partial equilibrium analyses such as event studies, regression techniques and quasi-experimental designs; iv) General equilibrium analyses such as Vector Auto Regressive (VAR) and Dynamic Stochastic General Equilibrium (DSGE) models.
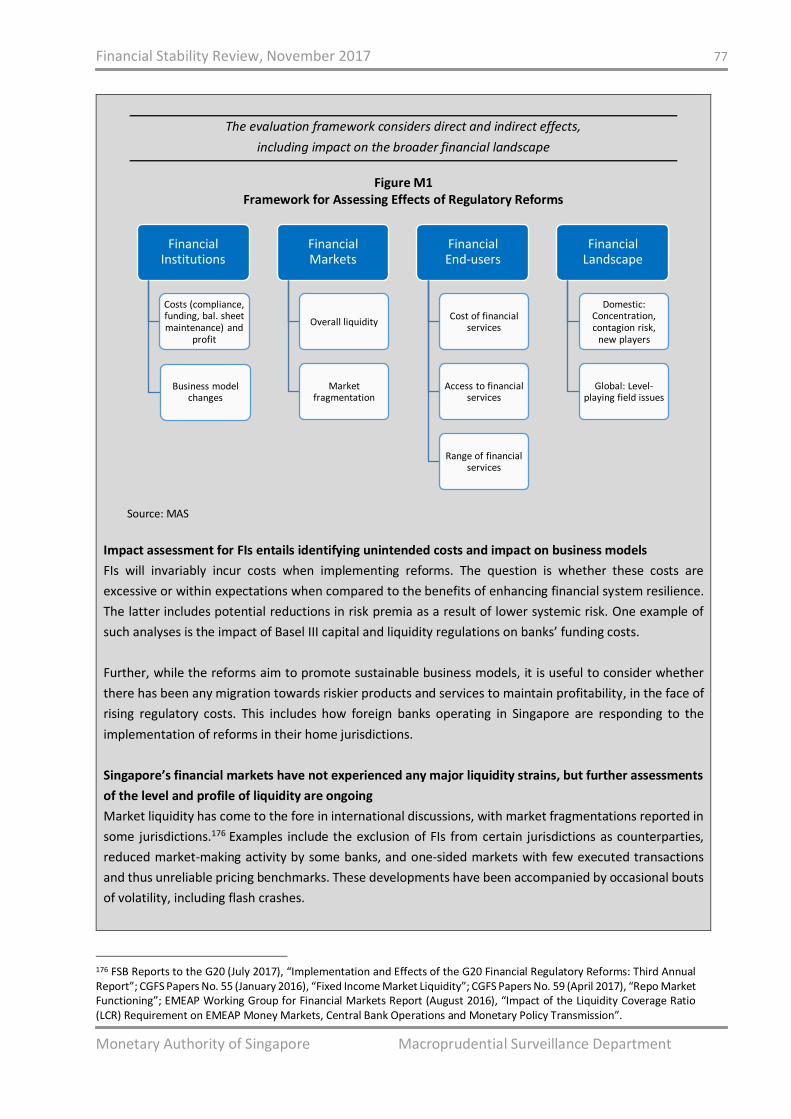
Financial Stability Review, November 2017 77
Monetary Authority of Singapore Macroprudential Surveillance Department
The evaluation framework considers direct and indirect effects,
including impact on the broader financial landscape
Figure M1 Framework for Assessing Effects of Regulatory Reforms
Source: MAS
Impact assessment for FIs entails identifying unintended costs and impact on business models
FIs will invariably incur costs when implementing reforms. The question is whether these costs are
excessive or within expectations when compared to the benefits of enhancing financial system resilience.
The latter includes potential reductions in risk premia as a result of lower systemic risk. One example of
such analyses is the impact of Basel III capital and liquidity regulations on banks’ funding costs.
Further, while the reforms aim to promote sustainable business models, it is useful to consider whether
there has been any migration towards riskier products and services to maintain profitability, in the face of
rising regulatory costs. This includes how foreign banks operating in Singapore are responding to the
implementation of reforms in their home jurisdictions.
Singapore’s financial markets have not experienced any major liquidity strains, but further assessments
of the level and profile of liquidity are ongoing
Market liquidity has come to the fore in international discussions, with market fragmentations reported in
some jurisdictions.176 Examples include the exclusion of FIs from certain jurisdictions as counterparties,
reduced market-making activity by some banks, and one-sided markets with few executed transactions
and thus unreliable pricing benchmarks. These developments have been accompanied by occasional bouts
of volatility, including flash crashes.
176 FSB Reports to the G20 (July 2017), “Implementation and Effects of the G20 Financial Regulatory Reforms: Third Annual Report”; CGFS Papers No. 55 (January 2016), “Fixed Income Market Liquidity”; CGFS Papers No. 59 (April 2017), “Repo Market Functioning”; EMEAP Working Group for Financial Markets Report (August 2016), “Impact of the Liquidity Coverage Ratio (LCR) Requirement on EMEAP Money Markets, Central Bank Operations and Monetary Policy Transmission”.
Financial Institutions
Costs (compliance, funding, bal. sheet maintenance) and
profit
Business model changes
Financial Markets
Overall liquidity
Market fragmentation
Financial End-users
Cost of financial services
Access to financial services
Range of financial services
Financial Landscape
Domestic: Concentration, contagion risk,
new players
Global: Level-playing field issues
Financial Stability Review, November 2017 78
Monetary Authority of Singapore Macroprudential Surveillance Department
While Singapore has not experienced any major liquidity disruptions, the level and profile of liquidity in
domestic markets warrant further study. This would require tracking more granular liquidity indicators and
other data, such as fees and charges, which may provide further insights into market participants’
behaviours. It would also be useful to assess whether particular rules, e.g. the classification of advanced
and emerging market currencies under the Basel III Fundamental Review of the Trading Book (FRTB), could
lead to potential market bifurcation.
Impact on financial end-users in terms of cost, access to and range of financial services is another area
of focus
Besides the direct impact on FIs, any indirect impact on end-users of financial services such as smaller FIs,
non-financial firms and households is an area which MAS pays close attention to.
A key question is whether FIs are adjusting to the costs of reforms by raising the prices of the financial
services they provide or by reducing the supply. The impact on smaller players (e.g. small and medium-
sized enterprises (SMEs) and sectors that could face financing constraints (e.g. infrastructure financing) is
of particular interest.
Certain reforms may inadvertently affect particular end-users. For example, feedback by industry
respondents177 suggests that the upcoming Basel III Leverage Ratio (LR) requirement may constrain some
banks’ ability to extend clearing services to smaller clients, in order to fulfil the clearing mandate for OTC
derivatives.
A holistic evaluation that includes effects on the broader financial landscape
Besides the specific assessments for FIs, markets and end-users, we need to consider whether there are
significant changes in the broad financial landscape, such as concentration, contagion, entry of non-
traditional players, and level playing field issues.
For example, while OTC central clearing helps to address interconnectedness and contagion risk, it leads
to concentration risk at the central counterparties (CCPs). The FSB has been working with relevant
standard-setting bodies to address this risk.
Another example is the requirement for banks to issue capital instruments which can be readily bailed-in
to facilitate orderly resolution. These instruments, which typically offer higher yields, could be attractive
investments to banks and other institutional investors such as insurance companies, pension funds and
fund managers. While the requirement is meant to avoid tax-payer bail-outs of failing banks, such cross-
holdings by FIs, if left unchecked, could raise contagion risk across the financial system. Some regulators
have also noted that these complex instruments are not suitable for retail investors.
177 Response to Basel Committee on Banking Supervision (BCBS) Consultative Document on “Revisions to the Basel III Leverage Ratio Framework” (July 2016), Comments by Global Financial Markets Association (GFMA), Institute of International Finance (IIF), International Swaps and Derivatives Association (ISDA), Japan Financial Markets Council (JFMC) and The Clearing House (TCH).

Financial Stability Review, November 2017 79
Monetary Authority of Singapore Macroprudential Surveillance Department
Evaluation of reforms should improve with more data and experience
Over time and as more data becomes available, MAS plans to employ methodologies that would better
differentiate the effects of regulatory reforms from non-regulatory factors such as global financial
conditions, risk aversion and technological advances. We also hope to draw on the experiences of the FSB,
standard-setting bodies and other regulators, as more evaluation exercises of post-crisis reforms are
conducted in the coming years.
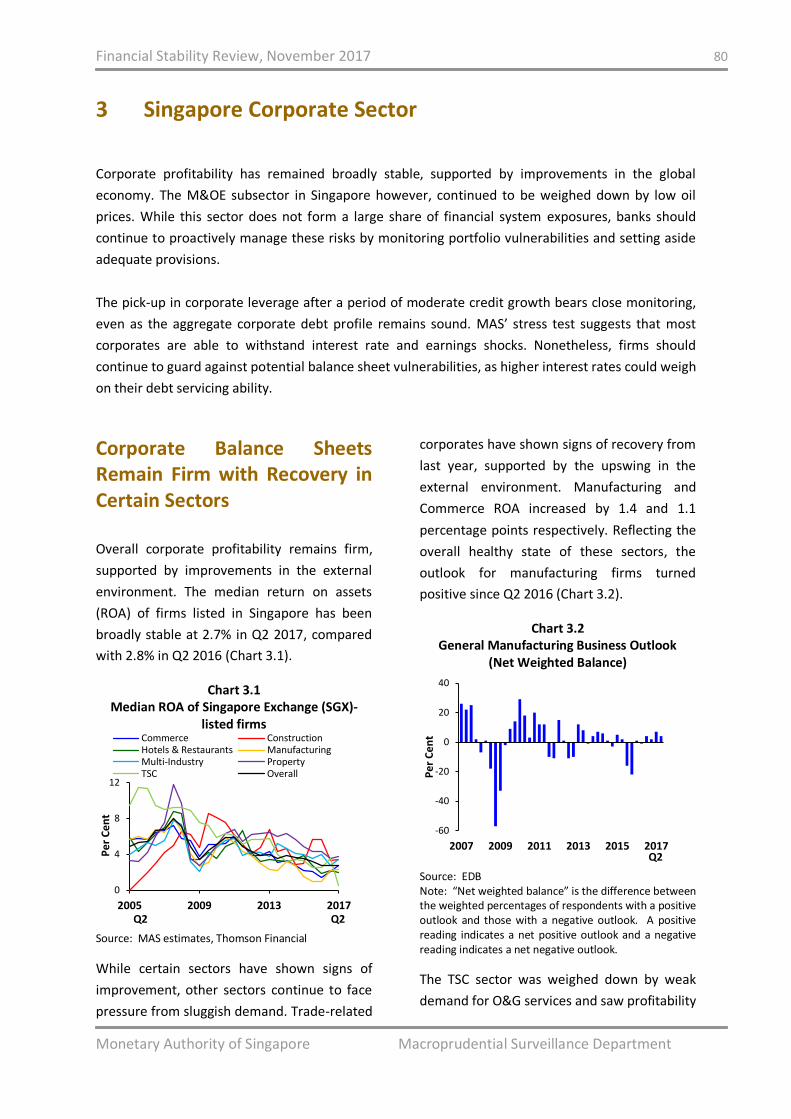
Financial Stability Review, November 2017 80
Monetary Authority of Singapore Macroprudential Surveillance Department
3 Singapore Corporate Sector
Corporate profitability has remained broadly stable, supported by improvements in the global
economy. The M&OE subsector in Singapore however, continued to be weighed down by low oil
prices. While this sector does not form a large share of financial system exposures, banks should
continue to proactively manage these risks by monitoring portfolio vulnerabilities and setting aside
adequate provisions.
The pick-up in corporate leverage after a period of moderate credit growth bears close monitoring,
even as the aggregate corporate debt profile remains sound. MAS’ stress test suggests that most
corporates are able to withstand interest rate and earnings shocks. Nonetheless, firms should
continue to guard against potential balance sheet vulnerabilities, as higher interest rates could weigh
on their debt servicing ability.
Corporate Balance Sheets Remain Firm with Recovery in Certain Sectors
Overall corporate profitability remains firm,
supported by improvements in the external
environment. The median return on assets
(ROA) of firms listed in Singapore has been
broadly stable at 2.7% in Q2 2017, compared
with 2.8% in Q2 2016 (Chart 3.1).
Chart 3.1 Median ROA of Singapore Exchange (SGX)-
listed firms
Source: MAS estimates, Thomson Financial
While certain sectors have shown signs of
improvement, other sectors continue to face
pressure from sluggish demand. Trade-related
corporates have shown signs of recovery from
last year, supported by the upswing in the
external environment. Manufacturing and
Commerce ROA increased by 1.4 and 1.1
percentage points respectively. Reflecting the
overall healthy state of these sectors, the
outlook for manufacturing firms turned
positive since Q2 2016 (Chart 3.2).
Chart 3.2 General Manufacturing Business Outlook
(Net Weighted Balance)
Source: EDB Note: “Net weighted balance” is the difference between the weighted percentages of respondents with a positive outlook and those with a negative outlook. A positive reading indicates a net positive outlook and a negative reading indicates a net negative outlook.
The TSC sector was weighed down by weak
demand for O&G services and saw profitability
0
4
8
12
2005 2009 2013 2017
Pe
r C
en
t
Commerce ConstructionHotels & Restaurants ManufacturingMulti-Industry PropertyTSC Overall
Q2 Q2
-60
-40
-20
0
20
40
2007 2009 2011 2013 2015 2017
Pe
r C
en
t
Q2
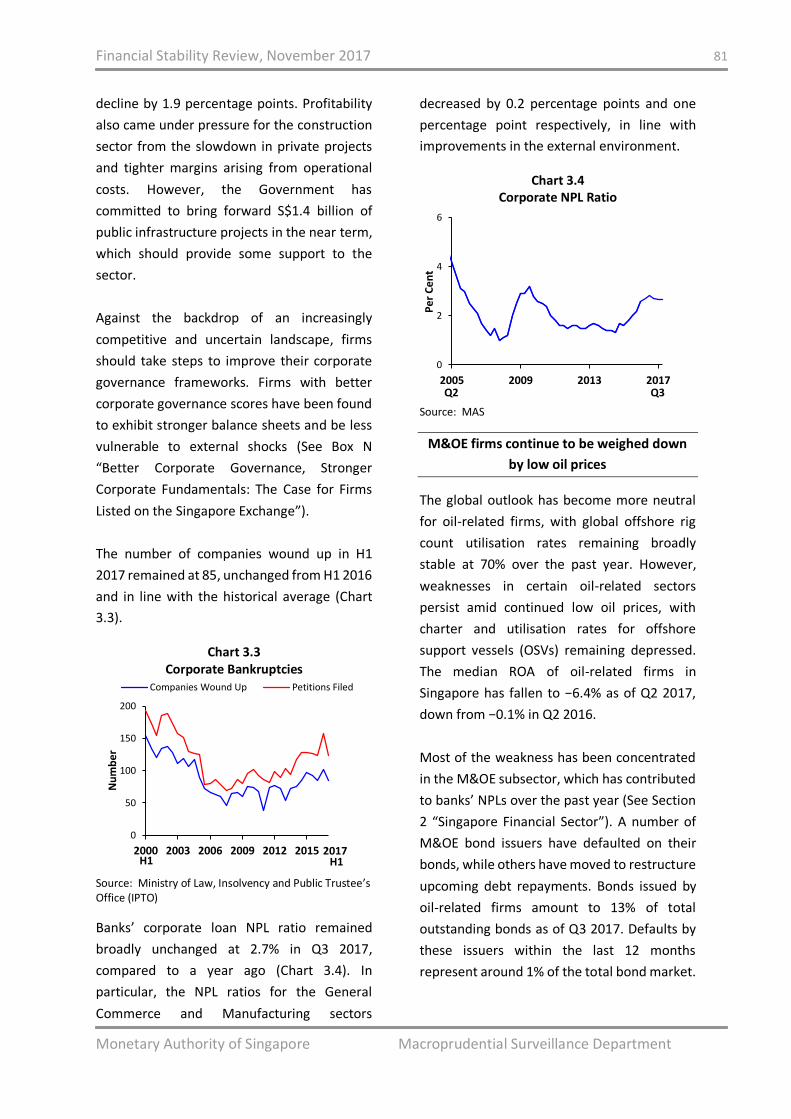
Financial Stability Review, November 2017 81
Monetary Authority of Singapore Macroprudential Surveillance Department
decline by 1.9 percentage points. Profitability
also came under pressure for the construction
sector from the slowdown in private projects
and tighter margins arising from operational
costs. However, the Government has
committed to bring forward S$1.4 billion of
public infrastructure projects in the near term,
which should provide some support to the
sector.
Against the backdrop of an increasingly
competitive and uncertain landscape, firms
should take steps to improve their corporate
governance frameworks. Firms with better
corporate governance scores have been found
to exhibit stronger balance sheets and be less
vulnerable to external shocks (See Box N
“Better Corporate Governance, Stronger
Corporate Fundamentals: The Case for Firms
Listed on the Singapore Exchange”).
The number of companies wound up in H1
2017 remained at 85, unchanged from H1 2016
and in line with the historical average (Chart
3.3).
Chart 3.3 Corporate Bankruptcies
Source: Ministry of Law, Insolvency and Public Trustee’s Office (IPTO)
Banks’ corporate loan NPL ratio remained
broadly unchanged at 2.7% in Q3 2017,
compared to a year ago (Chart 3.4). In
particular, the NPL ratios for the General
Commerce and Manufacturing sectors
decreased by 0.2 percentage points and one
percentage point respectively, in line with
improvements in the external environment.
Chart 3.4 Corporate NPL Ratio
Source: MAS
M&OE firms continue to be weighed down
by low oil prices
The global outlook has become more neutral
for oil-related firms, with global offshore rig
count utilisation rates remaining broadly
stable at 70% over the past year. However,
weaknesses in certain oil-related sectors
persist amid continued low oil prices, with
charter and utilisation rates for offshore
support vessels (OSVs) remaining depressed.
The median ROA of oil-related firms in
Singapore has fallen to −6.4% as of Q2 2017,
down from −0.1% in Q2 2016.
Most of the weakness has been concentrated
in the M&OE subsector, which has contributed
to banks’ NPLs over the past year (See Section
2 “Singapore Financial Sector”). A number of
M&OE bond issuers have defaulted on their
bonds, while others have moved to restructure
upcoming debt repayments. Bonds issued by
oil-related firms amount to 13% of total
outstanding bonds as of Q3 2017. Defaults by
these issuers within the last 12 months
represent around 1% of the total bond market.
0
50
100
150
200
2000 2003 2006 2009 2012 2015
Nu
mb
er
Companies Wound Up Petitions Filed
2017H1 H1
0
2
4
6
2005 2009 2013 2017
Pe
r C
en
t
Q2 Q3
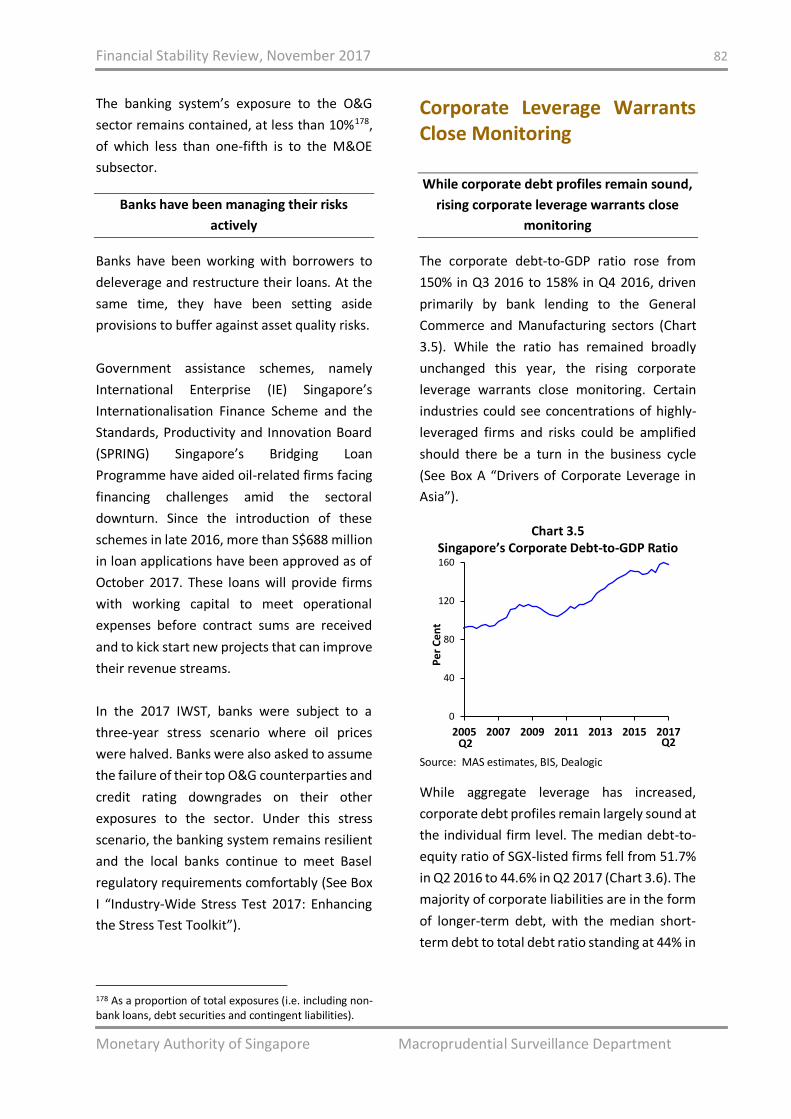
Financial Stability Review, November 2017 82
Monetary Authority of Singapore Macroprudential Surveillance Department
The banking system’s exposure to the O&G
sector remains contained, at less than 10%178,
of which less than one-fifth is to the M&OE
subsector.
Banks have been managing their risks
actively
Banks have been working with borrowers to
deleverage and restructure their loans. At the
same time, they have been setting aside
provisions to buffer against asset quality risks.
Government assistance schemes, namely
International Enterprise (IE) Singapore’s
Internationalisation Finance Scheme and the
Standards, Productivity and Innovation Board
(SPRING) Singapore’s Bridging Loan
Programme have aided oil-related firms facing
financing challenges amid the sectoral
downturn. Since the introduction of these
schemes in late 2016, more than S$688 million
in loan applications have been approved as of
October 2017. These loans will provide firms
with working capital to meet operational
expenses before contract sums are received
and to kick start new projects that can improve
their revenue streams.
In the 2017 IWST, banks were subject to a
three-year stress scenario where oil prices
were halved. Banks were also asked to assume
the failure of their top O&G counterparties and
credit rating downgrades on their other
exposures to the sector. Under this stress
scenario, the banking system remains resilient
and the local banks continue to meet Basel
regulatory requirements comfortably (See Box
I “Industry-Wide Stress Test 2017: Enhancing
the Stress Test Toolkit”).
178 As a proportion of total exposures (i.e. including non-bank loans, debt securities and contingent liabilities).
Corporate Leverage Warrants Close Monitoring
While corporate debt profiles remain sound,
rising corporate leverage warrants close
monitoring
The corporate debt-to-GDP ratio rose from
150% in Q3 2016 to 158% in Q4 2016, driven
primarily by bank lending to the General
Commerce and Manufacturing sectors (Chart
3.5). While the ratio has remained broadly
unchanged this year, the rising corporate
leverage warrants close monitoring. Certain
industries could see concentrations of highly-
leveraged firms and risks could be amplified
should there be a turn in the business cycle
(See Box A “Drivers of Corporate Leverage in
Asia”).
Chart 3.5 Singapore’s Corporate Debt-to-GDP Ratio
Source: MAS estimates, BIS, Dealogic
While aggregate leverage has increased,
corporate debt profiles remain largely sound at
the individual firm level. The median debt-to-
equity ratio of SGX-listed firms fell from 51.7%
in Q2 2016 to 44.6% in Q2 2017 (Chart 3.6). The
majority of corporate liabilities are in the form
of longer-term debt, with the median short-
term debt to total debt ratio standing at 44% in
0
40
80
120
160
2005 2007 2009 2011 2013 2015 2017
Pe
r C
en
t
Q2 Q2
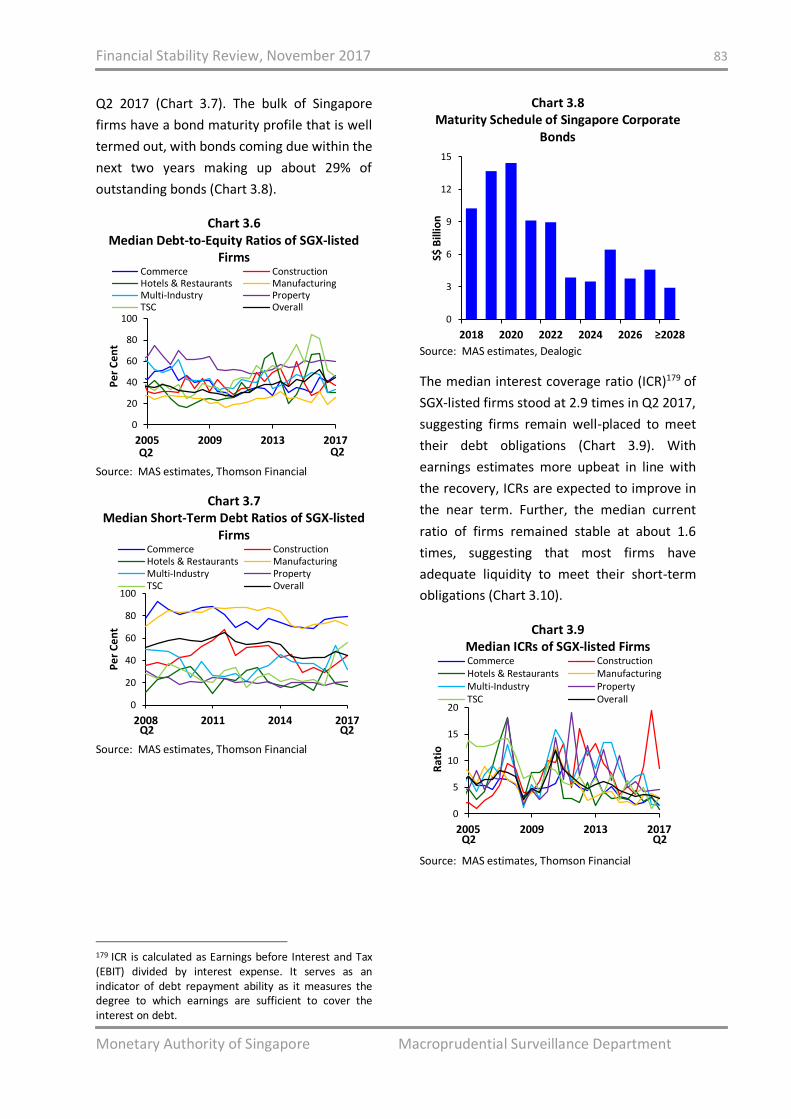
Financial Stability Review, November 2017 83
Monetary Authority of Singapore Macroprudential Surveillance Department
Q2 2017 (Chart 3.7). The bulk of Singapore
firms have a bond maturity profile that is well
termed out, with bonds coming due within the
next two years making up about 29% of
outstanding bonds (Chart 3.8).
Chart 3.6 Median Debt-to-Equity Ratios of SGX-listed
Firms
Source: MAS estimates, Thomson Financial
Chart 3.7 Median Short-Term Debt Ratios of SGX-listed
Firms
Source: MAS estimates, Thomson Financial
179 ICR is calculated as Earnings before Interest and Tax (EBIT) divided by interest expense. It serves as an indicator of debt repayment ability as it measures the degree to which earnings are sufficient to cover the interest on debt.
Chart 3.8 Maturity Schedule of Singapore Corporate
Bonds
Source: MAS estimates, Dealogic
The median interest coverage ratio (ICR)179 of
SGX-listed firms stood at 2.9 times in Q2 2017,
suggesting firms remain well-placed to meet
their debt obligations (Chart 3.9). With
earnings estimates more upbeat in line with
the recovery, ICRs are expected to improve in
the near term. Further, the median current
ratio of firms remained stable at about 1.6
times, suggesting that most firms have
adequate liquidity to meet their short-term
obligations (Chart 3.10).
Chart 3.9 Median ICRs of SGX-listed Firms
Source: MAS estimates, Thomson Financial
0
20
40
60
80
100
2005 2009 2013 2017
Pe
r C
en
t
Commerce ConstructionHotels & Restaurants ManufacturingMulti-Industry PropertyTSC Overall
Q2 Q2
0
20
40
60
80
100
2008 2011 2014 2017
Pe
r C
en
t
Commerce ConstructionHotels & Restaurants ManufacturingMulti-Industry PropertyTSC Overall
Q2 Q2
0
3
6
9
12
15
2018 2020 2022 2024 2026 ≥2028
S$ B
illio
n
0
5
10
15
20
2005 2009 2013 2017
Rat
io
Commerce ConstructionHotels & Restaurants ManufacturingMulti-Industry PropertyTSC Overall
Q2 Q2
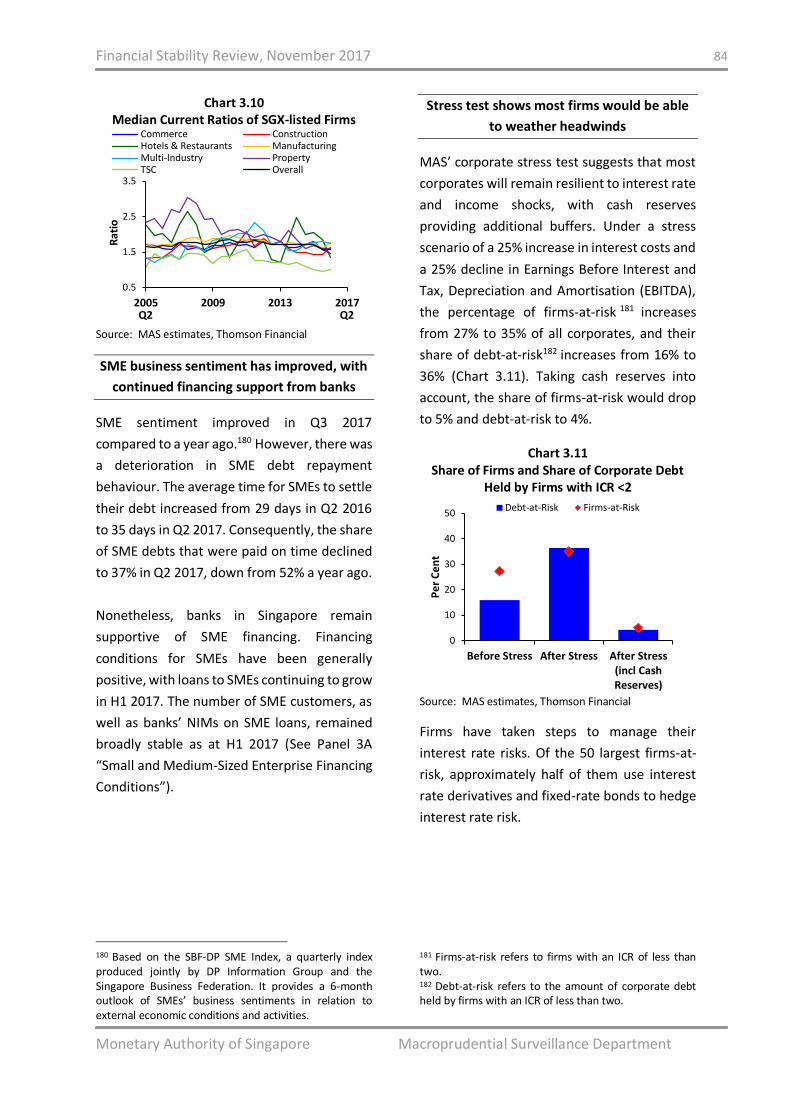
Financial Stability Review, November 2017 84
Monetary Authority of Singapore Macroprudential Surveillance Department
Chart 3.10 Median Current Ratios of SGX-listed Firms
Source: MAS estimates, Thomson Financial
SME business sentiment has improved, with
continued financing support from banks
SME sentiment improved in Q3 2017
compared to a year ago.180 However, there was
a deterioration in SME debt repayment
behaviour. The average time for SMEs to settle
their debt increased from 29 days in Q2 2016
to 35 days in Q2 2017. Consequently, the share
of SME debts that were paid on time declined
to 37% in Q2 2017, down from 52% a year ago.
Nonetheless, banks in Singapore remain
supportive of SME financing. Financing
conditions for SMEs have been generally
positive, with loans to SMEs continuing to grow
in H1 2017. The number of SME customers, as
well as banks’ NIMs on SME loans, remained
broadly stable as at H1 2017 (See Panel 3A
“Small and Medium-Sized Enterprise Financing
Conditions”).
180 Based on the SBF-DP SME Index, a quarterly index produced jointly by DP Information Group and the Singapore Business Federation. It provides a 6-month outlook of SMEs’ business sentiments in relation to external economic conditions and activities.
Stress test shows most firms would be able
to weather headwinds
MAS’ corporate stress test suggests that most
corporates will remain resilient to interest rate
and income shocks, with cash reserves
providing additional buffers. Under a stress
scenario of a 25% increase in interest costs and
a 25% decline in Earnings Before Interest and
Tax, Depreciation and Amortisation (EBITDA),
the percentage of firms-at-risk 181 increases
from 27% to 35% of all corporates, and their
share of debt-at-risk182 increases from 16% to
36% (Chart 3.11). Taking cash reserves into
account, the share of firms-at-risk would drop
to 5% and debt-at-risk to 4%.
Chart 3.11 Share of Firms and Share of Corporate Debt
Held by Firms with ICR <2
Source: MAS estimates, Thomson Financial
Firms have taken steps to manage their
interest rate risks. Of the 50 largest firms-at-
risk, approximately half of them use interest
rate derivatives and fixed-rate bonds to hedge
interest rate risk.
181 Firms-at-risk refers to firms with an ICR of less than two. 182 Debt-at-risk refers to the amount of corporate debt held by firms with an ICR of less than two.
0.5
1.5
2.5
3.5
2005 2009 2013 2017
Rat
io
Commerce ConstructionHotels & Restaurants ManufacturingMulti-Industry PropertyTSC Overall
Q2 Q2
0
10
20
30
40
50
Before Stress After Stress After Stress(incl CashReserves)
Pe
r C
en
t
Debt-at-Risk Firms-at-Risk
Financial Stability Review, November 2017 85
Monetary Authority of Singapore Macroprudential Surveillance Department
Despite ongoing economic recovery, firms
should continue to guard against
vulnerabilities
While trade-related firms have benefited from
improved conditions in recent quarters, the
performance of domestic-oriented firms
remains subdued.
Firms should continue to be prudent and guard
against balance sheet vulnerabilities. A
weakening in the external environment,
combined with rising interest rates, could
weigh on corporate profitability and debt
servicing ability. Firms should also continue to
enhance their corporate governance
frameworks and stakeholder engagement
practices amid an increasingly competitive and
uncertain landscape.
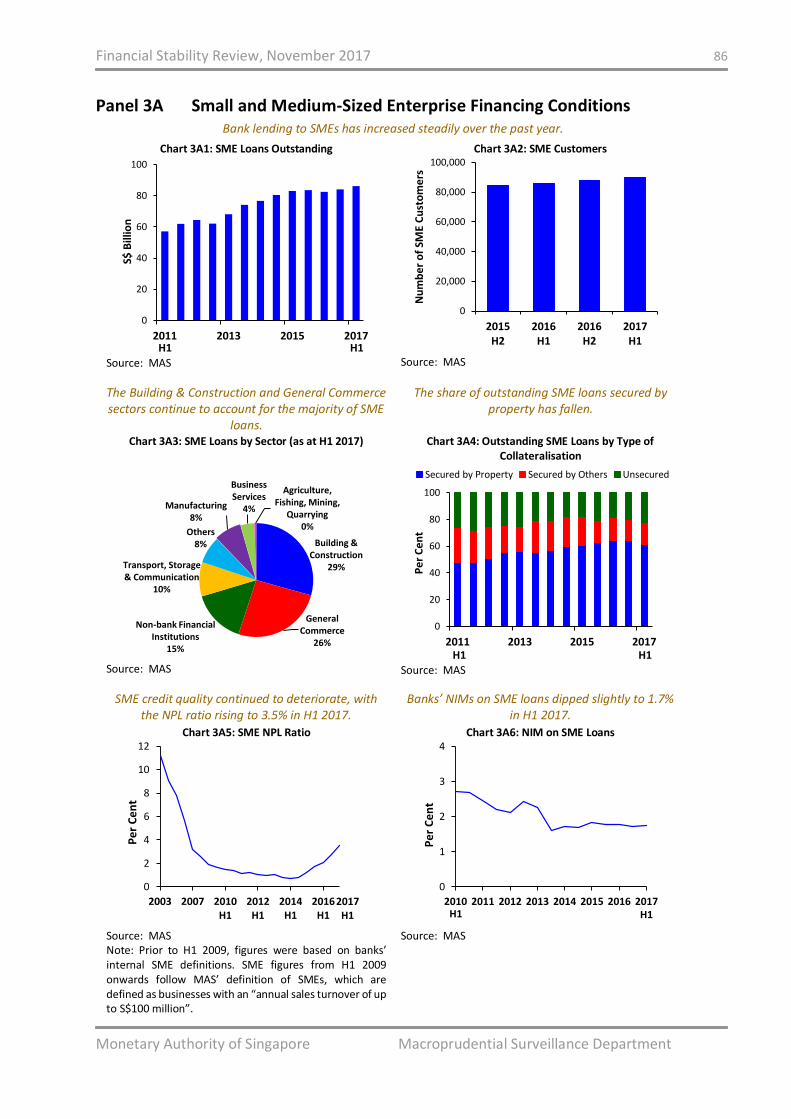
Financial Stability Review, November 2017 86
Monetary Authority of Singapore Macroprudential Surveillance Department
Panel 3A Small and Medium-Sized Enterprise Financing Conditions Bank lending to SMEs has increased steadily over the past year.
Chart 3A1: SME Loans Outstanding
Source: MAS
Chart 3A2: SME Customers
Source: MAS
The Building & Construction and General Commerce sectors continue to account for the majority of SME
loans.
The share of outstanding SME loans secured by property has fallen.
Chart 3A3: SME Loans by Sector (as at H1 2017)
Source: MAS
Chart 3A4: Outstanding SME Loans by Type of Collateralisation
Source: MAS
SME credit quality continued to deteriorate, with the NPL ratio rising to 3.5% in H1 2017.
Banks’ NIMs on SME loans dipped slightly to 1.7% in H1 2017.
Chart 3A5: SME NPL Ratio
Source: MAS Note: Prior to H1 2009, figures were based on banks’ internal SME definitions. SME figures from H1 2009 onwards follow MAS’ definition of SMEs, which are defined as businesses with an “annual sales turnover of up to S$100 million”.
Chart 3A6: NIM on SME Loans
Source: MAS
0
20
40
60
80
100
2011 2013 2015 2017
S$ B
illio
n
H1H1
0
20,000
40,000
60,000
80,000
100,000
2015H2
2016H1
2016H2
2017H1
Nu
mb
er
of
SME
Cu
sto
me
rs
Building & Construction
29%
General Commerce
26%
Non-bank Financial Institutions
15%
Transport, Storage & Communication
10%
Others8%
Manufacturing8%
Business Services
4%
Agriculture, Fishing, Mining,
Quarrying0%
0
20
40
60
80
100
2011 2013 2015 2017
Pe
r C
en
t
Secured by Property Secured by Others Unsecured
H1 H1
0
2
4
6
8
10
12
2003 2007 2010H1
2012H1
2014H1
2016H1
Pe
r C
en
t
2017H1
0
1
2
3
4
2010 2011 2012 2013 2014 2015 2016 2017
Pe
r C
en
t
H1 H1
Financial Stability Review, November 2017 87
Monetary Authority of Singapore Macroprudential Surveillance Department
Box N Better Corporate Governance, Stronger Corporate Fundamentals: The Case for Firms Listed on the
Singapore Exchange183
Corporate governance refers to having the appropriate people, processes and structures to direct and
manage the business and affairs of the company to enhance long-term shareholder value, whilst taking
into account the interests of other stakeholders. Corporate governance weaknesses can impede a
company’s performance and lead to financial difficulties and even corporate malfeasance. They can also
contribute to financial crises and cause financial instability.184 The FSB notes that one of the key lessons
from the GFC is the need to strengthen corporate governance, both in terms of the frameworks and related
rules, and the practices of FIs.185 From the perspective of companies, sound corporate governance is
increasingly viewed as an investment that could translate into improved future returns and greater
resilience to external shocks.186 In a study into the larger companies of 25 emerging market economies,
IMF finds that firms with stronger corporate governance and investor protection frameworks tend to have
higher market valuations, stronger corporate balance sheets and greater resilience to global financial
shocks.187
In Singapore, studies have mostly focused on the corporate governance and disclosure practices of SGX-
listed firms.188 Few studies have examined how good corporate governance practices could contribute to
improved corporate fundamentals or market value; those that do so considered either a subset of
corporate governance practices or a subset of the larger, more prominent firms. This box examines
whether SGX-listed firms with strong corporate governance practices tend to have stronger corporate
fundamentals — measured mainly by firm profitability and debt profile — and in turn show greater
resilience to external shocks.
Data and methodology For the purposes of this study, we used corporate governance data metrics from the National University of
Singapore (NUS) Business School’s Centre for Governance, Institutions and Organisations (CGIO) which
maintains the Singapore Governance and Transparency Index (SGTI).189 The SGTI evaluates SGX-listed
companies on their corporate governance practices as well as the timeliness, accessibility and transparency
of their financial disclosures. The SGTI overall score is computed from five areas spanning board
responsibilities, rights of shareholders, engagement of stakeholders, accountability and audit, and
183 This box is written in collaboration with the Centre for Governance, Institutions and Organisations (CGIO) at the National University of Singapore (NUS) Business School. 184 Some academics have postulated poor corporate governance as a major culprit for the Asian financial crisis. Far Eastern Economic Review (August 1998), “A Different World”. 185 FSB Peer Review Report (April 2017), “Thematic Review on Corporate Governance”. 186 PWC Singapore (February 2017), “The Importance of Good Governance”. 187 IMF GFSR Chapter 3 (October 2016), “Corporate Governance, Investor Protection and Financial Stability in Emerging Markets”. 188 Where financial information is concerned, studies on SGX-listed firms have mostly focused on the reporting frequency or the quality of reporting. For instance, some researchers find that the usefulness of a company’s financial statements is often limited by over-aggregation of information, insufficient disclosures and disclosures that are difficult to understand. Accounting and Corporate Regulatory Authority of Singapore (ACRA), Institute of Singapore Chartered Accountants (ISCA) and NUS Business School (August 2016), “Into the Minds of Investors - Investors’ Views of Financial Reporting, Audit and Corporate Governance”. 189 The SGTI is a joint initiative of CPA Australia, NUS Business School’s CGIO and the Singapore Institute of Directors (SID). http://bschool.nus.edu.sg/cgio/our-research/sgti.
Financial Stability Review, November 2017 88
Monetary Authority of Singapore Macroprudential Surveillance Department
disclosure and transparency. Data on firm-level financial performance and balance sheet strength were
obtained from Bloomberg and Thomson Reuters. Our sample size covers over 350 SGX-listed firms,
comprising more than 50% of SGX-listed firms, for the period 2011-2016.
For firm profitability, our panel regression takes the following form:
𝑹𝑶𝑨𝒕 = 𝜶𝒕 + 𝜷𝟏𝑪𝑮𝒕−𝟏 + 𝜷′𝟐𝑭𝒊,𝒕−𝟏 + 𝜷′𝟑𝑴𝒊,𝒕
where 𝑅𝑂𝐴𝑡 denotes the return on assets of SGX-listed firms. The variable 𝐶𝐺𝑡−1 is one of the firm-level
corporate governance scores (i.e. SGTI overall score or one of the sub-category scores).190 𝐹𝑡−1 is a vector
of variables to control for firm tangibility and market valuations.191 𝑀𝑡 is a vector of macro variables to
control for domestic macroeconomic conditions and country-level corporate governance.192
When the debt profile of SGX-listed firms is considered, the panel regression takes the following form:
𝑺𝑻𝑫𝒕 = 𝜶𝒕 + 𝜷𝟏𝑪𝑮𝒕−𝟏 + 𝜷′𝟐𝑭𝒊,𝒕−𝟏 + 𝜷′𝟑𝑴𝒊,𝒕
where 𝑆𝑇𝐷𝑡 denotes the short-term-to-total debt ratios of SGX-listed firms. A firm with a lower STD will
be less vulnerable to short-term credit supply shocks.193 𝐹𝑡−1 is a vector of variables to control for firm
leverage, profitability and size.194 𝑀𝑡 is a vector of macro variables to control for global financial conditions
and global market volatility.195
SGX-listed firms with higher CG scores tend to exhibit higher profitability We find that corporate governance, as measured by the SGTI, is positively correlated with firm profitability.
A one point increase in the overall CG score is associated with a 0.2 percentage point increase in ROA, while
a one point increase in the board responsibilities and accountability and audit sub-scores are associated
with a 0.3 to 0.4 percentage point increase in ROA (Chart N1). 196 Amongst these sub-categories,
accountability and audit has the biggest impact on ROA. This suggests that an independent and qualified
audit committee, together with strong risk management and internal controls, could have a positive
bearing on firm profitability.
190 For the purposes of this box item, CGIO generated historical scores for three sub-categories in addition to the SGTI overall score — namely (i) board responsibilities; (ii) accountability and audit; and (iii) stakeholders’ rights and engagement (comprising rights of shareholders, engagement of stakeholders, and disclosure and transparency). We note that historical data on stakeholders’ rights and engagement may be partial as this sub-category was added into the SGTI scoring structure beginning in 2015. 191 Firm tangibility was proxied using current ratios (i.e. current assets divided by current liabilities), and market valuations were proxied using price-to-book ratios. 192 Domestic macroeconomic conditions were proxied using GDP growth rates, and country-level corporate governance was proxied using a measure of corporate governance (strength of investor protection) from the Global Competitiveness Index database. 193 World Bank Global Financial Development Report 2015 – 2016 Chapter 2 (September 2015), “The Use of Long-Term Finance by Firms and Households: Determinants and Impact”. 194 Firm leverage was proxied using total debt divided by total assets, firm profitability was proxied using ROA, and firm size was proxied using market capitalisation. 195 Global financial conditions were proxied using Goldman Sach US Financial Conditions Index, and global market volatility was proxied using Merrill Lynch Option Volatility Estimate index (MOVE). 196 A typical year to year change in overall CG score for a firm is up to ten points, and such a change corresponds to a two percentage points change in ROA. We note that the average ROA of the top quartile CG firms was 3% whereas the average ROA of the bottom quartile CG firms was -13% in 2016.
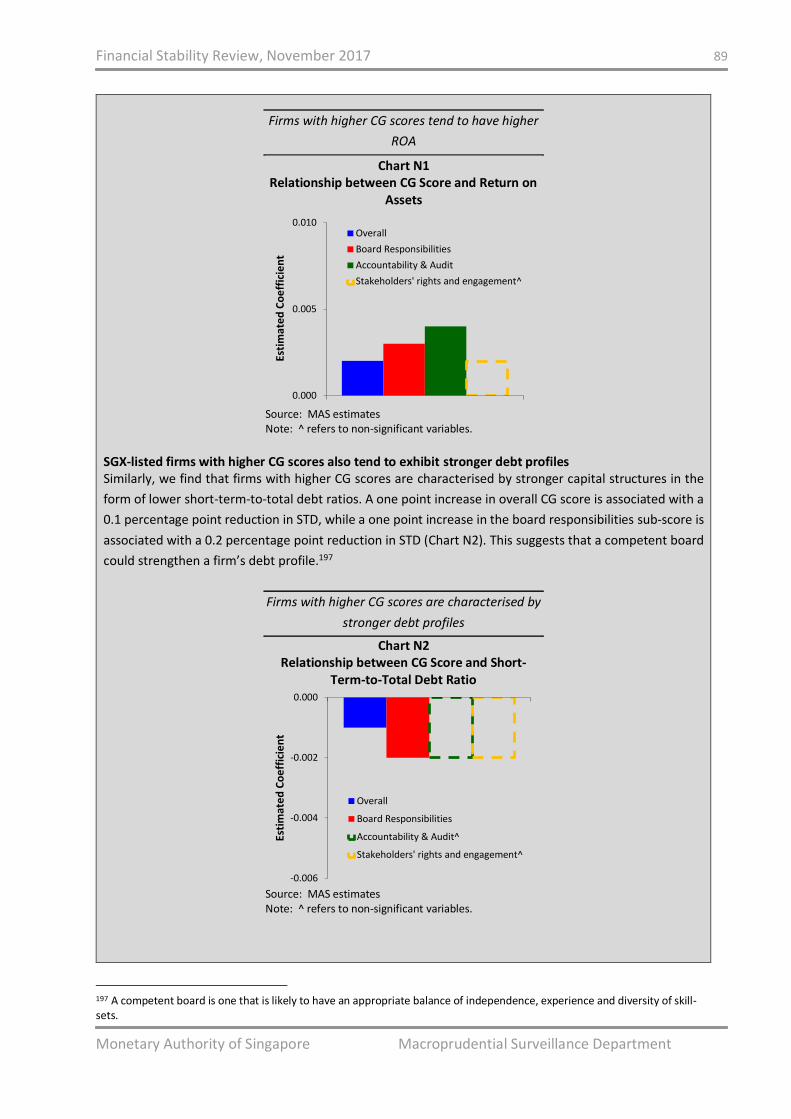
Financial Stability Review, November 2017 89
Monetary Authority of Singapore Macroprudential Surveillance Department
Firms with higher CG scores tend to have higher
ROA
Chart N1 Relationship between CG Score and Return on
Assets
Source: MAS estimates Note: ^ refers to non-significant variables.
SGX-listed firms with higher CG scores also tend to exhibit stronger debt profiles Similarly, we find that firms with higher CG scores are characterised by stronger capital structures in the
form of lower short-term-to-total debt ratios. A one point increase in overall CG score is associated with a
0.1 percentage point reduction in STD, while a one point increase in the board responsibilities sub-score is
associated with a 0.2 percentage point reduction in STD (Chart N2). This suggests that a competent board
could strengthen a firm’s debt profile.197
Firms with higher CG scores are characterised by
stronger debt profiles
Chart N2 Relationship between CG Score and Short-
Term-to-Total Debt Ratio
Source: MAS estimates Note: ^ refers to non-significant variables.
197 A competent board is one that is likely to have an appropriate balance of independence, experience and diversity of skill-sets.
0.000
0.005
0.010
Esti
mat
ed
Co
eff
icie
nt
Overall
Board Responsibilities
Accountability & Audit
Stakeholders' rights and engagement^
-0.006
-0.004
-0.002
0.000
Esti
mat
ed
Co
eff
icie
nt
Overall
Board Responsibilities
Accountability & Audit^
Stakeholders' rights and engagement^
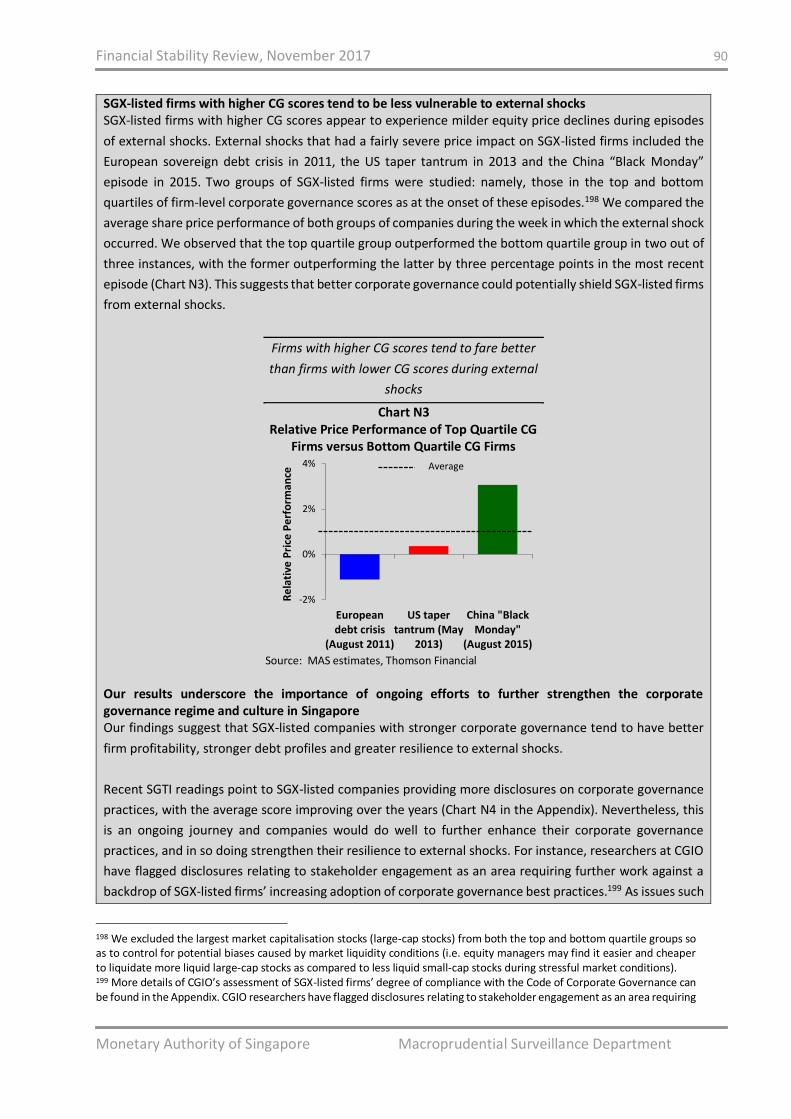
Financial Stability Review, November 2017 90
Monetary Authority of Singapore Macroprudential Surveillance Department
SGX-listed firms with higher CG scores tend to be less vulnerable to external shocks SGX-listed firms with higher CG scores appear to experience milder equity price declines during episodes
of external shocks. External shocks that had a fairly severe price impact on SGX-listed firms included the
European sovereign debt crisis in 2011, the US taper tantrum in 2013 and the China “Black Monday”
episode in 2015. Two groups of SGX-listed firms were studied: namely, those in the top and bottom
quartiles of firm-level corporate governance scores as at the onset of these episodes.198 We compared the
average share price performance of both groups of companies during the week in which the external shock
occurred. We observed that the top quartile group outperformed the bottom quartile group in two out of
three instances, with the former outperforming the latter by three percentage points in the most recent
episode (Chart N3). This suggests that better corporate governance could potentially shield SGX-listed firms
from external shocks.
Firms with higher CG scores tend to fare better
than firms with lower CG scores during external
shocks
Chart N3 Relative Price Performance of Top Quartile CG
Firms versus Bottom Quartile CG Firms
Source: MAS estimates, Thomson Financial
Our results underscore the importance of ongoing efforts to further strengthen the corporate governance regime and culture in Singapore Our findings suggest that SGX-listed companies with stronger corporate governance tend to have better
firm profitability, stronger debt profiles and greater resilience to external shocks.
Recent SGTI readings point to SGX-listed companies providing more disclosures on corporate governance
practices, with the average score improving over the years (Chart N4 in the Appendix). Nevertheless, this
is an ongoing journey and companies would do well to further enhance their corporate governance
practices, and in so doing strengthen their resilience to external shocks. For instance, researchers at CGIO
have flagged disclosures relating to stakeholder engagement as an area requiring further work against a
backdrop of SGX-listed firms’ increasing adoption of corporate governance best practices.199 As issues such
198 We excluded the largest market capitalisation stocks (large-cap stocks) from both the top and bottom quartile groups so as to control for potential biases caused by market liquidity conditions (i.e. equity managers may find it easier and cheaper to liquidate more liquid large-cap stocks as compared to less liquid small-cap stocks during stressful market conditions). 199 More details of CGIO’s assessment of SGX-listed firms’ degree of compliance with the Code of Corporate Governance can be found in the Appendix. CGIO researchers have flagged disclosures relating to stakeholder engagement as an area requiring
-2%
0%
2%
4%
Europeandebt crisis
(August 2011)
US tapertantrum (May
2013)
China "BlackMonday"
(August 2015)
Re
lati
ve P
rice
Pe
rfo
rman
ce
Average

Financial Stability Review, November 2017 91
Monetary Authority of Singapore Macroprudential Surveillance Department
as sustainability reporting come to the fore, SGX-listed companies could also enhance their disclosures
relating to environmental, social and governance (ESG) policies, practices and targets.200 Last but not least,
the ongoing review of the Singapore Code of Corporate Governance aims to ensure that the corporate
governance framework remains relevant and progressive. 201 We believe that such efforts will foster
sustained business growth and innovation for SGX-listed firms.
further work. The Business Times (2 August 2017), “Corporate Governance Reaches New High but Better Stakeholder Engagement Needed”. Other NUS researchers have flagged CG culture — a culture whereby companies, boards, investors, intermediaries, professional bodies, media and other market players drive corporate governance improvements — as another area requiring further work. The Business Times (20 April 2017), “Culture and Corporate Governance”. 200 Asset managers and institutional asset owners have shown greater interest in ESG investing, and this could be an area for further empirical work. 201 The Singapore Code of CG was last reviewed in 2012. http://www.mas.gov.sg/News-and-Publications/Media-Releases/2017/MAS-Announces-Establishment-of-Corporate-Governance-Council.aspx
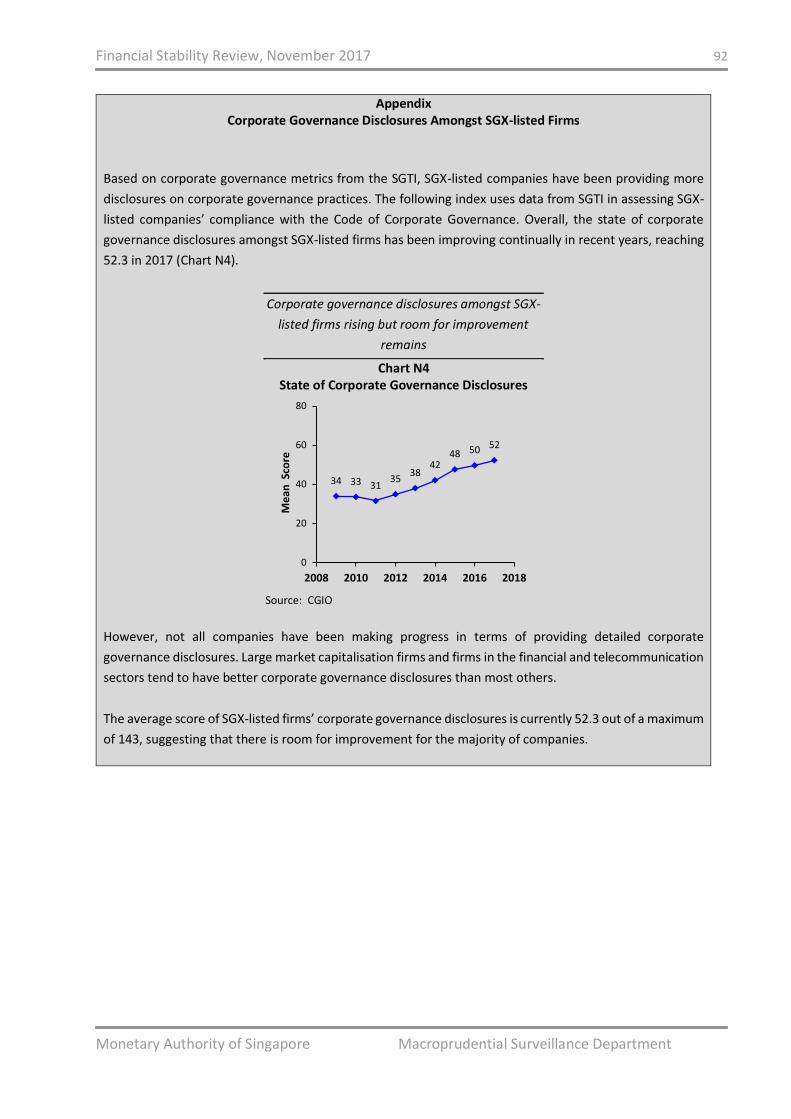
Financial Stability Review, November 2017 92
Monetary Authority of Singapore Macroprudential Surveillance Department
Appendix Corporate Governance Disclosures Amongst SGX-listed Firms
Based on corporate governance metrics from the SGTI, SGX-listed companies have been providing more
disclosures on corporate governance practices. The following index uses data from SGTI in assessing SGX-
listed companies’ compliance with the Code of Corporate Governance. Overall, the state of corporate
governance disclosures amongst SGX-listed firms has been improving continually in recent years, reaching
52.3 in 2017 (Chart N4).
Corporate governance disclosures amongst SGX-
listed firms rising but room for improvement
remains
Chart N4 State of Corporate Governance Disclosures
Source: CGIO
However, not all companies have been making progress in terms of providing detailed corporate
governance disclosures. Large market capitalisation firms and firms in the financial and telecommunication
sectors tend to have better corporate governance disclosures than most others.
The average score of SGX-listed firms’ corporate governance disclosures is currently 52.3 out of a maximum
of 143, suggesting that there is room for improvement for the majority of companies.
34 33 3135
3842
48 50 52
0
20
40
60
80
2008 2010 2012 2014 2016 2018
Me
an S
core
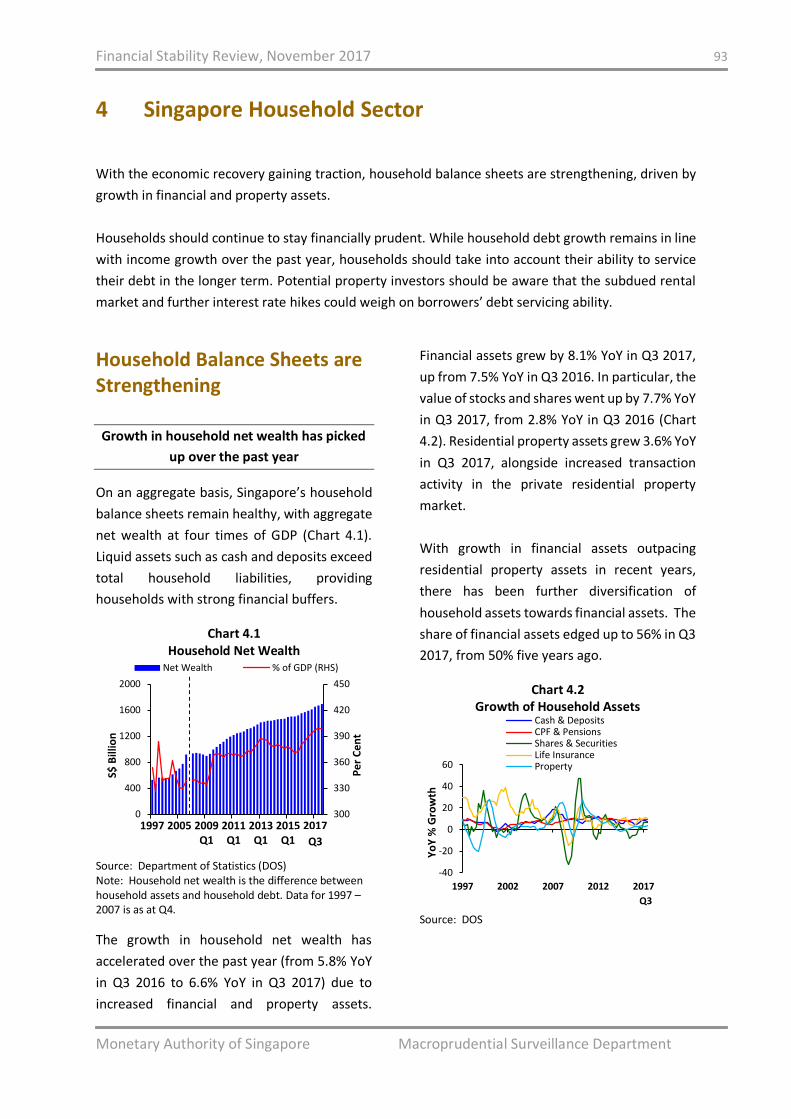
Financial Stability Review, November 2017 93
Monetary Authority of Singapore Macroprudential Surveillance Department
4 Singapore Household Sector
With the economic recovery gaining traction, household balance sheets are strengthening, driven by
growth in financial and property assets.
Households should continue to stay financially prudent. While household debt growth remains in line
with income growth over the past year, households should take into account their ability to service
their debt in the longer term. Potential property investors should be aware that the subdued rental
market and further interest rate hikes could weigh on borrowers’ debt servicing ability.
Household Balance Sheets are Strengthening
Growth in household net wealth has picked
up over the past year
On an aggregate basis, Singapore’s household
balance sheets remain healthy, with aggregate
net wealth at four times of GDP (Chart 4.1).
Liquid assets such as cash and deposits exceed
total household liabilities, providing
households with strong financial buffers.
Chart 4.1 Household Net Wealth
Source: Department of Statistics (DOS) Note: Household net wealth is the difference between household assets and household debt. Data for 1997 – 2007 is as at Q4.
The growth in household net wealth has
accelerated over the past year (from 5.8% YoY
in Q3 2016 to 6.6% YoY in Q3 2017) due to
increased financial and property assets.
Financial assets grew by 8.1% YoY in Q3 2017,
up from 7.5% YoY in Q3 2016. In particular, the
value of stocks and shares went up by 7.7% YoY
in Q3 2017, from 2.8% YoY in Q3 2016 (Chart
4.2). Residential property assets grew 3.6% YoY
in Q3 2017, alongside increased transaction
activity in the private residential property
market.
With growth in financial assets outpacing
residential property assets in recent years,
there has been further diversification of
household assets towards financial assets. The
share of financial assets edged up to 56% in Q3
2017, from 50% five years ago.
Chart 4.2 Growth of Household Assets
Source: DOS
300
330
360
390
420
450
0
400
800
1200
1600
2000
1997 2005 2009Q1
2011Q1
2013Q1
2015Q1
2017Q1
Pe
r C
en
t
S$ B
illio
n
Net Wealth % of GDP (RHS)
Q3
-40
-20
0
20
40
60
1997 2002 2007 2012 2017
Yo
Y %
Gro
wth
Cash & DepositsCPF & PensionsShares & SecuritiesLife InsuranceProperty
Q3
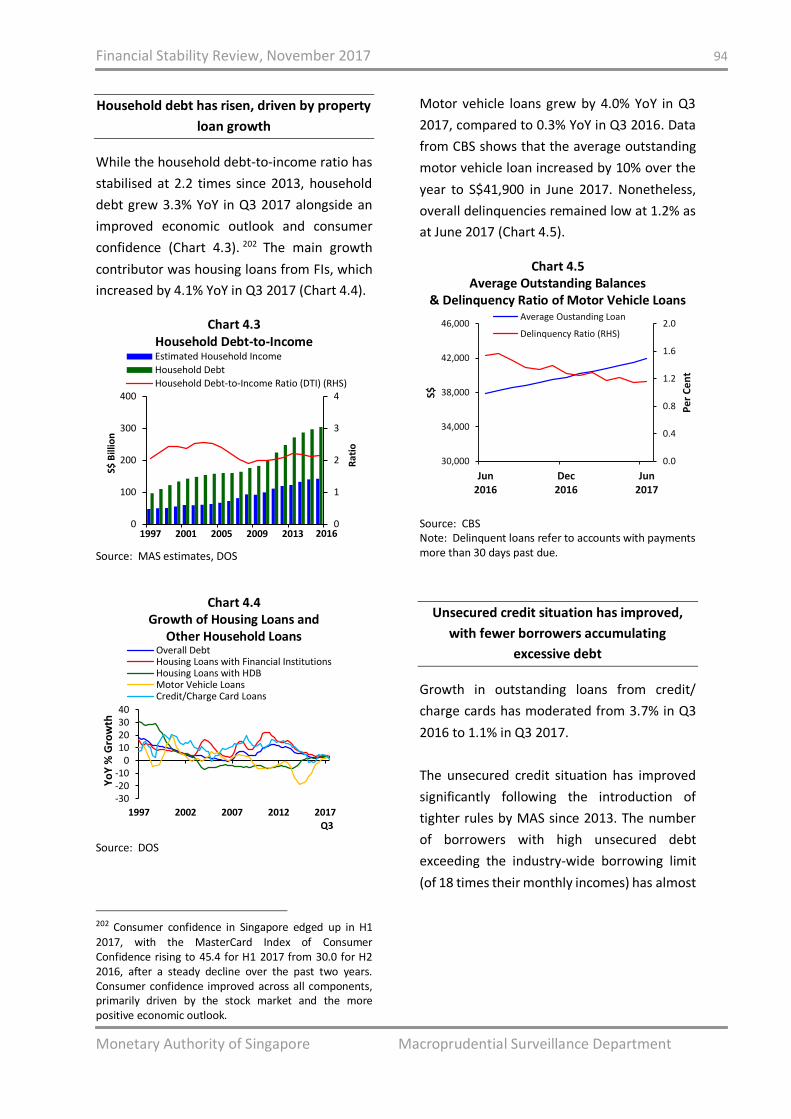
Financial Stability Review, November 2017 94
Monetary Authority of Singapore Macroprudential Surveillance Department
Household debt has risen, driven by property
loan growth
While the household debt-to-income ratio has
stabilised at 2.2 times since 2013, household
debt grew 3.3% YoY in Q3 2017 alongside an
improved economic outlook and consumer
confidence (Chart 4.3). 202 The main growth
contributor was housing loans from FIs, which
increased by 4.1% YoY in Q3 2017 (Chart 4.4).
Chart 4.3 Household Debt-to-Income
Source: MAS estimates, DOS
Chart 4.4
Growth of Housing Loans and Other Household Loans
Source: DOS
202 Consumer confidence in Singapore edged up in H1 2017, with the MasterCard Index of Consumer Confidence rising to 45.4 for H1 2017 from 30.0 for H2 2016, after a steady decline over the past two years. Consumer confidence improved across all components, primarily driven by the stock market and the more positive economic outlook.
Motor vehicle loans grew by 4.0% YoY in Q3
2017, compared to 0.3% YoY in Q3 2016. Data
from CBS shows that the average outstanding
motor vehicle loan increased by 10% over the
year to S$41,900 in June 2017. Nonetheless,
overall delinquencies remained low at 1.2% as
at June 2017 (Chart 4.5).
Chart 4.5 Average Outstanding Balances
& Delinquency Ratio of Motor Vehicle Loans
Source: CBS Note: Delinquent loans refer to accounts with payments more than 30 days past due.
Unsecured credit situation has improved,
with fewer borrowers accumulating
excessive debt
Growth in outstanding loans from credit/
charge cards has moderated from 3.7% in Q3
2016 to 1.1% in Q3 2017.
The unsecured credit situation has improved
significantly following the introduction of
tighter rules by MAS since 2013. The number
of borrowers with high unsecured debt
exceeding the industry-wide borrowing limit
(of 18 times their monthly incomes) has almost
0
1
2
3
4
0
100
200
300
400
1997 2001 2005 2009 2013
Rat
io
S$ B
illio
n
Estimated Household Income
Household Debt
Household Debt-to-Income Ratio (DTI) (RHS)
2016
-30-20-10
010203040
1997 2002 2007 2012 2017
Yo
Y %
Gro
wth
Overall DebtHousing Loans with Financial InstitutionsHousing Loans with HDBMotor Vehicle LoansCredit/Charge Card Loans
Q3
0.0
0.4
0.8
1.2
1.6
2.0
30,000
34,000
38,000
42,000
46,000
Jun2016
Dec2016
Jun2017
Pe
r C
en
t
S$
Average Oustanding Loan
Delinquency Ratio (RHS)
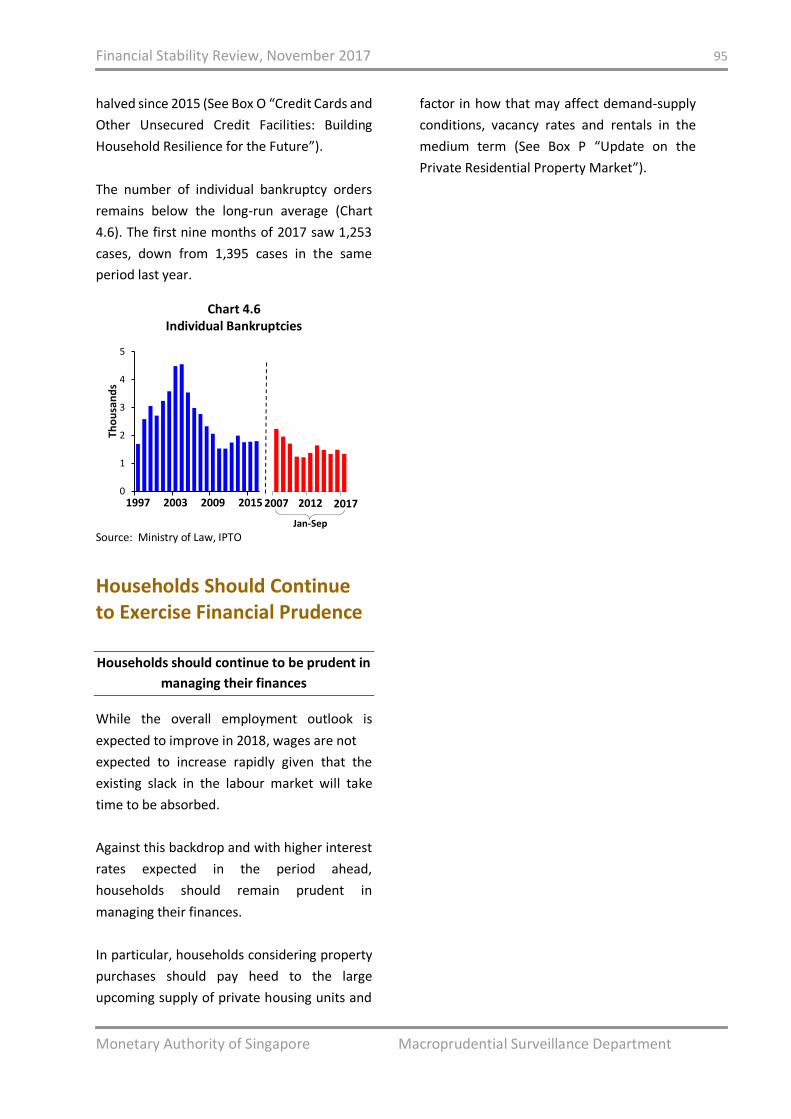
Financial Stability Review, November 2017 95
Monetary Authority of Singapore Macroprudential Surveillance Department
halved since 2015 (See Box O “Credit Cards and
Other Unsecured Credit Facilities: Building
Household Resilience for the Future”).
The number of individual bankruptcy orders
remains below the long-run average (Chart
4.6). The first nine months of 2017 saw 1,253
cases, down from 1,395 cases in the same
period last year.
Chart 4.6 Individual Bankruptcies
Source: Ministry of Law, IPTO
Households Should Continue to Exercise Financial Prudence
Households should continue to be prudent in
managing their finances
While the overall employment outlook is
expected to improve in 2018, wages are not
expected to increase rapidly given that the
existing slack in the labour market will take
time to be absorbed.
Against this backdrop and with higher interest
rates expected in the period ahead,
households should remain prudent in
managing their finances.
In particular, households considering property
purchases should pay heed to the large
upcoming supply of private housing units and
factor in how that may affect demand-supply
conditions, vacancy rates and rentals in the
medium term (See Box P “Update on the
Private Residential Property Market”).
0
1
2
3
4
5
1997 2003 2009 2015
Tho
usa
nd
s
2007 2012
Jan-Sep
2017
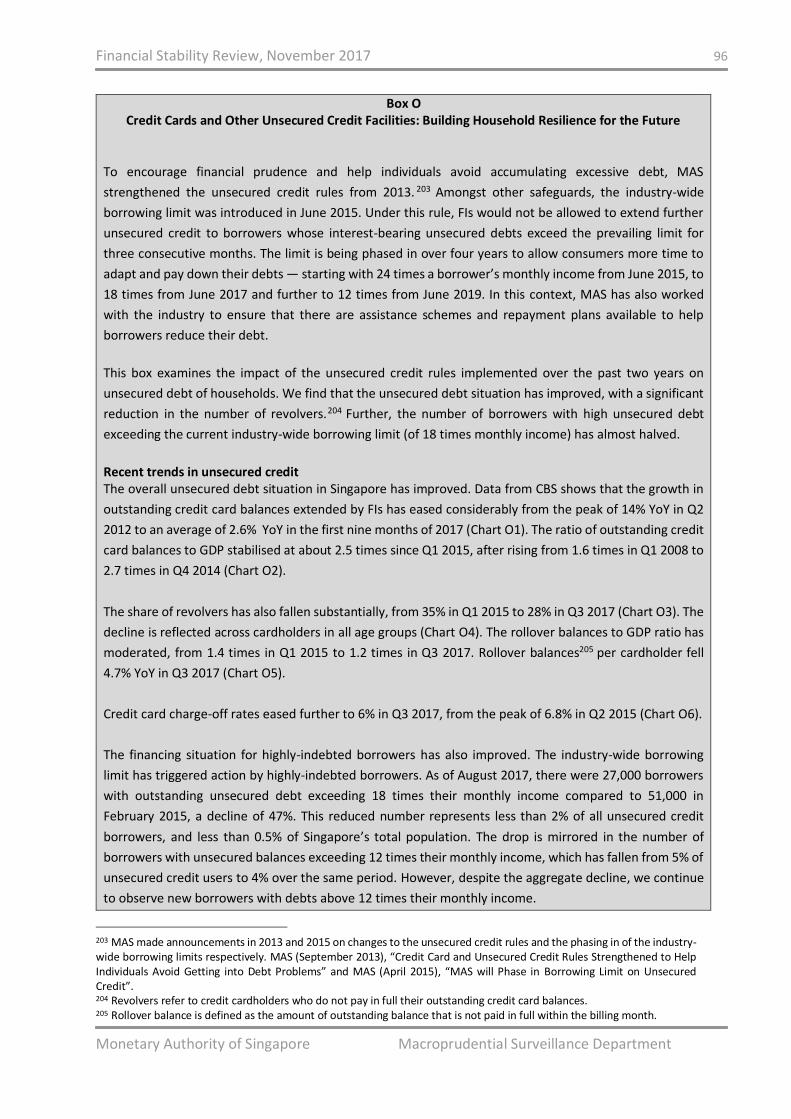
Financial Stability Review, November 2017 96
Monetary Authority of Singapore Macroprudential Surveillance Department
Box O Credit Cards and Other Unsecured Credit Facilities: Building Household Resilience for the Future
To encourage financial prudence and help individuals avoid accumulating excessive debt, MAS
strengthened the unsecured credit rules from 2013. 203 Amongst other safeguards, the industry-wide
borrowing limit was introduced in June 2015. Under this rule, FIs would not be allowed to extend further
unsecured credit to borrowers whose interest-bearing unsecured debts exceed the prevailing limit for
three consecutive months. The limit is being phased in over four years to allow consumers more time to
adapt and pay down their debts — starting with 24 times a borrower’s monthly income from June 2015, to
18 times from June 2017 and further to 12 times from June 2019. In this context, MAS has also worked
with the industry to ensure that there are assistance schemes and repayment plans available to help
borrowers reduce their debt.
This box examines the impact of the unsecured credit rules implemented over the past two years on
unsecured debt of households. We find that the unsecured debt situation has improved, with a significant
reduction in the number of revolvers.204 Further, the number of borrowers with high unsecured debt
exceeding the current industry-wide borrowing limit (of 18 times monthly income) has almost halved.
Recent trends in unsecured credit The overall unsecured debt situation in Singapore has improved. Data from CBS shows that the growth in
outstanding credit card balances extended by FIs has eased considerably from the peak of 14% YoY in Q2
2012 to an average of 2.6% YoY in the first nine months of 2017 (Chart O1). The ratio of outstanding credit
card balances to GDP stabilised at about 2.5 times since Q1 2015, after rising from 1.6 times in Q1 2008 to
2.7 times in Q4 2014 (Chart O2).
The share of revolvers has also fallen substantially, from 35% in Q1 2015 to 28% in Q3 2017 (Chart O3). The
decline is reflected across cardholders in all age groups (Chart O4). The rollover balances to GDP ratio has
moderated, from 1.4 times in Q1 2015 to 1.2 times in Q3 2017. Rollover balances205 per cardholder fell
4.7% YoY in Q3 2017 (Chart O5).
Credit card charge-off rates eased further to 6% in Q3 2017, from the peak of 6.8% in Q2 2015 (Chart O6).
The financing situation for highly-indebted borrowers has also improved. The industry-wide borrowing
limit has triggered action by highly-indebted borrowers. As of August 2017, there were 27,000 borrowers
with outstanding unsecured debt exceeding 18 times their monthly income compared to 51,000 in
February 2015, a decline of 47%. This reduced number represents less than 2% of all unsecured credit
borrowers, and less than 0.5% of Singapore’s total population. The drop is mirrored in the number of
borrowers with unsecured balances exceeding 12 times their monthly income, which has fallen from 5% of
unsecured credit users to 4% over the same period. However, despite the aggregate decline, we continue
to observe new borrowers with debts above 12 times their monthly income.
203 MAS made announcements in 2013 and 2015 on changes to the unsecured credit rules and the phasing in of the industry-wide borrowing limits respectively. MAS (September 2013), “Credit Card and Unsecured Credit Rules Strengthened to Help Individuals Avoid Getting into Debt Problems” and MAS (April 2015), “MAS will Phase in Borrowing Limit on Unsecured Credit”. 204 Revolvers refer to credit cardholders who do not pay in full their outstanding credit card balances. 205 Rollover balance is defined as the amount of outstanding balance that is not paid in full within the billing month.
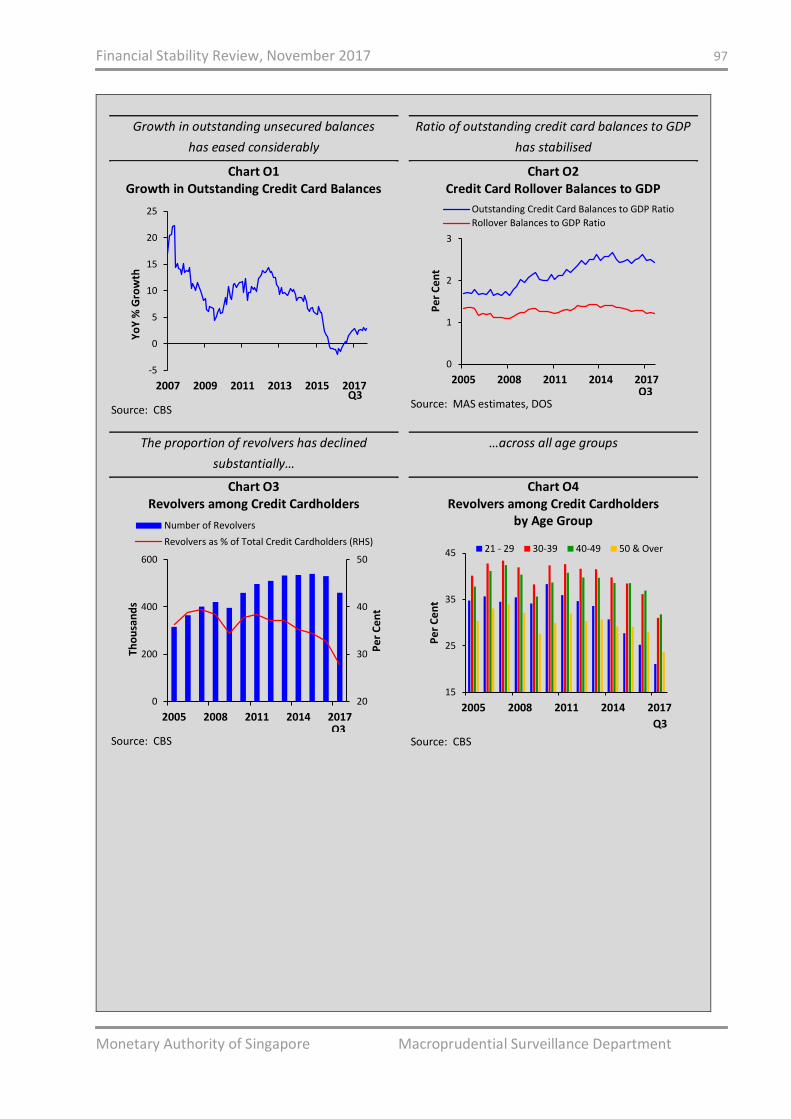
Financial Stability Review, November 2017 97
Monetary Authority of Singapore Macroprudential Surveillance Department
Growth in outstanding unsecured balances
has eased considerably
Chart O1 Growth in Outstanding Credit Card Balances
Source: CBS
Ratio of outstanding credit card balances to GDP
has stabilised
Chart O2 Credit Card Rollover Balances to GDP
Source: MAS estimates, DOS
The proportion of revolvers has declined
substantially…
Chart O3 Revolvers among Credit Cardholders
Source: CBS
…across all age groups
Chart O4 Revolvers among Credit Cardholders
by Age Group
Source: CBS
-5
0
5
10
15
20
25
2007 2009 2011 2013 2015 2017
Yo
Y %
Gro
wth
Q3
0
1
2
3
2005 2008 2011 2014 2017
Pe
r C
en
t
Outstanding Credit Card Balances to GDP Ratio
Rollover Balances to GDP Ratio
Q3
20
30
40
50
0
200
400
600
2005 2008 2011 2014 2017
Pe
r C
en
t
Tho
usa
nd
s
Number of Revolvers
Revolvers as % of Total Credit Cardholders (RHS)
Q3
15
25
35
45
2005 2008 2011 2014 2017
Pe
r C
en
t
21 - 29 30-39 40-49 50 & Over
Q3
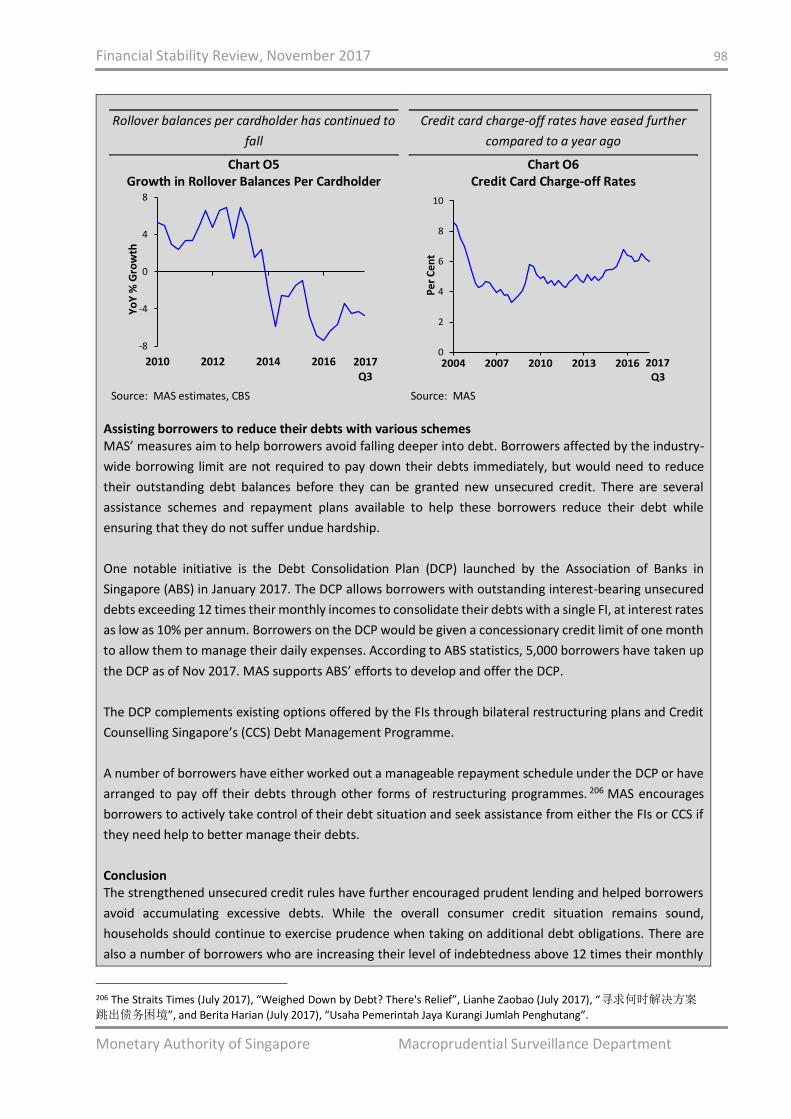
Financial Stability Review, November 2017 98
Monetary Authority of Singapore Macroprudential Surveillance Department
Rollover balances per cardholder has continued to
fall
Chart O5 Growth in Rollover Balances Per Cardholder
Source: MAS estimates, CBS
Credit card charge-off rates have eased further
compared to a year ago
Chart O6 Credit Card Charge-off Rates
Source: MAS
Assisting borrowers to reduce their debts with various schemes MAS’ measures aim to help borrowers avoid falling deeper into debt. Borrowers affected by the industry-
wide borrowing limit are not required to pay down their debts immediately, but would need to reduce
their outstanding debt balances before they can be granted new unsecured credit. There are several
assistance schemes and repayment plans available to help these borrowers reduce their debt while
ensuring that they do not suffer undue hardship.
One notable initiative is the Debt Consolidation Plan (DCP) launched by the Association of Banks in
Singapore (ABS) in January 2017. The DCP allows borrowers with outstanding interest-bearing unsecured
debts exceeding 12 times their monthly incomes to consolidate their debts with a single FI, at interest rates
as low as 10% per annum. Borrowers on the DCP would be given a concessionary credit limit of one month
to allow them to manage their daily expenses. According to ABS statistics, 5,000 borrowers have taken up
the DCP as of Nov 2017. MAS supports ABS’ efforts to develop and offer the DCP.
The DCP complements existing options offered by the FIs through bilateral restructuring plans and Credit
Counselling Singapore’s (CCS) Debt Management Programme.
A number of borrowers have either worked out a manageable repayment schedule under the DCP or have
arranged to pay off their debts through other forms of restructuring programmes. 206 MAS encourages
borrowers to actively take control of their debt situation and seek assistance from either the FIs or CCS if
they need help to better manage their debts.
Conclusion The strengthened unsecured credit rules have further encouraged prudent lending and helped borrowers
avoid accumulating excessive debts. While the overall consumer credit situation remains sound,
households should continue to exercise prudence when taking on additional debt obligations. There are
also a number of borrowers who are increasing their level of indebtedness above 12 times their monthly
206 The Straits Times (July 2017), “Weighed Down by Debt? There's Relief”, Lianhe Zaobao (July 2017), “寻求何时解决方案
跳出债务困境”, and Berita Harian (July 2017), “Usaha Pemerintah Jaya Kurangi Jumlah Penghutang”.
-8
-4
0
4
8
2010 2012 2014 2016
Yo
Y %
Gro
wth
2017Q3
0
2
4
6
8
10
2004 2007 2010 2013 2016
Per
Cen
t
2017Q3
Financial Stability Review, November 2017 99
Monetary Authority of Singapore Macroprudential Surveillance Department
income, even as others reduce theirs. Further, a small number of more highly-leveraged households could
face repayment risks if interest rates rise. They should therefore continue to pare down their debt with the
help of the DCP and other debt restructuring options.
Although credit card penetration and usage have decreased207, consumer credit services offered by Fintech
companies208 could facilitate a rise in unsecured credit209 by lowering loan administration costs. Risks
arising from such lending should be balanced with the potential financial inclusion benefits that such
lending can bring about. For example, the use of technology and data analytics to assess creditworthiness
has helped to increase the reach of microlending, especially to customers often overlooked by banks.210
However, lower income borrowers typically have lower financial buffers and may be more vulnerable to
interest rates and income shocks.
MAS will continue to monitor trends in unsecured credit facilities carefully, and take appropriate measures
where necessary to further encourage financial prudence among households.
207 Credit card issuance has fallen over the past two years. The number of credit cards issued fell from a high of 9.7 million in 2014 to 9.4 million in 2016, after rising from 3.7 million in 2004. Consequently, the credit card penetration rate has fallen, from a peak of 4.4 in 2014 to 4.2 in 2016. This is consistent with global payment trends. World Pay noted that while credit and debit cards remain the most popular form of online payment, the share is expected to fall by 2020 as users gain awareness of and confidence in alternative payment methods. World Pay (2016), “Global Payments Report 2016”. 208 For example, the Ant Check Later service offered by Alibaba's affiliate Ant Financial Services extends credit ranging from RMB 500 to RMB 50,000 based on its own risk assessment of its customers. The Straits Times (October 2017), “Buy Now, Pay Later: Easy Credit Leaving China's Millennials Spent”. 209 In China, the online credit market has grown more than seventy fold, from RMB 6 billion in 2013 to RMB 437 billion as of
2016. iResearch (May 2017), “2017 年中国消费金融洞察报告”. 210 Forbes (March 2017), “A Chinese Company That Lends to Borrowers with No Credit Scores”.
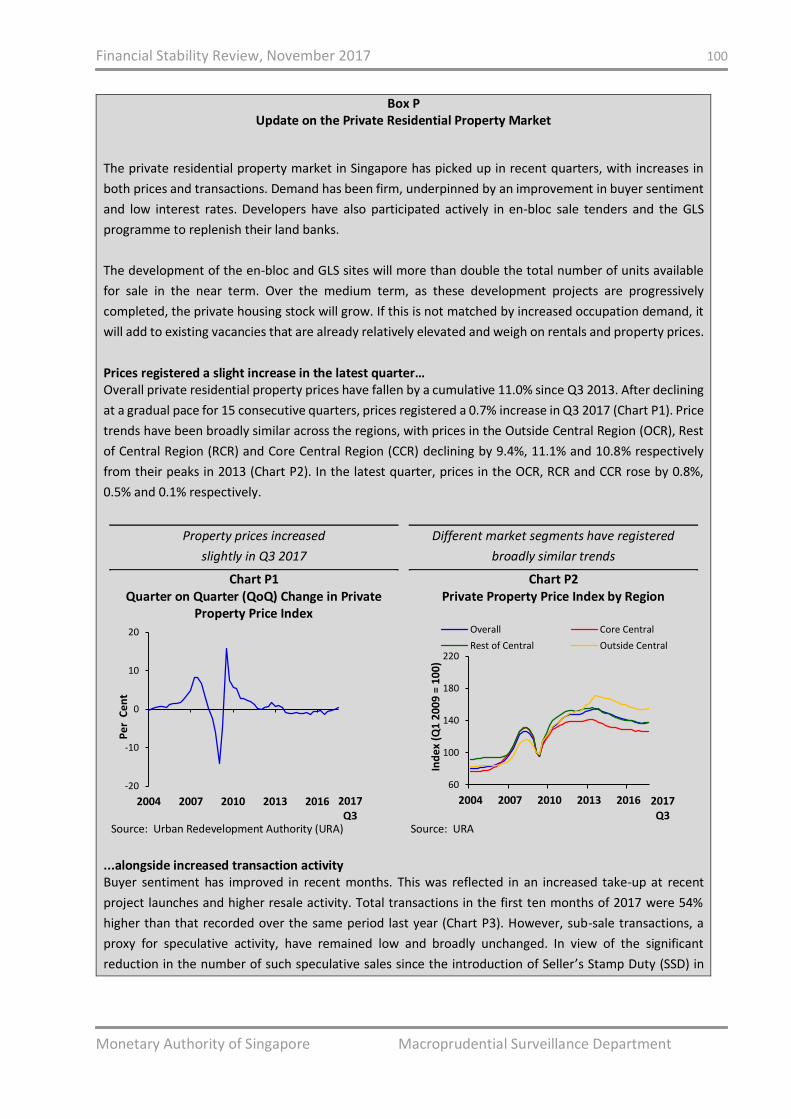
Financial Stability Review, November 2017 100
Monetary Authority of Singapore Macroprudential Surveillance Department
Box P Update on the Private Residential Property Market
The private residential property market in Singapore has picked up in recent quarters, with increases in
both prices and transactions. Demand has been firm, underpinned by an improvement in buyer sentiment
and low interest rates. Developers have also participated actively in en-bloc sale tenders and the GLS
programme to replenish their land banks.
The development of the en-bloc and GLS sites will more than double the total number of units available
for sale in the near term. Over the medium term, as these development projects are progressively
completed, the private housing stock will grow. If this is not matched by increased occupation demand, it
will add to existing vacancies that are already relatively elevated and weigh on rentals and property prices.
Prices registered a slight increase in the latest quarter… Overall private residential property prices have fallen by a cumulative 11.0% since Q3 2013. After declining
at a gradual pace for 15 consecutive quarters, prices registered a 0.7% increase in Q3 2017 (Chart P1). Price
trends have been broadly similar across the regions, with prices in the Outside Central Region (OCR), Rest
of Central Region (RCR) and Core Central Region (CCR) declining by 9.4%, 11.1% and 10.8% respectively
from their peaks in 2013 (Chart P2). In the latest quarter, prices in the OCR, RCR and CCR rose by 0.8%,
0.5% and 0.1% respectively.
Property prices increased
slightly in Q3 2017
Chart P1 Quarter on Quarter (QoQ) Change in Private
Property Price Index
Source: Urban Redevelopment Authority (URA)
Different market segments have registered
broadly similar trends
Chart P2 Private Property Price Index by Region
Source: URA
...alongside increased transaction activity Buyer sentiment has improved in recent months. This was reflected in an increased take-up at recent
project launches and higher resale activity. Total transactions in the first ten months of 2017 were 54%
higher than that recorded over the same period last year (Chart P3). However, sub-sale transactions, a
proxy for speculative activity, have remained low and broadly unchanged. In view of the significant
reduction in the number of such speculative sales since the introduction of Seller’s Stamp Duty (SSD) in
-20
-10
0
10
20
2004 2007 2010 2013 2016
Pe
r C
en
t
2017Q3
60
100
140
180
220
2004 2007 2010 2013 2016
Ind
ex
(Q1
20
09
= 1
00
)
Overall Core Central
Rest of Central Outside Central
2017Q3
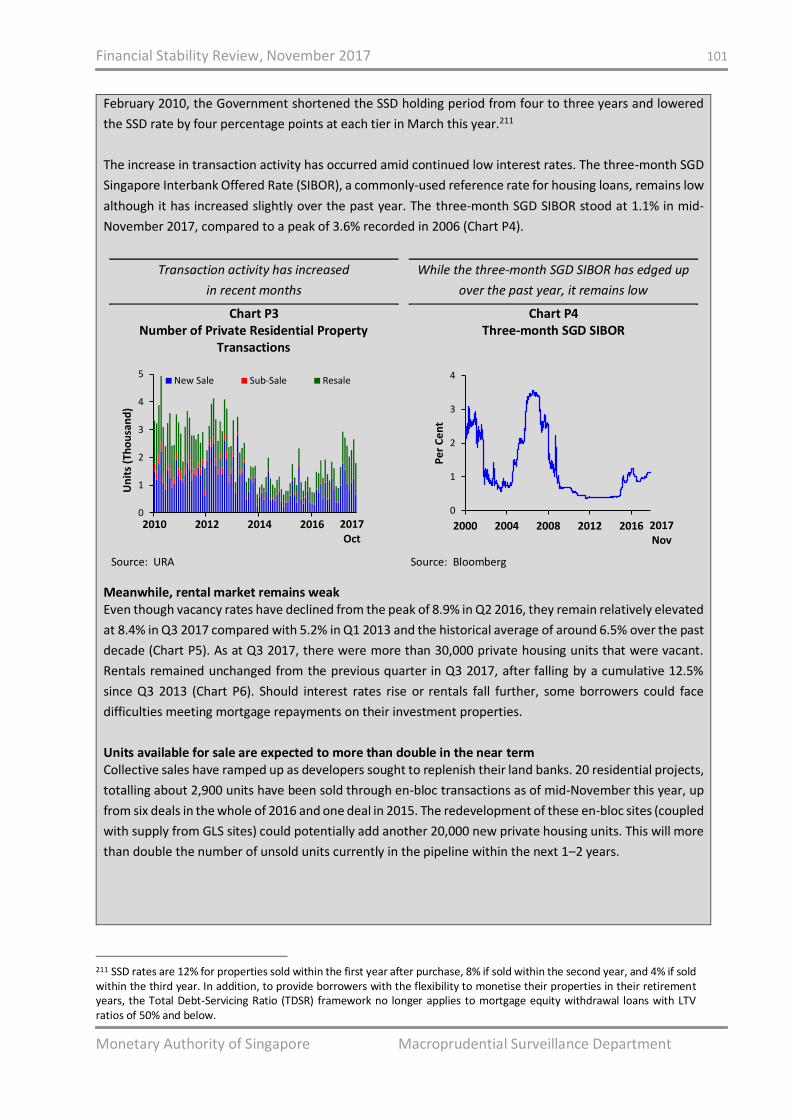
Financial Stability Review, November 2017 101
Monetary Authority of Singapore Macroprudential Surveillance Department
February 2010, the Government shortened the SSD holding period from four to three years and lowered
the SSD rate by four percentage points at each tier in March this year.211
The increase in transaction activity has occurred amid continued low interest rates. The three-month SGD
Singapore Interbank Offered Rate (SIBOR), a commonly-used reference rate for housing loans, remains low
although it has increased slightly over the past year. The three-month SGD SIBOR stood at 1.1% in mid-
November 2017, compared to a peak of 3.6% recorded in 2006 (Chart P4).
Transaction activity has increased
in recent months
Chart P3 Number of Private Residential Property
Transactions
Source: URA
While the three-month SGD SIBOR has edged up
over the past year, it remains low
Chart P4 Three-month SGD SIBOR
Source: Bloomberg
Meanwhile, rental market remains weak Even though vacancy rates have declined from the peak of 8.9% in Q2 2016, they remain relatively elevated
at 8.4% in Q3 2017 compared with 5.2% in Q1 2013 and the historical average of around 6.5% over the past
decade (Chart P5). As at Q3 2017, there were more than 30,000 private housing units that were vacant.
Rentals remained unchanged from the previous quarter in Q3 2017, after falling by a cumulative 12.5%
since Q3 2013 (Chart P6). Should interest rates rise or rentals fall further, some borrowers could face
difficulties meeting mortgage repayments on their investment properties.
Units available for sale are expected to more than double in the near term Collective sales have ramped up as developers sought to replenish their land banks. 20 residential projects,
totalling about 2,900 units have been sold through en-bloc transactions as of mid-November this year, up
from six deals in the whole of 2016 and one deal in 2015. The redevelopment of these en-bloc sites (coupled
with supply from GLS sites) could potentially add another 20,000 new private housing units. This will more
than double the number of unsold units currently in the pipeline within the next 1–2 years.
211 SSD rates are 12% for properties sold within the first year after purchase, 8% if sold within the second year, and 4% if sold within the third year. In addition, to provide borrowers with the flexibility to monetise their properties in their retirement years, the Total Debt-Servicing Ratio (TDSR) framework no longer applies to mortgage equity withdrawal loans with LTV ratios of 50% and below.
0
1
2
3
4
5
2010 2012 2014 2016
Un
its
(Th
ou
san
d)
New Sale Sub-Sale Resale
2017 Oct
0
1
2
3
4
2000 2004 2008 2012 2016
Pe
r C
en
t
2017Nov
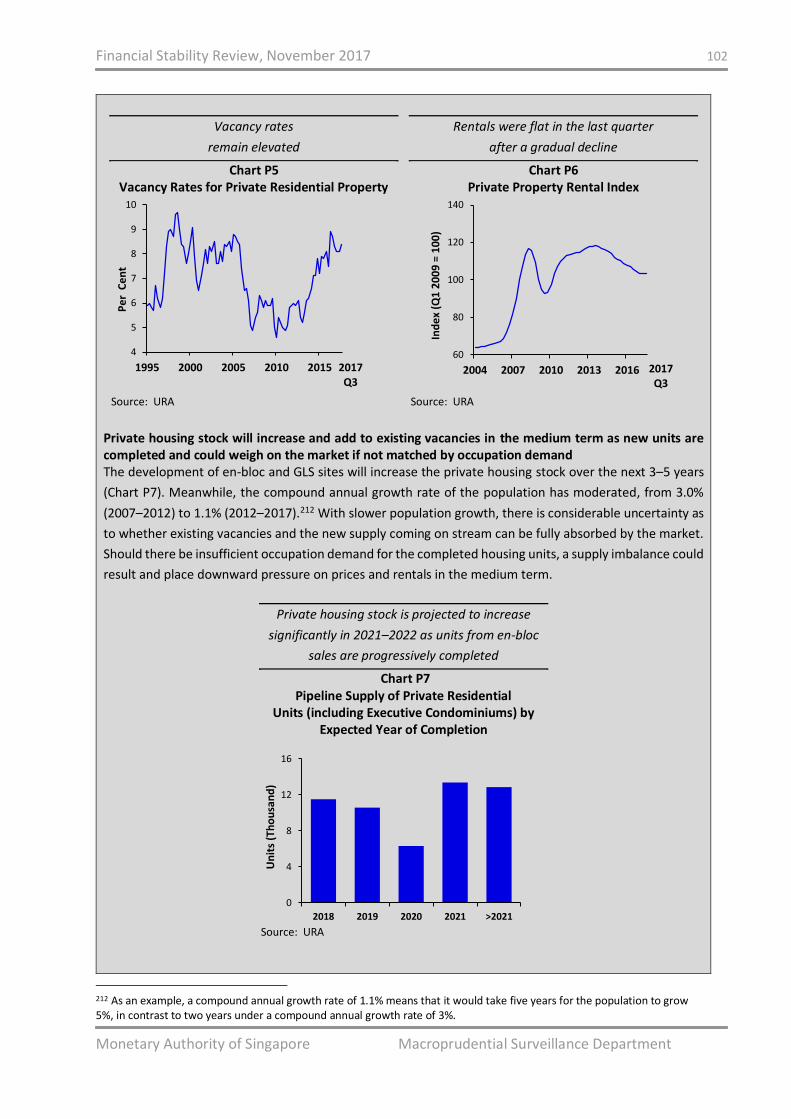
Financial Stability Review, November 2017 102
Monetary Authority of Singapore Macroprudential Surveillance Department
Vacancy rates
remain elevated
Chart P5 Vacancy Rates for Private Residential Property
Source: URA
Rentals were flat in the last quarter
after a gradual decline
Chart P6 Private Property Rental Index
Source: URA
Private housing stock will increase and add to existing vacancies in the medium term as new units are completed and could weigh on the market if not matched by occupation demand The development of en-bloc and GLS sites will increase the private housing stock over the next 3–5 years
(Chart P7). Meanwhile, the compound annual growth rate of the population has moderated, from 3.0%
(2007–2012) to 1.1% (2012–2017).212 With slower population growth, there is considerable uncertainty as
to whether existing vacancies and the new supply coming on stream can be fully absorbed by the market.
Should there be insufficient occupation demand for the completed housing units, a supply imbalance could
result and place downward pressure on prices and rentals in the medium term.
Private housing stock is projected to increase
significantly in 2021–2022 as units from en-bloc
sales are progressively completed
Chart P7 Pipeline Supply of Private Residential
Units (including Executive Condominiums) by Expected Year of Completion
Source: URA
212 As an example, a compound annual growth rate of 1.1% means that it would take five years for the population to grow 5%, in contrast to two years under a compound annual growth rate of 3%.
4
5
6
7
8
9
10
1995 2000 2005 2010 2015
Pe
r C
en
t
2017Q3
60
80
100
120
140
2004 2007 2010 2013 2016
Ind
ex
(Q1
20
09
= 1
00
)
2017Q3
0
4
8
12
16
2018 2019 2020 2021 >2021
Un
its
(Th
ou
san
d)
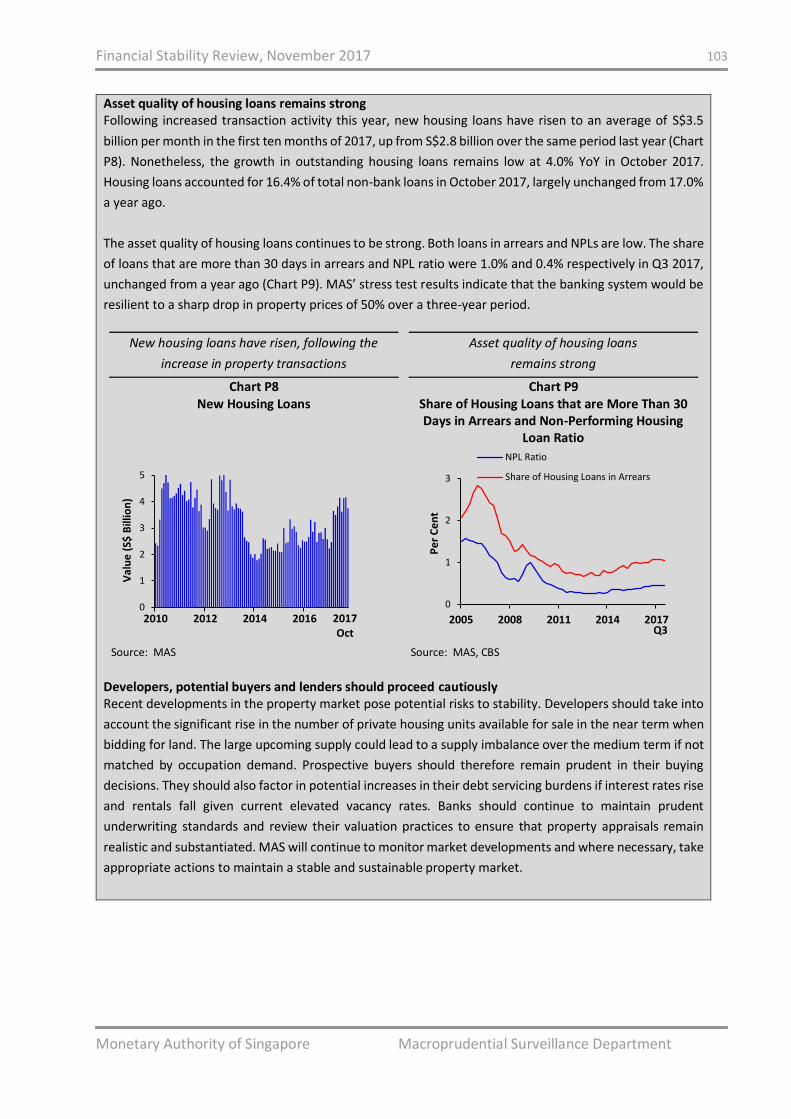
Financial Stability Review, November 2017 103
Monetary Authority of Singapore Macroprudential Surveillance Department
Asset quality of housing loans remains strong Following increased transaction activity this year, new housing loans have risen to an average of S$3.5
billion per month in the first ten months of 2017, up from S$2.8 billion over the same period last year (Chart
P8). Nonetheless, the growth in outstanding housing loans remains low at 4.0% YoY in October 2017.
Housing loans accounted for 16.4% of total non-bank loans in October 2017, largely unchanged from 17.0%
a year ago.
The asset quality of housing loans continues to be strong. Both loans in arrears and NPLs are low. The share
of loans that are more than 30 days in arrears and NPL ratio were 1.0% and 0.4% respectively in Q3 2017,
unchanged from a year ago (Chart P9). MAS’ stress test results indicate that the banking system would be
resilient to a sharp drop in property prices of 50% over a three-year period.
New housing loans have risen, following the
increase in property transactions
Chart P8 New Housing Loans
Source: MAS
Asset quality of housing loans
remains strong
Chart P9 Share of Housing Loans that are More Than 30 Days in Arrears and Non-Performing Housing
Loan Ratio
Source: MAS, CBS
Developers, potential buyers and lenders should proceed cautiously Recent developments in the property market pose potential risks to stability. Developers should take into
account the significant rise in the number of private housing units available for sale in the near term when
bidding for land. The large upcoming supply could lead to a supply imbalance over the medium term if not
matched by occupation demand. Prospective buyers should therefore remain prudent in their buying
decisions. They should also factor in potential increases in their debt servicing burdens if interest rates rise
and rentals fall given current elevated vacancy rates. Banks should continue to maintain prudent
underwriting standards and review their valuation practices to ensure that property appraisals remain
realistic and substantiated. MAS will continue to monitor market developments and where necessary, take
appropriate actions to maintain a stable and sustainable property market.
0
1
2
3
4
5
2010 2012 2014 2016
Val
ue
(S$
Bill
ion
)
2017 Oct
0
1
2
3
2005 2008 2011 2014 2017
Pe
r C
en
t
NPL Ratio
Share of Housing Loans in Arrears
Q3