Embed Size (px)
Citation preview

BofAML Leveraged Finance Conference
PresentationNovember 2017

1
Date
Safe Harbor Statement
This presentation contains “forward-looking” statements regarding the business operations and prospects of Darling Ingredients Inc. (the “Company”) and industry factors affectingit. These statements are identified by words such as “believe,” “anticipate,” “expect,” “estimate,” “intend,” “could,” “may,” “will,” “should,” “planned,” “potential,” “continue,”“momentum,” and other words referring to events that may occur in the future. These statements reflect the Company’s current view of future events and are based on itsassessment of, and are subject to, a variety of risks and uncertainties beyond its control, each of which could cause actual results to differ materially from those indicated in theforward-looking statements. These factors include, among others, existing and unknown future limitations on the ability of the Company's direct and indirect subsidiaries to maketheir cash flow available to the Company for payments on the Company's indebtedness or other purposes; global demands for bio-fuels and grain and oilseed commodities, whichhave exhibited volatility, and can impact the cost of feed for cattle, hogs and poultry, thus affecting available rendering feedstock and selling prices for the Company’s products;reductions in raw material volumes available to the Company due to weak margins in the meat production industry as a result of higher feed costs, reduced consumer demand orother factors, reduced volume from food service establishments, or otherwise; reduced demand for animal feed; reduced finished product prices, including a decline in fat andused cooking oil finished product prices; changes to worldwide government policies relating to renewable fuels and greenhouse gas emissions that adversely affect programs likethe Renewable Fuel Standards Program, low carbon fuel standards (“LCFS”) and tax credits for biofuels both in the Unites States and abroad; possible product recall resulting fromdevelopments relating to the discovery of unauthorized adulterations to food or food additives; the occurrence of Bird Flu including, but not limited to H5N1 flu, bovine spongiformencephalopathy ("BSE"), porcine epidemic diarrhea ("PED") or other diseases associated with animal origin in the United States or elsewhere; unanticipated costs and/or reductionsin raw material volumes related to the Company’s compliance with the existing or unforeseen new U.S. or foreign (including, without limitation, China) regulations affecting theindustries in which the Company operates or its value added products (including new or modified animal feed, Bird Flu, PED or BSE or similar or unanticipated regulations); risksassociated with the renewable diesel plant in Norco, Louisiana owned and operated by a joint venture between Darling Ingredients and Valero Energy Corporation, includingpossible unanticipated operating disruptions and issues related to the announced expansion project; difficulties or a significant disruption in our information systems or failure toimplement new systems and software successfully, including our ongoing enterprise resource planning project; risks relating to possible third party claims of intellectual propertyinfringement; increased contributions to the Company’s pension and benefit plans, including multiemployer and employer-sponsored defined benefit pension plans as required bylegislation, regulation or other applicable U.S. or foreign law or resulting from a U.S. mass withdrawal event; bad debt write-offs; loss of or failure to obtain necessary permits andregistrations; continued or escalated conflict in the Middle East, North Korea, Ukraine or elsewhere; uncertainty regarding the likely exit of the U.K. from the European Union;and/or unfavorable export or import markets. These factors, coupled with volatile prices for natural gas and diesel fuel, climate conditions, currency exchange fluctuations, generalperformance of the U.S. and global economies, disturbances in world financial, credit, commodities and stock markets, and any decline in consumer confidence and discretionaryspending, including the inability of consumers and companies to obtain credit due to lack of liquidity in the financial markets, among others, could negatively impact the Company'sresults of operations. Among other things, future profitability may be affected by the Company’s ability to grow its business, which faces competition from companies that mayhave substantially greater resources than the Company. The Company’s announced share repurchase program may be suspended or discontinued at any time and purchases ofshares under the program are subject to market conditions and other factors, which are likely to change from time to time. Other risks and uncertainties regarding the Company, itsbusiness and the industries in which it operates are referenced from time to time in the Company’s filings with the Securities and Exchange Commission. The Company is under noobligation to (and expressly disclaims any such obligation to) update or alter its forward-looking statements whether as a result of new information, future events or otherwise.
This presentation includes estimates of industry data and forecasts that have been obtained from industry publications and surveys or internal company sources. Estimatesregarding any industry data presented in this presentation, in particular as they relate to market share, size and growth rates and general expectations, involve risks anduncertainties and are subject to change based on various factors. We cannot guarantee the accuracy or completeness of such information contained in this presentation.
The financial information in this presentation includes financial information that is not presented in accordance with generally accepted accounting principles (“GAAP”). Non-GAAPfinancial measures may be considered in addition to GAAP financial information, but should not be used as substitutes for the corresponding GAAP measures. Non-GAAP measuresin this presentation may be calculated in a way that is not comparable to similarly titled measures reported by other companies. See the Appendix of this presentation for areconciliation between GAAP and these non-GAAP measures.

2
Date
Company & Segment Overview
CREATING SUSTAINABLE FOOD, FEED, AND FUEL INGREDIENTS FOR A GROWING POPULATION

3
Date
Our Strategy
…thus generating substantial cash flow and
growing shareholder value.
We seek to BUILD, ACQUIRE and DEVELOP businesses within geographieswhere we can achieve a sustainable Top 3 market position within 5 years…
To be the Global Leader in the production of high quality
sustainable protein and nutrient-recovered ingredients.
markets to satisfy a growing population.
FOOD
FEED
FUEL
Supplying ingredients for the
4
Date
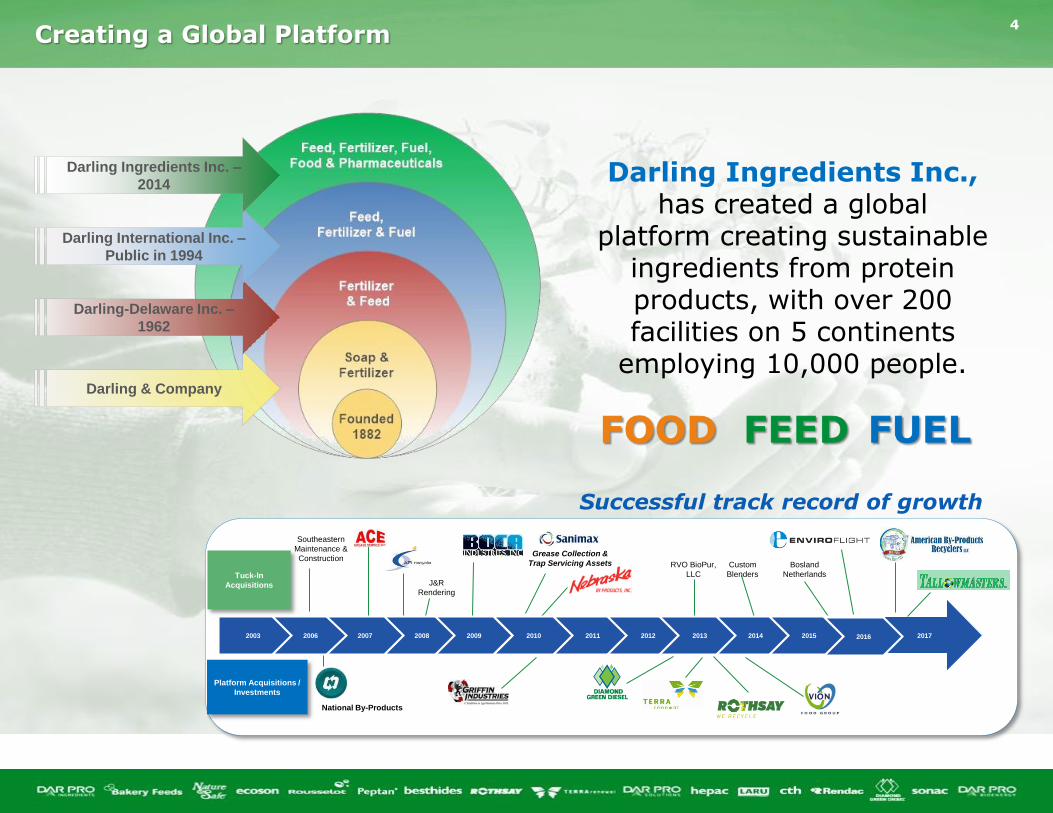
Creating a Global Platform
Darling & Company
Darling-Delaware Inc. –
1962
Darling International Inc. –
Public in 1994
Darling Ingredients Inc. –
2014
Southeastern
Maintenance &
Construction
2003 2006 2008 2010 2017
Tuck-In
Acquisitions
Platform Acquisitions /
Investments
2011 2012 2013 2014
J&R
Rendering
National By-Products
Grease Collection &
Trap Servicing Assets
201520092007
Bosland
Netherlands
Custom
Blenders
RVO BioPur,
LLC
Successful track record of growth
2016
Darling Ingredients Inc., has created a global
platform creating sustainable ingredients from protein products, with over 200 facilities on 5 continents
employing 10,000 people.

5
Date
With Population Growth and Wealth Creation…
...better nutrition evolves, and meat proteinsbecome a staple in the global diet
Source: Company, based on multiple population data reports
Source: Food & Agriculture Organization of the United Nations;
Organization for Economic Competitionand Development (forecast)
FORECAST
Africa
India
Latin America
Asia-Pacific
Europe
No. America
6
Date
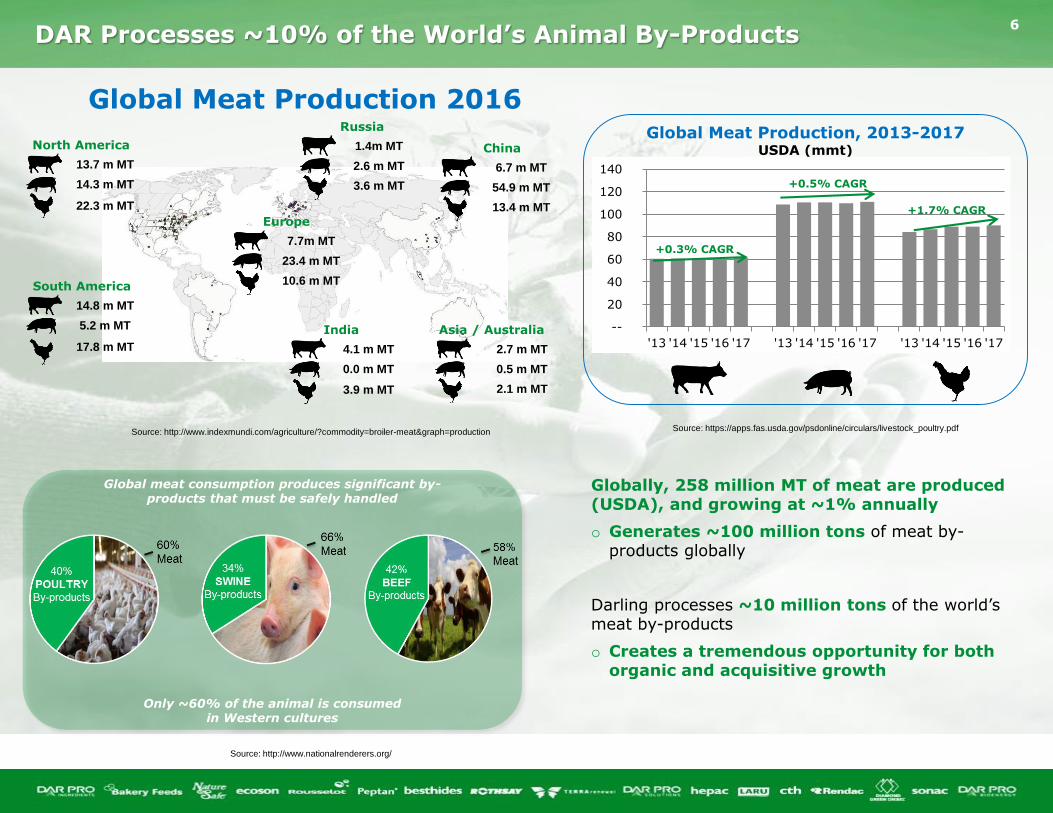
DAR Processes ~10% of the World’s Animal By-Products
Global Meat Production 2016
13.7 m MT
14.3 m MT
22.3 m MT
North America
14.8 m MT
5.2 m MT
17.8 m MT
South America
4.1 m MT
0.0 m MT
3.9 m MT
India
2.7 m MT
0.5 m MT
2.1 m MT
Asia / Australia
6.7 m MT
54.9 m MT
13.4 m MT
China1.4m MT
2.6 m MT
3.6 m MT
Russia
7.7m MT
23.4 m MT
10.6 m MT
Europe
Global Meat Production, 2013-2017 USDA (mmt)
Global meat consumption produces significant by-products that must be safely handled
Globally, 258 million MT of meat are produced (USDA), and growing at ~1% annually
o Generates ~100 million tons of meat by-products globally
Darling processes ~10 million tons of the world’s meat by-products
o Creates a tremendous opportunity for both organic and acquisitive growth
Only ~60% of the animal is consumed in Western cultures
--
20
40
60
80
100
120
140
'13 '14 '15 '16 '17 '13 '14 '15 '16 '17 '13 '14 '15 '16 '17
+0.3% CAGR
+0.5% CAGR
+1.7% CAGR
Source: https://apps.fas.usda.gov/psdonline/circulars/livestock_poultry.pdfSource: http://www.indexmundi.com/agriculture/?commodity=broiler-meat&graph=production
Source: http://www.nationalrenderers.org/

7
Date
Darling Has a Diversified and Unique Portfolio
Processed 1.08 million metric tons
of raw material in 2016
$1.1bn revenue, $131mm Adj. EBITDA
Processed 1.18 million metric tons
of raw material in 2016
$247mm revenue, $58mm Adj. EBITDA,
$87mm DAR share of DGD Adj. EBITDA
Processed 7.97 million metric tons
of raw material in 2016
$2.1bn revenue, $295mm Adj. EBITDA
Restaurant Services

8
Date
A defined model of identified and managed risk
Fee for Service
•Competition
•Government regulations
Commodity Exposed
• Fat price
•Soymeal price
•Corn Price
Spread Managed Margin
•Raw material availability
• Food demand
• Pharma demand
Shared Margin
• Fat price
• Poultry meal pet food spread price
BUSINESS DRIVERS
9
Date
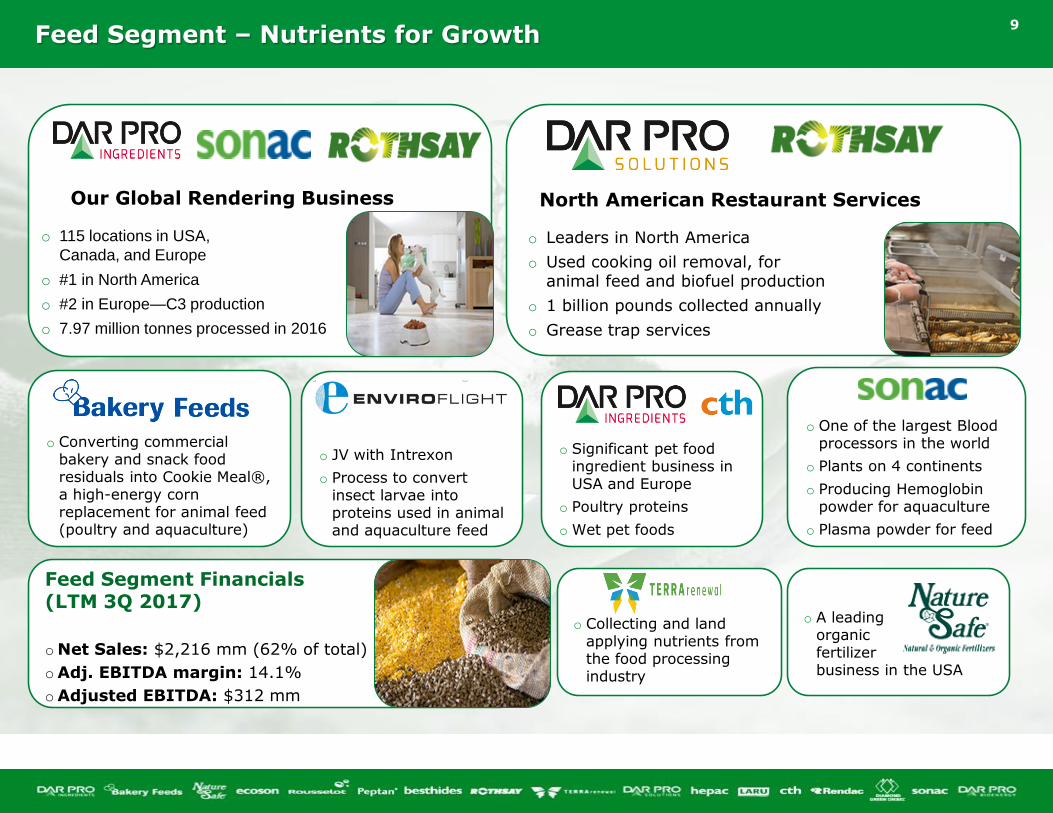
Feed Segment – Nutrients for Growth
o Converting commercial bakery and snack food residuals into Cookie Meal®,a high-energy corn replacement for animal feed(poultry and aquaculture)
o Leaders in North America
o Used cooking oil removal, for animal feed and biofuel production
o 1 billion pounds collected annually
o Grease trap services
o Collecting and land applying nutrients from the food processing industry
o JV with Intrexon
o Process to convert insect larvae into proteins used in animal and aquaculture feed
Feed Segment Financials (LTM 3Q 2017)
oNet Sales: $2,216 mm (62% of total)
oAdj. EBITDA margin: 14.1%
oAdjusted EBITDA: $312 mm
o A leadingorganic fertilizer business in the USA
North American Restaurant Services
o One of the largest Blood processors in the world
o Plants on 4 continents
o Producing Hemoglobin powder for aquaculture
o Plasma powder for feed
Our Global Rendering Business
o 115 locations in USA,
Canada, and Europe
o #1 in North America
o #2 in Europe—C3 production
o 7.97 million tonnes processed in 2016
o Significant pet food ingredient business in USA and Europe
o Poultry proteins
o Wet pet foods

10
Date
EBITDA Bridge Q3-2016 to Q3-2017(millions)
Feed Segment Performance
Key Drivers – Q3 2017
o Global volumes remain strong. Improving North American slaughter
o Fat pricing held firm during the quarter but trended lower during the back end due to uncertainty regarding biofuel mandates and typical seasonality
o Protein pricing remained mixed with lackluster demand for meat and bone meal but stable to higher demand and pricing for the poultry protein meals
US$ and metric tons
(millions)
Q3
2016
Q4
2016
Total
2016
Q1
2017
Q2
2017
Q3
2017 LTM
Revenue $531.4 $538.5 $2,089.1 $552.6 $549.1 $575.5 $2,215.7
Gross Margin 117.8 116.2 464.3 120.0 126.9 125.9 489.0
Gross Margin % 22.2% 21.6% 22.2% 21.7% 23.1% 21.9% 22.1%
SG&A 38.9 42.1 169.6 45.5 43.5 45.5 176.6
SG&A Margin % 7.3% 7.8% 8.1% 8.2% 7.9% 7.9% 8.0%
Operating Income 35.2 25.3 115.8 30.8 39.0 33.6 128.7
Adj. EBITDA (1) $78.9 $73.9 $294.6 $74.5 $83.4 $80.5 $312.3
Raw Material
Processed (million metric tons)
1.97 2.06 7.97 2.05 2.02 2.04 8.17
(1) Does not include Unconsolidated Subsidiaries Adj. EBITDA.
Non-GAAP Adj. EBITDA MarginFeed
10%
11%
12%
13%
14%
15%
16%
Q3 2016 Q4 2016 Q1 2017 Q2 2017 Q3 2017
$78.9 $79.2 $80.5
$14.9 $20.3
($28.9)($6.0)
$1.3
EBITDA Q316 Price / Yield Volumes Cost of Sales Other AdjustedEBITDA
FX Impact EBITDA Q317
14.8%
13.7% 13.5%
15.2%
14.0%
Note: Cost of Sales includes raw material costs, collection costs and factory costs.

11
Date
Growing our Feed Ingredient Segment – Focused on Serving the Growing Pet and Aqua Demand
Global Pet Industry4% annual growth in 2015;
by 2019 - $91 billion
Pet ownership increases with urban population rise
Rise in disposable incomes
Increased awareness for pet safety and health; pets are increasingly family
Completed 2 new wet and frozen pet food plants in Nebraska & Kentucky (US)
Completed expansion of our Zhejiang blood plant
2015
Built 2 new rendering plants
Netherlands de-hiding facility
Maquoketa Iowa blood expansion
Qionglai China blood expansion
Completed Bosland, Netherlands acquisition
2016
New blood plant in Europe
New poultry rendering plant in U.S.
Expansion of Los Angeles, CA plant
2017
Source: http://multibriefs.com/briefs/exclusive/pet_businesses_will_prosper.html#.Wh3kIVWnG70
Source: https://www.aquaculturenorthamerica.com/news/fao-releases-world-review-of-fisheries-and-
aquaculture-for-1630
(Aquaculture uses pet-grade poultry meal as protein source)
New rendering facilities planned for U.S.
2018

12
Date
Food Segment – Ingredients for Living
o A producer of crude
porcine heparin
o Sonac food-grade fat has processing facilities in Germany & the Netherlands
o Laru & Vada brands are Europe’s largest producers of high-quality edible fats for baking and frying
o A leading global supplier of gelatin and hydrolyzed collagen
o 13 production facilities selling to 75+ countries
oGelatin used for Pharma, food,binding agents for processed meats
o Produces Peptan®, collagen peptides for health and beauty markets
Food Segment Financials (LTM 3Q 2017)
o Net Sales: $1,128 mm (31% of total)
o Adj. EBITDA margin: 11.1%
o Adjusted EBITDA: $125 mm
oCTH supplies natural casings and meat products to the food and meat industries
o A leader in porcine bone degreasing
in Europe—supports Rousselot
o Leading producer of edible glues
o A global leader in bone ash for china production

13
Date
Food Segment Performance
Key Drivers – Q3 2017
o Rousselot gelatin business delivered stabilized results due to strong sales volumes and improving conditions in South America.
o Sonac edible fats delivered increased performance with a stabilized palm oil market
o CTH casings business produced solid earnings due to the strong global demand driven by a contraction in Chinese hog supplies.
US$ and metric tons
(millions)
Q3
2016
Q4
2016
Total
2016
Q1
2017
Q2
2017
Q3
2017LTM
Revenue $262.0 $279.9 $1,061.9 $267.8 $279.8 $300.3 $1,127.8
Gross Margin 50.7 56.7 227.5 56.8 56.0 60.1 229.6
Gross Margin % 19.3% 20.3% 21.4% 21.2% 20.0% 20.0% 20.4%
SG&A 25.4 26.5 96.2 25.1 26.8 25.6 104.0
SG&A Margin % 9.7% 9.5% 9.1% 9.4% 9.6% 8.5% 9.2%
Operating Income 7.9 11.7 61.2 14.1 11.0 15.0 51.8
Adj. EBITDA $25.3 $30.0 $131.3 $31.7 $29.2 $34.5 $125.4
Raw Material
Processed(million metric tons)
0.26 0.28 1.08 0.27 0.28 0.29 1.12
Note: Cost of Sales includes raw material costs, collection costs and factory costs.
Non-GAAP Adj. EBITDA MarginFood
EBITDA Bridge Q3-2016 to Q3-2017(millions)
0%
2%
4%
6%
8%
10%
12%
14%
Q3 2016 Q4 2016 Q1 2017 Q2 2017 Q3 2017
$25.3$32.7 $34.5
($2.0)
$25.5
($17.1)
$1.0 $1.8
EBITDAQ32016
Price / Yield Volumes Cost of Sales Other AdjustedEBITDA
FX Impact EBITDA Q317
9.7%10.7%
11.8%
10.4%11.5%

14
Date
Food Segment Performance
Film coating
Expansion of Gelatin plant in France
Dubuque Iowa expansion
Wenzhou China expansion
CTH sheep casing sorting workshop in China
Gelatin expansions in China, USA, Brazil
Expanded Peptan production--Fish
Halal dedicated gelatin production
Canadian edible animal fats
2018
Pill coatings
Confectionaries
Binding agents
Gelatinfor binding, texturizing, gelling,
smoothness, foaming, stabilizing, filming, emulsifying,
reducing fat content.. a natural protein source
2015 – 2017

15
Date
Fuel Segment – Energy for Today’s World
o Collect animal fats and used cooking oils from restaurants, supermarkets, hospitality and other food industry customers
o Recycled material converted into biodiesel DAR PRO Bioenergy – 1st Company plant
built in USA Rothsay Biodiesel - 1st Company plant built
in Canada
End Markets
o Renewable fuels
o Biofuels
o Green electricity
o Green gas
o European disposal rendering – operates multiple facilities and a specialized collection fleet of approx. 300 trucks in Europe to collect and safely process mortalities and slaughter designated unfit for animal feed (Category 1 & 2)
o Largest industrial digestion operation in the Netherlands; organic residuals converted into biogas for renewable electricity, and process manure intobiophosphate used as fertilizer
Fuel Segment Financials (LTM 3Q 2017)*
oNet Sales: $258mm (7% of total)
oAdj. EBITDA margin: 18.0%
oAdjusted EBITDA: $46mm
* Excludes Diamond Green Diesel

16
Date
Fuel Segment Performance
o Ecoson, bioenergy business, was curtailed during the quarter to address current regulatory requirements. Capital improvements underway to regain needed efficiencies
o Rendac, disposal rendering business, received business interruption insurance advance during quarter to help offset losses from fire
o North American biodiesel operating at a loss with the absence of blenders tax credit in 2017 vs. 2016
Key Drivers – Q3 2017US$ and metric tons
(millions)
Q3
2016
Q4
2016
Total
2016
Q1
2017
Q2
2017
Q3
2017LTM
Revenue $60.4 $68.8 $247.1 $59.7 $67.4 $61.9 $257.8
Gross Margin 14.2 19.9 64.6 13.6 12.7 7.6 53.8
Gross Margin % 23.5% 28.9% 26.1% 22.9% 18.8% 12.3% 20.9%
SG&A 1.3 1.9 6.9 3.3 2.9 -0.5 7.6
SG&A Margin % 2.2% 2.8% 2.8% 5.5% 4.3% -8.1% 2.9%
Operating Income 6.0 10.5 29.2 3.5 2.1 0.1 16.2
Adj. EBITDA (1) $12.9 $18.0 $57.7 $10.4 $9.8 $8.1 $46.3Raw Material Processed *
(million metric tons)0.29 0.31 1.18 0.30 0.29 0.28 1.18
(1) Does not include DGD Adj. EBITDA.
* Excludes raw material processed at the DGD joint venture.
$12.9
$7.6 $8.1
($0.2)($1.2)
($5.6)
$1.7$0.5
EBITDA Q216EBITDA Q316
Price / Yield Volumes Cost of Sales Other AdjustedEBITDA
FX Impact EBITDA Q217EBITDA Q317
0%
5%
10%
15%
20%
25%
30%
Q3 2016 Q4 2016 Q1 2017 Q2 2017 Q3 2017
Non-GAAP Adj. EBITDA MarginFuel
EBITDA Bridge Q3-2016 to Q3-2017(millions)
21.4%
26.2%
17.4%
14.5%13.1%
Note: Cost of Sales includes raw material costs, collection costs and factory costs.

17
Date
Diamond Green Diesel (“DGD”) - A Gem of an Ingredient
3Q16 4Q16
Total
2016 1Q17 2Q17 3Q17
DAR Share of Adj. EBITDA $22.5 $36.7 $87.2 $5.0 $12.4 $10.6
Production
(Gallons in millions)43.8 42 158.1 32.6 43.7 41.7
Gallons Sold / Shipped 42.5 46.6 160.9 32.7 40.5 43.0
Background & Rationale
o 50/50 JV with Valero, located adjacent to Valero’s refinery in Norco, Louisiana
o Creates a new market for Darling’s feed stocks, and a natural hedge for Darling’s animal fat products
o Low cost producer of biomass-based diesel to U.S. market
o Renewable diesel can be distributed using established petroleum pipeline systems
Capacity & Expansion
o Initial cost to build PP&E $380mm for capacity of 137mm gallons
o Expanded production to 160mm gallons in 2014
o Expansion to 275mm gallons scheduled for Q2 2018
o Expected to be 100% Low Carbon Fuel Standard (LCFS) capable with improved logistics by 2018
o DGD JV exploring phase three expansion to 550mm gallons
Performance & Financials
o Q3 2017 Adj. EBITDA: $21.1mm entity level, or $10.6mm Darling’s share
o DGD delivered $0.49 per gallon Adj. EBITDA
o Month end volatility in Renewable Identification Numbers (RIN) market drove inventory market adjustment
o Absence of blenders tax credit affected Y-o-Y comparison
o Current total debt in JV stands at $58.0mm. Total cash of $148.4mm at the end of Sep-2017
137 160 160 160 160
198
275
51
127
159 158 160
205
275
2013A 2014A 2015A 2016A 2017E 2018P 2019P
Capacity Gallons Gallons Sold
DGD Gallon Capacity & Sold Gallons
DGD JV Debt Paydown History
P = Planned
$221 $221 $213
$149
$71 $58
2012A 2013A 2014A 2015A 2016A Q32017
Total Debt

18
Date
New LCFS Standards Driving Expansion Plans and Enhancing Contribution to Darling
1.0% 1.0% 1.0% 2.0%
3.5%
5.0%
7.5%
10.0%
2013A 2014A 2015A 2016A 2017E 2018P 2019P 2020P
California LCFS Carbon Reduction Program
$0.71Jul-Dec
$0.30Fiscal
$0.52Fiscal
$1.01Fiscal
Carbon Credit Avg. Price $ / gallon
Adj. EBITDA per Gallon Renewable Diesel
$0.69
$1.29
$1.13 $1.08
$0.60
$1.25 $1.25
2013A 2014A 2015A 2016A 2017E 2018P 2019P
* Excludes blenders tax credit
2014 2015 2016 2017E
EBITDA $163.3 $177.0 $174.4 $96.0
Expansion - Capex $0.0 $0.0 ($6.6) ($89.7)
Regular - Capex ($13.3) ($1.5) ($36.7) ($20.6)Working Capital
Free Cash Flow $150.0 $175.5 $137.7 ($14.3)
Assumptions and References:
Carbon Credit Avg. Pricing per The Jacobsen index – average pricing for 2013 only
includes Jul-Dec 2013 (6 months)
LCFS Carbon Reduction Program per the California Air Resources Board
Start-up of the DGD expansion expected in 2Q 2018
2017 Adj. EBITDA per gallon rate does not include the retrospective blenders tax credit
Assumes sale of full production
$206.3
$275.0
$343.8
$412.5
$0.75 $1.00 $1.25 $1.50
2019 Cash Generation by DGD Price Sensitivity Analysis @ 275mm gal.
(US$ millions)
Adj. EBITDA per Gallon
*

19
Date
Financial Review
CREATING SUSTAINABLE FOOD, FEED, AND FUEL INGREDIENTS FOR A GROWING POPULATION
20
Date
The 2017 Strategy – “A World of Growth”
Continue to target debt reduction in 2017
o Paid down debt by $18.5 million in third quarter; YTD paid down $69.5 million
o Total leverage ratio of 3.56x, secured debt leverage ratio of 1.30x as of 30-Sep-2017 (1)
Targeting Working Capital improvement for 2017
YTD CAPEX spend at $196.4 million
o Seven ongoing construction, expansion, and conversion projects in various regions
• 2 U.S. rendering plants
• China blood and gelatin expansion, including new gelatin plant
• New European blood plant
• U.S. rendering expansion
• First EnviroFlight aquaculture plant in JV with Intrexon
o DGD expanding capacity from 160 million gallons to 275 million gallons annually, scheduled to be completed in 2Q18
• Exploring phase three expansion to 550 million gallons
SG&A current run-rate of $82-83 million/quarter in 2017; Q3 at $83.1 million
Goal is to deploy capital with 15-20% Return on Capital Employed (ROCE)
1) Leverage ratios calculated based on Credit Facility definitions.

21
Date
Q3 2017 OverviewYear over Year
• Global volumes up 3.8% over 3Q 2016.
• Gross margin compression driven by Fuel Segment. Operating challenges at the company’s Ecoson bioenergy plant, absence of a Blenders Tax Credit and business interruption at Rendac-Son facility explain the variance.
• Global pricing of fats and greases improved on solid biofuel demand while a growing global slaughter produced ample protein and pressured prices.
• The absence of the blenders tax credit negatively impacted overall profitability by approximately $21.5 million Adj. EBITDA from DGD, $2.4 million Adj. EBITDA in Fuel Segment or $0.14 EPS.
• Strong free cash flow in the quarter that led to a $18.5 million debt reduction in the quarter and $69.5 million year to date
US$ (millions) except per share price Q3
2016
Q4
2016
Total
2016
Q1
2017
Q2
2017
Q3
2017
Revenue 853.9$ 887.3$ 3,398.1$ 880.1$ 896.3$ 937.7$
Gross Margin 182.7 192.8 756.4 190.4 195.6 193.7
Gross Margin % 21.4% 21.7% 22.3% 21.6% 21.8% 20.7%
SG&A 76.5 79.9 314.0 87.9 85.5 83.1
SG&A Margin % 9.0% 9.0% 9.2% 10.0% 9.5% 8.9%
Operating Income 35.5 35.4 152.1 31.4 37.1 33.3
Adj. EBITDA (1)
106.2 112.8 441.9 102.5 110.1 110.5
Adj. EBITDA Margin % 12.4% 12.7% 13.0% 11.6% 12.3% 11.8%
Interest Expense (23.9) (22.4) (94.2) (21.7) (22.4) (22.5)
Foreign Currency gain/(loss) 0.4 0.4 (1.9) (0.3) (2.1) (2.1)
Other Expense (2) (1.9) 1.7 (3.9) (0.9) (2.9) (1.4)
Equity in net income of unconsolidated
subsidiaries18.1 32.7 70.4 0.7 8.3 7.7
Income Tax (Expense)/Benefit 0.7 (6.2) (15.3) (1.8) (7.7) (6.3)
Net income attributable to
noncontrolling interests(0.2) (1.1) (4.9) (1.6) (1.2) (0.9)
Net income attributable to Darling 28.7$ 40.5$ 102.3$ 5.8$ 9.1$ 7.8$
Earnings per share (fully diluted) 0.17$ 0.25$ 0.62$ 0.04$ 0.05$ 0.05$
(1) Does not inlcude Unconsolidated Subsidiaries EBITDA.
(2) Rounding captured in Other Expense.
Consolidated Financials – Comparisons to Q3 2016

22
Date
Source: Company Management
See Cautionary Statement at end of this presentation.
Revenue (US$ millions) Adj. EBITDA (US$ millions)
Capex (US$ millions)
Historical Financials
$3,956
$3,397 $3,398 $3,601
2014A 2015A 2016A LTM30-Sep-17
$434 $413 $442 $436
$82 $89 $87 $65
$515 $501 $529
$501
2014A 2015A 2016A LTM30-Sep-17
$229 $230
$244
$272
2014A 2015A 2016A LTM30-Sep-17
Dar share of DGD Adj. EBITDA
DAR Adj. EBITDA excl. DGD share

23
Date
Key Credit Highlights
Global, Diversified Platform Across Feed, Food, and Fuel Segments
Producer of High Quality Sustainable Ingredients, Supported by Industry and Macro Dynamics
Proven Economic Model with High Barriers to Entry
Track Record of Strong Financial Performance and Margin Stability
Key Investments to Fuel Long-Term Earnings Power
Exceptional, Tenured Management Team

24
Date
Appendix

25
Date
Adjusted EBITDA Reconciliation
Darling Adjusted EBITDA Total 2014 Total 2015 Q3 2016 Q4 2016 Total 2016 Q1 2017 Q2 2017 Q3 2017 LTM 9/30/2017
(US$ in millions)
Net income attributable to Darling $64 $79 $29 $41 $102 $6 $9 $8 $63
Depreciation and amortization 270 270 71 77 290 71 73 77 299
Interest expense 135 105 24 22 94 22 22 23 89
Income tax expense / (benefit) 13 13 (1) 6 15 2 8 6 22
Foreign currency loss / (gain) 14 5 (0) (0) 2 0 2 2 4
Other expense, net (0) 7 2 (2) 4 1 3 1 3
Equity in net (income) of unconsolidated subsidiaries (66) (73) (18) (33) (70) (1) (8) (8) (49)
Net income attributable to noncontrolling interests 4 7 0 1 5 2 1 1 5
Darling Adjusted EBITDA (Non-GAAP) $434 $413 $106 $113 $442 $103 $110 $111 $436
DGD Joint Venture Adjusted EBITDA (Darling's Share) $82 $89 $23 $37 $87 $5 $12 $11 $65

26
Date
Adjusted Segment EBITDA Reconciliation
Feed Segment Adjusted EBITDA Q3 2016 Q4 2016 Total 2016 Q1 2017 Q2 2017 Q3 2017 LTM
(US$ in millions)
Segment Income $35 $25 $116 $31 $39 $34 $130
Depreciation and amortization 44 49 179 44 44 47 184
Equity in Net Income of Unconsolidated Subsidiaries -- -- -- -- -- 1 1
Adjusted EBITDA (Non-GAAP) $79 $74 $295 $75 $83 $80 $312
Food Segment Adjusted EBITDA Q3 2016 Q4 2016 Total 2016 Q1 2017 Q2 2017 Q3 2017 LTM
(US$ in millions)
Segment Income $8 $12 $61 $14 $11 $15 $52
Depreciation and amortization 17 18 70 18 18 20 74
Equity in Net Income of Unconsolidated Subsidiaries -- -- -- -- -- -- --
Adjusted EBITDA (Non-GAAP) $25 $30 $131 $32 $29 $34 $125
Fuel Segment Adjusted EBITDA Q3 2016 Q4 2016 Total 2016 Q1 2017 Q2 2017 Q3 2017 LTM
(US$ in millions)
Segment Income $24 $43 $99 $4 $10 $7 $65
Depreciation and amortization 7 8 29 7 8 8 30
Equity in Net Income of Unconsolidated Subsidiaries 18 33 70 1 8 7 48
Adjusted EBITDA (Non-GAAP) $13 $18 $58 $10 $10 $8 $46

27
Date
DGD EBITDA Reconciliation
DGD Adjusted EBITDA Total 2014 Total 2015 Q3 2016 Q4 2016 Total 2016 Q1 2017 Q2 2017 Q3 2017 LTM
(US$ in millions)
Net Income $128 $144 $36 $65 $140 $1 $16 $14 $97
Depreciation and amortization $18 $20 7 7 28 8 8 7 30
Other (income) -- -- -- -- (1) -- -- -- (1)
Interest and debt expense, net $18 $14 1 1 7 1 1 -- 4
Adjusted EBITDA (Non-GAAP) $163 $177 $45 $73 $174 $10 $25 $21 $129

28
Date
DGD Provides a “hedge” on Commodity Exposure of DAR’s U.S. Fats
o DAR collects approximately 1 billion pounds of used cooking oil annually
o Yielding nearly 700 million pounds of finished product to market
o Approximately 35% is under shared risk formula pricing
o The balance has commodity optionality or market risk
$16.5 $81.6 $88.5 $87.2
-$12.3-$25.3
-$70.6 -$61.6
-$80
-$60
-$40
-$20
$0
$20
$40
$60
$80
$100
2013 20152014
2012YG/UCO
Price$37.31/cwt
2013YG/UCO
Price$34.57/cwt
2014YG/UCO
Price$28.95/cwt
2015YG/UCO
Price$21.79/cwt
$.0274 x 4.55 mm= $(12.30)
$.1552 x 4.55 mm= $(70.61)
$.1354 x 4.55 mm= $(61.60)
Every penny of price movement = $4.55mm in Adj. EBITDA to feed segment
YG = Yellow Grease UCO = Used Cooking Oil cwt = 100 pounds
Pricing from The Jacobsen index
Compared to
Darling’s Share of Adj. EBITDA
DGD YG/UCO (each year compared to 2012 pricing)
2016
2016YG/UCO
Price$23.77/cwt
$.0562 x 4.55 mm= $(25.29)
* Note: Diamond Green Diesel startup was in July 2013
**


![AGRICULTURAL EXTENSION SERVICE ANNUAL REPORT 1 9 ‘2 … · Address m3.6.. mg No. nitial Final Total No. - Gain Ave Tota]. Total Feed Feed Profit Value of Hogs Trfeight Weight gain](https://img.pdfslide.us/doc/110x75/603aaa225491a046bc66e183/agricultural-extension-service-annual-report-1-9-a2-address-m36-mg-no-nitial.jpg)