Embed Size (px)
Citation preview

PAGE 0
November 2016Investor Presentation – March 2017
PAGE 1
Yatra Online, Inc. (“Yatra”) or any of their respective affiliates make no representation or warranty as to the accuracy or completeness of the information contained
in this presentation. The data contained herein is derived from various internal and external sources and is not intended to be all-inclusive or to contain all of the
information that a person may desire in considering an investment in Yatra. It is not intended to form the basis of any investment decision. Yatra or any of their
respective affiliates assume no obligation to update the information in this presentation.
This presentation is for informational purposes only and does not constitute an offer to sell, a solicitation of any offer to buy, or a recommendation to purchase any
securities of or any of its affiliates (as such term is defined under the U.S. federal securities laws). The presentation shall not constitute a solicitation of a proxy,
consent or authorization with respect to any securities. This presentation shall also not constitute an offer to sell or the solicitation of an offer to buy any securities,
nor shall there be any sale of securities in any jurisdictions in which such offer, solicitation or sale would be unlawful prior to registration or qualification under the
securities laws of any such jurisdiction. No offering of securities shall be made except by means of a prospectus meeting the requirements of Section 10 of the
Securities Act of 1933, as amended.
Forward-Looking Statements
The statements in this presentation that are not historical facts are “forward-looking statements” within the meaning of the safe harbor provisions of the United
States Private Securities Litigation Reform Act of 1995. Forward-looking statements may be identified by the use of words such as “anticipate”, “believe”, “expect”,
“estimate”, “project”, “budget”, “forecast”, “intend”, “plan”, “may”, “will”, “could”, “should”, “predicts”, “potential”, “continue”, and other similar expressions that predict
or indicate future events or trends or that are not statements of historical matters. Such forward-looking statements are based on current expectations, estimates
and projections about the industry and markets in which Yatra operates. Yatra’s beliefs and assumptions are made by its management and are not predictions or
guarantees of actual performance. Accordingly, actual results and performance may materially differ from results or performance expressed or implied by the
forward-looking statements. No representation is made as to the reasonableness of the assumptions made within or the accuracy or completeness of any forward-
looking statements or other information contained herein. Factors that could cause future results and performance to differ from the forward-looking statements
include but are not limited to: (1) Yatra’s history of operating losses; (2) competition in the Indian travel industry; (3) declines or disruptions in the Indian economy;
(4) risks relating to any unforeseen liabilities of Yatra; (5) future capital expenditures, expenses, revenues, earnings, synergies, economic performance,
indebtedness, financial condition, losses and future prospects; businesses and management strategies and the expansion and growth of the operations of Yatra;
(6) the limited liquidity and trading of Yatra’s securities; (7) changes in applicable laws or regulations; (8) the possibility that Yatra may be adversely affected by
other economic, business, and/or competitive factors; and (9) other risks and uncertainties indicated from time to time in Yatra’s filings with the Securities and
Exchange Commission (the “SEC”).
Yatra cautions that the foregoing list of factors is not exclusive. Additional information concerning these and other risk factors is contained in Yatra’s most recent
filings with the SEC. All subsequent written and oral forward looking statements or other matters are expressly qualified in their entirety by the cautionary
statements above. Yatra cautions readers not to place undue reliance upon forward looking statements, which speak only as of the date made. Yatra undertakes
no obligation to update or revise any forward-looking statements, whether as a result of new information, future events or otherwise, except as required by law.
Industry and Market Data
Industry and market data used in this presentation have been obtained from industry publications and sources as well as from research reports prepared for other
purposes. Yatra has not independently verified the data obtained from these sources and cannot assure you of the data’s accuracy or completeness.
Other
All years are calendar years unless otherwise noted as “fiscal year” or “FY”.
Disclosure
PAGE 2
Yatra, India’s second largest online travel agent (“OTA”)2, is well-positioned to benefit from strong
macroeconomic trends Yatra had approximately 4.9 million cumulative customers as of Dec 31, 2016 and Gross Bookings of INR 49.5 Billion during 9M
fiscal year 20173,5
Yatra’s multi-channel platform is a competitive advantage in the consolidating Indian market Yatra’s channels for customer acquisition are consumers (B2C), corporates (B2E), and travel agents (B2B2C)
Yatra has hard-to-duplicate infrastructure including the largest Indian hotel network (62,000+) and more than 16,000 travel agents
in over 1,100 cities and towns
As the online Indian travel market enters a phase of consolidation, Yatra is well positioned to maintain and grow market share
Yatra’s installed mobile base of more than 8 million downloads is positioned to grow up to 5x Reliance, Yatra’s strategic investor and partner, has agreed to pre-load the Yatra app on 35 million new Jio phones over the
course of the next 36 months
Yatra grew Revenue Less Service Cost by a CAGR of 25% from FY 2014 – FY 20163
Growth rate expected to accelerate with the help of capital raised during the listing process
Yatra projects positive Adjusted EBITDA in FYE March 2019 and expects to meet its current growth and profit
goals without needing additional funding
Investment thesis
India is the fastest growing major economy, travel spending is growing faster than the
economy, and online travel booking is taking an increasing share of that market1
1. Source: Phocuswright
2. Management estimates based on publicly available company filings
3. Refer to Appendix for definitions and reconciliations of non-IFRS measures; FY2014 Revenue Less Service Cost amounts have been derived from unaudited financials of various subsidiaries prepared in
accordance with local GAAPs i.e. Indian GAAP as well as Singapore Financial Reporting Standard and aggregated together. FY2014 amounts should not be interpreted as comparable to FY2015 and FY2016 as
FY2014 has been prepared under a different basis of accounting. The Company adopted IFRS as issued by IASB from FY2015
4. These estimates are based on management assumptions and projections and are not predictions or guarantees of actual performance; actual results and performance may materially differ from these estimates
5. 9M Gross Bookings estimates basis unaudited financial results
PAGE 3
1. Management estimates based on publicly available company filings
2. Refer to Appendix for definitions and reconciliations of non-IFRS measures
3. Assumes 66.33 INR per USD
4. FY2014 Revenue Less Service Cost amounts have been derived from unaudited financials of various subsidiaries prepared in accordance with local GAAPs i.e. Indian GAAP as well as Singapore Financial
Reporting Standard and aggregated together. FY2014 amounts should not be interpreted as comparable to FY2015 and FY2016 as FY2014 has been prepared under a different basis of accounting. The
Company adopted IFRS as issued by IASB from FY2015
5. Cumulative as of December 31, 2016; does not include data for B2B2C businesses
6. Data for the period Jan-Dec 2016 for flagship brand Yatra.com only and excludes data from B2E and B2B2C businesses
7. As of December 31, 2016
8. In Q3 FY17
9. 9M 2017 Gross Bookings and Revenue less service cost estimates basis unaudited financial results
10. Data for the period Apr-Dec’16
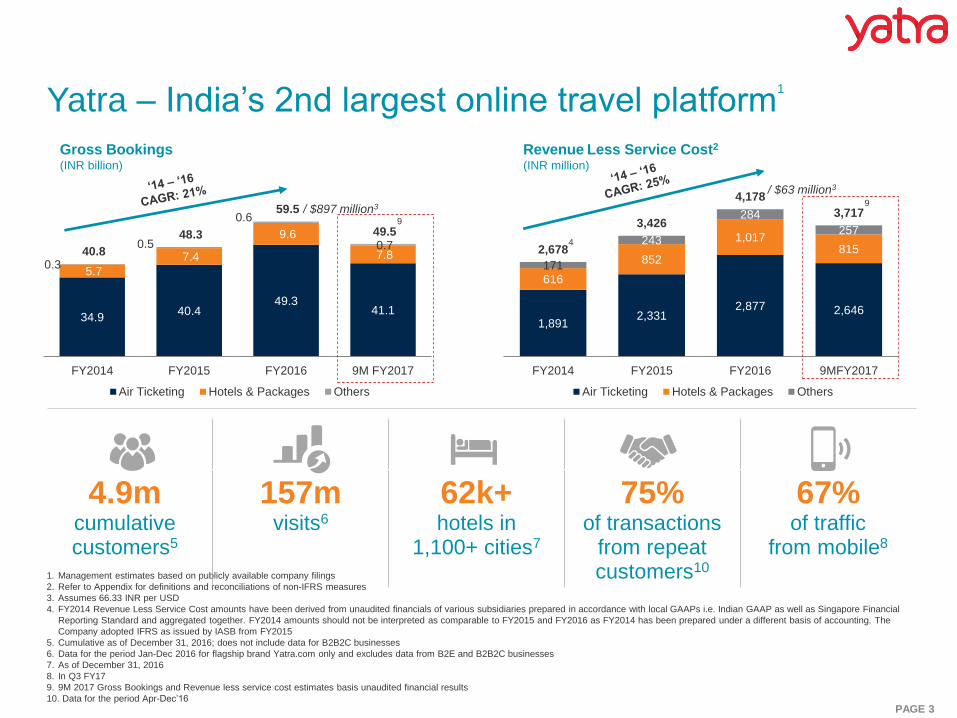
4.9mcumulativecustomers5
157mvisits6
62k+hotels in
1,100+ cities7
75%of transactions
from repeat customers10
67%of traffic
from mobile8
Yatra – India’s 2nd largest online travel platform1
34.940.4
49.341.1
5.7
7.4
9.6
7.8 0.3
0.5
0.6
0.7 40.8
48.3
59.5
49.5
FY2014 FY2015 FY2016 9M FY2017
Air Ticketing Hotels & Packages Others
Gross Bookings(INR billion)
Revenue Less Service Cost2
(INR million)
1,8912,331
2,877 2,646
616
852
1,017815
171
243
284
257
2,678
3,426
4,178
3,717
FY2014 FY2015 FY2016 9MFY2017
Air Ticketing Hotels & Packages Others
/ $897 million3
/ $63 million3
4
9
9

Industry Overview
PAGE 5
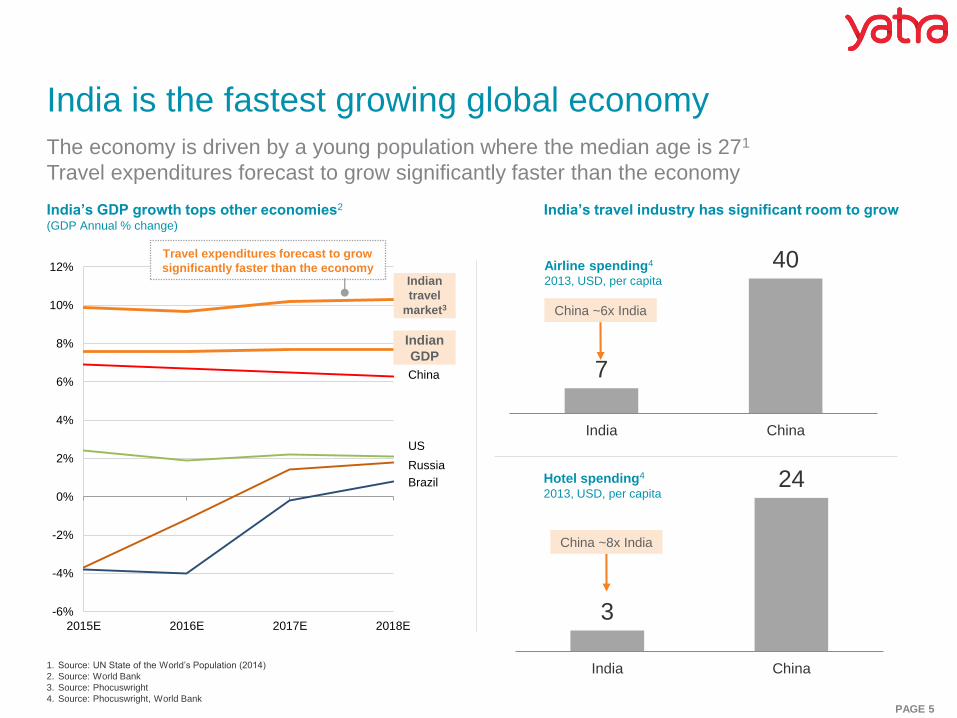
The economy is driven by a young population where the median age is 271
Travel expenditures forecast to grow significantly faster than the economy
1. Source: UN State of the World’s Population (2014)
2. Source: World Bank
3. Source: Phocuswright
4. Source: Phocuswright, World Bank
-6%
-4%
-2%
0%
2%
4%
6%
8%
10%
12%
2015E 2016E 2017E 2018E
Russia
US
China
Brazil
India’s travel industry has significant room to growIndia’s GDP growth tops other economies2
(GDP Annual % change)
India is the fastest growing global economy
Travel expenditures forecast to grow
significantly faster than the economy
Indian
GDP
Indian
travel
market3
7
40
India China
3
24
India China
China ~8x India
China ~6x India
Hotel spending4
2013, USD, per capita
Airline spending4
2013, USD, per capita
PAGE 6
5%
13%
16%
10%
15%
24%
7%
10%
20%
2013-14 2014-15 2015-16
Major Metro Airports
Secondary Airports
Smaller Regional Airports
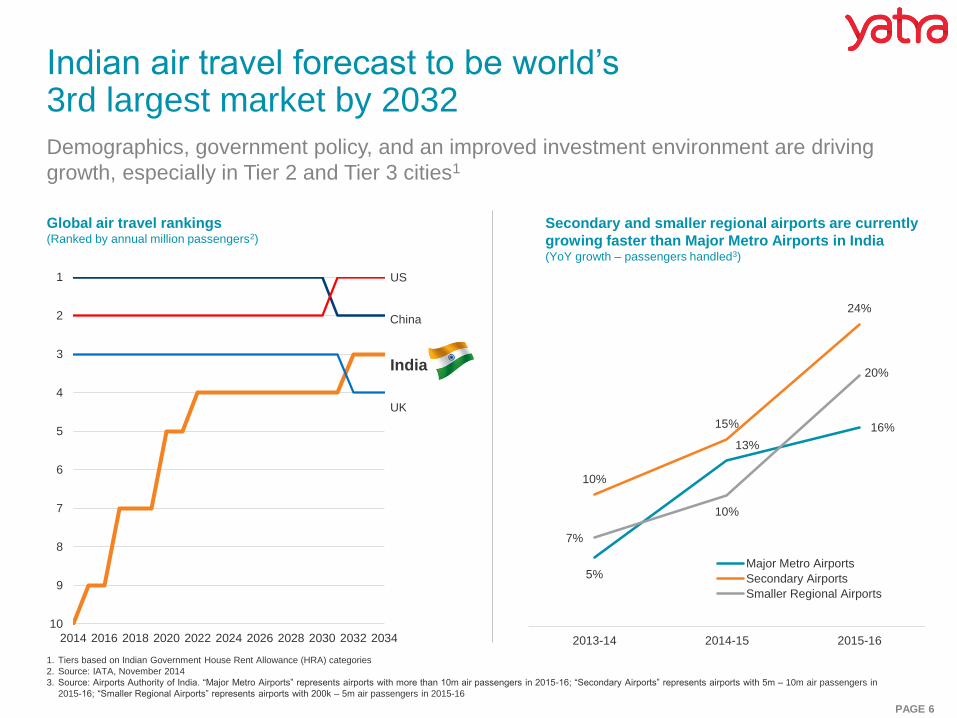
Demographics, government policy, and an improved investment environment are driving
growth, especially in Tier 2 and Tier 3 cities1
1. Tiers based on Indian Government House Rent Allowance (HRA) categories
2. Source: IATA, November 2014
3. Source: Airports Authority of India. “Major Metro Airports” represents airports with more than 10m air passengers in 2015-16; “Secondary Airports” represents airports with 5m – 10m air passengers in
2015-16; “Smaller Regional Airports” represents airports with 200k – 5m air passengers in 2015-16
Secondary and smaller regional airports are currently
growing faster than Major Metro Airports in India(YoY growth – passengers handled3)
Global air travel rankings(Ranked by annual million passengers2)
Indian air travel forecast to be world’s3rd largest market by 2032
1
2
3
4
5
6
7
8
9
10
2014 2016 2018 2020 2022 2024 2026 2028 2030 2032 2034
China
US
India
UK
PAGE 7
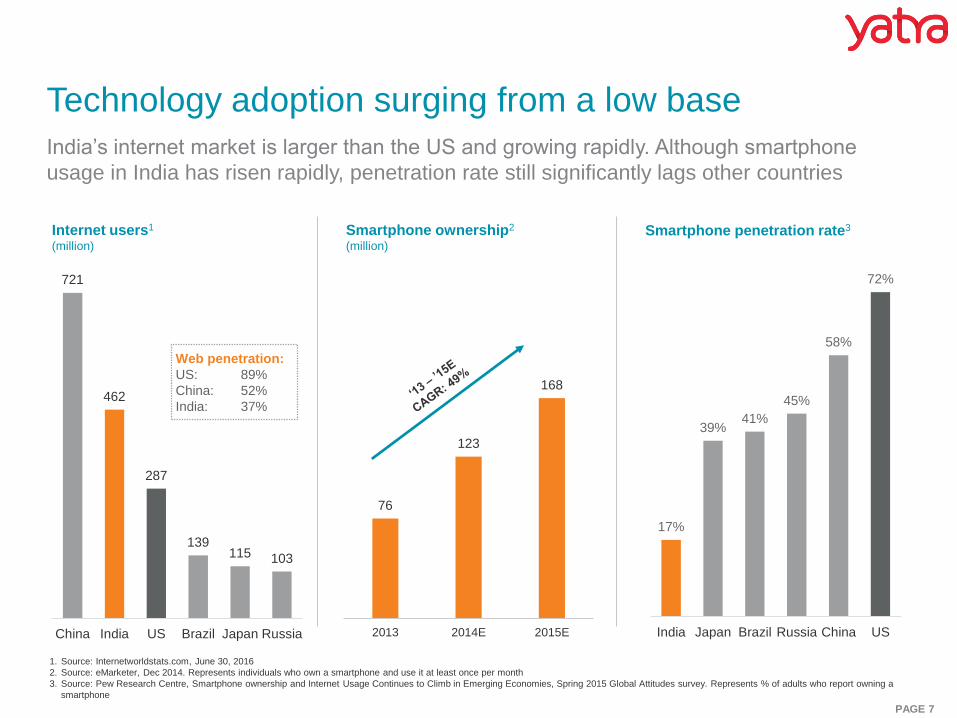
17%
39%41%
45%
58%
72%
India Japan Brazil Russia China US
721
462
287
139115 103
China India US Brazil Japan Russia
Smartphone penetration rate3Internet users1
(million)
Technology adoption surging from a low base
Web penetration:
US: 89%
China: 52%
India: 37%
Smartphone ownership2
(million)
76
123
168
2013 2014E 2015E
1. Source: Internetworldstats.com, June 30, 2016
2. Source: eMarketer, Dec 2014. Represents individuals who own a smartphone and use it at least once per month
3. Source: Pew Research Centre, Smartphone ownership and Internet Usage Continues to Climb in Emerging Economies, Spring 2015 Global Attitudes survey. Represents % of adults who report owning a
smartphone
India’s internet market is larger than the US and growing rapidly. Although smartphone
usage in India has risen rapidly, penetration rate still significantly lags other countries
PAGE 8
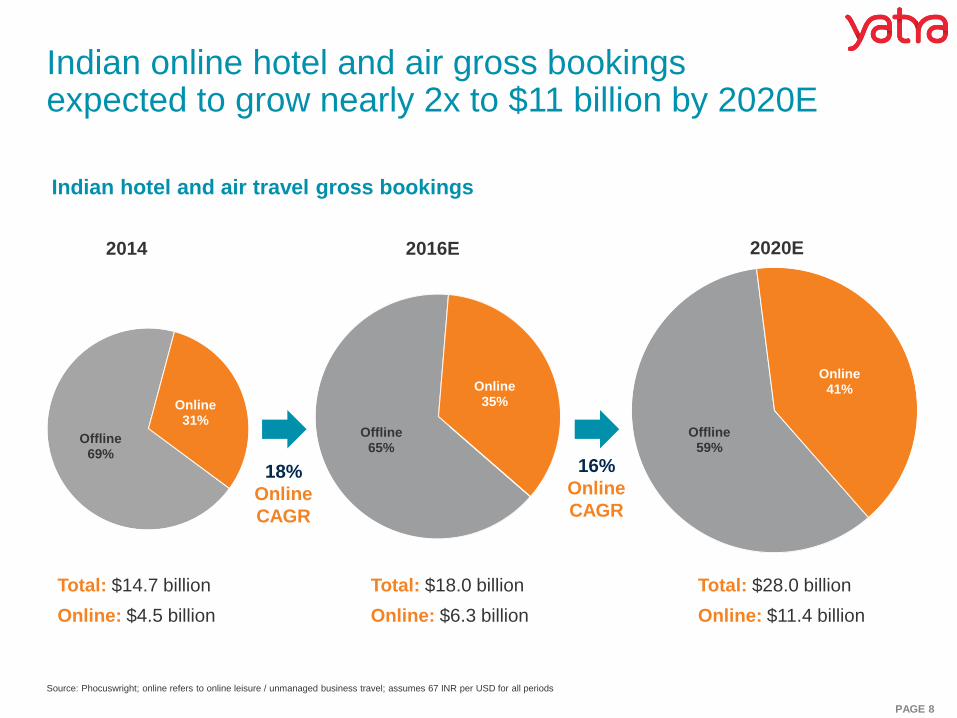
Offline59%
Online41%
Offline65%
Online35%
Source: Phocuswright; online refers to online leisure / unmanaged business travel; assumes 67 INR per USD for all periods
Indian online hotel and air gross bookingsexpected to grow nearly 2x to $11 billion by 2020E
18%
Online
CAGR
16%
Online
CAGR
Offline69%
Online31%
2014 2020E
Total: $14.7 billion
Online: $4.5 billion
Total: $18.0 billion
Online: $6.3 billion
Total: $28.0 billion
Online: $11.4 billion
2016E
Indian hotel and air travel gross bookings
PAGE 9
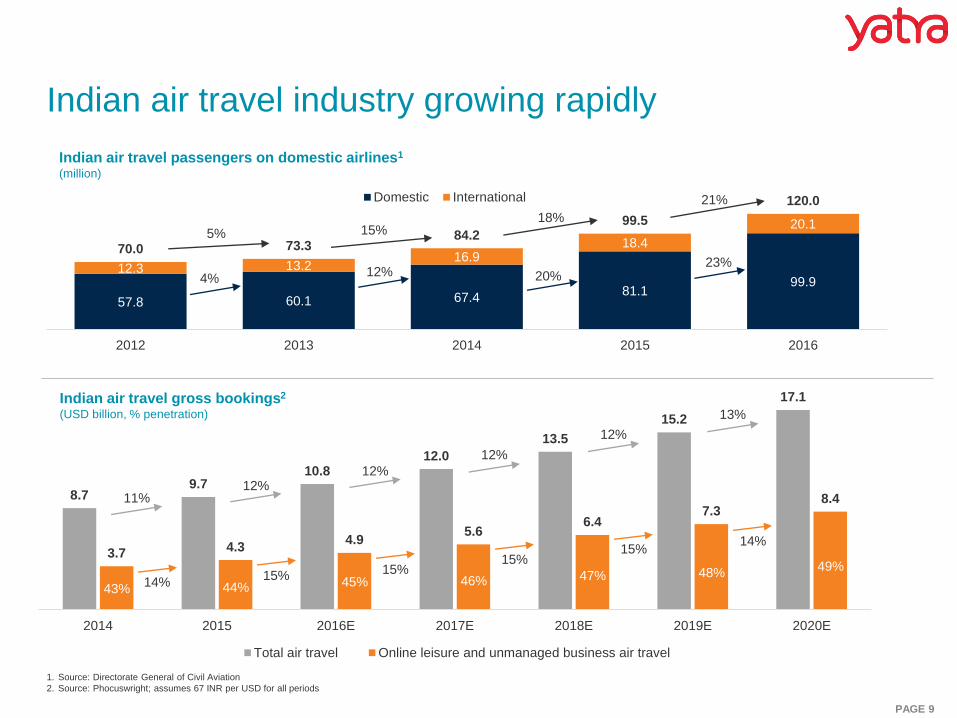
8.79.7
10.812.0
13.5
15.2
17.1
3.7 4.34.9
5.66.4
7.38.4
2014 2015 2016E 2017E 2018E 2019E 2020E
Total air travel Online leisure and unmanaged business air travel
Indian air travel gross bookings2
(USD billion, % penetration)
57.8 60.1 67.481.1
99.912.3 13.2
16.918.4
20.1
70.0 73.384.2
99.5
120.0
2012 2013 2014 2015 2016
Domestic International
Indian air travel passengers on domestic airlines1
(million)
Indian air travel industry growing rapidly
1. Source: Directorate General of Civil Aviation
2. Source: Phocuswright; assumes 67 INR per USD for all periods
14%15% 15%
15%15%
14%
11%12%
12%
12%
12%
13%
4%12% 20%
5% 15%18%
23%
21%
43% 44% 45% 46% 47% 48%49%
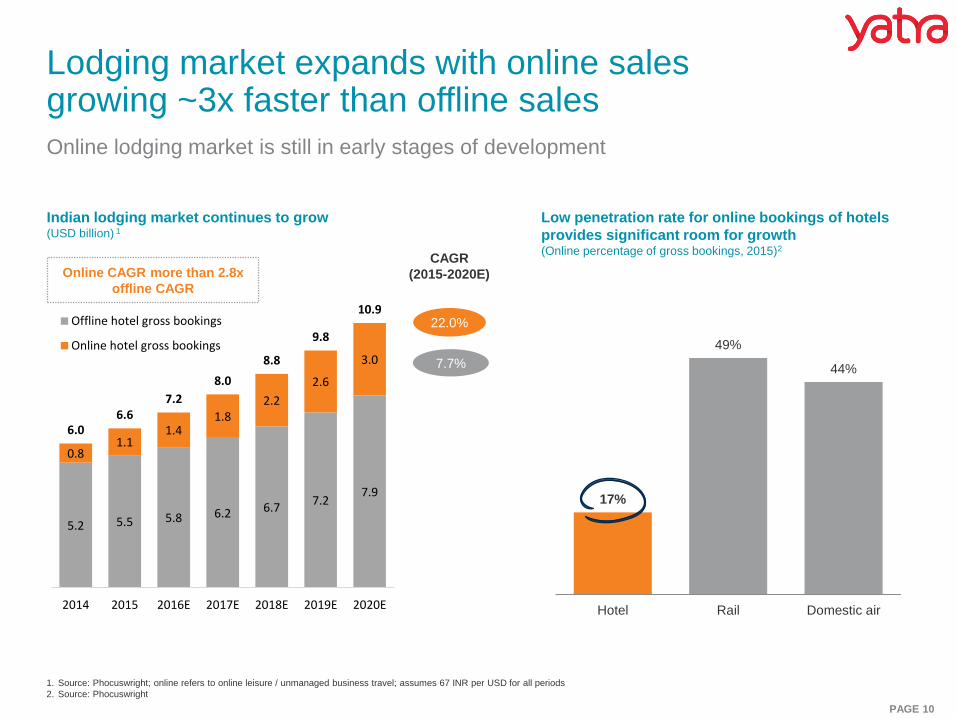
PAGE 10
Low penetration rate for online bookings of hotels
provides significant room for growth(Online percentage of gross bookings, 2015)2
Lodging market expands with online sales growing ~3x faster than offline sales
17%
49%
44%
Hotel Rail Domestic air
Indian lodging market continues to grow(USD billion) 1
Online CAGR more than 2.8x
offline CAGR
CAGR
(2015-2020E)
1. Source: Phocuswright; online refers to online leisure / unmanaged business travel; assumes 67 INR per USD for all periods
2. Source: Phocuswright
7.7%
22.0%
5.2 5.5 5.8 6.2 6.77.2
7.9
0.81.1
1.41.8
2.2
2.6
3.0
6.06.6
7.2
8.0
8.8
9.8
10.9
2014 2015 2016E 2017E 2018E 2019E 2020E
Offline hotel gross bookings
Online hotel gross bookings
Online lodging market is still in early stages of development
PAGE 11
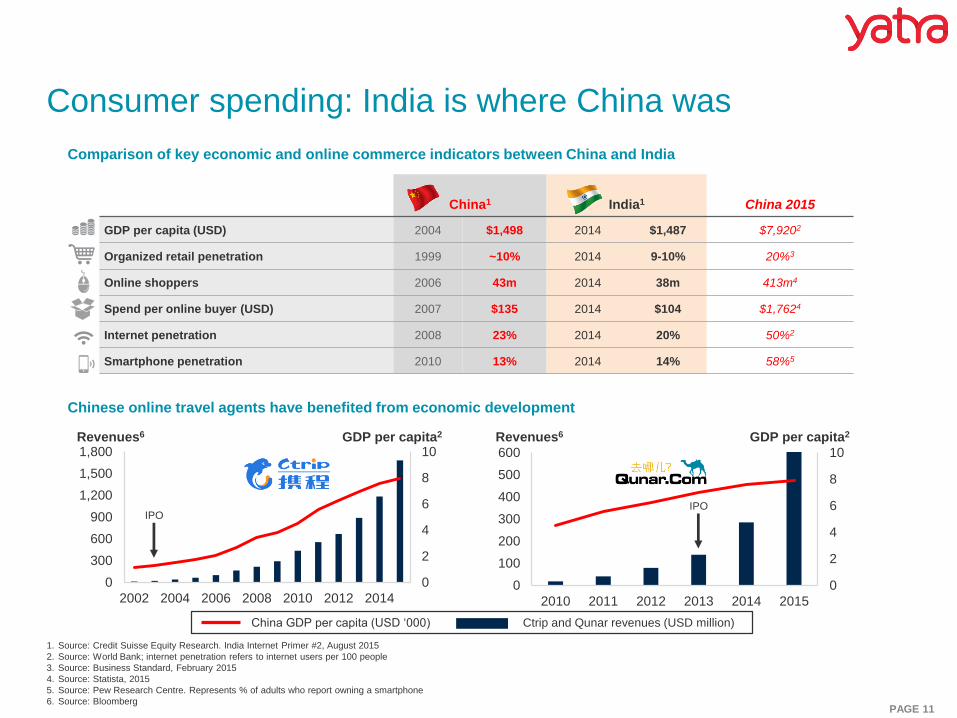
Consumer spending: India is where China was
Chinese online travel agents have benefited from economic development
China1 India1 China 2015
GDP per capita (USD) 2004 $1,498 2014 $1,487 $7,9202
Organized retail penetration 1999 ~10% 2014 9-10% 20%3
Online shoppers 2006 43m 2014 38m 413m4
Spend per online buyer (USD) 2007 $135 2014 $104 $1,7624
Internet penetration 2008 23% 2014 20% 50%2
Smartphone penetration 2010 13% 2014 14% 58%5
0
2
4
6
8
10
2010 2011 2012 2013 2014 2015
0
100
200
300
400
500
600
Comparison of key economic and online commerce indicators between China and India
0
2
4
6
8
10
2002 2004 2006 2008 2010 2012 2014
0
300
600
900
1,200
1,500
1,800
1. Source: Credit Suisse Equity Research. India Internet Primer #2, August 2015
2. Source: World Bank; internet penetration refers to internet users per 100 people
3. Source: Business Standard, February 2015
4. Source: Statista, 2015
5. Source: Pew Research Centre. Represents % of adults who report owning a smartphone
6. Source: Bloomberg
IPOIPO
Revenues6 GDP per capita2 Revenues6 GDP per capita2
China GDP per capita (USD ‘000) Ctrip and Qunar revenues (USD million)

Yatra Business Overview
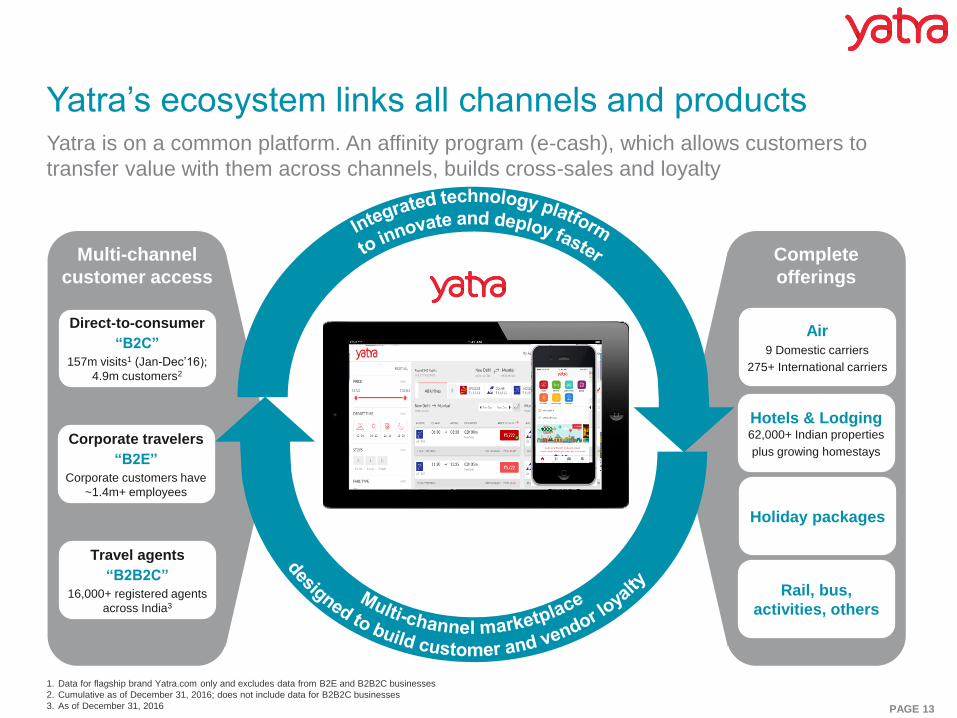
PAGE 13
Complete
offerings
Air9 Domestic carriers
275+ International carriers
Hotels & Lodging62,000+ Indian properties
plus growing homestays
Holiday packages
Rail, bus,
activities, others
Multi-channel
customer access
Direct-to-consumer
“B2C”
157m visits1 (Jan-Dec’16);
4.9m customers2
Corporate travelers
“B2E”
Corporate customers have
~1.4m+ employees
Travel agents
“B2B2C”
16,000+ registered agents
across India3
Yatra’s ecosystem links all channels and productsYatra is on a common platform. An affinity program (e-cash), which allows customers to
transfer value with them across channels, builds cross-sales and loyalty
1. Data for flagship brand Yatra.com only and excludes data from B2E and B2B2C businesses
2. Cumulative as of December 31, 2016; does not include data for B2B2C businesses
3. As of December 31, 2016
PAGE 14
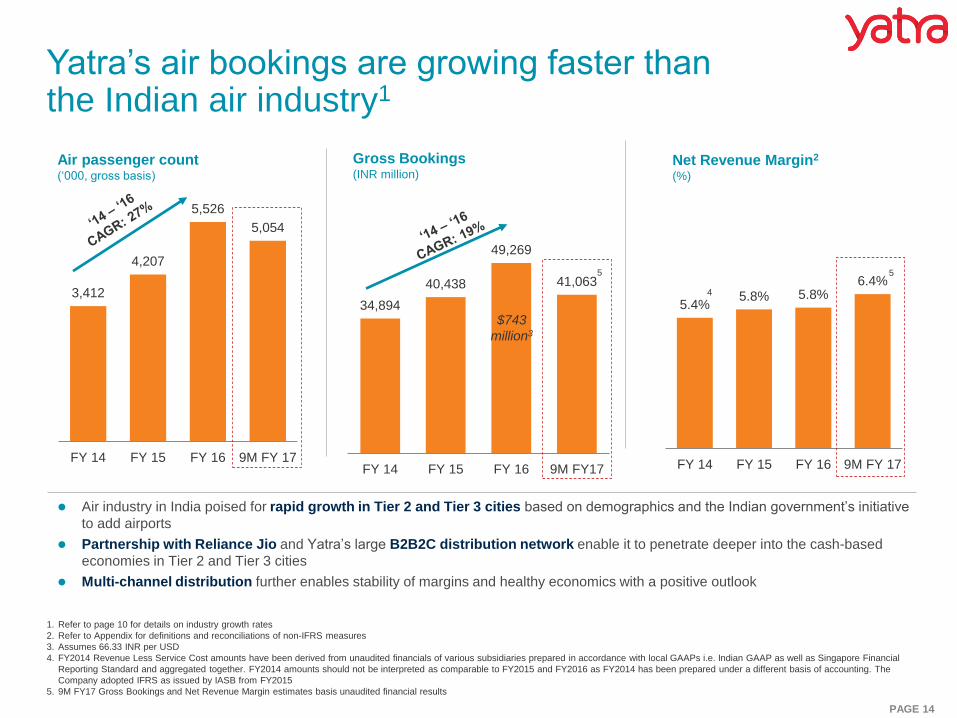
3,412
4,207
5,526
5,054
FY 14 FY 15 FY 16 9M FY 17
Air passenger count(‘000, gross basis)
Air industry in India poised for rapid growth in Tier 2 and Tier 3 cities based on demographics and the Indian government’s initiative
to add airports
Partnership with Reliance Jio and Yatra’s large B2B2C distribution network enable it to penetrate deeper into the cash-based
economies in Tier 2 and Tier 3 cities
Multi-channel distribution further enables stability of margins and healthy economics with a positive outlook
Yatra’s air bookings are growing faster than the Indian air industry1
1. Refer to page 10 for details on industry growth rates
2. Refer to Appendix for definitions and reconciliations of non-IFRS measures
3. Assumes 66.33 INR per USD
4. FY2014 Revenue Less Service Cost amounts have been derived from unaudited financials of various subsidiaries prepared in accordance with local GAAPs i.e. Indian GAAP as well as Singapore Financial
Reporting Standard and aggregated together. FY2014 amounts should not be interpreted as comparable to FY2015 and FY2016 as FY2014 has been prepared under a different basis of accounting. The
Company adopted IFRS as issued by IASB from FY2015
5. 9M FY17 Gross Bookings and Net Revenue Margin estimates basis unaudited financial results
34,894
40,438
49,269
41,063
FY 14 FY 15 FY 16 9M FY17
5.4%5.8% 5.8%
6.4%
FY 14 FY 15 FY 16 9M FY 17
Gross Bookings(INR million)
Net Revenue Margin2
(%)
$743
million3
4
5 5
PAGE 15
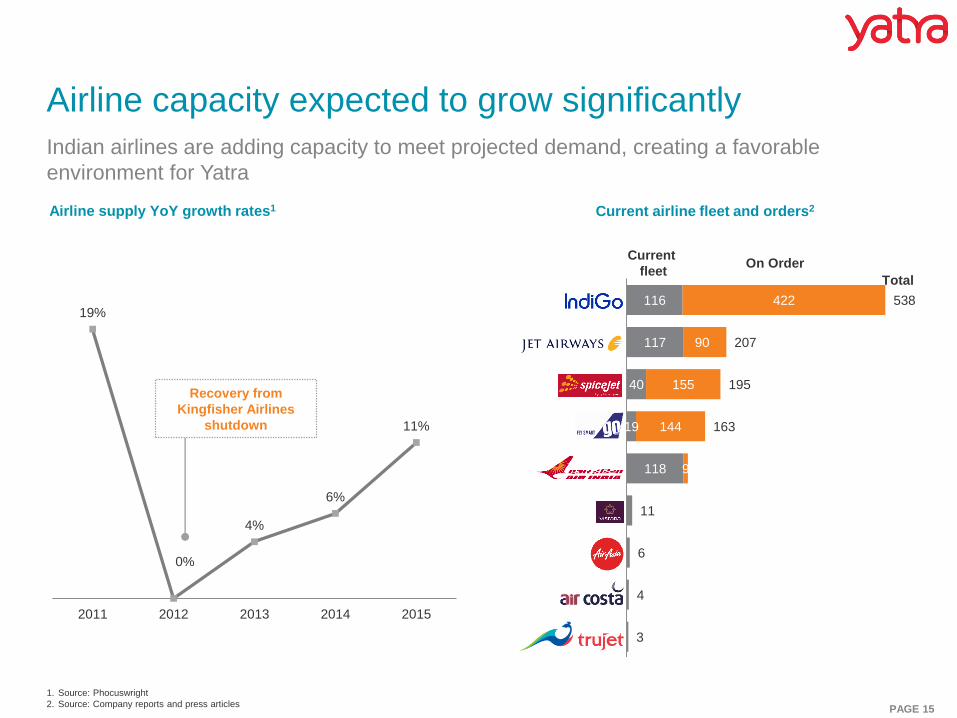
Airline capacity expected to grow significantly
Indian airlines are adding capacity to meet projected demand, creating a favorable
environment for Yatra
116
117
40
19
118
422
90
155
144
9
538
207
195
163
11
6
4
3
Current
fleetOn Order
Total
Current airline fleet and orders2
1. Source: Phocuswright
2. Source: Company reports and press articles
19%
0%
4%
6%
11%
2011 2012 2013 2014 2015
Airline supply YoY growth rates1
Recovery from
Kingfisher Airlines
shutdown
PAGE 16
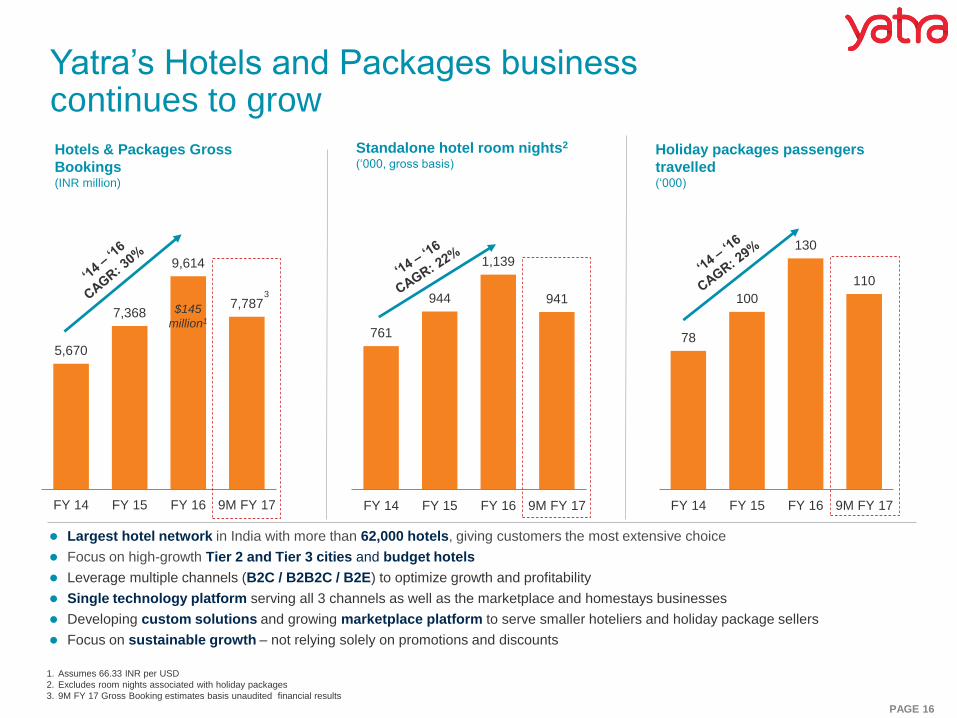
Yatra’s Hotels and Packages business continues to grow
761
944
1,139
941
FY 14 FY 15 FY 16 9M FY 17
78
100
130
110
FY 14 FY 15 FY 16 9M FY 17
Standalone hotel room nights2
(‘000, gross basis)
Largest hotel network in India with more than 62,000 hotels, giving customers the most extensive choice
Focus on high-growth Tier 2 and Tier 3 cities and budget hotels
Leverage multiple channels (B2C / B2B2C / B2E) to optimize growth and profitability
Single technology platform serving all 3 channels as well as the marketplace and homestays businesses
Developing custom solutions and growing marketplace platform to serve smaller hoteliers and holiday package sellers
Focus on sustainable growth – not relying solely on promotions and discounts
Holiday packages passengers
travelled(‘000)
Hotels & Packages Gross
Bookings(INR million)
1. Assumes 66.33 INR per USD
2. Excludes room nights associated with holiday packages
3. 9M FY 17 Gross Booking estimates basis unaudited financial results
5,670
7,368
9,614
7,787
FY 14 FY 15 FY 16 9M FY 17
$145
million1
3
PAGE 17
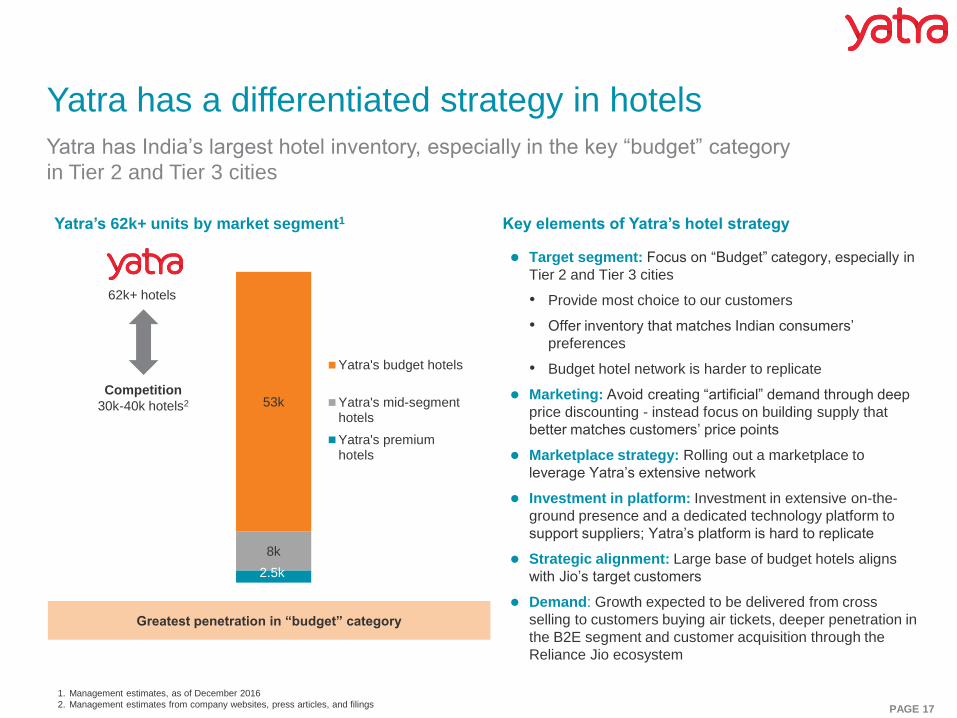
Yatra has a differentiated strategy in hotels
Yatra has India’s largest hotel inventory, especially in the key “budget” category
in Tier 2 and Tier 3 cities
1. Management estimates, as of December 2016
2. Management estimates from company websites, press articles, and filings
Yatra’s 62k+ units by market segment1
2.5k
8k
53k
Yatra's budget hotels
Yatra's mid-segmenthotels
Yatra's premiumhotels
Competition
30k-40k hotels2
Target segment: Focus on “Budget” category, especially in
Tier 2 and Tier 3 cities
• Provide most choice to our customers
• Offer inventory that matches Indian consumers’
preferences
• Budget hotel network is harder to replicate
Marketing: Avoid creating “artificial” demand through deep
price discounting - instead focus on building supply that
better matches customers’ price points
Marketplace strategy: Rolling out a marketplace to
leverage Yatra’s extensive network
Investment in platform: Investment in extensive on-the-
ground presence and a dedicated technology platform to
support suppliers; Yatra’s platform is hard to replicate
Strategic alignment: Large base of budget hotels aligns
with Jio’s target customers
Demand: Growth expected to be delivered from cross
selling to customers buying air tickets, deeper penetration in
the B2E segment and customer acquisition through the
Reliance Jio ecosystem
Key elements of Yatra’s hotel strategy
Greatest penetration in “budget” category
62k+ hotels
PAGE 18
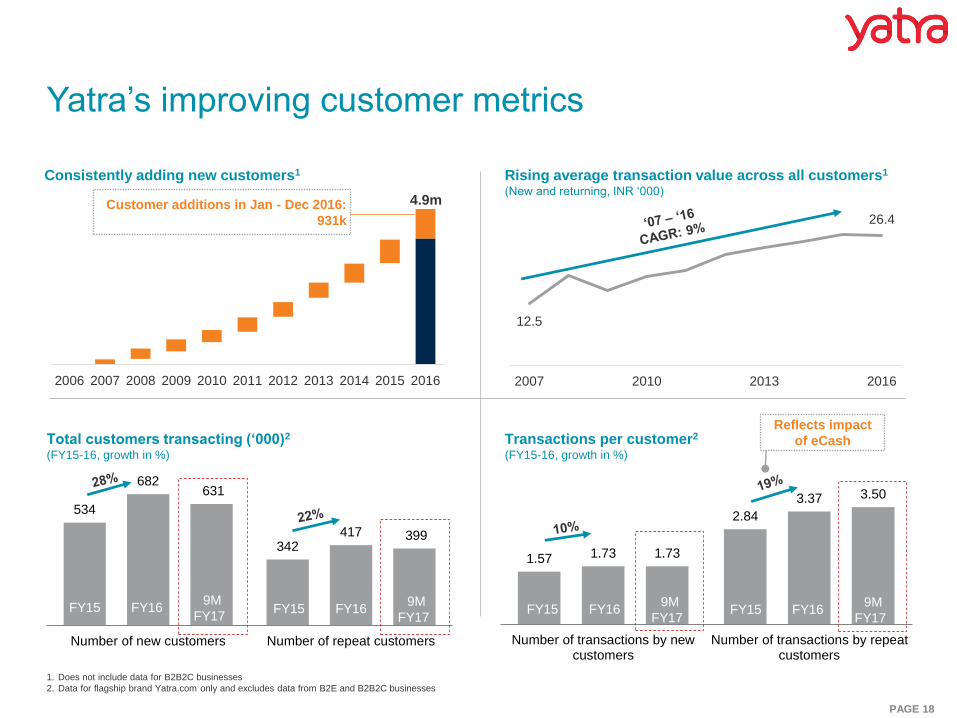
Total customers transacting (‘000)2
(FY15-16, growth in %)
Transactions per customer2
(FY15-16, growth in %)
534
342
682
417
631
399
Number of new customers Number of repeat customers
1.57
2.84
1.73
3.37
1.73
3.50
Number of transactions by newcustomers
Number of transactions by repeatcustomers
Consistently adding new customers1 Rising average transaction value across all customers1
(New and returning, INR ‘000)
12.5
26.4
2007 2010 2013 2016
Yatra’s improving customer metrics
FY15 FY16
Reflects impact
of eCash
1. Does not include data for B2B2C businesses
2. Data for flagship brand Yatra.com only and excludes data from B2E and B2B2C businesses
2006 2007 2008 2009 2010 2011 2012 2013 2014 2015 2016
4.9mCustomer additions in Jan - Dec 2016:
931k
9M
FY17FY15 FY16
9M
FY17FY15 FY16
9M
FY17FY15 FY16
9M
FY17
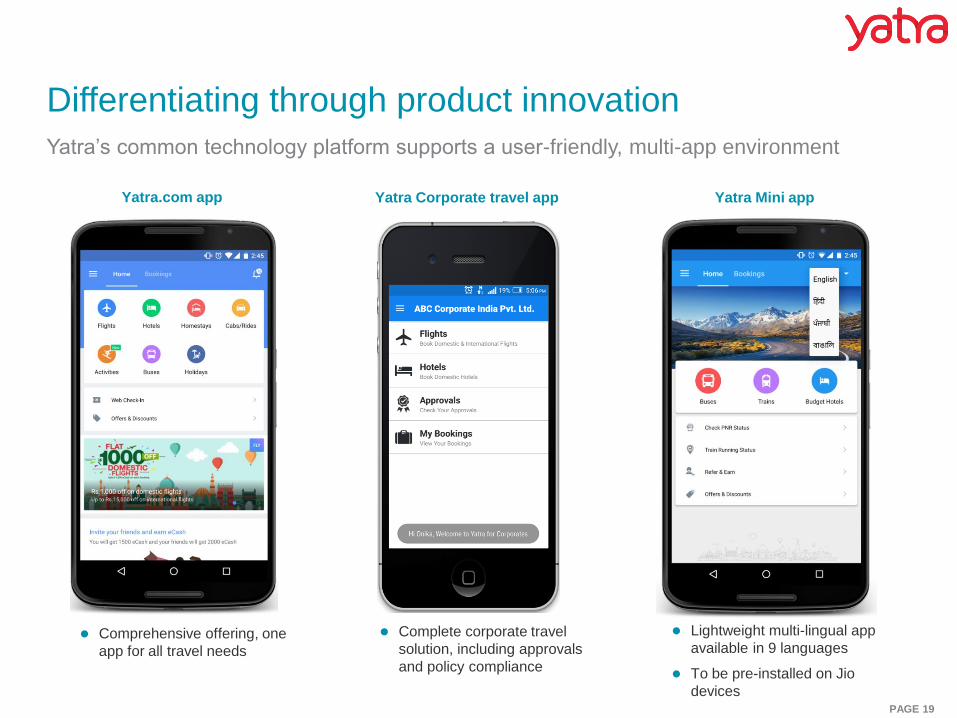
PAGE 19
Yatra Mini app
Differentiating through product innovation
Comprehensive offering, one
app for all travel needs
Complete corporate travel
solution, including approvals
and policy compliance
Lightweight multi-lingual app
available in 9 languages
To be pre-installed on Jio
devices
Yatra Corporate travel appYatra.com app
Yatra’s common technology platform supports a user-friendly, multi-app environment
PAGE 20
67%
33%
0%
20%
40%
60%
80%
100%
Jan-14 Jul-14 Jan-15 Jul-15 Jan-16 Jul-16
Mobile Desktop
Dec-16
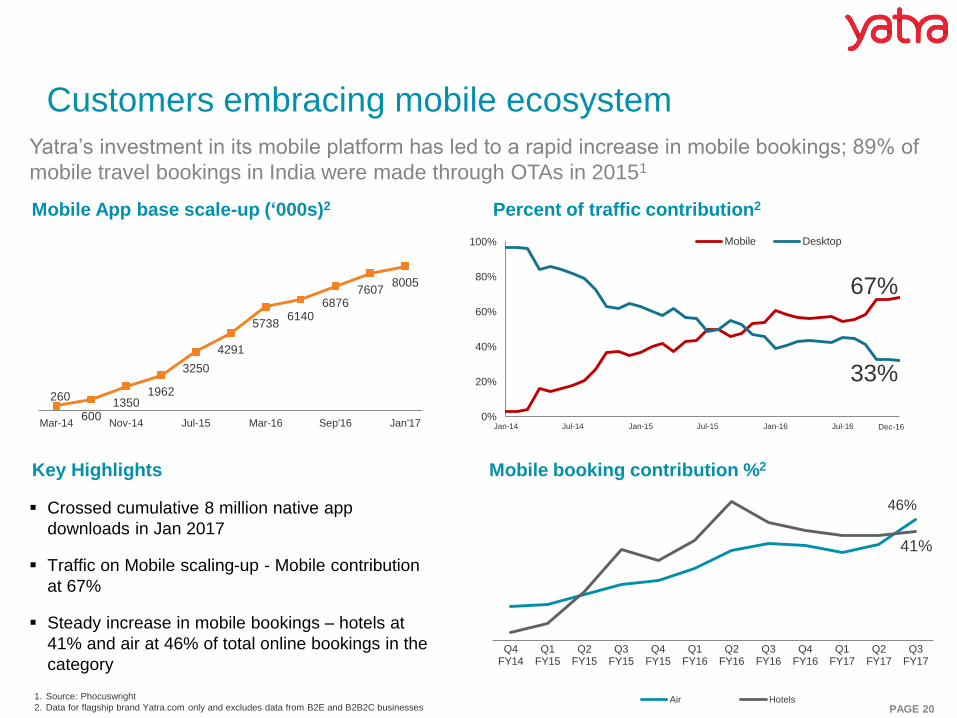
Customers embracing mobile ecosystem
Yatra’s investment in its mobile platform has led to a rapid increase in mobile bookings; 89% of
mobile travel bookings in India were made through OTAs in 20151
46%
41%
Q4FY14
Q1FY15
Q2FY15
Q3FY15
Q4FY15
Q1FY16
Q2FY16
Q3FY16
Q4FY16
Q1FY17
Q2FY17
Q3FY17
Air Hotels
260
6001350
1962
3250
4291
57386140
68767607
8005
Mar-14 Nov-14 Jul-15 Mar-16 Sep'16 Jan'17
Mobile booking contribution %2
Mobile App base scale-up (‘000s)2 Percent of traffic contribution2
Crossed cumulative 8 million native app
downloads in Jan 2017
Traffic on Mobile scaling-up - Mobile contribution
at 67%
Steady increase in mobile bookings – hotels at
41% and air at 46% of total online bookings in the
category
Key Highlights
1. Source: Phocuswright
2. Data for flagship brand Yatra.com only and excludes data from B2E and B2B2C businesses
PAGE 21
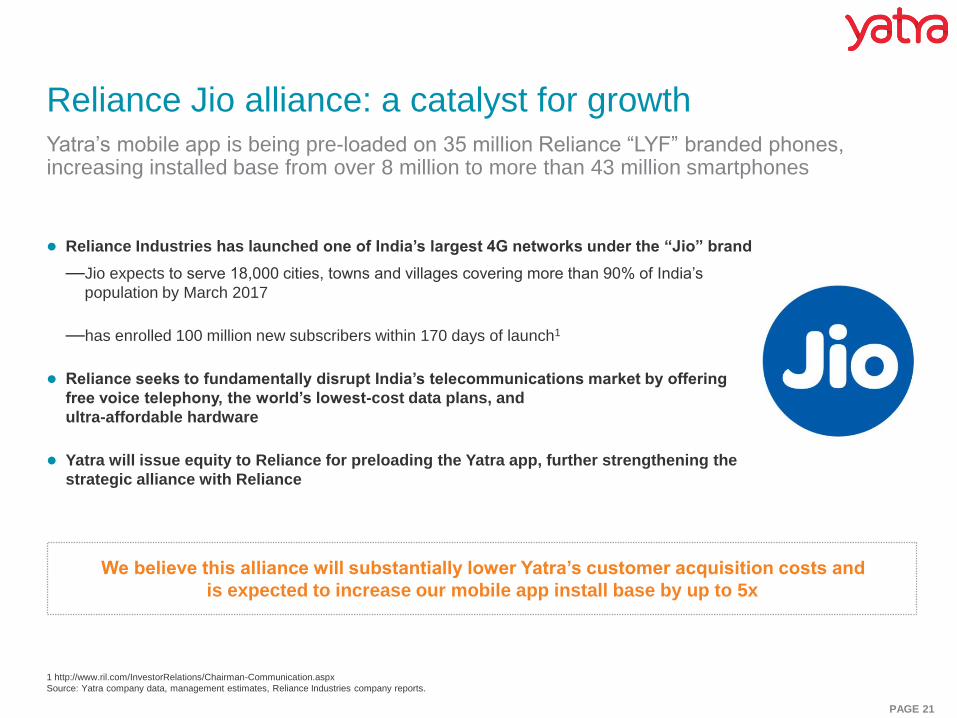
1 http://www.ril.com/InvestorRelations/Chairman-Communication.aspx
Source: Yatra company data, management estimates, Reliance Industries company reports.
Reliance Jio alliance: a catalyst for growth
Reliance Industries has launched one of India’s largest 4G networks under the “Jio” brand
—Jio expects to serve 18,000 cities, towns and villages covering more than 90% of India’s
population by March 2017
—has enrolled 100 million new subscribers within 170 days of launch1
Reliance seeks to fundamentally disrupt India’s telecommunications market by offering
free voice telephony, the world’s lowest-cost data plans, and
ultra-affordable hardware
Yatra will issue equity to Reliance for preloading the Yatra app, further strengthening the
strategic alliance with Reliance
We believe this alliance will substantially lower Yatra’s customer acquisition costs and
is expected to increase our mobile app install base by up to 5x
Yatra’s mobile app is being pre-loaded on 35 million Reliance “LYF” branded phones, increasing installed base from over 8 million to more than 43 million smartphones
PAGE 22
Focus on profitable growth and long-term sustainability
Focus on air business to drive new customer acquisitions and further profitability
Create an open market platform to become one stop-shop solution for all travel needs
Focus on cross-selling of hotels and packages to the customer base
Continue to build out the hotel network and homestay platform
Leverage multi-channel distribution platform
Continue to build brand loyalty, particularly in under-penetrated Tier 2 and Tier 3 cities
Use unified technology platform to efficiently roll-out new products
Yatra’s mission: “Create happy travelers”
Yatra’s strategic priorities
TM
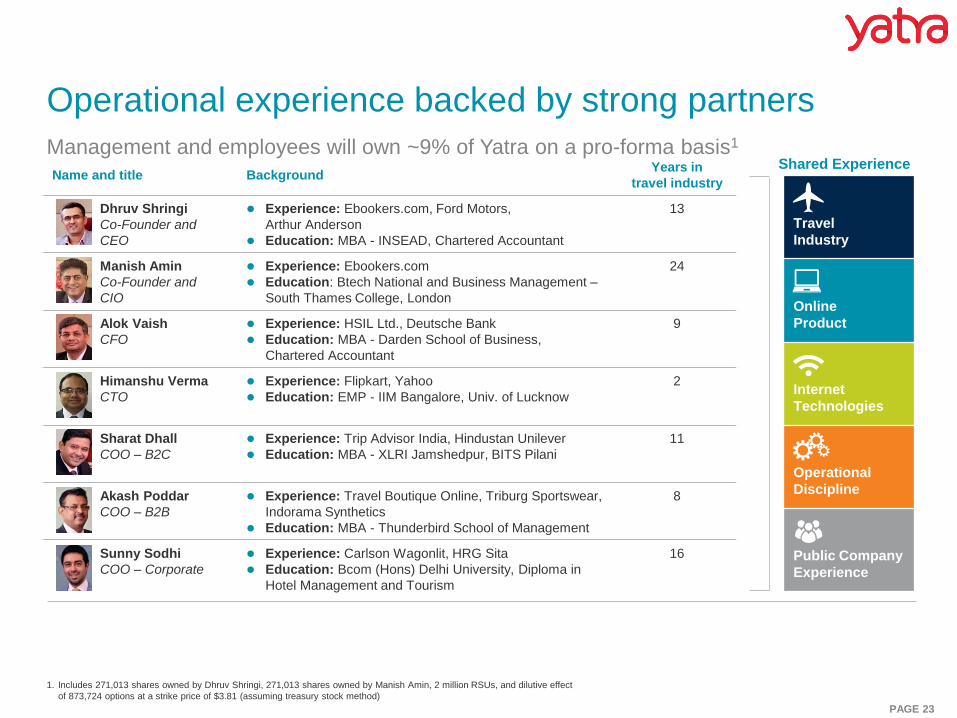
PAGE 23
Name and title BackgroundYears in
travel industry
Dhruv Shringi
Co-Founder and
CEO
Experience: Ebookers.com, Ford Motors,
Arthur Anderson
Education: MBA - INSEAD, Chartered Accountant
13
Manish Amin
Co-Founder and
CIO
Experience: Ebookers.com
Education: Btech National and Business Management –
South Thames College, London
24
Alok Vaish
CFO
Experience: HSIL Ltd., Deutsche Bank
Education: MBA - Darden School of Business,
Chartered Accountant
9
Himanshu Verma
CTO
Experience: Flipkart, Yahoo
Education: EMP - IIM Bangalore, Univ. of Lucknow
2
Sharat Dhall
COO – B2C
Experience: Trip Advisor India, Hindustan Unilever
Education: MBA - XLRI Jamshedpur, BITS Pilani
11
Akash Poddar
COO – B2B
Experience: Travel Boutique Online, Triburg Sportswear,
Indorama Synthetics
Education: MBA - Thunderbird School of Management
8
Sunny Sodhi
COO – Corporate
Experience: Carlson Wagonlit, HRG Sita
Education: Bcom (Hons) Delhi University, Diploma in
Hotel Management and Tourism
16
Shared Experience
Travel
Industry
Online
Product
Internet
Technologies
Operational
Discipline
Public Company
Experience
Operational experience backed by strong partners
Management and employees will own ~9% of Yatra on a pro-forma basis1
1. Includes 271,013 shares owned by Dhruv Shringi, 271,013 shares owned by Manish Amin, 2 million RSUs, and dilutive effect
of 873,724 options at a strike price of $3.81 (assuming treasury stock method)

Yatra Financial Overview
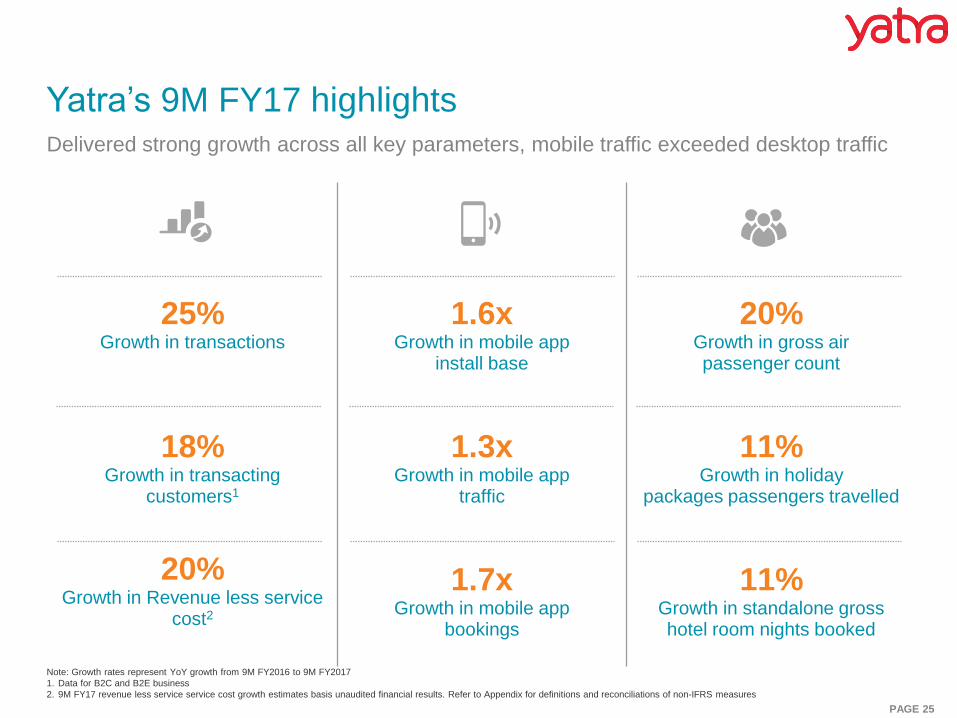
PAGE 25
25%Growth in transactions
1.6xGrowth in mobile app
install base
20%Growth in gross air passenger count
18%Growth in transacting
customers1
1.3xGrowth in mobile app
traffic
11%Growth in holiday
packages passengers travelled
20%Growth in Revenue less service
cost2
1.7xGrowth in mobile app
bookings
11%Growth in standalone grosshotel room nights booked
Note: Growth rates represent YoY growth from 9M FY2016 to 9M FY2017
1. Data for B2C and B2E business
2. 9M FY17 revenue less service service cost growth estimates basis unaudited financial results. Refer to Appendix for definitions and reconciliations of non-IFRS measures
Yatra’s 9M FY17 highlightsDelivered strong growth across all key parameters, mobile traffic exceeded desktop traffic
PAGE 26
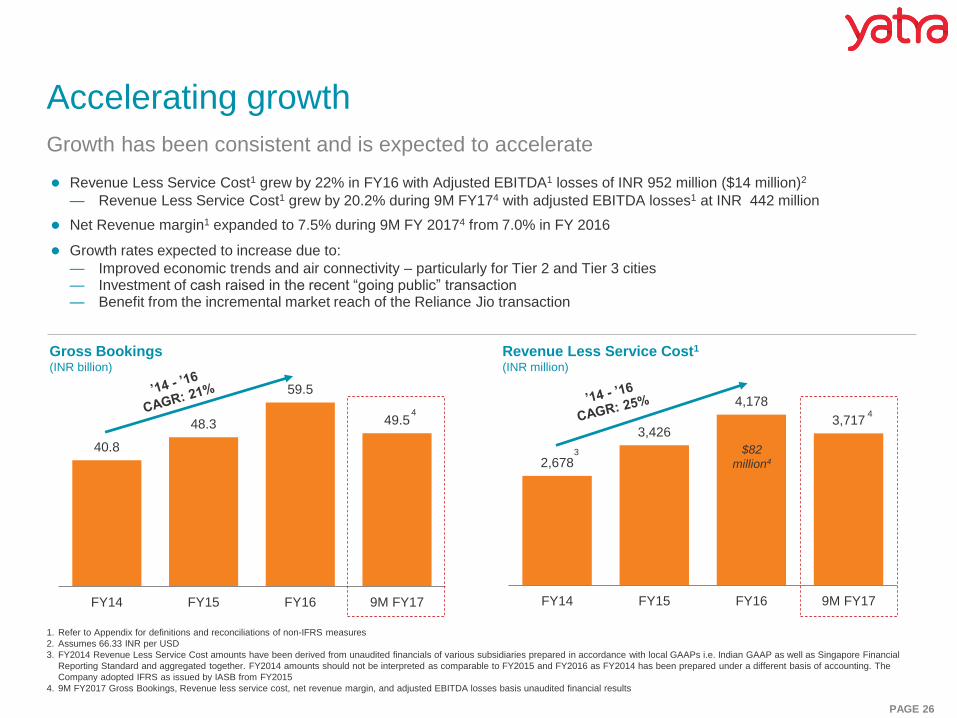
Revenue Less Service Cost1 grew by 22% in FY16 with Adjusted EBITDA1 losses of INR 952 million ($14 million)2
— Revenue Less Service Cost1 grew by 20.2% during 9M FY174 with adjusted EBITDA losses1 at INR 442 million
Net Revenue margin1 expanded to 7.5% during 9M FY 20174 from 7.0% in FY 2016
Growth rates expected to increase due to:
— Improved economic trends and air connectivity – particularly for Tier 2 and Tier 3 cities— Investment of cash raised in the recent “going public” transaction — Benefit from the incremental market reach of the Reliance Jio transaction
Growth has been consistent and is expected to accelerate
1. Refer to Appendix for definitions and reconciliations of non-IFRS measures
2. Assumes 66.33 INR per USD
3. FY2014 Revenue Less Service Cost amounts have been derived from unaudited financials of various subsidiaries prepared in accordance with local GAAPs i.e. Indian GAAP as well as Singapore Financial
Reporting Standard and aggregated together. FY2014 amounts should not be interpreted as comparable to FY2015 and FY2016 as FY2014 has been prepared under a different basis of accounting. The
Company adopted IFRS as issued by IASB from FY2015
4. 9M FY2017 Gross Bookings, Revenue less service cost, net revenue margin, and adjusted EBITDA losses basis unaudited financial results
Accelerating growth
2,678
3,426
4,178
3,717
FY14 FY15 FY16 9M FY17
40.8
48.3
59.5
49.5
FY14 FY15 FY16 9M FY17
Gross Bookings (INR billion)
Revenue Less Service Cost1
(INR million)
$82
million43
4 4
PAGE 27
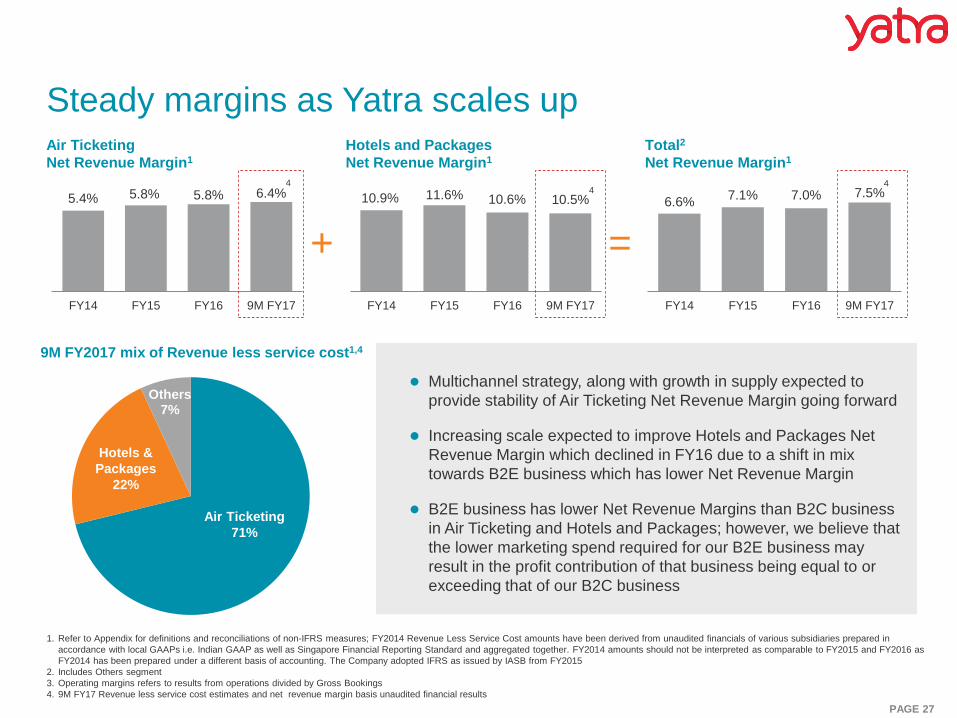
Air Ticketing
Net Revenue Margin1
5.4% 5.8% 5.8% 6.4%
FY14 FY15 FY16 9M FY17
Hotels and Packages
Net Revenue Margin1
10.9% 11.6% 10.6% 10.5%
FY14 FY15 FY16 9M FY17
Steady margins as Yatra scales up
+
6.6% 7.1% 7.0% 7.5%
FY14 FY15 FY16 9M FY17
Multichannel strategy, along with growth in supply expected to
provide stability of Air Ticketing Net Revenue Margin going forward
Increasing scale expected to improve Hotels and Packages Net
Revenue Margin which declined in FY16 due to a shift in mix
towards B2E business which has lower Net Revenue Margin
B2E business has lower Net Revenue Margins than B2C business
in Air Ticketing and Hotels and Packages; however, we believe that
the lower marketing spend required for our B2E business may
result in the profit contribution of that business being equal to or
exceeding that of our B2C business
Total2
Net Revenue Margin1
=
9M FY2017 mix of Revenue less service cost1,4
1. Refer to Appendix for definitions and reconciliations of non-IFRS measures; FY2014 Revenue Less Service Cost amounts have been derived from unaudited financials of various subsidiaries prepared in
accordance with local GAAPs i.e. Indian GAAP as well as Singapore Financial Reporting Standard and aggregated together. FY2014 amounts should not be interpreted as comparable to FY2015 and FY2016 as
FY2014 has been prepared under a different basis of accounting. The Company adopted IFRS as issued by IASB from FY2015
2. Includes Others segment
3. Operating margins refers to results from operations divided by Gross Bookings
4. 9M FY17 Revenue less service cost estimates and net revenue margin basis unaudited financial results
44
4
Others7%
Air Ticketing
71%
Hotels &
Packages
22%
PAGE 28
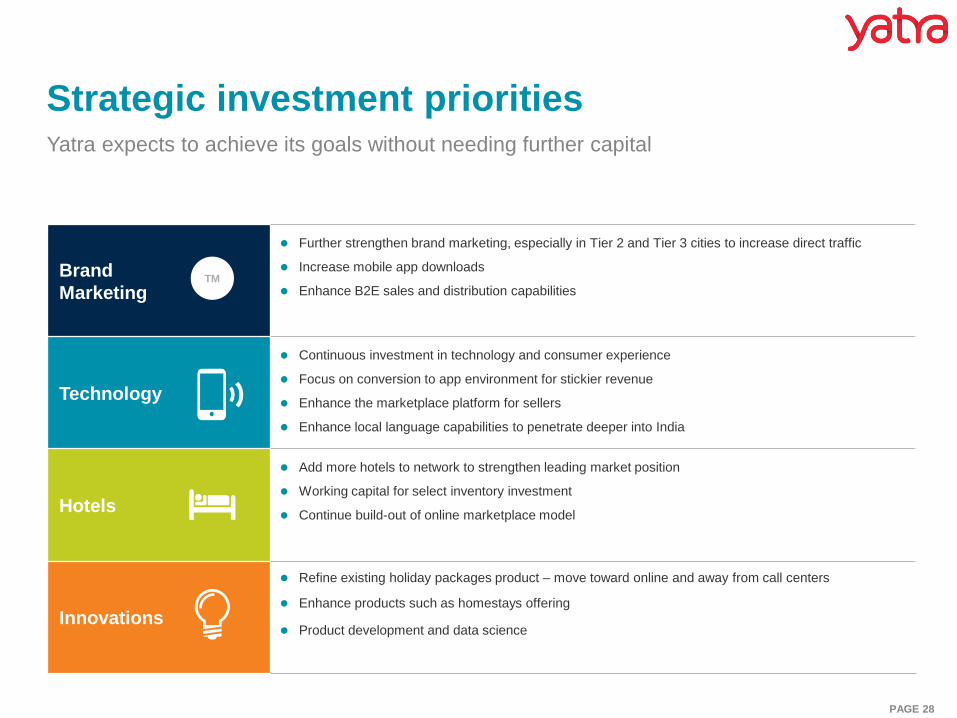
Yatra expects to achieve its goals without needing further capital
Brand
Marketing
Further strengthen brand marketing, especially in Tier 2 and Tier 3 cities to increase direct traffic
Increase mobile app downloads
Enhance B2E sales and distribution capabilities
Technology
Continuous investment in technology and consumer experience
Focus on conversion to app environment for stickier revenue
Enhance the marketplace platform for sellers
Enhance local language capabilities to penetrate deeper into India
Hotels
Add more hotels to network to strengthen leading market position
Working capital for select inventory investment
Continue build-out of online marketplace model
Innovations
Refine existing holiday packages product – move toward online and away from call centers
Enhance products such as homestays offering
Product development and data science
Strategic investment priorities
TM

Appendix
PAGE 30
The historical financial information regarding Yatra included in this investor presentation reflects Yatra’s fiscal year end of March 31, and has been derived from
audited financial statements of Yatra and its subsidiaries that were prepared in accordance with International Financial Reporting Standards, or IFRS as issued by
IASB, on a consolidated basis.
This presentation presents the metrics Revenue Less Service Cost, Adjusted EBITDA Losses, and Net Revenue Margin, which are non-IFRS measures. The
presentation of these non-IFRS measures, which are defined below, is not meant to be considered in isolation or as a substitute for Yatra’s consolidated financial
results prepared in accordance with IFRS as issued by the IASB and included in the proxy statement/prospectus. The non-IFRS financial metrics may not be
comparable to similarly titled measures reported by other companies due to potential differences in the method of calculation. A reconciliation of these non-IFRS
measures to the most comparable IFRS metric is set forth in this Appendix.
Description of Revenue Less Service Cost: As certain parts of Yatra’s revenue are recognized on a “net” basis and other parts of revenue are recognized on a
“gross” basis, Yatra evaluates its financial performance based on Revenue Less Service Cost, which is a non-IFRS measure. Yatra believes that Revenue Less
Service Cost provides investors with useful supplemental information about the financial performance of Yatra’s business and more accurately reflects the value
addition of the travel services that Yatra provides to its customers. The presentation of this non-IFRS information is not meant to be considered in isolation or as a
substitute for Yatra’s consolidated financial results prepared in accordance with IFRS as issued by the IASB. Yatra’s Revenue Less Service Cost may not be
comparable to similarly titled measures reported by other companies due to potential differences in the method of calculation. This Appendix reconciles Yatra’s
revenue, which is an IFRS measure, to Revenue Less Service Cost, which is a non-IFRS measure.
Description of Adjusted EBITDA: In addition to referring to Revenue Less Service Cost, we also refer to adjusted EBITDA (loss) which is a non-IFRS measure
and most directly comparable to results from operations for the year. We use financial statements that exclude share-based payment expense, and depreciation
and amortization for our internal management reporting, budgeting and decision making purposes, including comparing our operating results to that of our
competitors. Because of varying available valuation methodologies and subjective assumptions that companies can use when adopting IFRS 2 “Share based
payment”, management believes that providing non-IFRS financial measures that exclude such expenses allows investors to make additional comparisons between
our operating results and those of other companies. Accordingly, we believe that adjusted EBITDA (loss) is useful in measuring the results of our company and
provide investors and analysts a more accurate representation of our operating results. However, the presentation of these non-IFRS measures are not meant to
be considered in isolation or as a substitute for our consolidated financial results prepared in accordance with IFRS as issued by the IASB. These non-IFRS
measures may not be comparable to similarly titled measures reported by other companies due to potential differences in the method of calculation. The IFRS
measures most directly comparable to adjusted EBITDA (loss) is results from operations and loss for the year, respectively. A limitation of using adjusted EBITDA
(loss) calculated in accordance with IFRS is that this non-IFRS financial measure excludes a recurring cost, namely share-based payment expense. Management
compensates for this limitation by providing specific information on the IFRS amounts excluded from adjusted operating loss and adjusted net loss.
Description of Net Revenue Margin: Net Revenue Margin is defined as Revenue Less Service Cost as a percentage of Gross Bookings and represent the
commissions, fees, incentive payments and other amounts earned in our business. We follow Net Revenue Margin trends closely across our various lines of
business to gain insight into the performance of our various businesses.
Description of Gross Bookings: This presentation also uses the operating metric “Gross Bookings” which represents the total amount paid by our customers for
the travel services and products booked through us, including fees and other charges, and are net of cancellations and refunds.
All years are calendar years unless otherwise noted as “fiscal year” or “FY”.
Basis of financial presentation and use of non-IFRS measures
PAGE 31
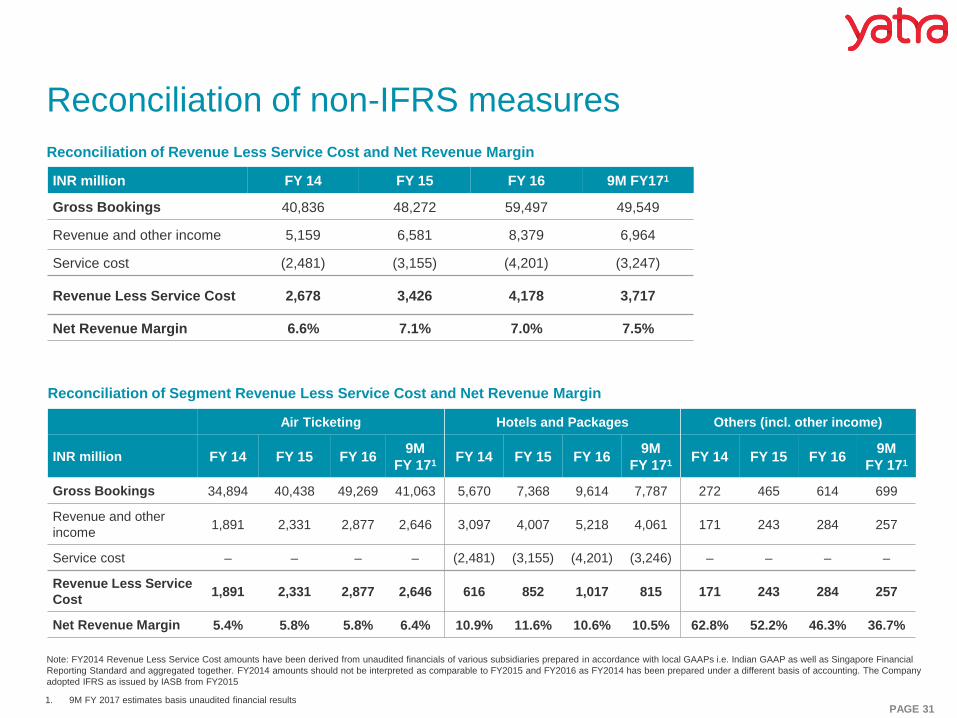
Reconciliation of Revenue Less Service Cost and Net Revenue Margin
Reconciliation of non-IFRS measures
INR million FY 14 FY 15 FY 16 9M FY171
Gross Bookings 40,836 48,272 59,497 49,549
Revenue and other income 5,159 6,581 8,379 6,964
Service cost (2,481) (3,155) (4,201) (3,247)
Revenue Less Service Cost 2,678 3,426 4,178 3,717
Net Revenue Margin 6.6% 7.1% 7.0% 7.5%
Reconciliation of Segment Revenue Less Service Cost and Net Revenue Margin
Air Ticketing Hotels and Packages Others (incl. other income)
INR million FY 14 FY 15 FY 169M
FY 171FY 14 FY 15 FY 16
9M
FY 171FY 14 FY 15 FY 16
9M
FY 171
Gross Bookings 34,894 40,438 49,269 41,063 5,670 7,368 9,614 7,787 272 465 614 699
Revenue and other
income1,891 2,331 2,877 2,646 3,097 4,007 5,218 4,061 171 243 284 257
Service cost – – – – (2,481) (3,155) (4,201) (3,246) – – – –
Revenue Less Service
Cost1,891 2,331 2,877 2,646 616 852 1,017 815 171 243 284 257
Net Revenue Margin 5.4% 5.8% 5.8% 6.4% 10.9% 11.6% 10.6% 10.5% 62.8% 52.2% 46.3% 36.7%
Note: FY2014 Revenue Less Service Cost amounts have been derived from unaudited financials of various subsidiaries prepared in accordance with local GAAPs i.e. Indian GAAP as well as Singapore Financial
Reporting Standard and aggregated together. FY2014 amounts should not be interpreted as comparable to FY2015 and FY2016 as FY2014 has been prepared under a different basis of accounting. The Company
adopted IFRS as issued by IASB from FY2015
1. 9M FY 2017 estimates basis unaudited financial results
PAGE 32
Reconciliation of non-IFRS measures, cont’d
INR millionFY2015 FY2016 9M FY20171
Personnel expenses 1,154 1,513 1,173
Marketing and sales promotion expenses 1,469 1,687 1,495
Other operating expenses 1,579 1,949 1,528
Depreciation and amortisation 209 234 194
Total 4,411 5,383 4,390
Cost Details
1. 9M FY 2017 estimates basis unaudited financial results
INR millionFY2015 FY2016 9M FY20171
Results from operations as per IFRS (985) (1,205) (672)
Add: Depreciation and amortization 209 234 194
EBITDA (777) (971) (478)
Add: Share based payment expense 32 19 36
Adjusted EBITDA (Loss) (745) (952) (442)
Reconciliation of Adjusted EBITDA (Loss)
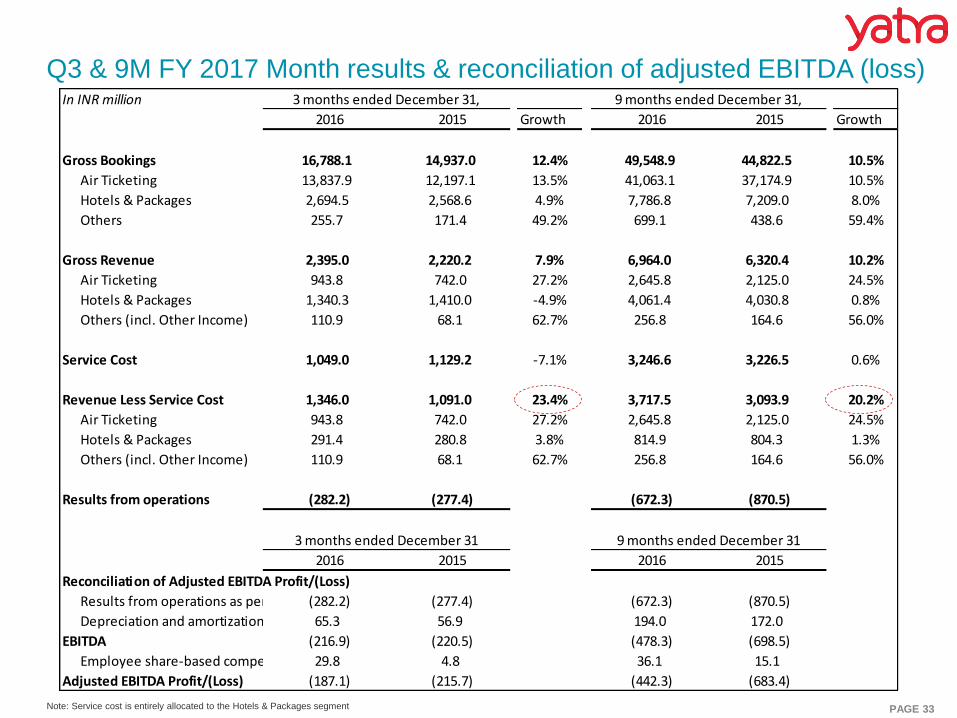
PAGE 33Note: Service cost is entirely allocated to the Hotels & Packages segment
Q3 & 9M FY 2017 Month results & reconciliation of adjusted EBITDA (loss)In INR million
2016 2015 Growth 2016 2015 Growth
Gross Bookings 16,788.1 14,937.0 12.4% 49,548.9 44,822.5 10.5%
Air Ticketing 13,837.9 12,197.1 13.5% 41,063.1 37,174.9 10.5%
Hotels & Packages 2,694.5 2,568.6 4.9% 7,786.8 7,209.0 8.0%
Others 255.7 171.4 49.2% 699.1 438.6 59.4%
Gross Revenue 2,395.0 2,220.2 7.9% 6,964.0 6,320.4 10.2%
Air Ticketing 943.8 742.0 27.2% 2,645.8 2,125.0 24.5%
Hotels & Packages 1,340.3 1,410.0 -4.9% 4,061.4 4,030.8 0.8%
Others (incl. Other Income) 110.9 68.1 62.7% 256.8 164.6 56.0%
Service Cost 1,049.0 1,129.2 -7.1% 3,246.6 3,226.5 0.6%
Revenue Less Service Cost 1,346.0 1,091.0 23.4% 3,717.5 3,093.9 20.2%
Air Ticketing 943.8 742.0 27.2% 2,645.8 2,125.0 24.5%
Hotels & Packages 291.4 280.8 3.8% 814.9 804.3 1.3%
Others (incl. Other Income) 110.9 68.1 62.7% 256.8 164.6 56.0%
Results from operations (282.2) (277.4) (672.3) (870.5)
2016 2015 2016 2015
Reconciliation of Adjusted EBITDA Profit/(Loss)
Results from operations as per IFRS (282.2) (277.4) (672.3) (870.5)
Depreciation and amortization 65.3 56.9 194.0 172.0
EBITDA (216.9) (220.5) (478.3) (698.5)
Employee share-based compensation costs 29.8 4.8 36.1 15.1
Adjusted EBITDA Profit/(Loss) (187.1) (215.7) (442.3) (683.4)
3 months ended December 31,
3 months ended December 31
9 months ended December 31,
9 months ended December 31