Embed Size (px)
Citation preview
1616 P St. NW Washington, DC 20036 202-328-5000 www.rff.org
November 2015 RFF DP 15-51
Lessons Learned from Three Decades of Experience with Cap-and-Trade
Ric har d Schm alensee and Rober t N . Stav ins
Prepared for the Review of Environmental Economics and Policy
DIS
CU
SS
ION
PA
PE
R
1
Lessons Learned from Three Decades of Experience with Cap-and-Trade
Richard Schmalensee and Robert N. Stavins
ABSTRACT
This essay provides an overview of the major emissions trading programs of the
past thirty years on which significant documentation exists, and draws a number
of important lessons for future applications of this environmental policy
instrument. References to a larger number of other emissions trading programs
that have been implemented or proposed are included.
Key Words: market-based instruments, cap-and-trade, leaded gasoline phasedown, Clean Air Act amendments of 1990, sulfur dioxide, acid rain, carbon dioxide, global climate change, European Union Emissions Trading System
JEL Classification Codes: Q540, Q580, Q400, Q480
2
Lessons Learned from Three Decades of Experience with Cap-and-Trade
Richard Schmalensee and Robert N. Stavins1
[9,887 words]
INTRODUCTION
Thirty years ago, the notion of a government allocating tradable rights to emit pollution was
controversial. Many environmental advocates felt this approach inappropriately legitimized
environmental degradation, while others doubted its workability. At that time, virtually all pollution
regulations took a more prescriptive, “command-and-control” approach, either specifying the type of
pollution-control equipment to be installed or by setting uniform limits on emission levels or rates.
Today, it is broadly acknowledged that because emission reduction costs often vary greatly,
aggregate abatement costs under command-and-control approaches can be much higher than they need to
be. Instead, by establishing a price on emissions, either directly through taxes or indirectly through a
market for tradable emissions rights (called permits or allowances) established under a cap-and-trade
policy, market-based approaches tend to equate marginal abatement costs rather than emissions levels or
rates across sources, and thereby can – in principle – achieve pollution-control targets at minimum cost.
Most early experience with market-based environmental policies was in the United States,
starting with the Federal government’s attention to localized air pollution, and subsequently
transboundary acid rain. More recently, with increased attention to the threat of global climate change,
the locus of policy action using this approach has shifted from national to sub-national policies in the
United States, and for national policies from this country to others.
We examine the design and performance of seven of the most prominent emissions trading
systems that have been implemented over the past 30 years – systems that are particularly important
environmentally and/or economically and the performance of which has been documented. We ask what
lessons this experience offers for future applications. We focus on systems that involve trading emissions
rights and exclude emission-reduction-credit (offset) systems, which offer credits for emissions reductions
from some baseline. It is worth noting, however, that systems of the latter kind have been used in many
1 Schmalensee is the Howard W. Johnson Professor of Economics and Management, Emeritus at the Massachusetts Institute of Technology. Stavins is the Albert Pratt Professor of Business and Government at the Harvard Kennedy School, a University Fellow of Resources for the Future, and a Research Associate of the National Bureau of Economic Research. They acknowledge research assistance by Megan Bailey and Jennifer Austin, and exceptionally valuable comments on a previous version of the manuscript by Dallas Burtraw, Denny Ellerman, and Robert Hahn. The authors, who are responsible for any and all remaining errors, can be reached at [email protected] and [email protected].
3
countries, as well as internationally in the form of the Clean Development Mechanism under the Kyoto
Protocol.
THIRTY YEARS OF EXPERIENCE
The seven emissions trading systems examined here are: the U.S. Environmental Protection
Agency’s (EPA’s) leaded gasoline phasedown in the 1980s; the sulfur dioxide allowance trading program
under the Clean Air Act Amendments of 1990; the Regional Clean Air Incentives Market in southern
California; NOX trading in the Eastern United States; the Regional Greenhouse Gas Initiative in the
northeast United States; California’s AB-32 cap-and-trade system; and the European Union Emissions
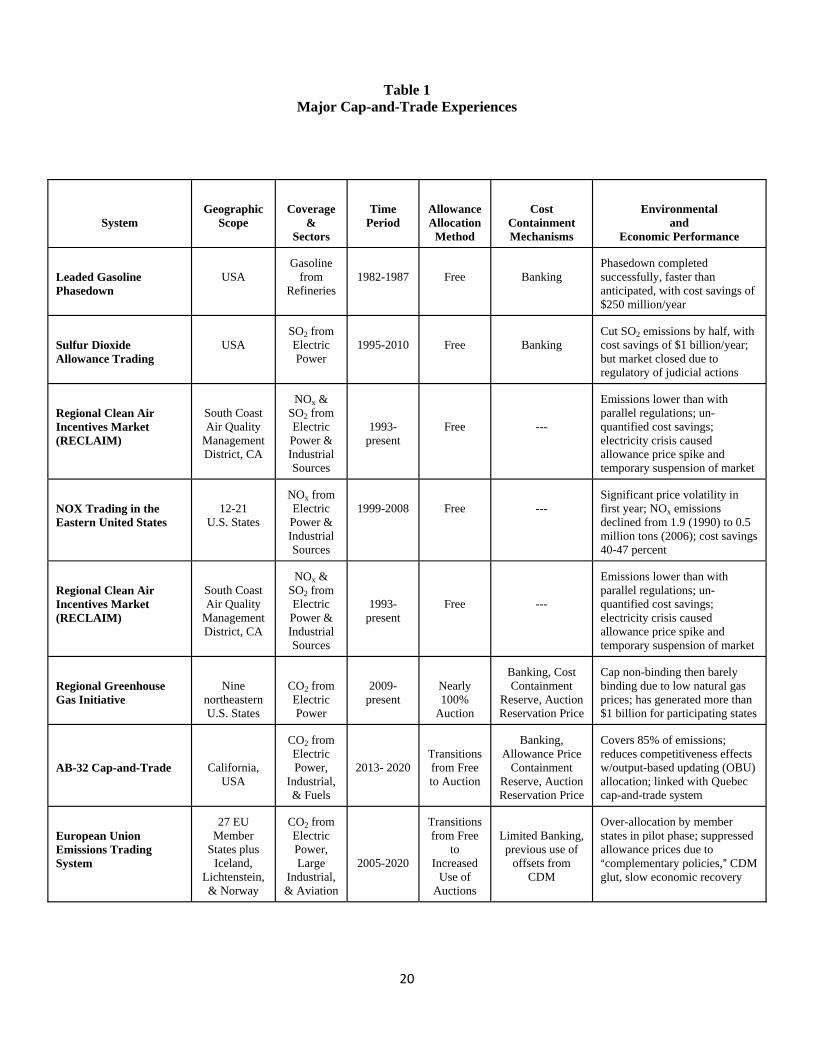
Trading System. All but the first of these are textbook cap-and-trade systems. Table 1 provides a brief
overview of these systems (see p. 20).
Leaded Gasoline Phasedown
In the 1970s, concern arose regarding the use of lead as an additive in gasoline. Although it was
later documented that lead oxide emissions were a serious human health threat, the original concern was
that these emissions were fouling catalytic converters, which were required in new U.S. cars starting in
1975 to reduce emissions of carbon monoxide and hydrocarbons. Because of this concern, in the early
1980s, EPA began a phasedown of lead in gasoline to 10 percent of its original level.
A trading program was launched in 1982 that was intended to lessen the financial burden on
smaller refineries, which had significantly higher compliance costs. Unlike a textbook cap-and-trade
program, there was no explicit allocation of permits, but the system implicitly awarded property rights on
the basis of historical levels of gasoline production (Hahn 1989). If a refiner produced gasoline with a
lower total lead content than was allowed, it earned lead credits that EPA allowed it to sell. Under
banking provisions of the program, lead credits could be saved for later use, providing an incentive for
early reductions to help meet the lower limits that existed during the later years of the phasedown. Firms
made extensive use of this option.
Performance
Trading resulted in leaded gasoline being removed from the market faster than anticipated. In
each year of the program, more than 60 percent of the lead added to gasoline was associated with traded
lead credits (Hahn and Hester 1989), until the lead phasedown was completed and the program was
terminated at the end of 1987. Overall, the program was successful in meeting its environmental targets,
4
although it may have produced some temporary geographic shifts in use patterns (Anderson, Hofmann,
and Rusin 1990; Newell and Rogers 2007). The high level of trading between firms far surpassed levels
observed in earlier environmental offset markets. This level of trading activity and the rate at which
refiners reduced their production of leaded gasoline suggest that the program was relatively cost-effective
(Hahn and Hester 1989; Kerr and Maré 1997; Nichols 1997). EPA estimated savings from the lead
trading program of approximately 20 percent compared with alternative approaches that did not provide
for trade (U.S. Environmental Protection Agency, Office of Policy Analysis 1985), and the program
provided significant incentives for cost-saving technology diffusion (Kerr and Newell 2003).
Lessons
First, as the first environmental program in which trading played a central role, EPA’s leaded
gasoline phasedown served as a proof of concept, showing that a tradable emission rights system could be
environmentally effective and economically cost effective.
Second, the program’s implementation demonstrated that transaction costs in such a system could
be small enough to permit substantial trade. Specifically, requiring prior government approval of
individual trades had raised transactions cost and hampered trade in EPA's Emissions Trading Program in
the 1970s (a set of emission-reduction-credit systems), while the lack of such requirements was an
important factor in the success of lead trading (Hahn and Hester 1989).
Third, as in other programs to follow, banking played a very important role. By enabling
intertemporal substitution, it contributed a significant share of the gains from trade.
Sulfur Dioxide Allowance Trading
During the 1980s, there was growing concern that acid precipitation – due mainly to emissions of
sulfur dioxide (SO2) from coal-fired power plants – was damaging forests and aquatic ecosystems.
Because costs of emissions reductions differed dramatically among existing plants, legislative proposals
to use one-size-fits-all command-and-control methods to address this problem failed to attract significant
support.
In response, Title IV of the Clean Air Act Amendments of 1990 launched the path-breaking SO2
allowance trading program. Phase I (1995–1999) required emissions reductions from the 263 most
polluting coal-fired electric generating units (larger than 100 MW), almost all located east of the
Mississippi River. Phase II, which began in 2000, placed an aggregate national emissions cap on
approximately 3,200 electric generating units (larger than 25 MW) — nearly the entire fleet of fossil-
fueled plants in the continental United States (Ellerman et al. 2000). This cap represented a 50 percent
reduction from 1980 levels. The allowances were demarcated by vintage, with the total number
decreasing for successive years, thereby establishing a declining cap.
5
The government gave power plants permits to emit (called “allowances”), denominated in tons of
SO2 emissions; allocations were based mainly on actual fuel use during the period 1985--1987.2 If annual
emissions at a regulated facility exceeded the allowances allocated to that facility, the owner could buy
allowances or reduce emissions, whether by installing pollution controls, changing the mix of fuels used
to operate the facility, or scaling back operations. If emissions at a regulated facility were reduced below
its allowance allocation, the facility owner could sell the extra allowances or bank them for future use.
EPA monitored emissions on a continuous basis and verified allowances submitted for compliance.
The cap-and-trade system created incentives to find ways to reduce SO2 emissions at the lowest
cost. Although government auctioning of allowances would have generated revenue that could have been
used – in principle – to reduce distortionary taxes, thereby reducing the program’s social cost (Goulder
1995), this efficiency argument was not advanced at the time. Because the entire investor-owned electric
utility industry was subject to cost-of-service regulation in 1990, it was assumed that the value of free
allowances would be passed on to consumers and would not generate windfall profits for generators. As
important, the political value of being able to allocate free allowances to build support by addressing
differential economic and other concerns was substantial (Joskow and Schmalensee 1998). Since the
equilibrium allocation of pollution permits, after trading has occurred, is independent of the initial
allocation (Montgomery 1972) — barring particularly problematic types of transaction costs (Hahn and
Stavins 2012) --- the initial allocation of allowances could be designed to maximize political support
without compromising the system’s environmental performance or raising its cost.
Performance
The program performed exceptionally well along all relevant dimensions. SO2 emissions from
electric power plants decreased 36 percent between 1990 and 2004 (U.S. Environmental Protection
Agency 2011), even though electricity generation from coal-fired power plants increased 25 percent over
the same period (U.S. Energy Information Administration 2012). The program delivered emissions
reductions more quickly than expected, as utilities made substantial use of the freedom to bank
allowances for future use. With its $2,000/ton statutory fine for any emissions exceeding allowance
holdings (and continuous emissions monitoring), compliance was nearly 100 percent.
Some worried that emissions would end up disproportionately concentrated and would produce
“hot spots” of unacceptably high SO2 concentrations in eastern forests. However, the geographic pattern
of emissions reductions was broadly consistent with model predictions, and the program did not generate
significant hot spots (Ellerman et al. 2000; Swift 2004).
2 In addition, the statute required EPA to withhold about 2.8% of all allocated allowances each year, sell them at an annual auction, and return the proceeds in proportion to those from whom allowances had been withheld (Ellerman et al 2000). This provision was intended to stimulate the development of private market-trading activity and seems to have done so.
6
The cost of the program was significantly reduced as rail rates fell after their substantial
deregulation in 1980, significantly reducing the cost of burning low-sulfur Western coal in the East
(Keohane 2003; Ellerman and Montero 1980; Schmalensee and Stavins 2013). That said, cost savings
were at least 15 percent and perhaps as great as 90 percent of the costs of various counterfactual
command and control policies (Carlson et al. 2000; Ellerman et al. 2000; Keohane 2003). In addition to
static cost effectiveness, there is evidence that the program reduced costs over time by providing
incentives for innovation (Ellerman et al. 2000; Popp 2003; Bellas and Lange 2011). On the other hand,
the program’s costs were likely not as low as they could have been, due to a variety of constraints
(Schmalensee and Stavins 2013).
In any case, the SO2 allowance-trading system’s actual costs were much lower than would have
been incurred under a traditional regulatory approach – if such an approach had been politically feasible.
The program’s goals were achieved with less litigation (and thus less uncertainty) than is typical for
traditional environmental programs, because firms that found it particularly costly to reduce emissions
had the option to buy allowances instead, and because firms could not complain about EPA’s exercise of
administrative discretion, since the law gave it very little discretion. That said, subsequent regulatory
actions, court decisions, and regulatory responses led to the virtual elimination of the SO2 market by 2010
(Schmalensee and Stavins 2013).
The SO2 reductions achieved benefits that were a substantial multiple of costs (Burtraw, et al.
1998; Chestnut and Mills 2005). In contrast to what was expected at the time of the program’s enactment,
however, the program’s benefits were due mainly to the positive human health impacts of decreased local
SO2 and small particulate concentrations, not the ecological impacts of reduced acid deposition
(Schmalensee and Stavins 2013), though there were significant ecological benefits as well (Banzhal et al.
2006).
Lessons
Even though the conclusion of trading in the leaded gasoline phasedown preceded by a decade
the beginning of the SO2 allowance trading program, the SO2 system was and is still today often
celebrated as the first important use of this policy instrument. Some of the lessons from the system’s
design and performance reinforce lessons that emerged from the lead program.
First, to provide some degree of certainty to regulated entities, facilitate their planning, and limit
price volatility in early years, it is valuable to put final rules in place well before the beginning of the first
compliance period. This was done two years prior with the SO2 allowance trading program.
Second, as with the lead trading program, the absence of requirements for prior approval of trades
reduced uncertainty for utilities and administrative costs for government, and it contributed to low
transaction costs and substantial trading (Rico 1995).
7
Third, as in the lead trading program, banking was extremely important. It accounted for more
than half of the program’s cost savings (Carlson et al. 2000; Ellerman et al. 2000).
Fourth, a robust allowance market can be fostered through a cap that is significantly below
business-as-usual (BAU) emissions, combined with unrestricted trading and banking.
Fifth, allocation of free allowances can be used to build political support, an important reminder
for later programs focused on climate change.
Sixth, intra-sector emissions leakage can be minimized, as it was in this program, by including all
non-trivial sources within the sector.
Seventh, high levels of compliance can be ensured through accurate emissions monitoring and
significant penalties for non-compliance.
Regional Clean Air Incentives Market
The South Coast Air Quality Management District, which is responsible for controlling emissions
in a four-county area of southern California, launched its Regional Clean Air Incentives Market
(RECLAIM) in 1993 to reduce emissions of nitrogen oxides (NOx) and in 1994 to reduce SO2 emissions
from 350 affected sources, including power plants and industrial sources in the Los Angeles area that
emitted four or more tons per year of either pollutant. RECLAIM replaced command-and-control
regulations that were scheduled to bring the region into compliance with national ambient air quality
standards (Ellerman, Joskow, and Harrison 2003).
Initial free allocations of NOx and SO2 RECLAIM Trading Credits (RTCs) were based on
historical peak production levels, and the initial allocations were 40 to 60 percent above actual emissions
until the year 2000. The NOx and SO2 caps declined annually by 8.3% and 6.8%, respectively, until 2003,
when the market reached its overall goal of a 70% emissions reduction (Hansjurgens 2011; Ellerman,
Joskow, and Harrison 2003). The compliance period was a single year, and banking was not allowed. A
particularly interesting aspect of the trading program’s design was its zonal nature: trades were not
permitted from downwind to upwind sources.
Performance
Prospective analysis predicted significant cost savings (Johnson and Pekelney 1996; Anderson
1997). By June 1996, 353 program participants had traded more than 100,000 tons of NOx and SO2
credits, with a value of over $10 million. Retrospective empirical evidence indicates that emissions at
RECLAIM facilities were some 20 percent lower than at facilities that were regulated with parallel,
command-and-control regulations, that hotspots did not appear, and that substantial cost savings were
achieved (Burtraw and Szambelan 2010; Fowlie, Holland, and Mansur 2012).
8
In the program’s early years, allowance prices remained in the expected range of $500 to $1,000
per ton of NOX, but California’s electricity crisis in 2000-2001 eliminated some sources of electricity and
thereby caused electricity demand and production levels at some RECLAIM generating facilities to
increase dramatically. This caused emissions to exceed permit allocations at these facilities, thereby
bringing about a dramatic spike in allowance prices to more than $60,000/ton (Fowlie, Holland, and
Mansur 2012). Part of the problem was the absence of a pool of banked allowances. The program was
temporarily suspended for the affected sources, and prices returned to normal levels (below $2,000/ton)
by 2002, with all sources rejoining the program by 2007. As of July, 2015, the twelve-month moving
average of prices was $3,625/ton (South Coast Air Quality Management District 2015).
Lessons
First, because the RECLAIM system included two zones, with trades allowed in only one
direction to account for prevailing winds, the design demonstrated the feasibility of a basic ambient as
opposed to an emissions-based cap-and-trade system. Thus, system design can accommodate a non-
uniformly mixed pollutant and attendant concerns about hot spots.
Second, a lesson from RECLAIM that later turned out to be important for several CO2 cap-and-
trade systems is that over-allocation of allowances means there is no scarcity created and therefore no
functioning spot allowance market, though there were active forward markets throughout.
Third, provisions for emissions banking (and other cost-containment elements) are crucial in
order to allow for compliance at reasonable cost in years in which unanticipated circumstances lead to
greater than expected emissions.
NOx Trading in the Eastern United States
Two programs are relevant here. First, under EPA guidance and enabled by the Clean Air Act
Amendments of 1990, eleven northeastern states and the District of Columbia developed and
implemented the NOx Budget Program, a regional NOx cap-and-trade system, in 1999. Reflecting the
significant adverse health effects of ground-level ozone (smog) (U.S. Environmental Protection Agency
2004), the goal was to reduce summertime ground-level ozone by more than 50% as compared with 1990
levels. Some 1,000 electric generating and industrial units were required to demonstrate compliance each
year from May through September (the summer ozone season).
The region was divided into upwind and downwind zones. Allowances were given to states to
distribute to in-state sources, with less generous allowance allocations, measured as percentages of 1990
emissions, given to upwind states. Since interzonal trading was permitted on a one-for-one basis,
however, the two zones made similar reductions from baseline emissions levels (Ozone Transport
9
Commission 2003). Sources could buy, sell, and bank allowances (within limits due to the seasonal
nature of the ozone problem).
In 1998, the EPA issued the NOx SIP Call, which required 21 eastern states to submit plans to
reduce their NOx emissions from more than 2,500 sources. The Call included a model rule, which, if
adopted by a state, enabled it to meet its obligations by participating in an interstate cap-and-trade
program. All affected states adopted the model rule, and the NOx Budget Trading Program went into
effect in 2003, replacing the NOx Budget Program. As in the earlier program, states were given
allowances to allocate to in-state sources.
In 2009, the NOX Budget Trading Program was effectively replaced by the Clean Air Interstate
Rule (CAIR), and CAIR was replaced in January 2015 by the Cross State Air Pollution Rule (CSAPR).
Performance
Uncertainty existed in the NOX Budget Program market at the outset because some rules were not
in place when trading commenced. The result was a high degree of price volatility in the program’s first
year, although prices stabilized by the program’s second year of operation (Farrell 2000). Overall, NOx
emissions declined from about 1.9 million tons in 1990 to less than 500,000 tons by 2006, with 99%
compliance (Butler, et al. 2011; Deschenes et al. 2012). Abatement cost savings of 40 to 47 percent were
estimated for the period 1999-2003, compared with conventional regulation without trading or banking
(Farrell 2000).
Lessons
First, to avoid unnecessary price volatility, the design of an emissions trading program should be
clear, with all rules in place well before the program takes effect.
Second, a lesson that is potentially important in the future for the Obama administration’s Clean
Power Plan is that a well-designed multi-state process with federal guidance can be effective in
coordinating what are legally state-level goals.
Third, this history provides a precedent and model for expanding the coverage of a cap-and-trade
system over time to include additional jurisdictions (such as neighboring states).
Fourth, giving states freedom to allocate allowances among in-state sources can provide valuable
flexibility without compromising environmental goals.
The Regional Greenhouse Gas Initiative
Nine northeastern U.S. states participate in the Regional Greenhouse Gas Initiative (RGGI), the
first cap-and-trade system in the United States to address carbon dioxide (CO2) emissions. RGGI is a
downstream program limited to the power sector. The program began in 2009 with a goal of limiting
10
emissions from regulated sources to then current levels in the period from 2009 to 2014. The emissions
cap was then set to decrease by 2.5 percent each year from 2015, until it reached 10 percent below 2009
emissions in 2019. It was originally anticipated that meeting this goal would require a reduction
approximately of 35 percent below business-as-usual emissions (13 percent below 1990 emissions levels).
Because of the economic recession and drastic declines in natural gas prices relative to coal
prices, the cap quickly ceased to be binding, and it appeared unlikely to become binding through 2020. In
response, the RGGI states agreed in a pre-planned review in 2012 to establish a lower cap in 2014, with
2.5% annual cuts thereafter to 2019. Reflecting these changes, allowance prices fell from approximately
$3/ton of CO2 at the first auction in 2008, down to the floor price of $1.86/ton in 2010, and up to
$5.50/ton in 2015.
The program has required participating states to auction at least 25 percent of their allowances
and to use the proceeds for energy efficiency, renewable energy, and related improvements.3 In practice,
states have auctioned virtually all allowances. The major rationale for an auction was to avoid the
windfall profits that would generally result from free allocation of allowances in deregulated electricity
markets (Sijm, Neuhoff, and Chen 2006).
An allowance price ceiling is included in the form of a cost containment reserve, from which
some additional allowances are released for sale when auction prices hit specified, escalating levels. A
price floor is also included through an auction reserve price. Any unsold allowances are permanently
retired after three years, thereby providing an automatic mechanism for tightening the cap in the face of
any chronic allowance surplus. This combination provides a price collar, making the program a hybrid –
to some degree – of a cap-and-trade system and a carbon tax.
Performance
Because the cap was not binding during the program’s first compliance period (though the price
floor kept the allowance price positive) and has been barely binding since then, the direct impacts of the
RGGI program on power-sector CO2 emissions have been small. However, the program’s auctions have
generated more than $1 billion in revenues for the participating states. Per the program’s design, some of
this revenue has gone to financing government programs that can reduce energy demand and hence CO2
emissions and demand for allowances (Hibbard, et al. 2011)
Monitoring costs for the program have been very low, because U.S. power plants were already
required to report their hourly CO2 emissions by the federal SO2 allowance trading program. The penalty
for non-compliance is that entities must submit three allowances for each allowance they are short.
3 Three states have used some of their auction revenue to help balance their overall state budgets.
11
Because of the geographically-limited scope of the RGGI system, combined with interconnected
electricity markets, emissions leakage has been a significant concern (Burtraw, Kahn, and Palmer 2006).
One study found that if the program were fully binding, power imports from Pennsylvania to New York
State could result in emissions leakage approximating as much as 50% (Sue Wing and Kolodziej 2008).
Lessons
First, a lesson that has not been lost on policy makers is that a cap-and-trade system that auctions
its allowances can generate substantial revenue for government, whether or not the system has much
effect on emissions.
Second, the leakage problem is potentially severe for any state or regional program; this is
particularly the case for a power-sector program because of the interconnected nature of electricity
markets (Burtraw, Kahn, and Palmer 2006).
Third, a changing economy can render a cap non-binding or drive prices to excessive levels.
Hence, there is an important role for price collars. In the case of RGGI, an effective floor on the price of
allowances was established through the use of a reservation price in allowance auctions, so that allowance
prices remain positive. Upside cost-containment has not been tested and may be less effective because of
limits on the size of the cost containment reserve.
California’s AB-32 Cap-and-Trade System
In 2006, California enacted Assembly Bill 32 (AB-32), which required the California Air
Resources Board to establish an ambitious program to cut the state’s greenhouse gas (GHG) emissions to
their 1990 level by the year 2020. The program includes: energy efficiency standards for vehicles,
buildings, and appliances; renewable portfolio standards that increase the share of renewable electricity
supply from 20% to 33%; a low carbon fuel standard that requires refineries to reduce the carbon content
of motor vehicle fuels; and a cap-and-trade system (California Environmental Protection Agency 2014).
The AB-32 cap-and-trade system began in 2013 with coverage of electricity sold in California
(wherever generated4) and large-scale manufacturing. It was expanded to include fuels in 2015, thereby
covering 85% of the state’s emissions. The 2013 cap was set at approximately 98% percent of anticipated
2012 emissions, and annual cuts follow until 1990 emission levels are achieved in 2020. Most
allowances were initially distributed via free allocation, with greater use of auctions over time. Banking
is allowed, and regulated entities may use approved offsets from emissions reductions from forestry, dairy
digestion, and ozone-depleting substances reduction to account for up to 49% of reductions.
4 Profound leakage risks nonetheless exist in California for the electricity sector due to contract reshuffling (Bushnell, Peterman, and Wolfram 2008).
12
A ceiling on allowance prices is established by releasing allowances from a reserve when auction
prices hit specified levels that escalate over time. A price floor is created through an auction reservation
price, with unsold allowances held until the reservation price is exceeded for six consecutive months.
This combination produces an effective price collar, making the system a hybrid of cap-and-trade and a
carbon tax. In addition, competitiveness concerns in energy-intensive, trade-exposed (EITE) industries
are addressed by granting free allowances in proportion to production levels in previous periods.
It is noteworthy that California’s system was linked to a very similar system in Quebec in 2014
(Kroft and Drance 2015). Each system recognizes allowances from the other system for compliance
purposes, and joint allowance auctions are held on a quarterly basis.
Performance and Lessons
Since the system was only launched in 2013, it is too soon to comment on its performance, other
than to note that the auction mechanisms and other features of the program’s design have functioned as
anticipated. Hence, the lessons we identify from the AB-32 cap-and-trade system are from its design,
rather than its performance.
First, the California system has demonstrated that an initial free allowance allocation that fosters
political support can be successfully transitioned over time to greater auctioning of allowances.
Second, the California experience is a reminder of the political pressures to use auction revenues
for purposes other than reducing distortionary taxes. Through May, 2015, the AB-32 cap-and-trade
auctions had generated over $2 billion, an amount that is anticipated to reach nearly $4 billion by the end
of 2016 (California Legislative Analyst’s Office 2015). As courts have interpreted the state constitution,
the funds “are to be used to reduce GHG emissions and, to the extent feasible, achieve co-benefits such as
job creation, air quality improvements, and public health benefits.”
Third, California’s AB-32 system was the first CO2 (or GHG) cap-and-trade system to be
essentially economy-wide, demonstrating the feasibility of this approach, compared with less efficient
approaches that treat different sectors differently.
Fourth, the system greatly reduces the risk of unanticipated allowance price changes and price
volatility by employing an effective price collar.
Fifth, California has deployed an effective mechanism to address concerns about competitiveness
impacts in EITE sectors. Granting free allowances to firms in specific sectors in proportion to their
production levels in the previous time period subsidizes production and thus directly affects
competitiveness. In contrast, simply giving allowances for free to firms in certain sectors (as in the
European Union’s Emissions Trading System – see below) has no effect on the receiving firm’s
competitiveness, because its marginal production costs are unaffected.
13
Sixth, California’s intense interest in linking its cap-and-trade system with those in other sub-
national and national jurisdictions – and its implemented linkage with Quebec – reflects the importance of
such linkage to reduce abatement costs, reduce price volatility, and restrain market power (Ranson and
Stavins 2013).
Seventh, while policies that address other market failures, such as the well-known principal-agent
problem associated with energy-efficiency investment decisions by landlords and tenants, can reduce
costs, the suite of policies within California’s AB-32 provides examples of so-called “complementary
policies” that are more likely to increase costs with no effect on emissions.
An important example is the state’s Low Carbon Fuel Standard (LCFS), which requires that
California refineries produce fuel with, on average, no more than a stated amount of life-cycle carbon
content. Since refineries and transportation fuels are already covered by the cap of the cap-and-trade
system, this additional regulation cannot reduce emissions in the short run unless it makes the allowance
price floor binding. Because the LCFS is a binding constraint on refiners, additional CO2 emission
reductions are achieved in this sector beyond what the cap-and-trade system would accomplish on its
own. This produces 100% leakage to other sectors when allowances are sold, however, unless the price
floor becomes effective. In any case, marginal abatement costs are not equated across sectors and
sources,5 so aggregate abatement costs are increased. And allowance prices are depressed, causing
concern about the ability of the cap-and-trade system to encourage technological change --- except, of
course, in the refinery sector. In short, this “complementary policy” mainly serves to increase abatement
costs and lower allowance prices (Goulder and Stavins 2011). Many other so-called complementary
policies also have these same perverse effects.6
The European Union Emissions Trading System
The world’s largest carbon pricing regime is the European Union Emission Trading System (EU
ETS), a cap-and-trade system of CO2 allowances (European Commission 2012). Adopted in 2003 with a
pilot phase that started in 2005, the EU ETS covers about half of EU CO2 emissions in 31 countries
(Ellerman and Buchner 2007). The 11,500 regulated emitters include electricity generators and large
industrial sources. Competitiveness concerns were dealt with by the allocation of free allowances to
selected sectors. The program does not cover most sources in the transportation, commercial, or
residential sectors, although some aviation sector emissions were brought under the cap in 2012.
5 As of August, 2015, LCFS credits were selling for an average of $57/ton of CO2 (California Environmental Protection Agency 2015), while the cap-and-trade allowances were selling for about $13/ton of CO2 (Climate Policy Initiative 2015).
6 The requirement that auction revenues from the AB-32 cap-and-trade system be spent to further the purposes of the statute virtually guarantees that this perverse interaction of “complementary policies” and the cap-and-trade system will continue.
14
The EU ETS was designed to be implemented in phases: a pilot Phase I from 2005 to 2007, a
Kyoto Phase II from 2008 to 2012, and a series of subsequent Phases. Penalties for violations increased
from €40 per ton of CO2 in the first phase to €100 in the second phase. Although the first phase allowed
trading only in CO2, the second phase broadened the program to include some other GHGs.
The process for setting caps and allowances in member states was initially decentralized (Kruger,
Oates, and Pizer 2007), with each member state responsible for proposing its own national carbon cap,
subject to review by the European Commission. This created incentives for individual countries to be
generous with their allowances (Convery and Redmond 2007).
Performance
In January, 2005, the allowance price per ton of CO2 was approximately €8; by early 2006, it
exceeded €30. After it became clear that the generous allocation of allowances in 2005 had exceeded
emissions by about 4 percent, the price fell by about half in one week of April, 2006, before fluctuating
and returning to about €8, en route to a collapse to zero in 2007 (Convery and Redmond 2007). This
volatility was attributed to the absence of good emissions data at the beginning of the program, a surplus
of allowances, energy price volatility, and the inability to bank allowances from Phase I to Phase II
(Market Advisory Committee 2007).
The first and second phases of the EU ETS required member states to distribute almost all of the
emissions allowances freely to regulated sources, but beginning in 2013, member states were required to
auction larger shares of their allowances. The initial free distribution of allowances led to complaints
about electricity generators’ “windfall profits” when electricity prices increased significantly in 2005.
But higher fuel prices also played a role in the electricity price increases, and some generators’ profits
reflected their ownership of low-cost nuclear or coal generation in areas where the market electricity price
was set by higher-cost natural gas plants (Ellerman and Buchner 2007).
The system’s cap was tightened for Phase II, and its scope was expanded to cover new sources in
countries that participated in Phase I plus nations that joined the EU in 2007 and 2013. In addition, three
non-member states joined the EU ETS in 2008. Allowance prices in Phase II increased to over €20 in
2008, then fell when recession led to decreased demand. Heavy use of offsets under the Clean
Development Mechanism also reduced demand. Prices fell to €10 by the fall of 2011 and have remained
in the range of €5 to €10 since then.
The EU ETS has been extended through its Phase III, 2013-2020, with a more stringent, centrally
determined cap (20% below 1990 emissions), a larger share of allowances to be auctioned, tighter limits
on the use of offsets, and unlimited banking of allowances between Phases II and III.
15
Concern continues in the EU regarding low allowances prices (Löfgren, et al. 2015). These prices
reflect the slow pace of European economic recovery and the lack of a price floor, as well as the fact that
other binding EU policies, particularly renewable generation and energy efficiency standards, reduce
emissions under the cap. In the absence of a binding price floor, these other policies raise costs and
reduce allowance prices without affecting total emissions.
Lessons
First, good data are potentially important for sound allowance allocation and cap-setting decisions
to avoid the type of over-allocation that occurred in the EU ETS’s Phase I.
Second, to avoid an artificial price collapse at the end of a compliance period, it is necessary to
allow for banking from one period to the next. The European system did not do this in Phase I, and the
unsurprising result was that Phase I allowance prices fell to zero as that period came to a close.
Third, more broadly, as with the California system, the EU ETS illustrates the perverse outcomes
that are fostered when so-called “complementary policies” are put in place under the cap of a cap-and-
trade system, particularly in the absence of a price floor. Unless those policies address sources outside of
the cap or other market failures, they relocate emissions, drive up aggregate abatement costs, and depress
allowance prices.
Fourth, granting free allowances to selected sectors is a poor way to deal with competitiveness
concerns, though it may serve a useful political function. When the allocations are not linked to
production, they do not affect marginal costs. Thus, incentives to increase output or to relocate
production or investment in other jurisdictions remain unchanged.
Fifth, on the other hand, the history of the EU ETS shows that it can be possible to move over
time from a regime of generally free allowances to one in which most are auctioned.
Other Cap-and-Trade Systems
Historically, several countries implemented systems of tradable rights for ozone depleting
substances (ODS) during the ODS phasedown from 1991 to 2000 under the 1987 Montreal Protocol
(Klaassen 1999; U.S. Environmental Protection Agency 2014). In principle, an international CO2 cap-
and-trade system has also operated since 2008 under the Kyoto Protocol: Annex I countries that have
signed and ratified the Kyoto Protocol can sell their emission reductions beyond their compliance
obligations to other Annex I parties with compliance obligations. However, because the trading agents
are nations, rather than firms, there has been little activity, as anticipated (Hahn and Stavins 1999).
Currently, CO2 cap-and-trade systems are in various stages of development in a number of
countries around the world, including Japan (Sopher and Mansell 2014a), South Korea (Park and Hong
2014), Kazakhstan (Kossoy et al 2014), and Switzerland (Sopher and Mansell 2014b). Most importantly,
16
China began municipal and provincial pilot trading systems in 2013 (Kossoy et al 2014), and on
September 25, 2015, President Xi Jinping announced that China will launch a national CO2 cap-and-trade
system covering key industries in 2017 (Cunningham 2015).
Cap-and-trade systems have also been proposed in other countries at levels of governance ranging
from sub-municipal to national (Kossoy, et al. 2014; Organization for Economic Cooperation and
Development and World Bank Group 2015). Notably, the government of Ontario has recently announced
a CO2 cap-and-trade system to be linked to Quebec’s system and thus to California’s (Government of
Ontario 2015). In addition, the Clean Power Plan, finalized on August 3, 2015 and aimed at CO2
emissions from electricity generators, both enables and encourages state-level and multi-state emissions
trading (U.S. Environmental Protection Agency 2015). This rule will be subject to serious legal
challenges, however (Potts and Zoppo 2015).
KEY LESSONS
While there has been a significant amount of positive experience over the past thirty years with
the use of cap-and-trade policies for environmental protection, the design and performance of cap-and-
trade systems have varied. That experience has lessons for system design and for identifying future
applications, as well as for climate change policy.
Key Lessons for System Design
Most important, cap-and-trade has long since proven to be environmentally effective and
economically cost-effective relative to traditional command and control approaches. Less flexible systems
would not have led to the technological change that may have been induced by market-based instruments
(Keohane 2003; Schmalensee and Stavins 2013), nor the induced process innovations that have resulted
(Doucet and Strauss 1994).
Transactions costs can be low enough to permit considerable efficiency-enhancing trade among
sophisticated entities, particularly if, in contrast to early U.S. experience with emissions offset systems,
prior approval of trades is not required. It is clear from theory and experience that a robust market
requires a cap that is significantly below BAU emissions. In addition, it has been shown to be important
for final rules (including those for allowance allocation) to be established and accurate data supplied well
before commencement of a system’s first compliance period to avoid unnecessary price volatility. High
levels of compliance in a downstream system can be obtained with accurate emissions monitoring
combined with significant penalties for non-compliance.
Provisions for banking of allowances have proven to very important. Such inter-temporal trading
represented a large share of the realized gains from trade in the lead phasedown and SO2 allowance
17
trading. Moreover, the absence of banking provisions can lead to price spikes (RECLAIM) and price
collapses (EU ETS).
In addition, of course, a changing economy can render a cap non-binding (RGGI, EU ETS) or
drive prices to excessive levels (RECLAIM). Hence, there is a distinct role in cap-and-trade systems for
price collars, which reduce the risk of unanticipated allowance price changes and price volatility by
combining an auction price floor with an allowance reserve (RGGI, AB-32).
Economy-wide systems have been shown to be feasible (AB-32), although downstream, sectoral
programs have been more commonly employed (RGGI, EU ETS). In the context of climate policy, CO2
emissions trading programs have inevitably been downstream and limited in scope of coverage, in
contrast with textbook, upstream trading of rights associated with the carbon content of fossil fuels.
The allocation of allowances is inevitably a major political issue, because of the large
distributional impacts that can be involved. Free allowance allocation has proven abler to build political
support, although it foregoes the opportunity to cut the program’s overall social cost by auctioning
allowances and using the proceeds to cut distortionary taxes (SO2 allowance trading, AB-32). On the
other hand, experience has revealed that political pressures exist to use auction revenue not to cut such
taxes but to fund new or existing environmental programs or relieve deficits (AB-32, RGGI). Indeed,
cap-and-trade allowance auctions can and have generated very significant revenue for governments
(RGGI, AB-32).
Another prominent political concern when cap-and-trade systems have been designed has been
the possibility of emissions leakage and adverse competitiveness impacts. Of course, virtually any
meaningful environmental policy will increase production costs and thereby could raise these concerns,
but this issue has been more prominent when cap-and-trade instruments have been considered. In
practice, leakage from cap-and-trade systems can range from non-existent (lead phasedown) to potentially
quite serious (RGGI). It is most likely to be significant for programs of limited geographic scope,7
particularly in the power sector because of interconnected electricity markets (RGGI, AB32). Attempts to
reduce leakage and competitiveness threats through free allocation of allowances per se does not address
the problem (EU ETS), but an output-based updating allocation can do so (AB-32).
Carbon pricing (through cap-and-trade or taxes) may be necessary to address climate change, but
it is surely not sufficient. Abatement costs can be reduced by complementary policies that address other
market failures, such as principal-agent problems associated with energy-efficiency decisions in rental
properties. But actual suites of so-called “complementary policies” that have emerged from political
7 For this and other reasons, linkage between cap-and-trade systems and linkages with other types of policies in other jurisdictions is likely to become increasingly important in the future, because such linkage can reduce abatement costs, leakage, and price volatility, and can restrain market power (AB-32).
18
processes have instead addressed emissions under the cap, thereby relocating rather than reducing
emissions, driving up abatement costs, and suppressing allowance prices (AB-32, EU ETS).
Key Lessons for Identifying New Applications
Cap-and-trade instruments are now considered for a wide range of environmental problems,
ranging from endangered species preservation to global climate change. Experience can offer some
guidance to the conditions under which such approaches are most likely to work well, and when they may
face the greatest difficulties (Stavins 2007).
First, the more the cost of abating pollution differs among sources, the greater the cost savings a
market-based system – whether cap-and-trade or tax – is likely to produce, relative to conventional
regulations (Newell and Stavins 2003). For example, it was clear early on that SO2 abatement cost
heterogeneity was great, because of differences in ages of plants and their proximity to sources of low-
sulfur coal (Carlson et al. 2000).
Second, the greater is the degree of mixing of pollutants in the receiving airshed (or watershed),
the more attractive will a market-based system be, relative to a conventional uniform standard.
Applications of cap-and-trade systems have been based either on the reality of uniformly-mixed
pollutants (AB-32, EU ETS, RGGI) or the assumption of uniform mixing (lead phasedown, SO2
allowance trading). In theory, with a non-uniformly mixed pollutant, a cap-and-trade system could lead
to localized hot spots with relatively high levels of ambient concentrations raising distributional issues
and potentially also efficiency issues. The problem can be addressed, in theory, through the use of
ambient permits (Montgomery 1972), as illustrated by the two-zone trading system under RECLAIM, at
the cost of greater complexity.
Third, since the seminal analysis by Weitzman (1974), it is well known that in the presence of
cost uncertainty, the efficiency of a quantity-based (cap-and-trade) system relative to a price-based (tax)
system depends on the pattern of costs and benefits. Subsequent literature has identified additional
relevant considerations favoring one approach or the other (Stavins 1996; Newell and Pizer 2003). But
perhaps more important, theory (Roberts and Spence 1976) and experience (RGGI, AB-32) have shown
that there are efficiency advantages of hybrid systems that combine price and quantity instruments in the
presence of uncertainty.
Fourth, under many circumstances, the equilibrium allowance distribution and hence aggregate
abatement costs of a cap-and-trade system are independent of the initial allowance allocation
(Montgomery 1972; Hahn and Stavins 2012). Hence, the allowance allocation decision can used to build
political support and address equity issues without concern about effects on overall cost-effectiveness.
19
Implications for Climate Change Policy
Taken together, the lessons from thirty years of experience suggest that cap-and-trade merits
serious consideration when regions, nations, or sub-national jurisdictions seek to develop policies to
reduce GHG emissions. And, indeed, this has happened. But because any meaningful climate policy will
have significant impacts on economic activity in many sectors and regions, it is not surprising that
proposals for such policies bring forth significant opposition.
In the United States, political polarization has decimated both moderate Republicans and
moderate Democrats (Schmalensee and Stavins 2013). Whereas Congressional debates about
environmental and energy policy had long featured regional politics, they have become fully and simply
partisan. The failure of cap-and-trade climate policy in the U.S. Senate in 2010 was essentially collateral
damage from a much larger political war.
At the same time, as we noted above, political support has emerged around the world for
employing cap-and-trade systems to address GHG emissions. In international climate negotiations
leading up to the Paris conference in late 2015, many parties endorsed key roles for regional, national, and
sub-national carbon markets, and broad recognition emerged of the importance of linkage among these
systems.
It remains possible that three decades of high receptivity in the United States, Europe, and other
parts of the world to cap-and-trade will turn out to be no more than a relatively brief departure from a
long-term trend of reliance on conventional command and control regulation. But in light of the generally
positive experience with cap-and-trade, we are inclined to the more optimistic view that the recent
tarnishing of cap-and-trade in U.S. political discourse will itself turn out to be a temporary departure from
a long-term trend of increasing reliance on market-based environmental policy instruments.
20
Table 1 Major Cap-and-Trade Experiences
System Geographic
Scope Coverage
& Sectors
Time Period
Allowance Allocation
Method
Cost Containment Mechanisms
Environmental and
Economic Performance
Leaded Gasoline Phasedown
USA Gasoline
from Refineries
1982-1987 Free Banking Phasedown completed successfully, faster than anticipated, with cost savings of $250 million/year
Sulfur Dioxide Allowance Trading
USA SO2 from Electric Power
1995-2010 Free Banking Cut SO2 emissions by half, with cost savings of $1 billion/year; but market closed due to regulatory of judicial actions
Regional Clean Air Incentives Market (RECLAIM)
South Coast Air Quality
Management District, CA
NOx & SO2 from Electric Power & Industrial Sources
1993-present
Free ---
Emissions lower than with parallel regulations; un-quantified cost savings; electricity crisis caused allowance price spike and temporary suspension of market
NOX Trading in the Eastern United States
12-21 U.S. States
NOx from Electric Power & Industrial Sources
1999-2008 Free --- Significant price volatility in first year; NOx emissions declined from 1.9 (1990) to 0.5 million tons (2006); cost savings 40-47 percent
Regional Clean Air Incentives Market (RECLAIM)
South Coast Air Quality
Management District, CA
NOx & SO2 from Electric Power & Industrial Sources
1993-present
Free ---
Emissions lower than with parallel regulations; un-quantified cost savings; electricity crisis caused allowance price spike and temporary suspension of market
Regional Greenhouse Gas Initiative
Nine northeastern U.S. States
CO2 from Electric Power
2009-present
Nearly 100%
Auction
Banking, Cost Containment
Reserve, Auction Reservation Price
Cap non-binding then barely binding due to low natural gas prices; has generated more than $1 billion for participating states
AB-32 Cap-and-Trade California, USA
CO2 from Electric Power,
Industrial, & Fuels
2013- 2020 Transitions from Free to Auction
Banking, Allowance Price
Containment Reserve, Auction Reservation Price
Covers 85% of emissions; reduces competitiveness effects w/output-based updating (OBU) allocation; linked with Quebec cap-and-trade system
European Union Emissions Trading System
27 EU Member
States plus Iceland,
Lichtenstein, & Norway
CO2 from Electric Power, Large
Industrial, & Aviation
2005-2020
Transitions from Free
to Increased
Use of Auctions
Limited Banking, previous use of
offsets from CDM
Over-allocation by member states in pilot phase; suppressed allowance prices due to Acomplementary policies,@ CDM glut, slow economic recovery
21
REFERENCES
Anderson, R. 1997. The U.S. Experience with Economic Incentives in Environmental Pollution Control Policy Environmental Law Institute, Washington, D.C.
Anderson, R. C., L. A. Hofmann, and M. Rusin. 1990. The Use of Economic Incentive Mechanisms in Environmental Management. Research Paper 51, American Petroleum Institute, Washington, D.C.
Banzhaf, H. Spencer, Dallas Burtraw, David Evans, and Alan Krupnick. 2006. Valuation of Natural Resource Improvements in the Adirondacks. Land Economics, 82(4): 445-464.
Bellas, Allen S., and Ian Lange. 2011. Evidence of Innovation and Diffusion under Tradable Permit Programs. International Review of Environmental and Resource Economics 5(1): 1–22.
Burtraw, Dallas, Alan J. Krupnick, Erin Mansur, David Austin, and Alan Farrell. 1998. The Costs and Benefits of Reducing Air Pollution Related to Acid Rain. Contemporary Economic Policy 16: 379-400.
Burtraw, Dallas, Danny Kahn, and Karen Palmer. 2006. CO2 Allowance Allocation in the Regional Greenhouse Gas Initiative and the Effect on Electricity Investors. The Electricity Journal, Volume 19, Issue 2 (March), pp. 79-90.
Burtraw, Dallas, and Sarah Jo Szambelan. 2010. U.S. emissions trading markets for SO2 and NOx. Permit Trading in Different Applications, Bernd Hansjürgens (ed.), New York: Routledge.
Bushnell, James, Carla Peterman, and Catherine Wolfram. 2008. Local Solutions to Global Problems: Climate Change Policy and Regulatory Jurisdiction. Review of Environmental Economics and Policy, Vol. 2 (Summer): 175-193.
Butler, T. J., Vermeylen, F. M., Rury, M., Likens, G. E., Lee, B., Bowker, G. E., & McCluney, L. 2011. Response of ozone and nitrate to stationary source NO x emission reductions in the eastern USA. Atmospheric Environment, 455, 1084-1094.
California Environmental Protection Agency. 2014. Assembly Bill 32 Overview. Air Resources Board.
California Environmental Protection Agency. 2015. Low Carbon Fuel Standard Credit Trading Activity Report, August 2015 Report (posted September 8, 2015).
California Legislative Analyst’s Office. 2015. Governor’s May Revision: 2015-16 Cap-and-Trade Expenditure Plan. Sacramento, May 17.
Carlson, Curtis, Dallas Burtraw, Maureen Cropper, and Karen Palmer. 2000. SO2 Control by Electric Utilities: What Are the Gains from Trade? Journal of Political Economy 108: 1292-326.
Chestnut, Lauraine G., and David M. Mills. 2005. A Fresh Look at the Benefits and Costs of the US Acid Rain Program. Journal of Environmental Management, 77(3): 252-266.
Climate Policy Initiative. 2015. California Carbon Dashboard. http://calcarbondash.org/
Convery, Frank, and Luke Redmond. 2007. Market and Price Developments in the European Union Emissions Trading Scheme. Review of Environmental Economics and Policy 1:66-87.
Cunningham, Edward A. 2015. China’s New Plans for a Cap and Trade System Just Might Work. Foreign Policy, October 6.
Deschenes, Olivier, Michael Greenstone, and Joseph S. Shapiro. 2012. Defensive investments and the demand for air quality: Evidence from the NOx budget program and ozone reductions. No. w18267. National Bureau of Economic Research.
22
Doucet, Joseph A., and Todd Strauss. 1994. On the Bundling of Coal and Sulfur Dioxide Emissions Allowances. Energy Policy, Volume 22, Number 9, pp. 764-770.
Ellerman, A. Denny, and Barbara K. Buchner. 2007. The European Union Emissions Trading Scheme: Origins, Allocation, and Early Results. Review of Environmental Economics and Policy, volume 1, number 1, pp. 66-87.
Ellerman, A. Denny, and Barbara K. Buchner. 2008. Over-allocation or abatement? A preliminary analysis of the EU ETS based on the 2005–06 emissions data. Environmental and Resource Economics, 412, 267-287.
Ellerman, A. Denny, Paul L. Joskow, Richard Schmalensee, Juan-Pablo Montero, and Elizabeth M. Bailey. 2000. Markets for Clean Air: The U.S. Acid Rain Program. Cambridge, UK: Cambridge University Press.
Ellerman, A. Denny, Paul L. Joskow, and David Harrison. 2003. Emissions Trading in the U.S.: Experience, Lessons and Considerations for Greenhouse Gases. Prepared for the Pew Center on Global Climate Change.
Ellerman, A. Denny, and Juan-Pablo Montero (1998), AThe Declining Trend in Sulfur Dioxide Emissions: Implications for Allowance Prices@, Journal of Environmental Economics and Management 36:26-45.
European Commission. 2012. Emissions Trading System. http://ec.europa.eu/clima/policies/ets/index_en.htm.
Farrell, Alan. 2000. The NOx Budget: A Look at the First Year. The Electricity Journal, 13(2), 83-93.
Fowlie, Meredith, Stephen P. Holland, and Erin T. Mansur. 2012. What Do Emissions Markets Deliver and to Whom? Evidence from Southern California’s NOx Trading Program. American Economic Review, Vol. 102, No. 2 (April), pp. 965-993.
Goulder, Lawrence H. 1995. Environmental Taxation and the ‘Double Dividend’: A Reader’s Guide. International Tax and Public Finance 2(2).
Goulder, Lawrence H., and Robert N. Stavins. 2011. Challenges from State-Federal Interactions in U.S. Climate Change Policy. American Economic Review Papers and Proceedings, volume 101, number 3, May, pages 253-257.
Government of Ontario. 2015. Cap and Trade System to Limit Greenhouse Gas Pollution in Ontario. http://news.ontario.ca/opo/en/2015/04/cap-and-trade-system-to-limit-greenhouse-gas-pollution-in-ontario.html
Hahn, Robert W. 1989. Economic Prescriptions for Environmental Problems: How the Patient Followed the Doctor’s Orders. Journal of Economic Perspectives 3:95-114.
Hahn, Robert W., and Gordon L. Hester. 1989. Marketable Permits: Lessons for Theory and Practice. Ecology Law Quarterly 16:361-406.
Hahn, Robert W., and Robert N. Stavins. 1999. What Has the Kyoto Protocol Wrought? The Real Architecture of International Tradeable Permit Markets. Washington, D.C.: The AEI Press.
Hahn, Robert W., and Robert N. Stavins. 2012. The Effect of Allowance Allocations on Cap-and-Trade System Performance. The Journal of Law and Economics 54(4), 2011 (published August, 2012), pp. S267-S294.
Hansjürgens, B., 2011. Markets for SO2 and NOx—what can we learn for carbon trading?. Wiley Interdisciplinary Reviews: Climate Change, 24, 635-646.
Hibbard, Paul J., Susan F. Tierney, Andrea M. Okie, and Pavel G. Darling. 2011. The Economic Impacts of the Regional Greenhouse Gas Initiative on Ten Northeast and Mid-Atlantic States. Boston: Analysis Group.
23
Johnson, Scott Lee, and David M. Pekelney. 1996. Economic Assessment of the Regional Clean Air Incentives Market: A New Emissions Trading Program for Los Angeles. Land Economics Vol. 72, No. 3, pp. 277-297.
Joskow, Paul L., and Richard Schmalensee. 1998. The Political Economy of Market-based Environmental Policy: The U.S. Acid Rain Program. Journal of Law and Economics41(1): 37– 83.
Keohane, Nathaniel O. 2003. What Did the Market Buy? Cost Savings under the U.S. Tradeable Permits Program for Sulfur Dioxide. Working Paper YCELP-01-11-2003, Yale Center for Environmental Law and Policy.
Kerr, Suzi, and David Maré. 1997. Efficient Regulation Through Tradeable Permit Markets: The United States Lead Phasedown. Department of Agricultural and Resource Economics, University of Maryland, College Park, Working Paper 96-06 (January).
Kerr, Suzi, and Richard Newell. 2003. Policy-Induced Technology Adoption: Evidence from the U.S. Lead Phasedown. Journal of Industrial Economics, 51(3), pp. 317-343.
Klaassen, Ger. 1999. Emissions trading in the European Union: practice and prospects. In S. Sorrell and J. Skea Eds., Pollution for Sale: Emissions Trading and Joint Implementation pp. 83-100. Cheltenham, UK: Edward Elgar Publishing.
Kossoy, A., Opperman, K., Platanova-Oquab, A., Suphachalasai, S., Höhne, N., Klein, N., Gilbert, A.,…Wong, L. 2014. State and Trends of Carbon Pricing 2014. Washington, DC: World Bank.
Kroft, P. Jason, and Jonathan Drance. 2015. Examining California’s and Quebec’s Cap-and-Trade Systems. Stikeman Elliot online post, http://www.canadianenergylaw.com/2015/05/articles/climate-change/examining-california-and-quebecs-capandtrade-systems/
Kruger, Joseph, Wallace E. Oates, and William a Pizer. 2007. Decentralization in the EU Emissions Trading Scheme and Lessons for Global Policy. Review of Environmental Economics and Policy 1: 112-133.
Löfgren, Asa, Dallas Burtraw, Markus Wråke, and Anna Malinovskaya. 2015. Architecture of the EU Emissions Trading System in Phase 3 and the Distribution of Allowance Asset Values. Discussion Paper 15-45. Resources for the Future.
Market Advisory Committee to the California Air Resources Board. 2007. Recommendations for Designing a Greenhouse Gas Cap-and-Trade System for California.
Montgomery, David W. 1972. Markets in Licenses and Efficient Pollution Control Programs. Journal of Economic Theory 395-418.
Newell, Richard G., and William Pizer. 2003. Regulating Stock Externalities Under Uncertainty. Journal of Environmental Economics and Management 45:416-432.
Newell, Richard G, and K. Rogers. 2007. The market-based lead phasedown. Moving to Markets in Environmental Regulation: Lessons from Twenty Years of Experience, pp. 173-193. Edited by Jody Freeman and Charles Kolstad. Oxford: Oxford University Press.
Newell, Richard G., and Robert N. Stavins. 2003. Cost Heterogeneity and the Potential Savings from Market-Based Policies. Journal of Regulatory Economics 23(1):43-59.
Nichols, Albert L. 1997. Lead in Gasoline. Richard D. Morgenstern, ed., Economic Analyses at EPA: Assessing Regulatory Impact, pp. 49-86. Resources for the Future, Washington, D.C.
Organization for Economic Cooperation and Development and World Bank Group. 2015. The FASTER Principles for Successful Carbon Pricing: An Approach Based on Initial Experience. Washington, D.C.
24
Ozone Transport Commission. 2003. NOX Budget Program: 1999-2002 Progress Report. See: http://www2.epa.gov/sites/production/files/2015-08/documents/otcreport.pdf
Park, Hojeong, and Won Kyung Hong. 2014. Korea’s Emission Trading Scheme and Policy Design Issues to Achieve Market-Efficiency and Abatement Targets. Energy Policy, Volume 75, December.
Popp, David. 2003. Pollution Control Innovations and the Clean Air Act of 1990. Journal of Policy Analysis and Management 22(4): 641– 60.
Potts, Brian H., and David R. Zoppo. 2015. Will the EPA’s Final Clean Power Plan Make it Through the Courts? The Electricity Journal, forthcoming (October).
Ranson, Matthew, and Robert N. Stavins. 2013. Post-Durban climate policy architecture based on linkage of cap-and-trade systems. Chicago Journal of International Law 13: 403–438.
Rico, Renee. 1995. The U.S. Allowance Trading System for Sulfur Dioxide: An Update of Market Experience. Environmental and Resource Economics 5(2):115-129.
Roberts, Mark, and Michael Spence. 1976. Effluent Charges and Licenses under Uncertainty. Journal of Public Economics 5(3-4), 193-208.
Schmalensee, Richard, and Robert N. Stavins. 2013. “The SO2 Allowance Trading System: The Ironic History of a Grand Policy Experiment.” Journal of Economic Perspectives, Volume 27, Number 1, Winter, pp. 103-122.
Sijm, Jos, Karsten Neuhoff, and Yihsu Chen. 2006. “CO2 Cost Pass Through and Windfall Profits in the Power Sector.” Climate Policy, Volume 6, Number 1, 2006, pp. 49-72.
Sopher, P., & Mansell, A. 2014a. Japan. The World’s Carbon Markets: A Case Study Guide to Emissions Trading. International Emissions Trading Association.
Sopher, P., & Mansell, A. 2014b. Switzerland. The World’s Carbon Markets: A Case Study Guide to Emissions Trading. International Emissions Trading Association.
South Coast Air Quality Management District. 2015. RECLAIM Trade Information, Accessed September 7, 2015.
Stavins, Robert N. 1996. Correlated Uncertainty and Policy Instrument Choice. Journal of Environmental Economics and Management 30:218-232.
Stavins, Robert N. 2007. Market-Based Environmental Policies: What Can We Learn From U.S. Experience (and Related Research)? Moving to Markets in Environmental Regulation: Lessons from Twenty Years of Experience, eds. Jody Freeman and Charles Kolstad, pp. 19-47. New York: Oxford University Press.
Sue Wing, Ian and Marek Kolodziej. 2008. The Regional Greenhouse Gas Initiative: Emission Leakage and the Effectiveness of Interstate Border Adjustments. Regulatory Policy Program Working Paper RPP-2008-03. Cambridge, MA: Mossavar-Rahmani Center for Business and Government, John F. Kennedy School of Government, Harvard University.
Swift, Byron. 2004. Emissions Trading and Hot Spots: A Review of the Major Programs. Environment Reporter 35(19): 1–16.
U.S. Energy Information Administration. 2012. Electricity Net Generation: Total (All Sectors), 1949–2011. Table 8.2a, Annual Energy Review 2011.
U.S. Environmental Protection Agency. 1985. Office of Policy Analysis. Costs and Benefits of Reducing Lead in Gasoline, Final Regulatory Impact Analysis. Washington, D.C.
25
U.S. Environmental Protection Agency. 2004. Evaluating Ozone Control Programs in the Eastern United States: Focus on the NOx Budget Trading Program. See: http://www.epa.gov/airtrends/2005/ozonenbp.pdf#page=1
U.S. Environmental Protection Agency. 2011. National Emissions Inventory (NEI) Air Pollutant Emissions Trends Data: 1970–2011. See: http://www3.epa.gov/ttnchie1/trends/
U.S. Environmental Protection Agency. 2014. Chlorofluorocarbon Taxes and Allowance Trading. See: http://yosemite1.epa.gov/EE/epa/eed.nsf/dcee735e22c76aef85257662005f4116/86a2750ed83fe1d88525774200597f3a!OpenDocument
U.S. Environmental Protection Agency. 2015. Carbon Pollution Emission Guidelines for Existing Stationary Sources: Electric Utility Generating Units. August 3, 2015. See: http://www2.epa.gov/cleanpowerplan.
Weitzman, Martin. 1974. Prices vs. Quantities. Review of Economic Studies 41:477-491.