Embed Size (px)
Citation preview
Immigration in Two ActsThe immigration laws of 1965 and 1990 represent perhaps two of the most important reforms to U.S. immigration policy in the last century. After more than 40 years of an immigration system grounded on the basis of race and national origin, favoring immigrants from certain regions of the world over others, the 1965 law abolished the national origins quotas of the 1920s and established a more equitable preference system based on skills and family relations. Twenty-five years later, Congress once again overhauled U.S. immigration policy in 1990 and built on the structure and principles of the system set up in 1965 to attract even more educated and diverse immigrants. While both laws had signifi cant impacts on immigration trends and characteristics for decades after their enactment, they were also refl ections of the specific economic and political realities of their time. Both laws had unintended consequences or were often overshadowed by political and economic trends in the United States and around the world.
Twenty-fi ve years after the last major immigration reforms passed in 1990, this issue brief looks back and provides an overview of the political context, major provisions, and impacts of the immigration acts of 1965 and 1990.
November 2015
2
Immigration and Nationality Act of 1965
Background and Political Context
The 1965 Immigration and Nationality Act—also called the Hart-Celler Act after its original sponsors, Rep. Emanuel Celler (D-NY) and Sen. Philip Hart (D-MI)—replaced the national origins quota system that had structured U.S. immigration policy since the 1920s with a preference system based on immigrants’ skills and family relations. In the 1960s, broad social change and emphasis on civil rights and racial equality in the United States brought attention to the quota-based immigration system. Foreign policy concerns over an immigration system that actively weakened the country’s ability to conduct business abroad and limited its influence during the Cold War also played a major part in swaying support toward ending an ethnic-centric system that was viewed by many as discriminatory.
Immigration Law Pre-1965
Before the 1965 act, the U.S. immigration system was governed by restrictive immigration laws from the 1920s—notably, the 1921 Emergency Quota Law and the National Origins Quota Act of 1924.1 Both acts were a response to the shifting wave of immigrants from mainly Northern European countries to Southern and Eastern Europe (e.g., Poland and Italy). The laws of the 1920s also sought to decrease the number of immigrants entering the country after the foreign-born population in the nation reached 13.9 million in 1920—a record high at the time.2 The laws established country quotas that were based on the national origins of the U.S. foreign-born population at a particular date in time according to Census figures. The 1924 act established an overall numeral limit of 150,000 immigrants per year and set the annual quotas for 1924 through 1927 by national origin in proportion to the national origin makeup of the population as of the 1890 U.S. Census. After 1927, the quotas would be set according to the 1920 Census.3 These quotas were only set for European countries—strongly favoring Western and Northern Europe over Eastern and Southern Europe—since immigration from Asia and some other areas of the world were already restricted by several previous bans.4 Immigration from the Western Hemisphere was not restricted at the time and circular migration was popular among Mexican workers, particularly after the establishment of the Bracero program in 1942 (discussed later).
Before the major reforms in 1965, two significant immigration laws were passed in the 1940s and 1950s. First, the Nationality Act of 1940 sought to codify nationality law in the United States with several provisions on eligibility for citizenship based on birth and requirements for naturalization, including residency and English knowledge. The act also focused on specific activities that render individuals ineligible for citizenship, including those involved with organizations that oppose the U.S. government or organized government in general and those convicted of avoiding a draft or deserting military service.5 In 1952, the Immigration and Nationality Act (INA) was passed. The law—also known as the McCarran-Walter Act after its authors, Sen. Pat McCarran (R-NV) and Rep. Francis Walter (D-PA)—collected the various existing immigration statutes and organized them into a single body of law, the structure of which remains mostly intact today.6 The act upheld the national origins quota system from the 1920s, but it officially ended the exclusion of Asian immigrants with a very low, racially based quota of about 100 per year, and it introduced the first preference system based on skills and family reunification. Set against the backdrop of the Cold War and the perceived threat of communism, the act specifically highlighted grounds of exclusions for immigrants, such as political extremism and any association with communism.7
3
Influence of Civil Rights Movement
In the midst of the social changes occurring in the late 1950s and 1960s, many Americans and politicians began to express dissatisfaction with an immigration system that many felt was outdated at best and discriminatory and racist at worst. The abolition of the origins quota system received strong support from both Democrats and Republicans at the time, and by 1956, both parties’ platforms advocated for an end to the country-specific quotas.8 In a speech to the American Committee on Italian Migration in 1963 ahead of the reform debate in Congress, President John F. Kennedy referred to the quota system as “nearly intolerable.”9 Many specifically drew a link between the civil rights movements of the time and the necessity of changing the quota system, including Vice President Hubert Humphrey. After the Civil Rights Act was signed in 1964, Humphrey said: “We have removed all elements of second-class citizenship from our laws. …We must, in 1965, remove all elements in our immigration law which suggest there are second- class people.”
It was clear from comments made by many at the time that the bill was not expected to be of much consequence to the number of immigrants in the country or its demographic makeup. It was seen as a way to bring the nation’s immigration system in line with the anti-racist and anti-discriminatory principles of the decade and give all would-be immigrants from all nations an equal chance at immigration without regard to their ethnicity. At the bill’s signing ceremony, President Lyndon Johnson highlighted this sentiment:
This bill that we will sign today is not a revolutionary bill. It does not affect the lives of millions. It will not reshape the structure of
our daily lives, or really add importantly to either our wealth or our power. Yet it is still one of the most important acts of this Congress
and of this administration. For it does repair a very deep and painful flaw in the fabric of American justice. It corrects a cruel and
enduring wrong in the conduct of the American Nation.
Foreign Policy Concerns
Foreign policy concerns were also central to swaying support for an end to the ethnic-centric immigration system in the United States. In fact, the outline for the 1965 act was born out of a report from the Commission on Immigration and Naturalization formed by President Harry Truman in 1952 that heavily emphasized foreign policy concerns in its immigration reform recommendations.10 Both the commission and many proponents of reforming the immigration laws argued that the quotas had negative implications for U.S. foreign policy abroad. Testifying before Congress, then-Secretary of State Dean Rusk stressed the implications of U.S. immigration system principles abroad, saying: “The rest of the world watches us closely to see whether or not we live up to the great principles we have proclaimed and promoted. Our blemishes delight our enemies and dismay our friends.”11
Other proponents stressed America’s ability to garner trust and support from emerging nations in Asia and Africa or its ability to work with and influence nations in its own hemisphere, many of which had come together to ban discriminatory immigration provisions and pressure the United States to follow suit.12 Echoing similar sentiments to Rusk, Sen. Kenneth Keating (R-NY) asked, “If we are willing to continue laws discriminating against individuals because of race or national origin, what trust can we in turn expect from emerging nations of Africa and Asia?”13
Much like many of the segregationist policies of its time, the national origins quota immigration system cast a shadow over the United States as it took on its role as a post-World War II superpower espousing ideals of freedom and fighting back communism around the world.
4
Opposition and Final Passage
Most of the opposition to the immigration reforms of 1965 came from conservative Southern Democrats citing concerns over an “inundation” of poor immigrants from the developing world and nativist objections. For example, Sen. Sam J. Ervin (D-NC) argued that the United States was fundamentally a European country and that its quota system was “like a mirror reflecting the United States.” He added: “The people of Ethiopia have the same right to come to the United States under this bill as the people from England, the people of France, the people of Germany, [and] the people of Holland. … With all due respect to Ethiopia, I don’t know of any contributions that Ethiopia has made to the making of America.”14 Many key conservative Democrats, like Rep. Francis Walter (D-PA), then-chair of the House Subcommittee on Immigration and Naturalization, were also able to block immigration reform efforts in Congress for years despite popular support.
In spite of these objections, the bill passed with strong bipartisan support in both the House and the Senate, which were controlled by Democrats at the time. In the House of Representatives, the bill passed by a vote of 326 to 70, with 171 Democrats and 93 Republicans voting in favor. In the Senate, the bill passed by a vote of 76 to 18, with 52 Democrats and 24 Republicans voting in favor.
Major Provisions
The Immigration and Nationality Act of 1965 created an immigration preference system that prioritized family relations and skilled workers—a principle that continues in current immigration law. Overall, the new law continued to limit the amount of available visas per year, establishing a cap of 170,000 annual visas in the Eastern Hemisphere, allowing no more than 20,000 from each individual country. Furthermore, the law established an annual cap of 120,000 visas in the Western Hemisphere, which was the first time any numerical limit had been placed on immigrants from that area.15 The new system granted visas according to the following seven criteria in preference order:
• Unmarried children of U.S. citizens
• Spouses and unmarried children of permanent residents
• Professionals, scientists, and artists of exceptional capability
• Married children, and their spouses and children, of U.S. citizens
• Siblings, and their spouses and children, of U.S. citizens
• Workers in occupations with labor shortages
• Political refugees
The overall quota for the Eastern Hemisphere was divided as follows: about 74 percent of the visas were allotted to the family-reunification preferences; 20 percent were allotted to the two employment-based categories; and 6 percent were allotted for the political refugees. Under the act, two categories of immigrants were not subject to numerical restrictions: immediate relatives, including spouses, children under 21, and parents of U.S. citizens; and “special immigrants.” Special immigrants included certain ministers of religion, certain former employees of the U.S. government abroad, certain persons who lost citizenship (e.g., by marriage or by service in foreign armed forces), and certain foreign medical graduates.16 Neither the preference categories nor the 20,000-per-country limit were applied within the separate 120,000 cap on Western Hemisphere countries.
5
For the first time, the law also called on the Department of Labor to certify that visas issued through the employment-based preference categories would not negatively affect American workers. Specifically, the Department of Labor had to certify that an alien seeking to enter the United States for the purposes of performing skilled or unskilled labor would not adversely affect the wages and working conditions of similarly employed workers in the United States and would only be hired if there were no sufficient workers able, willing, qualified, and available at the time of application.17
Impact of the 1965 Act
The 1965 immigration reforms are often credited as signaling the beginning of a major wave of immigration and shifting the demographic makeup of the immigrant community in the United States. The act’s new quota on the Western Hemisphere—coupled with a phase-out of the Bracero program at the time—is also often cited as the beginning of significant unauthorized immigration to the country.
Foreign-born Population and Legal Immigration
The nationality-specific quota system that preceded the act reflected regional preferences in immigration to the United States: Northern and Western Europeans were viewed as a superior and preferred subcategory of people, while immigration from Southern and Eastern Europe, Asia, and Africa were more strictly restricted. In changing a system from one that favored region, race, and nationality to a system that favored family ties and skills more equitably across nations, the law—in conjunction with unrelated political and economic trends across the world—allowed for an eventual shift in the major sources of immigration to the United States that drifted away from Northern and Western Europe and moved toward other parts of the world, including the Americas and Asia. The emphasis on family reunification specifically as a basis for immigration resulted in families, once established in the United States, continuing to sponsor other relatives, creating larger diasporas from the new immigrant-sending nations.
This emphasis on family ties was not initially intended to spark a demographic shift. At the time, this priority was thought to continue to favor European immigration because of the mostly European-descended population in the United States—in fact, this was a key factor in winning over some of the law’s detractors. However, as political and economic conditions stabilized in Europe in the decades following World War II, demand for visas decreased. Meanwhile, wars in Southeast Asian countries like Cambodia and Vietnam, and later civil strife in Latin America and the Caribbean, increased migration from those areas of the world to the United States.18
In total numbers, the overall flow of immigrants to the United States did significantly increase after the act’s passage. Since 1965, the foreign-born population of the United States has increased from about 9.6 million (or about 5 percent of the total U.S. population) to 45 million in 2015 (about 14 percent of the population). In that time span, new immigrants and their descendants accounted for 55 percent of U.S. population growth, adding 72 million to the total population.19
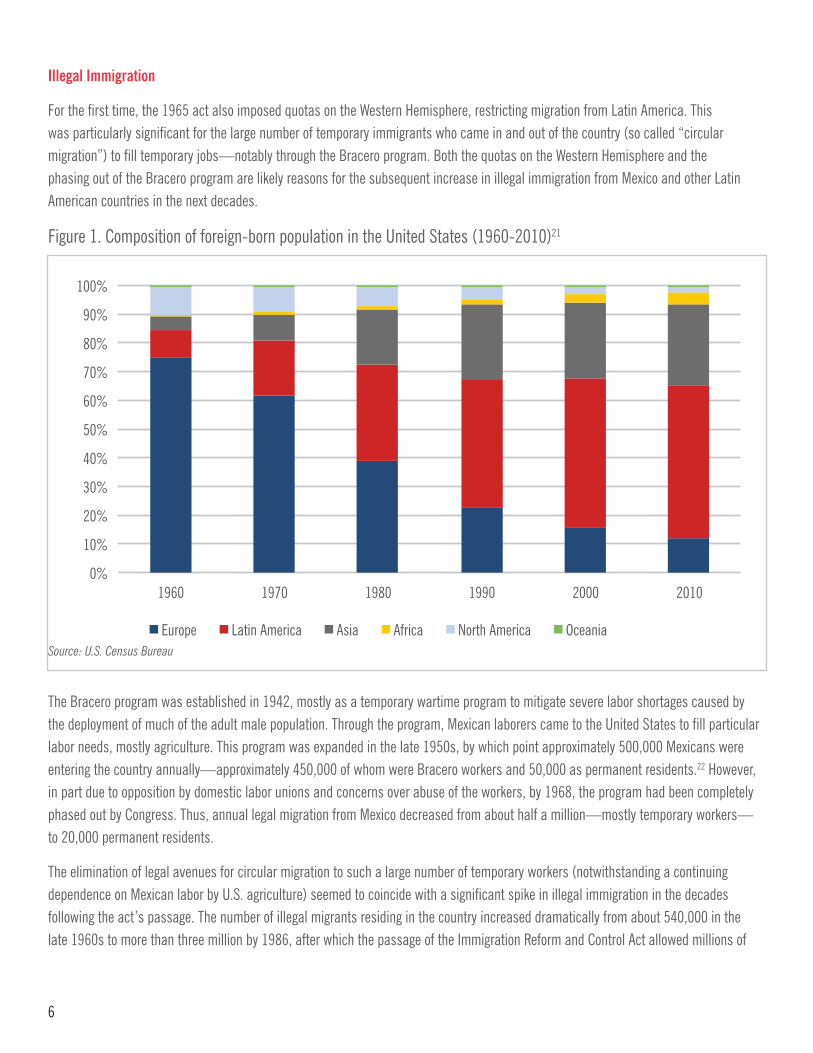
Overall, the major regional sources of immigration to the United States shifted dramatically in the decades following the 1965 act, as more than half of the new immigrants arrived from Latin America and 25 percent came from Asia.20 In 1960, the composition of the foreign-born population in the United States by region of origin (both legal and illegal) was 75 percent European, 9 percent Latin American, and 5 percent Asian. Today, more than 53 percent of the foreign-born population comes from Latin America, while 28 percent comes from Asia, and only 12 percent comes from Europe (Figure 1).
6
Illegal Immigration
For the first time, the 1965 act also imposed quotas on the Western Hemisphere, restricting migration from Latin America. This was particularly significant for the large number of temporary immigrants who came in and out of the country (so called “circular migration”) to fill temporary jobs—notably through the Bracero program. Both the quotas on the Western Hemisphere and the phasing out of the Bracero program are likely reasons for the subsequent increase in illegal immigration from Mexico and other Latin American countries in the next decades.
The Bracero program was established in 1942, mostly as a temporary wartime program to mitigate severe labor shortages caused by the deployment of much of the adult male population. Through the program, Mexican laborers came to the United States to fill particular labor needs, mostly agriculture. This program was expanded in the late 1950s, by which point approximately 500,000 Mexicans were entering the country annually—approximately 450,000 of whom were Bracero workers and 50,000 as permanent residents.22 However, in part due to opposition by domestic labor unions and concerns over abuse of the workers, by 1968, the program had been completely phased out by Congress. Thus, annual legal migration from Mexico decreased from about half a million—mostly temporary workers— to 20,000 permanent residents.
The elimination of legal avenues for circular migration to such a large number of temporary workers (notwithstanding a continuing dependence on Mexican labor by U.S. agriculture) seemed to coincide with a significant spike in illegal immigration in the decades following the act’s passage. The number of illegal migrants residing in the country increased dramatically from about 540,000 in the late 1960s to more than three million by 1986, after which the passage of the Immigration Reform and Control Act allowed millions of
Figure 1. Composition of foreign-born population in the United States (1960-2010)21
Source: U.S. Census Bureau
0%
10%
20%
30%
40%
50%
60%
70%
80%
90%
100%
1960 1970 1980 1990 2000 2010
OceaniaEurope Latin America Asia Africa North America
7
undocumented immigrants to gain legal status. Apprehensions at the border—another indicator of unauthorized entry attempts—also spiked after 1965.23
Immigration Act of 1990
Following the 1965 act, there was a long period during which almost no changes to the immigration laws were made. With the exception of the Refugee Act in 1980, the next time major changes were made to the U.S. legal immigration system came 25 years after the 1965 act in 1990.
Background and Political Context
The Immigration Act of 1990 (“IMMACT90”) was the most significant restructuring of the country’s immigration system since 1965, and it instituted major reforms to the legal immigration system that remain mostly intact today. While the act maintained the basic elements and structure of the immigration system under the 1965 act, including preference categories and numerical limits, it attempted to emphasize educated and skilled immigration by significantly increasing the overall cap for employment-based immigrants and by creating new nonimmigrant temporary work programs.
While enacted in 1990, the act’s major reforms had been circulating for a decade and originated in the late 1970s and early 1980s when the Select Commission on Immigration and Refugee Policy was established to recommend reforms to U.S. immigration policy. After two years, in 1981, the commission released its report with 67 recommendations on legal immigration quotas, illegal immigration, enforcement, and several other facets of immigration law.24 The commission’s report asserted the national importance of immigration, but it stressed that unauthorized immigration had to be curbed. The commission’s chairman, Rev. Theodore Hesburgh, summarized the principles as follows:
We recommend closing the back door to undocumented, illegal migration, opening the front door a little to accommodate
legal migration in the interests of this country, defining our immigration goals clearly and providing a structure to implement
them effectively, and setting forth procedures that will lead to fair and efficient adjudication and administration of U.S. immigration
laws.
The 1986 “amnesty,” the Immigration Reform and Control Act, was an attempt to deal with the “back door” while IMMACT90 represented a shift in focus to legal immigration and the numerical limits on permanent immigration. It sought to address and balance several concerns highlighted by both the commission and members of Congress at the time. Particularly, many worried about the high number of family-based immigrants—particularly uncapped immigrants—in comparison with the number of employment-based immigrants entering the country and sought to set worldwide caps on all categories. Others were concerned that such limits on certain family categories would create larger backlogs and prevent faster reunification of families.25
At the time, members of Congress were also concerned about U.S. competitiveness in the global economy and sought to use legal immigration as a tool in a larger economic plan, stating that “it is unlikely that enough U.S. workers will be trained quickly enough to meet legitimate employment needs, and immigration can and should be incorporated into an overall strategy that promotes the creation of the type of workforce needed in an increasingly global economy.”26 As part of this shift toward economic immigration, Congress tripled the number of employment-based immigrant visas by expanding the preference categories and prioritizing high-skilled workers and other professionals.
8
In 1990, the Democratic Party controlled both houses of Congress while the sitting president, George H.W. Bush, was a Republican. The act, which was introduced to the Senate in February 1989 and was signed into law in November 1990, had substantial bipartisan support. Sen. Edward Kennedy (D-MA) sponsored the act (also known as S. 358), and its four Senate co-sponsors included two Democrats and two Republicans: Alan K. Simpson (R-WY), Daniel Patrick Moynihan (D-NY), Alfonse D’Amato (R-NY), and Christopher J. Dodd (D-CT).
IMMACT90 passed in the Senate by a vote of 81 to 17 and a vote of 231 to 192 in the House of Representatives. In the Senate, 41 Republicans voted to pass the bill (three voted against it), and 40 Democrats voted for the bill (14 voted against it). In the House, 186 Democrats voted for the bill and 65 voted against it. The bill received less support from the House Republicans, with 45 voting for the bill and 127 voting against it.27 President Bush expressed his support of the 1990 Immigration Act when he signed it into law on November 29, 1990, saying that “S. 358 accomplished what this administration sought from the outset of the immigration reform process: a complementary blending of our tradition of family reunification with increased immigration of skilled individuals to meet our economic needs.”28
Major Provisions
The 1990 Immigration Act built on the goals of the 1965 Immigration Act to reflect and balance the primary priorities of the immigration system: family reunification, immigrants with education and skills that are valuable to the economy, and the promotion of diversity. The act significantly expanded legal immigration to the United States—both permanent and temporary—through the creation of new immigrant categories and was the last time major revisions were made to legal permanent immigration policy.
Permanent Legal Immigration
IMMACT90 expanded permanent legal immigration to the United States, setting a flexible cap on worldwide permanent immigration at 675,000, including family-sponsored immigrants, immediate relatives, and employment-based immigrants (Figure 2). While there had previously been only two major employment-based categories, capped at around 54,000 visas per year, the 1990 act allocated 140,000 visas per year for five employment-based preference categories, which prioritized would-be immigrants by skills and professional accomplishments.29 For all immigrant categories, family members of the principal applicant were considered “derivative” applicants and were counted against the same numerical ceilings. For both employment and family-based visas, the act also set per-country limits, stating, “The total number of immigrant visas made available to natives of any single foreign state … in any fiscal year may not exceed 7 percent.”30
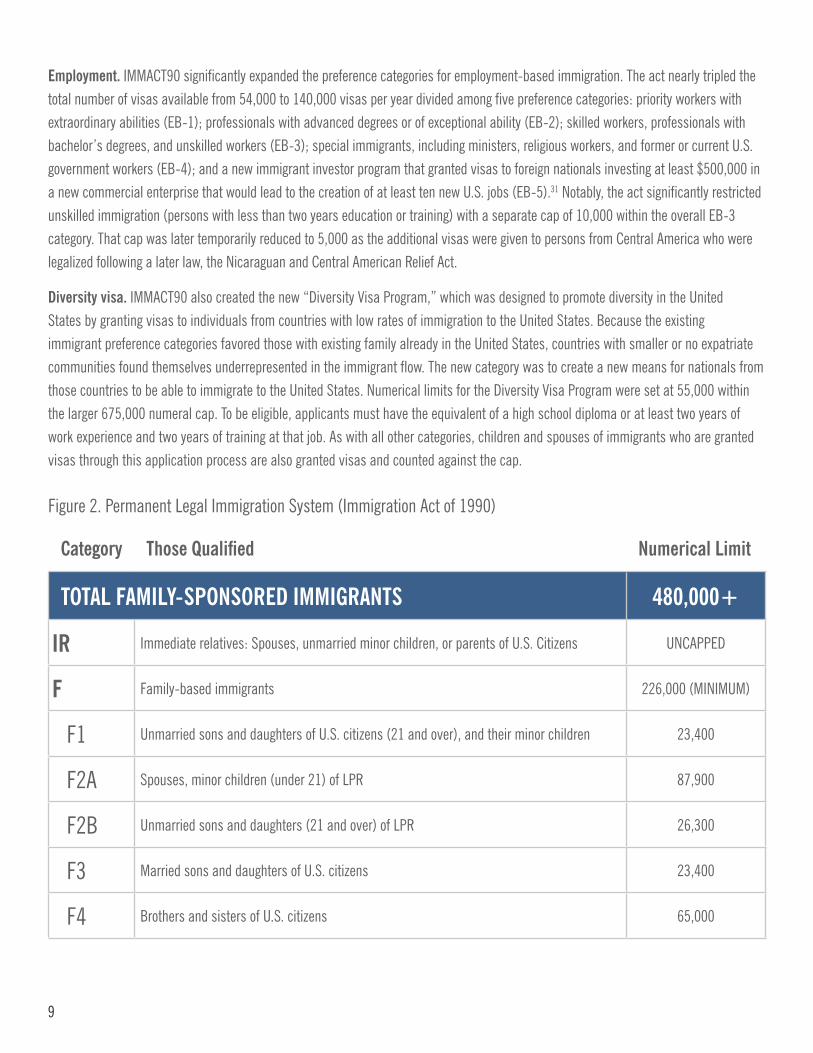
Family. To balance calls for more numerical limitations while ensuring that family reunification remained a priority, a flexible limit of 480,000 visas per year was placed on family visas and a minimum floor was set for the capped categories to ensure those would be available even if immediate relative demand for any single year exceeded expectations. Perhaps the most significant change to family-based preference categories involved the so-called “second-preference” category—immediate relatives of lawful permanent residents, also known as “LPRs” (F2A for spouses and minor children and F2B for adult unmarried children)—which had built a large backlog at the time. Congress significantly increased the visa cap for the second-preference category to 114,200 visas (87,900 for F2A and 26,300 for F2B). The act also exempted three-quarters of the F2A visas from per-country limits to alleviate backlogs from specific countries. Lastly, the act provided 55,000 additional visas per year for the spouses and children of immigrants legalized through the 1986 Immigration Reform and Control Act provisions, which had become another source of great demand in this category.
9
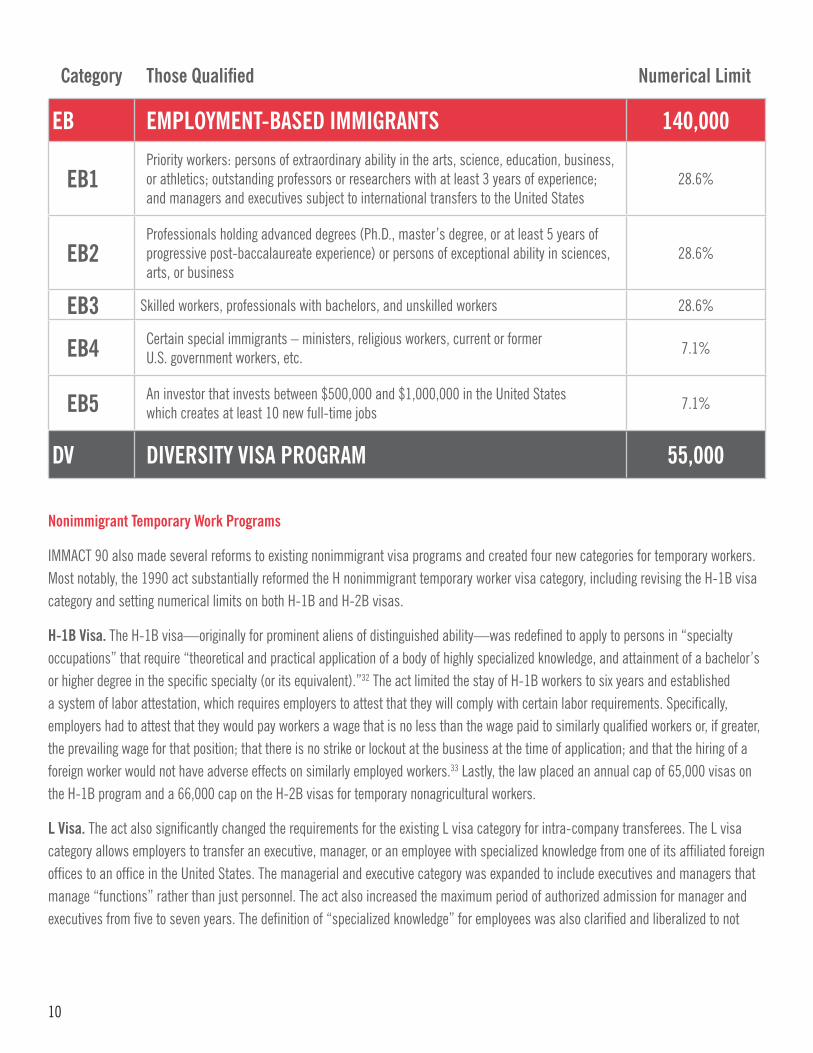
Employment. IMMACT90 significantly expanded the preference categories for employment-based immigration. The act nearly tripled the total number of visas available from 54,000 to 140,000 visas per year divided among five preference categories: priority workers with extraordinary abilities (EB-1); professionals with advanced degrees or of exceptional ability (EB-2); skilled workers, professionals with bachelor’s degrees, and unskilled workers (EB-3); special immigrants, including ministers, religious workers, and former or current U.S. government workers (EB-4); and a new immigrant investor program that granted visas to foreign nationals investing at least $500,000 in a new commercial enterprise that would lead to the creation of at least ten new U.S. jobs (EB-5).31 Notably, the act significantly restricted unskilled immigration (persons with less than two years education or training) with a separate cap of 10,000 within the overall EB-3 category. That cap was later temporarily reduced to 5,000 as the additional visas were given to persons from Central America who were legalized following a later law, the Nicaraguan and Central American Relief Act.
Diversity visa. IMMACT90 also created the new “Diversity Visa Program,” which was designed to promote diversity in the United States by granting visas to individuals from countries with low rates of immigration to the United States. Because the existing immigrant preference categories favored those with existing family already in the United States, countries with smaller or no expatriate communities found themselves underrepresented in the immigrant flow. The new category was to create a new means for nationals from those countries to be able to immigrate to the United States. Numerical limits for the Diversity Visa Program were set at 55,000 within the larger 675,000 numeral cap. To be eligible, applicants must have the equivalent of a high school diploma or at least two years of work experience and two years of training at that job. As with all other categories, children and spouses of immigrants who are granted visas through this application process are also granted visas and counted against the cap.
Figure 2. Permanent Legal Immigration System (Immigration Act of 1990)
Category Those Qualified Numerical Limit
TOTAL FAMILY-SPONSORED IMMIGRANTS 480,000+
IR Immediate relatives: Spouses, unmarried minor children, or parents of U.S. Citizens UNCAPPED
F Family-based immigrants 226,000 (MINIMUM)
F1 Unmarried sons and daughters of U.S. citizens (21 and over), and their minor children 23,400
F2A Spouses, minor children (under 21) of LPR 87,900
F2B Unmarried sons and daughters (21 and over) of LPR 26,300
F3 Married sons and daughters of U.S. citizens 23,400
F4 Brothers and sisters of U.S. citizens 65,000
10
Category Those Qualified Numerical Limit
EB EMPLOYMENT-BASED IMMIGRANTS 140,000
EB1Priority workers: persons of extraordinary ability in the arts, science, education, business, or athletics; outstanding professors or researchers with at least 3 years of experience; and managers and executives subject to international transfers to the United States
28.6%
EB2Professionals holding advanced degrees (Ph.D., master’s degree, or at least 5 years of progressive post-baccalaureate experience) or persons of exceptional ability in sciences, arts, or business
28.6%
EB3 Skilled workers, professionals with bachelors, and unskilled workers 28.6%
EB4 Certain special immigrants – ministers, religious workers, current or former U.S. government workers, etc.
7.1%
EB5 An investor that invests between $500,000 and $1,000,000 in the United States which creates at least 10 new full-time jobs
7.1%
DV DIVERSITY VISA PROGRAM 55,000
Nonimmigrant Temporary Work Programs
IMMACT 90 also made several reforms to existing nonimmigrant visa programs and created four new categories for temporary workers. Most notably, the 1990 act substantially reformed the H nonimmigrant temporary worker visa category, including revising the H-1B visa category and setting numerical limits on both H-1B and H-2B visas.
H-1B Visa. The H-1B visa—originally for prominent aliens of distinguished ability—was redefined to apply to persons in “specialty occupations” that require “theoretical and practical application of a body of highly specialized knowledge, and attainment of a bachelor’s or higher degree in the specific specialty (or its equivalent).”32 The act limited the stay of H-1B workers to six years and established a system of labor attestation, which requires employers to attest that they will comply with certain labor requirements. Specifically, employers had to attest that they would pay workers a wage that is no less than the wage paid to similarly qualified workers or, if greater, the prevailing wage for that position; that there is no strike or lockout at the business at the time of application; and that the hiring of a foreign worker would not have adverse effects on similarly employed workers.33 Lastly, the law placed an annual cap of 65,000 visas on the H-1B program and a 66,000 cap on the H-2B visas for temporary nonagricultural workers.
L Visa. The act also significantly changed the requirements for the existing L visa category for intra-company transferees. The L visa category allows employers to transfer an executive, manager, or an employee with specialized knowledge from one of its affiliated foreign offices to an office in the United States. The managerial and executive category was expanded to include executives and managers that manage “functions” rather than just personnel. The act also increased the maximum period of authorized admission for manager and executives from five to seven years. The definition of “specialized knowledge” for employees was also clarified and liberalized to not
11
include a proprietary knowledge requirement.34 Lastly, the law also made the requirement for the period of prior employment experience with the company more flexible; rather than having been employed by the company in the year immediately preceding admission, an employee must have been employed with the company within the last three years.35
Notably, the 1990 act also statutorily recognized the concept of dual intent for both H-1B and L visa applicants. Normally, to be approved for a nonimmigrant visa, a foreign national must sufficiently demonstrate that they do not intend to remain permanently in the United States and are required to maintain a residence in a foreign country that they do not intend to abandon.36 While the latter foreign residence requirement never applied to L immigrants, section 205(b) of the 1990 act eliminated the foreign residence requirement for H-1B nonimmigrants and exempted both from proving that they did not have immigrant intent.
New Nonimmigrant Categories. The 1990 act also created four new nonimmigrant worker visa categories, the O, P, Q, and R categories. The “O” category was established for nonimmigrants with extraordinary abilities in the sciences, arts, education, business, or athletics. The “P” category allowed for nonimmigrant athletes or entertainers for a particular performance (P-1), artists or entertainers as part of a reciprocal-exchange program (P-2), artists or entertainers for a culturally unique program (P-3), and their spouses or children (P-4). The “Q” category was created for international cultural-exchange programs, and the “R” category was established for nonimmigrants coming to the United States to be employed as ministers or other religious occupations.37
Grounds of Exclusion and Deportation and Enforcement
Although primarily focused on reforms to the legal immigration system, the Immigration Act of 1990 also significantly updated and revised the grounds for exclusion based on several health-, criminal-, or security-related grounds. For example, the law removed dangerous contagious diseases, mental retardation, insanity, psychopathic personality, sexual deviation, and mental defect from the health-related grounds of exclusion and replaced them with “communicable diseases of public health significance”; “physical or mental disorder and behavior associated with the disorder that may pose, or has posed, a threat to the property, safety, or welfare of the alien or others”; and drug abusers or addicts.38 Membership or affiliation with a communist or other totalitarian party was retained as security-related grounds for exclusion of immigrants. The act also excludes any alien who has participated in terrorist activities or whose entry would pose “potentially serious adverse foreign policy consequences for the United States.”39 Similarly, the act also revised some of the grounds for deportation under five categories of deportable aliens: (1) aliens who were excludable at the time of entry or adjustment of status or violated the conditions of their entry; (2) aliens convicted of criminal offenses, including crimes of moral turpitude, aggravated felonies, and drug offenses; (3) failure to register or falsification of documents; (4) security and related grounds such as espionage and terrorist activities; and (5) aliens who become a public charge within five years of entry.
Most of the grounds for deportation in the new act were similar to previous law, but a notable addition included conviction for an attempt to commit a drug offense. The act also redefined “aggravated felony” to include illicit trafficking in controlled substances, as well as money laundering, any crime of violence for which at least five years’ imprisonment has been imposed, violations committed outside the United States, and violation of foreign law for which the term of imprisonment was completed within the previous 15 years. The emphasis on drugs and the treatment of nonviolent drug offenses as “aggravated felonies” reflected the ongoing “War on Drugs” policy focus of the era, which began in the 1970s but became priorities throughout the Reagan and Bush presidencies.
12
0
2,000,000
4,000,000
6,000,000
8,000,000
10,000,000
12,000,000
1900
-09
1910
-19
1920
-29
1930
-39
1940
-49
1950
-59
1960
-69
1970
-79
1980
-89
1990
-99
2000
-09
2010
-13
1890
-99
Europe Asia Latin America Africa Oceania
Other Provisions
Naturalization. Following reports of severe backlogs in some jurisdictions for judicial naturalization, the 1990 act set up a new system of “administrative naturalization,” transferring the authority to naturalize persons from federal and state courts under the judicial branch to the attorney general (now the secretary of homeland security since the creation of the department) under the executive branch (SEC. 401). Under the act’s provisions, INS was authorized to adjudicate applications and conduct naturalization ceremonies. The law also provided safeguards to applicants whose applications are denied, including requests for an additional hearing before an immigration officer and judicial review in federal court. The residency requirement for naturalization was also changed from six months in a particular state to three months. Lastly, a waiver from the English-language requirement was made available for applicants who are more than 55 years old and have been permanent residents in the United States for at least 15 years.
Temporary Protected Status. The 1990 act established the Temporary Protected Status program (TPS) to provide temporary protection from deportation and work authorization to individuals from designated countries that cannot return home. Under the law, the U.S. government may designate a country for TPS if that country is subject to ongoing, armed conflict, natural disaster, or other extraordinary conditions. The act designated El Salvador for TPS to protect Salvadorans living in the United States who had fled the country’s civil war between 1980 and 1992.
Impact of the 1990 Act
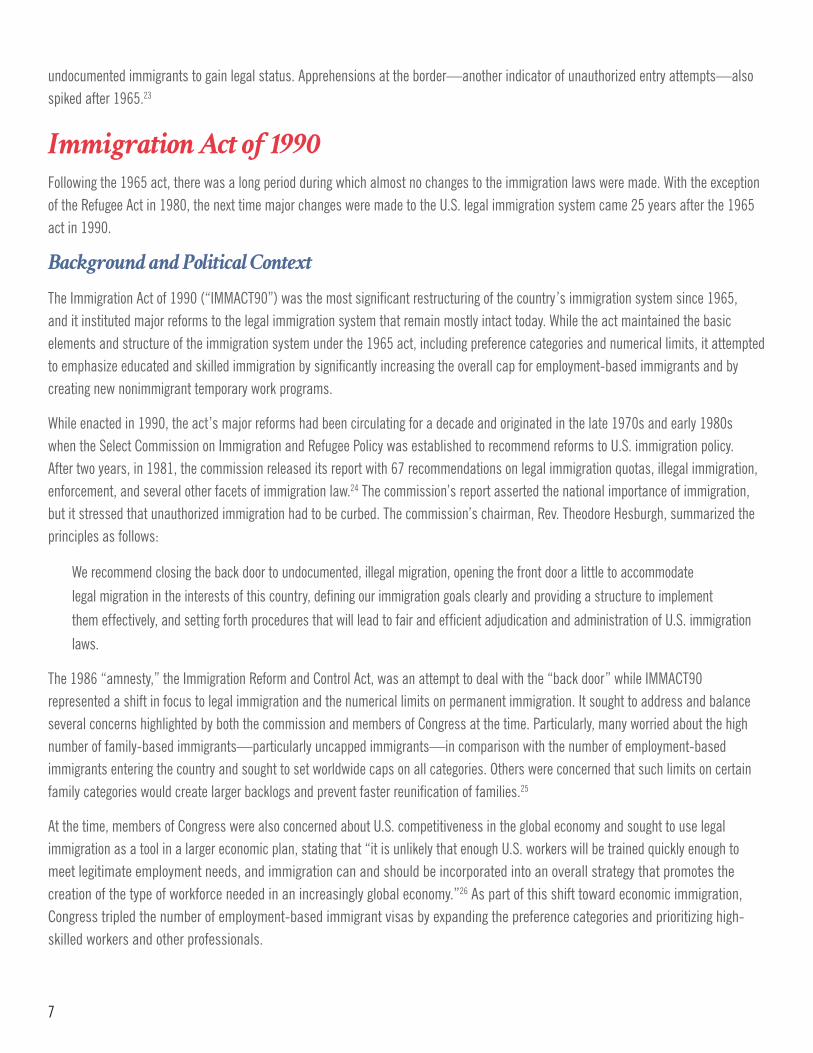
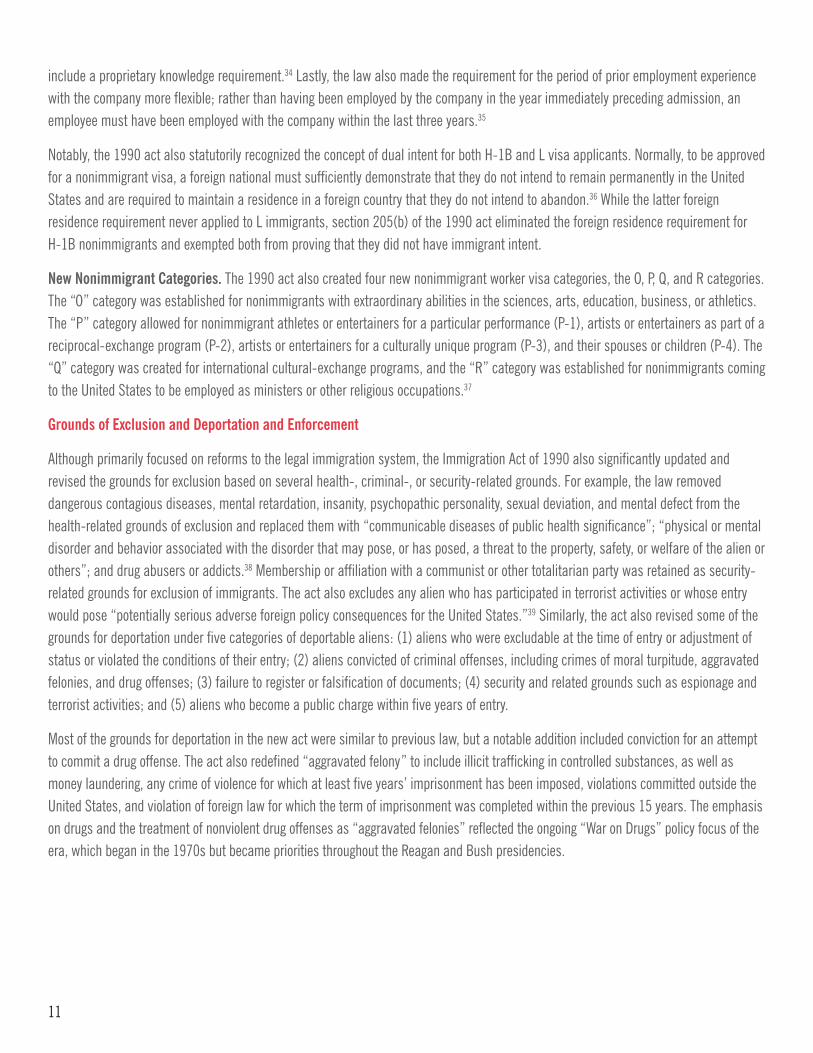
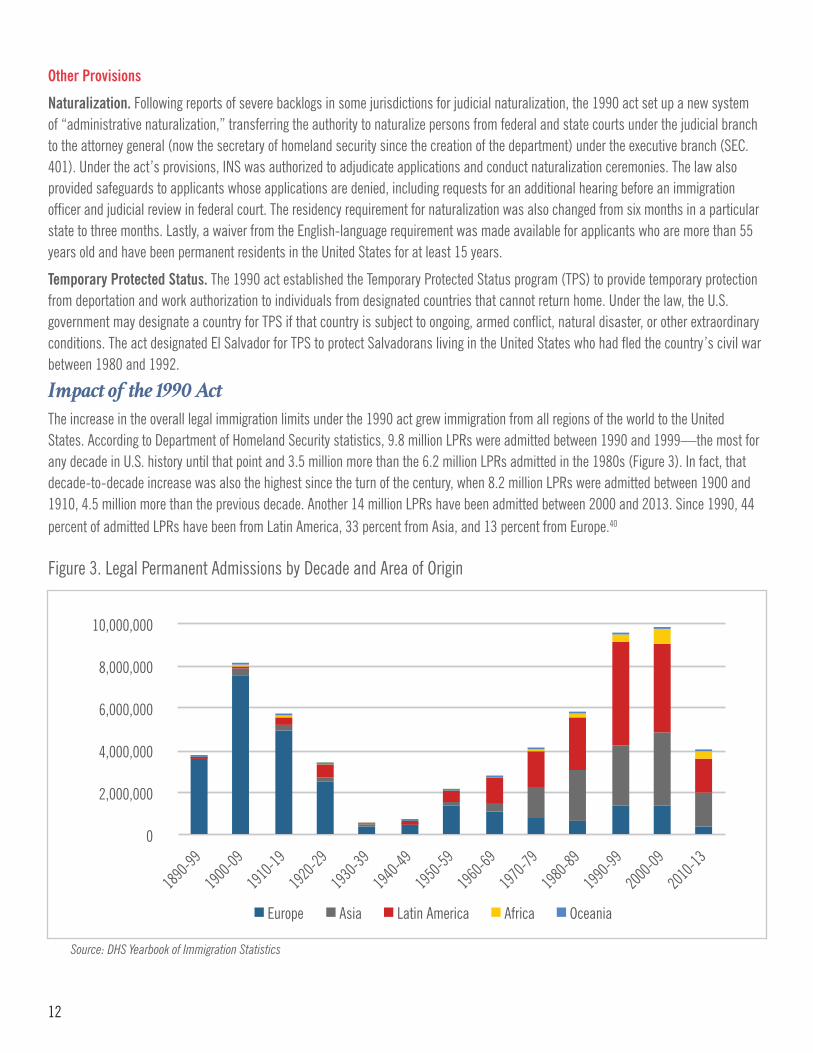
The increase in the overall legal immigration limits under the 1990 act grew immigration from all regions of the world to the United States. According to Department of Homeland Security statistics, 9.8 million LPRs were admitted between 1990 and 1999—the most for any decade in U.S. history until that point and 3.5 million more than the 6.2 million LPRs admitted in the 1980s (Figure 3). In fact, that decade-to-decade increase was also the highest since the turn of the century, when 8.2 million LPRs were admitted between 1900 and 1910, 4.5 million more than the previous decade. Another 14 million LPRs have been admitted between 2000 and 2013. Since 1990, 44 percent of admitted LPRs have been from Latin America, 33 percent from Asia, and 13 percent from Europe.40
Figure 3. Legal Permanent Admissions by Decade and Area of Origin
Source: DHS Yearbook of Immigration Statistics
13
Because most immigration to the United States is still based on family reunification, IMMACT90 did not significantly alter the national or regional composition of the total foreign-born population (legal or illegal) in the United States, but rather, it continued the post-1965 trends. Asia and the Americas, which had been the largest-sending regions in the 1980s, remained the largest-sending regions for immigrants in the two decades after IMMACT90’s enactment, and immigrants from Europe continued to decrease as a percentage of the foreign-born population. In 1990, 44.3 percent of the foreign-born population in the United States was from Latin America, 26.3 percent from Asia, and 22.9 percent from Europe. In 2000, 51.7 percent of the foreign-born population was from Latin America, 26.4 percent from Asia, and 15.8 from Europe. As of 2010, 53 percent of the foreign-born population was from Latin America, 28 percent from Asia, and 12 percent from Europe (Figure 1). Specific provisions of the act also contributed to increases from particular regions. For example, the elimination of the per-country limit for 75 percent of the FB-2A spouses and children of permanent residents allowed for increased immigration from countries with large family-sponsored immigration backlogs, specifically Mexico and the Dominican Republic.41
While the 1990 law significantly increased overall employment-based immigration from 54,000 to 140,000, it also limited the number of permanent visas for unskilled immigrants and their families, resulting in growing backlogs in some employment-based visa categories. The act reduced the number of unskilled immigrants from 27,000 to 10,000 under the new EB-3 category. By 1994, the only backlog in the employment-based categories was for unskilled workers, about 94,000 of them.42 Nonimmigrant categories did allow for new temporary workers to enter the country, but most of these were also focused on immigrants with higher skills or education (e.g., H-1B). The limitations on lesser-skilled workers—in combination with the long period of economic growth in the 1990s—is thought by many to have also contributed to the steady increase in illegal immigration in the 1990s. During this period, the resident unauthorized population grew from about 3.5 million in 1990 to 8.6 million in 2000, peaking at about 12 million in 2008.43
Conclusion
The immigration laws of 1965 and 1990 represented pivotal moments for U.S. immigration policy in the last century. The 1965 act abolished the 40-year-old national-origins-based immigration system that prioritized immigrants from certain regions of world and established a more equitable preference system based on skills and family relations. In 1990, Congress once again overhauled U.S. immigration policy, building on the structure and principles of the system set up in 1965 while revising it to attract even more educated and diverse immigrants.
Both laws certainly had significant impacts on immigration trends and characteristics for decades after their enactment. The 1965 act opened the gates to immigrants from Asia and other regions of the world, which allowed for new diasporas to be formed in the United States and expanded through subsequent migration. The reforms in 1990 had direct and significant impacts on the number and type of immigrants coming to the United States, almost tripling the number of employment-based immigrants alone. However, from bringing the immigration system in line with the civil rights movement of the decade, to addressing foreign policy concerns in a post-World War II Cold War era, to responding to the labor needs of a more skilled and globalized economy, both laws were products of their time.
While both laws had consequences on future immigration that were unforeseen by their authors, subsequent immigration trends were also heavily influenced by other political and economic factors. Strong economic growth and labor demands in the 1990s that even an expanded immigration system couldn’t keep up with and a shift in the sources of immigration as political and economic conditions stabilized in Europe and worsened in Asia and Latin America contributed heavily to the current profile of immigration to the United States.

14
As policymakers look toward the next set of reforms of the U.S. immigration system, these lessons are especially relevant. Waiting another quarter-century before revisiting America’s immigration system has put the system widely out of touch with the current reality. Because unforeseen impacts of the law as well as external and uncontrollable factors can influence immigration trends, more regular review and revisions of immigration policy may be necessary to adapt to these changes.
15
End Notes
1. 1921 Emergency Quota Law. H.R. 4075, Pub.L. 67-5, 42 Stat. 5. 67th Congress (May 19, 1921). Chapter 8. Available at: http://library.uwb.edu/guides/usimmigration/42%20stat%205.pdf; Immigration Act of 1924. 68th Cong., Sess. I, Chp. 190, p. 153-169.Available at: http://tucnak.fsv.cuni.cz/~calda/Documents/1920s/ImmigAct1924.html.
2. Although the number was the highest number of immigrants in the country to that date, it actually represented about 13 percent ofthe population, less than the high of 14.9 percent that was reached in 1910. See: Pew Research Center. “Modern Immigration WaveBrings 59 Million to U.S., Driving Population Growth and Change Through 2065 Views of Immigration’s Impact on U.S. Society Mixed”(September 28, 2015). Available at: http://www.pewhispanic.org/2015/09/28/chapter-1-the-nations-immigration-laws-1920-to-today/#fn-22980-5.
3. Immigration Act of 1924.
4. Pew Research Center (September 28, 2015).
5. National Act of 1940. H.R. 9980, Pub.L. 76-853, 54 Stat. 1137. 76th Congress (October 14, 1940). Available at: http://library.uwb.edu/guides/usimmigration/54%20stat%201137.pdf.
6. Immigration and Nationality Act of 1952. Pub.L. 89-236 (updated through February 2013). Available at: http://www.uscis.gov/laws/immigration-and-nationality-act.
7. U.S. Department of State, Office of the Historian. “The Immigration and Nationality Act of 1952 (The McCarran-Walter Act).”Available at: https://history.state.gov/milestones/1945-1952/immigration-act.
8. David S. Fitzgerald and David Cook-Martin. “The Geopolitical Origins of the U.S. Immigration Act of 1965.” Migration Policy Institute(February 5, 2015). Available at: http://www.migrationpolicy.org/article/geopolitical-origins-us-immigration-act-1965.
9. John F. Kennedy. “Remarks to Delegates of the American Committee on Italian Migration” (June 11, 1963). Available at: http://www.presidency.ucsb.edu/ws/?pid=9269.
10. David S. Fitzgerald and David Cook-Martin. “Whom Shall We Welcome” (February 5, 2015). Available at: http://www.migrationpolicy.org/article/geopolitical-origins-us-immigration-act-1965.
11. Thomas W. Zeiler. Dean Rusk: Defending the American Mission Abroad. Rowman &Littlefield (2000). Available at: https://books.google.com/books?id=2UnCYH04o_YC&pg=PA91&lpg=PA91&dq=dean+rusk+testimony+immigration&source=bl&ots=XneYY4XUQ7&sig=dn1IK10xLyKonAio_KohUMaRw8w&hl=en&sa=X&ved=0CB0Q6AEwAGoVChMI-siYscTAyAIVTKoeCh1dLAkE#v=onepage&q=dean%20rusk%20testimony%20immigration&f=false.
12. David S. Fitzgerald and David Cook-Martin (February 5, 2015).
13. Ibid.
16
14. U.S. Department of State, IIP Digital. “The Immigration Act of 1965: Intended and unintended consequences of the 20th Century”(April 3, 2008). Available at: http://iipdigital.usembassy.gov/st/english/publication/2008/04/20080423214226eaifas0.9637982.html#axzz3oVnjyvBg; Tom Gjelten. “The Immigration Act That Inadvertently Changed America.” The Atlantic (October 2, 2015).Available at: http://www.theatlantic.com/politics/archive/2015/10/immigration-act-1965/408409/.
15. Douglass S. Massey and Karen A. Pren. “Unintended Consequences of US Immigration Policy: Explaining the Post-1965 Surgefrom Latin America.” Population and Development Review 38.1 (2012). Available at: http://www.ncbi.nlm.nih.gov/pmc/articles/PMC3407978/.
16. The Immigration and Nationality Act. Public Law 89-236 (October 3, 1965). Available at: http://library.uwb.edu/guides/usimmigration/79%20stat%20911.pdf.
17. The Immigration and Nationality Act. Public Law 89-236 (October 3, 1965). Available at: https://www.govtrack.us/congress/bills/89/hr2580/text.
18. More on unintended consequences: Douglass S. Massey and Karen A. Pren (2012); Malcolm Collier “The Immigration Act of 1990”(September 1995). Available at: http://online.sfsu.edu/mcollier/AAS_write/aas%20essays/1990act.pdf; “U.S. Immigration Since1965.” History.com (November 4, 2015). Available at: http://www.history.com/topics/us-immigration-since-1965.
19. U.S. Census Bureau. Population Estimates (2014); Pew Research Center (September 28, 2015).
20. Pew Research Center (September 28, 2015).
21. Campbell Gibson and Kay Jung. “Historical Census Statistics on the Foreign-Born Population of the United States 1850-2000”(1960-2000). Available at: http://www.census.gov/population/www/documentation/twps0081/twps0081.html; U.S. CensusBureau. “The Foreign Born Population in the United States: 2010” (2010). Available at: http://www.census.gov/population/www/documentation/twps0081/twps0081.html.
22. Douglass S. Massey and Karen A. Pren (2012).
23. Bipartisan Policy Center. “Measuring the Metrics: Grading the Government on Immigration Enforcement” (February 2015).Available at: http://bipartisanpolicy.org/wp-content/uploads/2015/02/BPC_Immigration_MeasuringEnforcement.pdf; ProCon.org.“Illegal Immigration, Population Estimates in the United States, 1969-2011” (last updated February 7, 2013). Available at: http://immigration.procon.org/view.resource.php?resourceID=000844.
24. Philip L. Martin. “Select commission suggests changes in immigration policy—a review essay.” Monthly Labor Review (February1982). Available at: http://www.bls.gov/opub/mlr/1982/02/art4full.pdf.
25. U.S. Commission on Immigration Reform. “The Immigration Act of 1990 and Legal Immigration” (1994). Available at: https://migration.ucdavis.edu/mn/cir/94report/immact.htm.
26. H.R. Rep. No. 723; 101st Cong. 2d Sess.; pt. 1, at 41 (1990). Quoted in: http://www.wolfsdorf.com/articles/EB-5%20Immigrant%20Investor%20Program%20-%20A%20Changing%20Landscape.pdf.
27. H.R. 4300 (101st): Family Unity and Employment Opportunity Immigration Act of 1990. 101st Congress Vote (October 3, 1990).
17
Available at: https://www.govtrack.us/congress/votes/101-1990/h406; S. 358 (101st): Immigration Act of 1990. Senate vote (July 13, 1990). Available at: https://www.govtrack.us/congress/votes/101-1989/s117.
28. George Bush. “Statement on Signing the Immigration Act of 1990” (November 29, 1980). Available at: http://www.presidency.ucsb.edu/ws/?pid=19117.
29. William A. Kandel. “Permanent Legal Immigration to the United States: Policy Overview.” Congressional Research Service (2014).Available at: https://www.fas.org/sgp/crs/homesec/R42866.pdf.
30. Immigration Act of 1990. Pub. L 101-649. 101st Congress (November 29, 1990). Available at: http://www.justice.gov/sites/default/files/eoir/legacy/2009/03/04/IMMACT1990.pdf.
31. Read more about the EB-5 Immigrant Investor Program: Bipartisan Policy Center. “EB-5 Program: Successes, Challenges, andOpportunities for States and Localities” (September 17, 2015). Available at: http://bipartisanpolicy.org/library/eb-5-visa-program/.
32. Immigration Act of 1990 (November 29, 1990). p. 67.
33. U.S. Citizenship and Immigration Services. “H-1B Specialty Occupations, DOD Cooperative Research and Development ProjectWorkers, and Fashion Models” (last updated July 15, 2015). Available at: http://www.uscis.gov/working-united-states/temporary-workers/h-1b-specialty-occupations-dod-cooperative-research-and-development-project-workers-and-fashion-models.
34. U.S. Citizenship and Immigration Services. “Policy Memorandum.” PM-602-0111 (March 24, 2015). Available at: http://www.uscis.gov/sites/default/files/USCIS/Outreach/Draft%20Memorandum%20for%20Comment/2015-0324-Draft-L-1B-Memo.pdf.
35. Immigration Act of 1990 (November 29, 1990), p. 72.
36. Immigration and Nationality Act. Section 214(b). Available at: http://www.uscis.gov/iframe/ilink/docView/SLB/HTML/SLB/0-0-0-1/0-0-0-29/0-0-0-3422.html.
37. Bipartisan Policy Center. “Immigration 101.” Available at: http://bipartisanpolicy.org/wp-content/uploads/sites/default/files/Immigration%20101%20format.pdf; U.S. Citizenship and Immigration Services. “Temporary (Nonimmigrant) Workers” (last updatedSeptember 7, 2011). Available at: http://www.uscis.gov/working-united-states/temporary-workers/temporary-nonimmigrant-workers.
38. Immigration Act of 1990 (November 29, 1990).
39. Ibid.
40. All calculated from: DHS Yearbook of Immigration Statistics. Lawful Permanent Residents (2013). Table 2. Available at: http://www.dhs.gov/publication/yearbook-immigration-statistics-2013-lawful-permanent-residents.
41. U.S. Commission on Immigration Reform (1994).
42. Ibid.
43. Bipartisan Policy Center. “Measuring the Metrics: Grading the Government on Immigration Enforcement” (2015), p. 51. Available at:http://bipartisanpolicy.org/wp-content/uploads/2015/02/BPC_Immigration_MeasuringEnforcement.pdf.
Founded in 2007 by former Senate Majority Leaders Howard Baker, Tom Daschle, Bob Dole and George Mitchell, the Bipartisan Policy Center (BPC) is a non-profit organization that drives principled solutions through rigorous analysis, reasoned negotiation and respectful dialogue. With projects in multiple issue areas, BPC combines politically balanced policymaking with strong, proactive advocacy and outreach.
bipartisanpolicy.org | 202-204-2400 1225 Eye Street NW, Suite 1000 | Washington, DC 20005
@BPC_Bipartisan facebook.com/BipartisanPolicyCenter instagram.com/BPC_Bipartisan flickr.com/BPC_Bipartisan
BPC Policy Areas
Economy
Energy
Finance
Governance
Health
Housing
Immigration
National Security

1225 Eye Street NW, Suite 1000Washington, DC 20005
202-204-2400 bipartisanpolicy.org