Embed Size (px)
Citation preview

November 2015
Seven Year
Fixed rate bonds

Important InformationAuckland Airport intends to make an offer of fixed rate bonds (Bonds) in reliance upon the exclusion in clause 19 of schedule 1 of the
Financial Markets Conduct Act 2013 (FMCA). Except for the interest rate and maturity date, the Bonds will have identical rights,
privileges, limitations and conditions as Auckland Airport’s:
(a) 4.73% NZ$100,000,000 fixed rate bonds maturing on 13 December 2019 which are quoted on the NZX Debt Market
under the ticker code AIA120; and
(b) 5.52% NZ$150,000,000 fixed rate bonds maturing on 28 May 2021 which are quoted on the NZX Debt Market under the
ticker code AIA130,
(together, Quoted Bonds) and therefore are of the same class as the Quoted Bonds for the purposes of the FMCA and the Financial
Markets Conduct Regulations 2014 (FMC Regulations).
Auckland Airport is subject to a disclosure obligation that requires it to notify certain material information to NZX Limited (NZX) for the
purpose of that information being made available to participants in the market and that information can be found by visiting
https://www.nzx.com/companies/AIA.
Investors should look to the market price of the Quoted Bonds to find out how the market assesses the returns and risk premium for
those bonds.
DisclaimerThis presentation is for preliminary information purposes only and is not an offer to sell or the solicitation of any offer to purchase or
subscribe for any financial products and no part of it shall form the basis of or be relied upon in connection with any contract or
commitment whatsoever. The information in this document is given in good faith and has been obtained from sources believed to be
reliable and accurate at the date of preparation, but its accuracy, correctness and completeness cannot be guaranteed.
All of the data provided in this document is derived from publicly available information in relation to Auckland Airport (including the
annual report of Auckland Airport for its financial year ended 30 June 2015), unless otherwise indicated.
A Terms Sheet dated 2 November 2015 (Terms Sheet) has been prepared in respect of the offer of the Bonds. Investors should not
purchase the Bonds until they have read the Terms Sheet. Investors should consider the risks that are associated with an investment in
the Bonds, particularly with regard to their personal circumstances (including financial and tax issues).
The selling restrictions set out in the schedule to the Terms Sheet apply to the Bonds.
This presentation is dated November 2015.

Description of Bonds
Direct, unsecured, unsubordinated, fixed rate debt obligations of Auckland Airport
ranking equally and without preference among themselves and equally with all other
outstanding unsecured and unsubordinated indebtedness of Auckland Airport (except
indebtedness preferred by law)
Issuer Long-Term Credit Rating (S&P) A-
Expected Long-Term Issue Credit Rating (S&P) A-
Issue Amount Up to NZ$100,000,000
Opening Date Monday, 2 November 2015
Closing Date 1.00pm on Wednesday, 4 November 2015
Issue Date Monday, 9 November 2015
Tenor 7 years
Maturity Date Wednesday, 9 November 2022
Interest Rate The aggregate of the Base Rate and the Margin on the Rate Set Date
Base RateThe semi-annual mid-market swap rate for an interest rate swap of a term matching the
period from the Issue Date to the Maturity Date
Indicative Issue Margin The indicative margin range is 0.95 per cent to 1.00 per cent per annum for the Bonds
Interest Payment Dates 9 May and 9 November in each year until and including the Maturity Date
Minimum Denomination NZ$10,000 and multiples of NZ$1,000 thereafter
Interest Payments Semi-annually in arrears
Joint Lead Managers Bank of New Zealand and Westpac Banking Corporation
Co-Manager Deutsche Craigs Limited
Registrar Link Market Services Limited
Indicative Terms Sheet

Com
pany
overv
iew Investor update
Philip Neutze, Acting Chief Financial Officer
Campbell De Morgan, Treasury & IR specialist

Company position in the group
5
Investing in Auckland International Airport Limited – the parent
Auckland International Airport Limited is listed on the NZX and ASX
• Acquired 24.55% ownership of North
Queensland Airports (Cairns and Mackay)
in January 2010
• Acquired 24.99% of Queenstown Airport in
July 2010
• Has a 20% ownership in 4+ star Novotel
Hotel limited partnership located next to
Auckland Airport’s international terminal
(opened in May 2011)
20.00% 24.55% 24.99%
Auckland International Airport Limited (the Issuer)
Auckland Airport
Limited
Auckland Airport
Holdings Limited
Auckland Airport
Holdings (No 2)
Limited
Auckland
International
Airport Limited -
Employee Share
Purchase Plan
Tainui Auckland
Airport Hotel LP
Stapled Securities
of North
Queensland
Airports Group
Queenstown
Airport
Corporation
Limited
Aeronautical assets
6
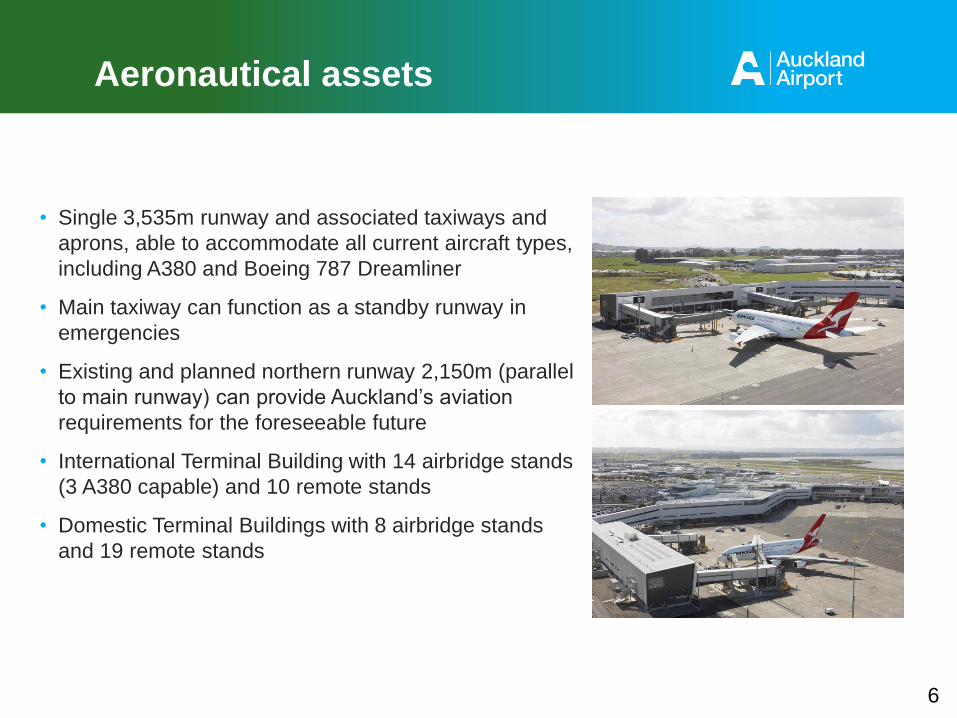
• Single 3,535m runway and associated taxiways and
aprons, able to accommodate all current aircraft types,
including A380 and Boeing 787 Dreamliner
• Main taxiway can function as a standby runway in
emergencies
• Existing and planned northern runway 2,150m (parallel
to main runway) can provide Auckland’s aviation
requirements for the foreseeable future
• International Terminal Building with 14 airbridge stands
(3 A380 capable) and 10 remote stands
• Domestic Terminal Buildings with 8 airbridge stands
and 19 remote stands

Significant land holdings
7
• Auckland Airport owns approximately 1,500 hectares of freehold land (~298 hectares available for IP development)
• Land value NZ$3.2 billion as at 30 June 2015
• Vacant land enables staged and affordable expansion of aeronautical infrastructure as required and ongoing rental income
growth
Auckland Airport boundaries
Auckland CBD (transposed)

Aero
nautical
overv
iew
Investor update

9
New Zealand’s busiest airport and our international gateway
• Auckland Airport is the largest and busiest airport in New Zealand in terms of
passenger movements and revenue
• International passengers represented 51% of total passenger movements in the year to
30 June 2015, the highest proportion of all Australasian airports
• Third highest number of international passengers in Australasia (behind Sydney and
Melbourne)
Source: Passenger information has been taken from each airport’s monthly traffic update (via their individual
websites) or from ACI Statistics for the 12 month period ending 30 June 2015
-
2,000
4,000
6,000
8,000
10,000
12,000
14,000
16,000
18,000
Auckland Christchurch Wellington Queenstown
Pa
sse
ng
ers
(0
00
's)
Domestic International (Excl. Transits)
8,124
13,327
4,194
8,373
1,447
5,078
7,199
25,555
9,790
23,820
4,479
16,957
0% 20% 40% 60% 80% 100%
Auckland
Sydney
Perth
Melbourne
Christchurch
Brisbane
International (Excl. Transits) Domestic
Total passengers – New Zealand airports Comparison of international vs domestic passengers

Passenger volume growth and volatility
1
0
FY01 – FY15 CAGR AIAL
International 3.9%
Domestic 5.5%
Total 4.6%
Standard Deviation
International 4.2%
Domestic 5.0%
Total 3.7%
Coefficient of Variation 0.80
-10.0%
-8.0%
-6.0%
-4.0%
-2.0%
0.0%
2.0%
4.0%
6.0%
8.0%
10.0%
12.0%
14.0%
16.0%
FY02 FY03 FY04 FY05 FY06 FY07 FY08 FY09 FY10 FY11 FY12 FY13 FY14 FY15
Total Passenger Growth
Auckland Airport12 months to
30 June 2015
12 months to
30 June 2014
Change
%
International passengers excluding transits 8,124,435 7,687,836 5.7
Transit passengers 493,756 462,560 6.7
Total international passenger movements 8,618,191 8,150,396 5.7
Domestic passengers 7,198,595 6,911,689 4.2
Total passenger movements 15,816,786 15,062,085 5.0

Aircraft up-gauging delivers benefits
12 months to
30 June 2015
12 months to
30 June 2014
Change
%
Aircraft movements
International departures 46,692 45,809 1.9
Domestic aircraft movements 104,264 107,454 (3.0)
Total aircraft movements 150,956 153,263 (1.5)
MCTOW 1 (tonnes)
International MCTOW 4,556,051 4,339,266 5.0
Domestic MCTOW 1,890,764 1,879,199 0.6
Total MCTOW 6,446,815 6,218,465 3.7
Aircraft movements and MCTOW
• Domestic landings still trending down, but larger aircraft delivering MCTOW
growth
• Bigger aircraft introduced on both domestic and international routes, eg:
• Guangzhou • Seoul
• Shanghai • NZ domestic trunk
• Singapore • NZ regional
111. MCTOW: Maximum Certified Take Off Weight

Futu
re
Investm
ent
Investor update
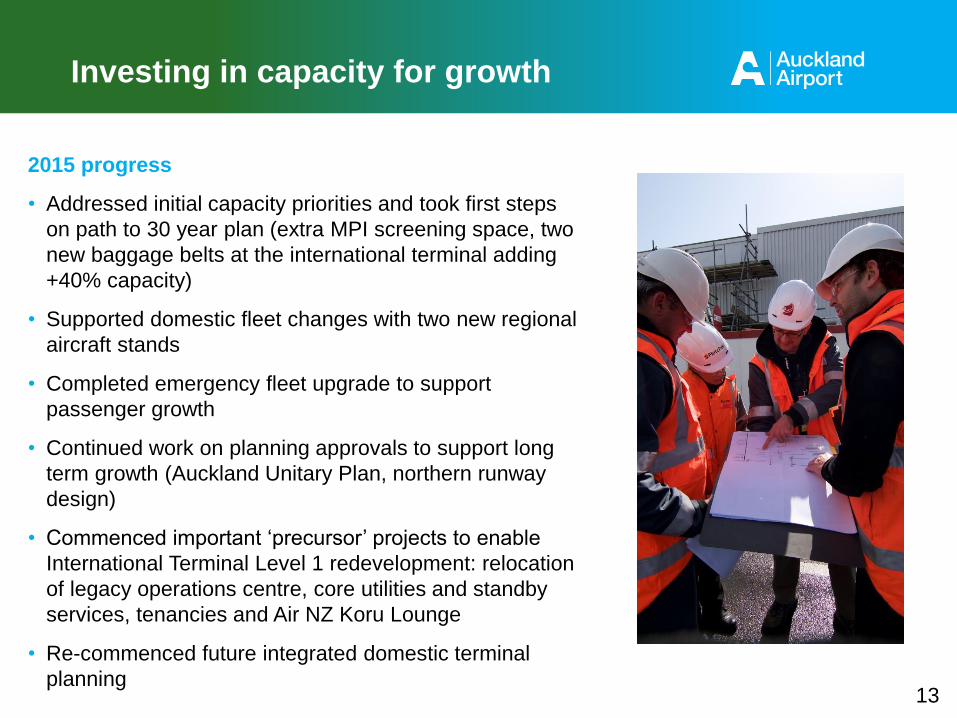
2015 progress
• Addressed initial capacity priorities and took first steps
on path to 30 year plan (extra MPI screening space, two
new baggage belts at the international terminal adding
+40% capacity)
• Supported domestic fleet changes with two new regional
aircraft stands
• Completed emergency fleet upgrade to support
passenger growth
• Continued work on planning approvals to support long
term growth (Auckland Unitary Plan, northern runway
design)
• Commenced important ‘precursor’ projects to enable
International Terminal Level 1 redevelopment: relocation
of legacy operations centre, core utilities and standby
services, tenancies and Air NZ Koru Lounge
• Re-commenced future integrated domestic terminal
planning
Investing in capacity for growth
13

Key focus areas for coming year
• Commencing Level 1 redevelopment construction
following design, scope and consultation outcomes
• Staged expansion of Pier B to support international
growth and fleet changes
• Develop further domestic stand and gate capacity
to support growth in regional market later in 2015
• Continue working with partners on future integrated
domestic and international terminal planning
• Working with commercial partners and local and
central transport agencies to support improved
transport access
• Continued work on statutory planning and northern
runway design
Investing in capacity for growth (continued)
14

Strong property momentum
Development activity has never been higher
• Q4 2015 had $162m worth of development projects
under construction – quadruple our best prior period
• 87% of projects pre-leased (excl. Quad 7 office)
Growing our logistics core
• 14,000m2 expansions including DHL Express, CEVA
Logistics and Agility
While attracting new marquee tenants
• Fuji Xerox
• Coca-Cola Amatil
Future developments
• New speculative build on Timberley Road (8,500m2).
• Stage 3 of the Landing encompassing 8.7 hectares
soon to be ready for commercial development
• 8,500m2 Quad 7 office development underway.
Expected completion Q2 FY17
15

Demand supports hotel expansion
Ibisoccupancy 88.7%Novoteloccupancy 87.3%
• ~50% expansion to Ibis budget hotel in
December 2014 with an additional 73 rooms
• Preferred site identified for a third hotel adjacent
to international terminal
• First stage of conceptual design and feasibility
completed
• Clear on product – expected to comprise 250-
300 rooms catering to the mid-tier market
16
Fin
ancia
l perf
orm
ance a
nd
borr
ow
ings
Investor update
18
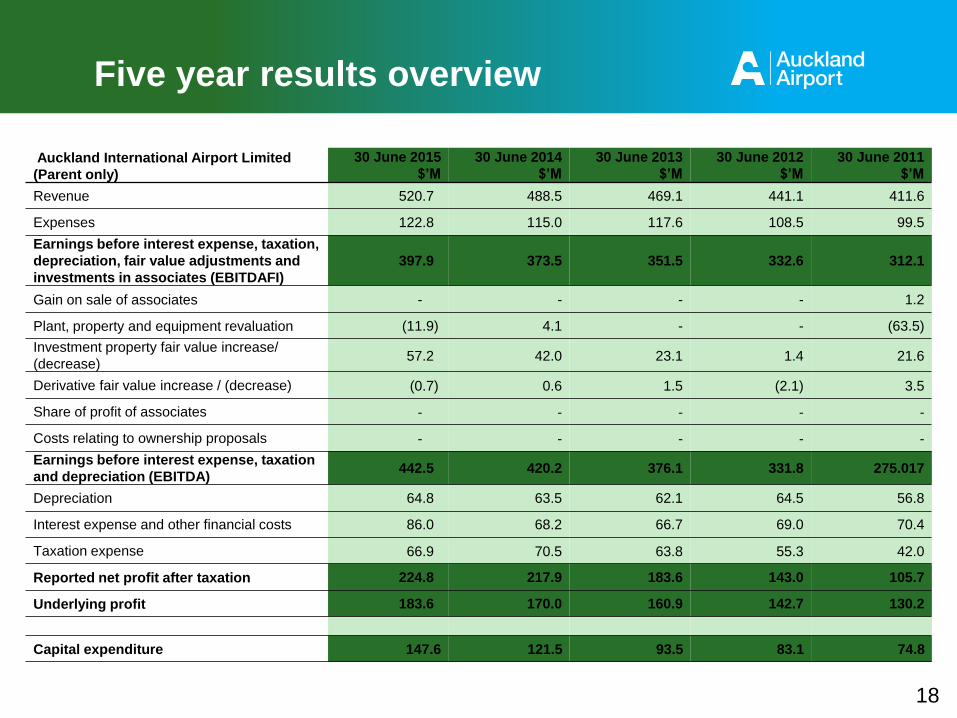
Five year results overview
Auckland International Airport Limited
(Parent only)
30 June 2015
$’M
30 June 2014
$’M
30 June 2013
$’M
30 June 2012
$’M
30 June 2011
$’M
Revenue 520.7 488.5 469.1 441.1 411.6
Expenses 122.8 115.0 117.6 108.5 99.5
Earnings before interest expense, taxation,
depreciation, fair value adjustments and
investments in associates (EBITDAFI)
397.9 373.5 351.5 332.6 312.1
Gain on sale of associates - - - - 1.2
Plant, property and equipment revaluation (11.9) 4.1 - - (63.5)
Investment property fair value increase/
(decrease)57.2 42.0 23.1 1.4 21.6
Derivative fair value increase / (decrease) (0.7) 0.6 1.5 (2.1) 3.5
Share of profit of associates - - - - -
Costs relating to ownership proposals - - - - -
Earnings before interest expense, taxation
and depreciation (EBITDA)442.5 420.2 376.1 331.8 275.017
Depreciation 64.8 63.5 62.1 64.5 56.8
Interest expense and other financial costs 86.0 68.2 66.7 69.0 70.4
Taxation expense 66.9 70.5 63.8 55.3 42.0
Reported net profit after taxation 224.8 217.9 183.6 143.0 105.7
Underlying profit 183.6 170.0 160.9 142.7 130.2
Capital expenditure 147.6 121.5 93.5 83.1 74.8
Key credit metrics
19
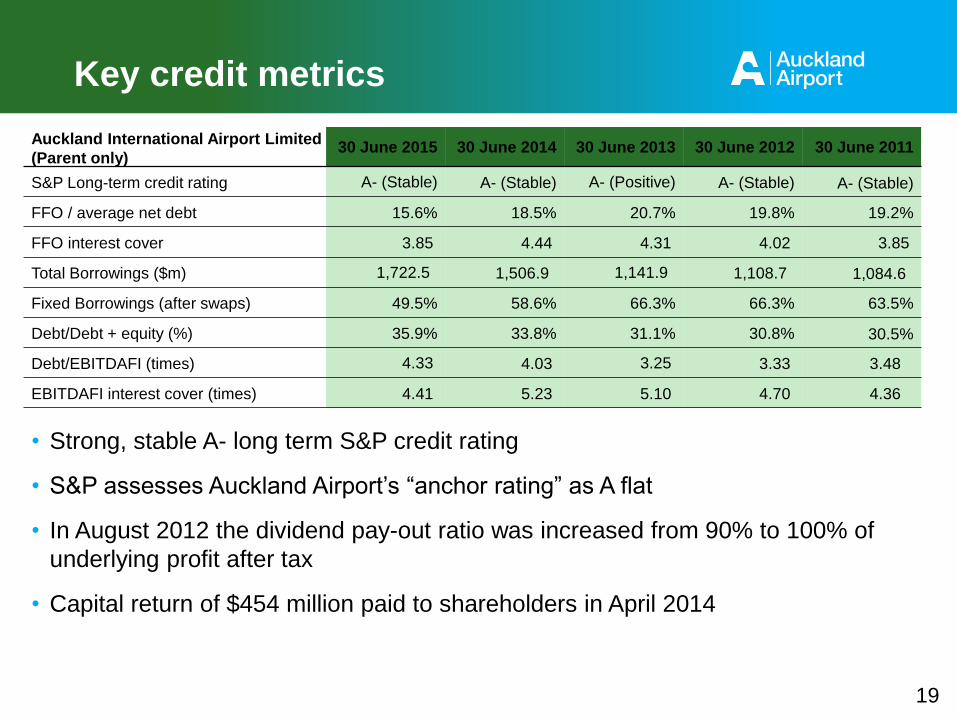
Auckland International Airport Limited
(Parent only)30 June 2015 30 June 2014 30 June 2013 30 June 2012 30 June 2011
S&P Long-term credit rating A- (Stable) A- (Stable) A- (Positive) A- (Stable) A- (Stable)
FFO / average net debt 15.6% 18.5% 20.7% 19.8% 19.2%
FFO interest cover 3.85 4.44 4.31 4.02 3.85
Total Borrowings ($m) 1,722.5 1,506.9 1,141.9 1,108.7 1,084.6
Fixed Borrowings (after swaps) 49.5% 58.6% 66.3% 66.3% 63.5%
Debt/Debt + equity (%) 35.9% 33.8% 31.1% 30.8% 30.5%
Debt/EBITDAFI (times) 4.33 4.03 3.25 3.33 3.48
EBITDAFI interest cover (times) 4.41 5.23 5.10 4.70 4.36
• Strong, stable A- long term S&P credit rating
• S&P assesses Auckland Airport’s “anchor rating” as A flat
• In August 2012 the dividend pay-out ratio was increased from 90% to 100% of
underlying profit after tax
• Capital return of $454 million paid to shareholders in April 2014

0
2,000,000
4,000,000
6,000,000
8,000,000
10,000,000
12,000,000
14,000,000
16,000,000
18,000,000
FY00 FY01 FY02 FY03 FY04 FY05 FY06 FY07 FY08 FY09 FY10 FY11 FY12 FY13 FY14 FY15
Annual passengers
Financial Year Ended 30 June
Total Passengers at Auckland Airport (excl. Transits)
20
Resilient passenger growth underpins credit strength
• The business has been resilient during times of stress in global economies and
during times of external negative events.
Sept 11
Terrorist
Attacks
SARS
Outbreak
Avian Flu
Outbreak
Sub Prime
Crisis and
Global
Recession
Christchurch
Earthquake
Auckland Airport borrowings
21
• Auckland Airport currently utilises a mixture of NZ DCM term
bonds, bank facilities, USPP notes, commercial paper and money
market facilities
• As at 30 June 2015, Auckland Airport had:
• $1.723 billion total drawn debt
• $220 million committed but undrawn facilities
• Average interest rate for FY15 = 5.8%
• Average term to maturity of drawn debt as at 30 June 2015 = 4.9
years
• Bond programme supported by a master trust deed
Auckland Airport borrowings
22
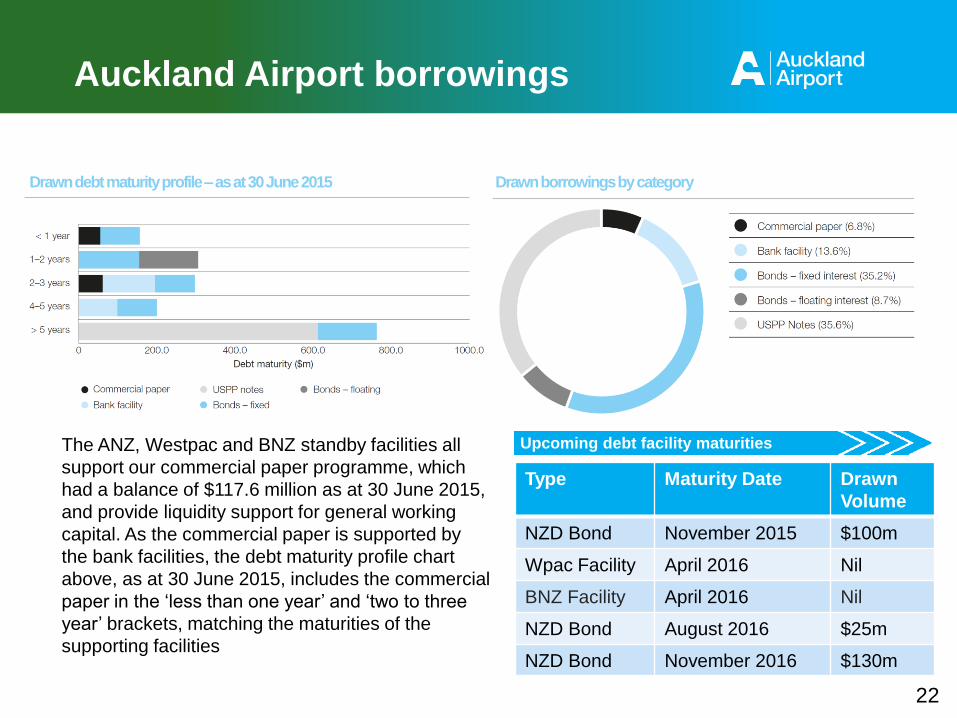
The ANZ, Westpac and BNZ standby facilities all
support our commercial paper programme, which
had a balance of $117.6 million as at 30 June 2015,
and provide liquidity support for general working
capital. As the commercial paper is supported by
the bank facilities, the debt maturity profile chart
above, as at 30 June 2015, includes the commercial
paper in the ‘less than one year’ and ‘two to three
year’ brackets, matching the maturities of the
supporting facilities
Drawn borrowings by categoryDrawn debt maturity profile –as at 30 June 2015
Type Maturity Date Drawn
Volume
NZD Bond November 2015 $100m
Wpac Facility April 2016 Nil
BNZ Facility April 2016 Nil
NZD Bond August 2016 $25m
NZD Bond November 2016 $130m
Upcoming debt facility maturities

Regula
tory
and g
uid
ance
Investor update

• Dual-till regime under the Commerce Act 1986 with information disclosure regulation
• Aeronautical till faces limited competition and therefore subject to information disclosure
regulation
• Airport Authorities Act 1966 provides for and requires:
• Airports to set charges as they see fit
• Consult on aeronautical charges at least every five years
• Consult on capex decisions exceeding 20% of aeronautical asset base
• Disclosure regime includes monitoring of service standards, asset availability, capital
expenditure plans, efficiency of pricing and return on investment
• Commerce Commission monitors information disclosure regime effectiveness
• ‘Input Methodology Review’ underway (December 2016 completion). Key issues for AIAL =
WACC percentile & treatment of land held for future aeronautical use
• Auckland Airport’s FY18-22 aeronautical price path consultation with major airlines and
representatives to begin early FY17, with the final pricing decision expected circa May 2017
Regulatory environment
24
Guidance
• We expect total capital expenditure of between $230 million and $260
million in FY16, including approximately $135 million of aeronautical
projects
• Aeronautical capital expenditure will continue firming over the remainder
of the current aeronautical pricing period (PSE2) reflecting higher than
expected demand and emerging airline requirements regarding Pier B.
• We expect underlying net profit after tax (excluding any fair value
changes and other one off items) to be between $183 million and $191
million
• This guidance is subject to any material adverse events, significant one-
off expenses, non-cash fair value changes to property and deterioration
due to global market conditions or other unforeseeable circumstances
25